Article

Combining Visual Contrast Information with Sound Can Produce Faster Decisions

by
Birgitta Dresp-Langley
* and
Marie Monfouga
Centre National de la Recherche Scientifique UMR 7357 ICube Lab, Strasbourg University, 67000 Strasbourg, France
*
Author to whom correspondence should be addressed.
Information 2019, 10(11), 346; https://doi.org/10.3390/info10110346
Submission received: 20 October 2019 / Revised: 4 November 2019 / Accepted: 5 November 2019 / Published: 7 November 2019
(This article belongs to the Special Issue Information-Centred Approaches to Visual Perception)

Abstract

:
Pieron’s and Chocholle’s seminal psychophysical work predicts that human response time to information relative to visual contrast and/or sound frequency decreases when contrast intensity or sound frequency increases. The goal of this study is to bring to the forefront the ability of individuals to use visual contrast intensity and sound frequency in combination for faster perceptual decisions of relative depth (“nearer”) in planar (2D) object configurations based on physical variations in luminance contrast. Computer controlled images with two abstract patterns of varying contrast intensity, one on the left and one on the right, preceded or not by a pure tone of varying frequency, were shown to healthy young humans in controlled experimental sequences. Their task (two-alternative, forced-choice) was to decide as quickly as possible which of two patterns, the left or the right one, in a given image appeared to “stand out as if it were nearer” in terms of apparent (subjective) visual depth. The results showed that the combinations of varying relative visual contrast with sounds of varying frequency exploited here produced an additive effect on choice response times in terms of facilitation, where a stronger visual contrast combined with a higher sound frequency produced shorter forced-choice response times. This new effect is predicted by audio-visual probability summation.

1. Introduction

On the basis of predictions derived from Pieron’s Law [1], classic psychophysical response time studies using two-alternative, forced-choice techniques have shown that human response time to contrast information decreases when the luminance intensity of a stimulus, or the contrast between two stimuli, increases [2]. Moreover, for a constant luminance or contrast level, response times decrease when the visual area of contrast increases because of a probability summation effect [3] in the contrast-processing channels of the visual brain. Ahead of Piéron, psychophysicists like Exner, Wundt, Cattell, and Chocholle [4,5,6] had already emphasized the inverse relationship between human response time and stimulus intensity in different sensory modalities, including sound. Chocholle [7], and subsequently Stevens [8], systematically investigated human motor response time as a function of loudness (dB) and/or sound frequency (Hz), showing that an increase in either parameter may produce a decrease in response times or the perceptual system’s readiness to respond. Since these early and seminal psychophysical studies, further research has shown that sound information impacts information processing by other senses, including vision, and may considerably influence our decisions in response to signals we receive [9,10].
The human brain’s capacity to exploit combined information of visual contrast and sound in motor response behavior [11] has important implications in the context of a variety of operator tasks and in the context of human–computer interaction systems where optimal motor performance is critical [12,13,14]. The goal of this study here was to bring to the forefront the ability of individuals to effectively use visual contrast and sound for making faster perceptual decisions by taking into account the well-documented capacity of the human perceptual system to extract subjective cues of relative depth from planar (2D) object configurations on the basis of physical variations in luminance contrast [15,16,17,18,19,20,21,22,23,24,25,26,27]. As shown previously, in 2D configurations with higher-contrast and lower-contrast visual objects, those with the higher contrast will be consistently perceived as “nearer” by human observers. The greater the difference in contrast between two objects in a 2D image, the higher the probability is for the stronger contrast to be perceived as “nearer” [18], and, as a direct consequence of Piéron’s Law [1], the shorter the time taken to reach that perceptual decision will be [18].
In a recent study [28] using psychophysical forced-choice, subjects were asked to covertly monitor the perceived alternation between a Gabor contrast and a radial checkerboard contrast, pressing one key to report the Gabor and another key to report the radial checkerboard contrast. It was found that when a brief tone (500 Hz, 60 dB) preceded the target cue, which could be either the Gabor or the checkerboard contrast, the subjects’ response latencies decreased. Analysis of the results revealed patterns fully consistent with a sound–vision probability summation hypothesis [28]. This research here was placed under a similar probability summation hypothesis. In addition, the sound frequency factor was varied here to show that, in the light of Chocholle’s seminal work [7], stronger contrasts combined with higher sound frequencies preceding the contrast stimulus will produce even faster forced-choice decisions, in further consistency with probability summation. The contrast factor here was varied in the context of perceptual decisions for “nearer” in response to the stronger one of two simultaneously presented image configurations [15,16,17,18,19,20,21,22,23,24,25,26,27]. The investigation takes into account that identical sounds in terms of physical intensity (dB) with higher frequencies have a higher average energy for any given section of the sound wave compared with lower frequency sounds. This results in the perception of differences in pitch [29], where sounds with a higher frequency are subjectively assimilated to sounds of a higher intensity [30], although physically they have the same intensity in dB.

2. Materials and Methods

Stimulus sequences (images and sounds) in the different experimental conditions, corresponding to individual trial sessions, and data acquisition were computer controlled. The experimental task was a classic psychophysical two-alternative forced-choice (2AFC) task [30], yielding perceptual decisions, relative to perceived relative pattern depth in this study here, and their associated decision times, more generally referred to as choice response times.

2.1. Research Ethics and Participants

The experiments were conducted in conformity with the Helsinki Declaration for scientific experiments on human individuals, and in full compliance with regulations set by the ethics board of the corresponding author’s host institution (CNRS) relative to response data collected from healthy human individuals in non-invasive psychophysical tasks. Ten healthy, young individuals, five men and five women, took part in the experiments as undergraduate study volunteers. All had normal vision and hearing and provided informed consent to participate as subjects. Their identity is not revealed.

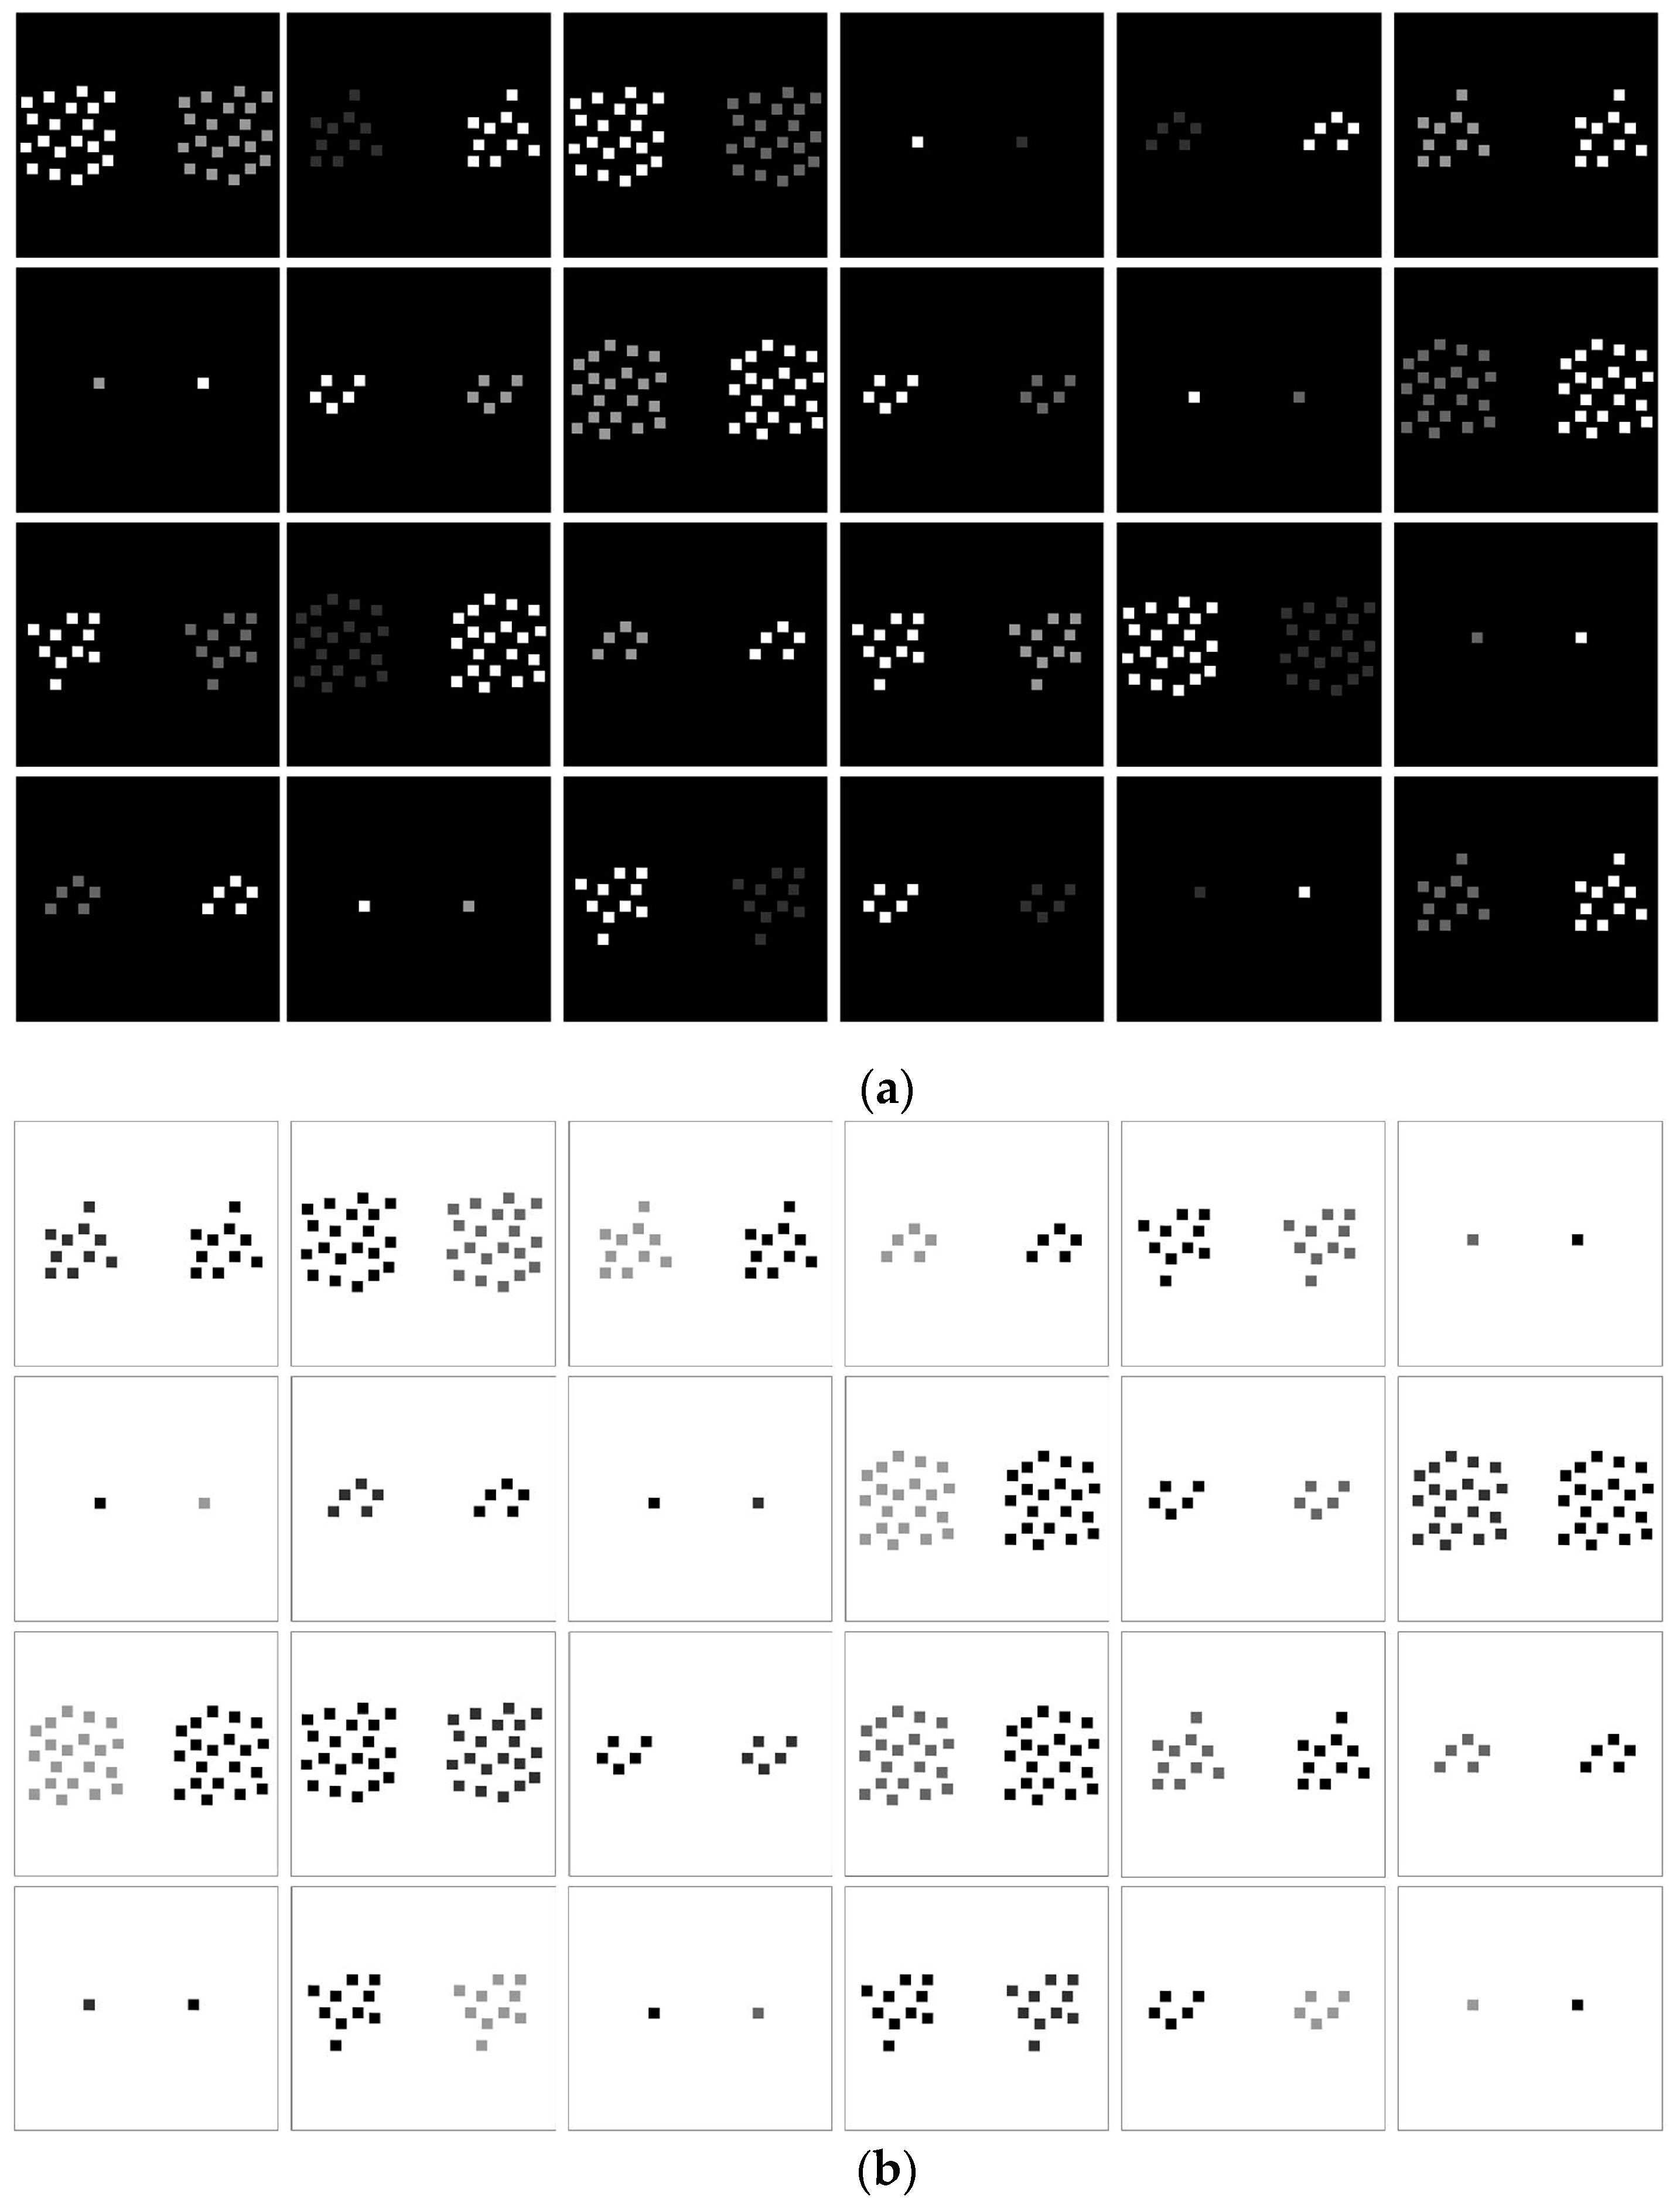
2.2. Image and Sound Conditions

Image configurations for the experiments were computer generated and displayed on a high-resolution color monitor (EIZO COLOR EDGE CG 275W, 2560 × 1440) connected to a DELL T5810 computer (Intel Xeon CPU E5-1620), equipped with an NVidia GForce GTX980 graphics card and a sound card with port for plugging in headphones. Color and luminance calibration of the RGB channels of the monitor was performed using the inbuilt Color Navigator self-calibration software, which was delivered with the screen and runs under Windows 7. RGB values here correspond to ADOBE RGB. All luminance levels were cross-checked with an external photometer (OPTICAL, Cambridge Research Systems). RGB coordinates and luminance parameters (cd/m2) of the different patterns in the image configurations and their dark and light backgrounds are given in Table 1. Weber contrasts (LumC) in the different positive and negative polarity displays produced systematic differences in contrast (dC) between left and right patterns (Table 1) of an image pair. Within this range, dC values were predicted to produce a high-probability (between 0.95 and 1) “foreground” effect in the stronger of the two pattern contrasts, as explained in the introduction. Patterns had a variable number of elements across image pairs, but never within (see Figure 1). The size of each square surface in the patterns was 16 × 16 pixels, the size of a single pixel on the screen being 0.023 cm. Lighter and darker patterns were paired (Figure 1) and were randomly displayed to the left and to the right in alternation. A given image pair on a given trial was either preceded by a brief pure tone of 200, 1000, or 2000 Hz or by no sound at all (no-sound control condition). All configurations were displayed centrally on the monitor in computer-controlled sequences on their dark or light backgrounds. Task sessions and data generation were controlled by a program written in Python for Windows and available online at: https://pumpkinmarie.github.io/ExperimentalPictureSoftware.
Positive-sign and negative-sign pattern contrasts are expressed here in terms of Weber contrast (LumC), which is given by
LumC = (Lum_max − Lum_min)/Lum_min.
The difference in visual contrast (w) between two patterns in a pair is given by
dC = LumC_max − LumC_min.
Pure tone sound signals with three different sound frequencies, corresponding to 200, 1000, and 2000 hertz (Hz), with identical amplitudes of 70 decibels (Db), were generated from a wav file. Sound frequency (Hz) measures the speed with which a sound wave propagates and determines the pitch of a sound. Human individuals with normal hearing are perfectly able to discriminate variations in pitch within an acoustic range between 20 and 20,000 Hz. Within that range, higher-pitch sounds are perceived as “sharper” than lower-pitch sounds of the same amplitude. For illustration, sound waves of 200 and 100 Hz with identical amplitudes are displayed below in Figure 2.

2.3. Experimental Design

Pattern pairs of light-on-dark and dark-on-light contrast with varying numbers of pattern elements (Figure 1) were displayed in a random order in separate counterbalanced experimental sessions for each of the two conditions of the contrast polarity factor (Polaritie2). The number of pattern elements (E) on both sides of a pair varied between n = 1, n = 5, n = 10, and n = 20 (see Figure 1 for illustration), yielding another factor of systematic variation with four levels (Elements4). The contrast intensity of patterns in image pairs varied in such a way that the strongest pattern contrast (see Table 1) was always associated with a weaker pattern contrast of the same polarity, and it was presented to the left and to the right in alternation in a given image pair. This produced three levels of difference in pattern contrast (dC), within and across polarity conditions, yielding a factor of systematic variation with three levels (dC3), and a secondary factor of relative location with two levels (Locations2), not expected to produce any systematic effects on perceptual responses. Each image pair was preceded by a 100 ms pure tone sound signal with a frequency of either 200, 1000, 2000, or 0 Hz (‘no sound’ control condition), yielding another factor of systematic variation with four levels (Sound4). The delay between the end of a given sound signal and the beginning of a given image presentation on each single trial was 800 ms. Different sound conditions were presented in separate counterbalanced experimental sessions. With ten individuals (Individual10) run in separate trial block sessions, we have the following experimental design plan: Individuals10 × Polarities2 × dC3 × Locations2 × Elements4 × Sounds4, producing a total number of n = 1920 experimental observations, with P2 × dC3 × L2 × E4 × S4 = 192 data per subject in terms of response times and their associated perceptual decisions.

2.4. Procedure and Task Instructions

The subject was comfortably seated in front of the computer, at a distance of about 80 cm from the screen, in a semidark room (mesopic viewing condition) and adapted to surrounding conditions for about five minutes. He/she was informed that images with two abstract patterns, one on the left and one on the right, will be shown in sequences, preceded or not by a brief tone, and that his/her task was to decide as quickly as possible which of the two patterns, the left or the right one, in a given image appeared to “stand out as if it were nearer” in terms of apparent (subjective) visual depth, as previously in [17,18,21,23,24]. A response had to be delivered by pressing ‘1’ for ‘left’ or ‘2’ for ‘right’, and was recorded and stored in a labeled data column of an excel file. The response time (i.e., the time between an image onset and the moment a response key was pressed) was also recorded by the computer and stored in a second labeled data column of the same excel file. As soon as a response was given, the image disappeared from the screen, and 900 ms later, the next image of a given sequence appeared. In the conditions where the images were preceded by a 100 ms sound signal of a given frequency, the sound was delivered after 800 milliseconds following the previous response.

3. Results

The choice response time data and their associated perceptual decisions (‘nearer on left’ versus ‘nearer on right’) were analyzed to evaluate the combined effects of visual contrast information and sound frequency (i.e., pitch) on the time taken to make a perceptual decision.

3.1. Perceptual Decisions Relative to Expected Depth Effects (“Nearer”)

As explained in the introduction, such an analysis makes sense, provided the perceptual decisions are ‘high-probability’ (i.e., reflect very little stimulus uncertainty). To meet this requirement, the contrast differences between a pair of image patterns here were chosen, in light of previous studies [17,18], under the prediction that they would produce high-probability effects of perceived relative depth, reflected by a 95 to 100% decision rate for “nearer” in response to the stronger contrast patterns of the pairs. This prediction was confirmed. For the 24 positive contrast polarity images, a 98% response rate for “nearer” to the stronger contrast pattern in a pair was recorded, and for the 24 negative contrast polarity images, we saw a 96% response rate for “nearer” to the stronger contrast pattern of a pair.

3.2. Effects of Experimental Factors on Response Times

Response time data were analyzed in terms of means and standard errors for a graphical representation, shown here below in Figure 3, of effects of the different experimental factors. The individual response time data were fed into a four-way ANOVA (analysis of variance) to assess the statistical significance of these effects. The analysis plan corresponded to the fully balanced Cartesian design plan Individuals10 × Polarities2 × dC3 × Locations2 × Elements4 × Sounds4 with a total number of 1920 data points for individual response times. The source of random variability, the subject factor Individuals10, was not included in the analysis. The two levels of the secondary factor Locations2, relative to counterbalanced variations in the spatial location of stronger/weaker patterns in a pair (left or right), were not associated with any hypothesis and, as expected, did not produce any effect (see Table 2). The results of the ANOVA yielded statistically significant effects and are summarized below in Table 2, which shows the F statistics relative to effects and their respective probability limits. The full set of raw data (individual response times) from which the analyses were drawn is provided in Table S1 of the Supplementary Materials. Power tests associated with the corresponding paired comparisons (Holm–Sidak) are provided in Table S2 of the Supplementary Materials. Post hoc paired comparisons (Holm–Sidak tests) and their associated power tests were computed for factor levels relative to significant interactions. The results from these analyses are provided in Table S3 of the Supplementary Materials. Least-squares group means and their standard errors associated with each factor are given in Table S4 of the Supplementary Materials.

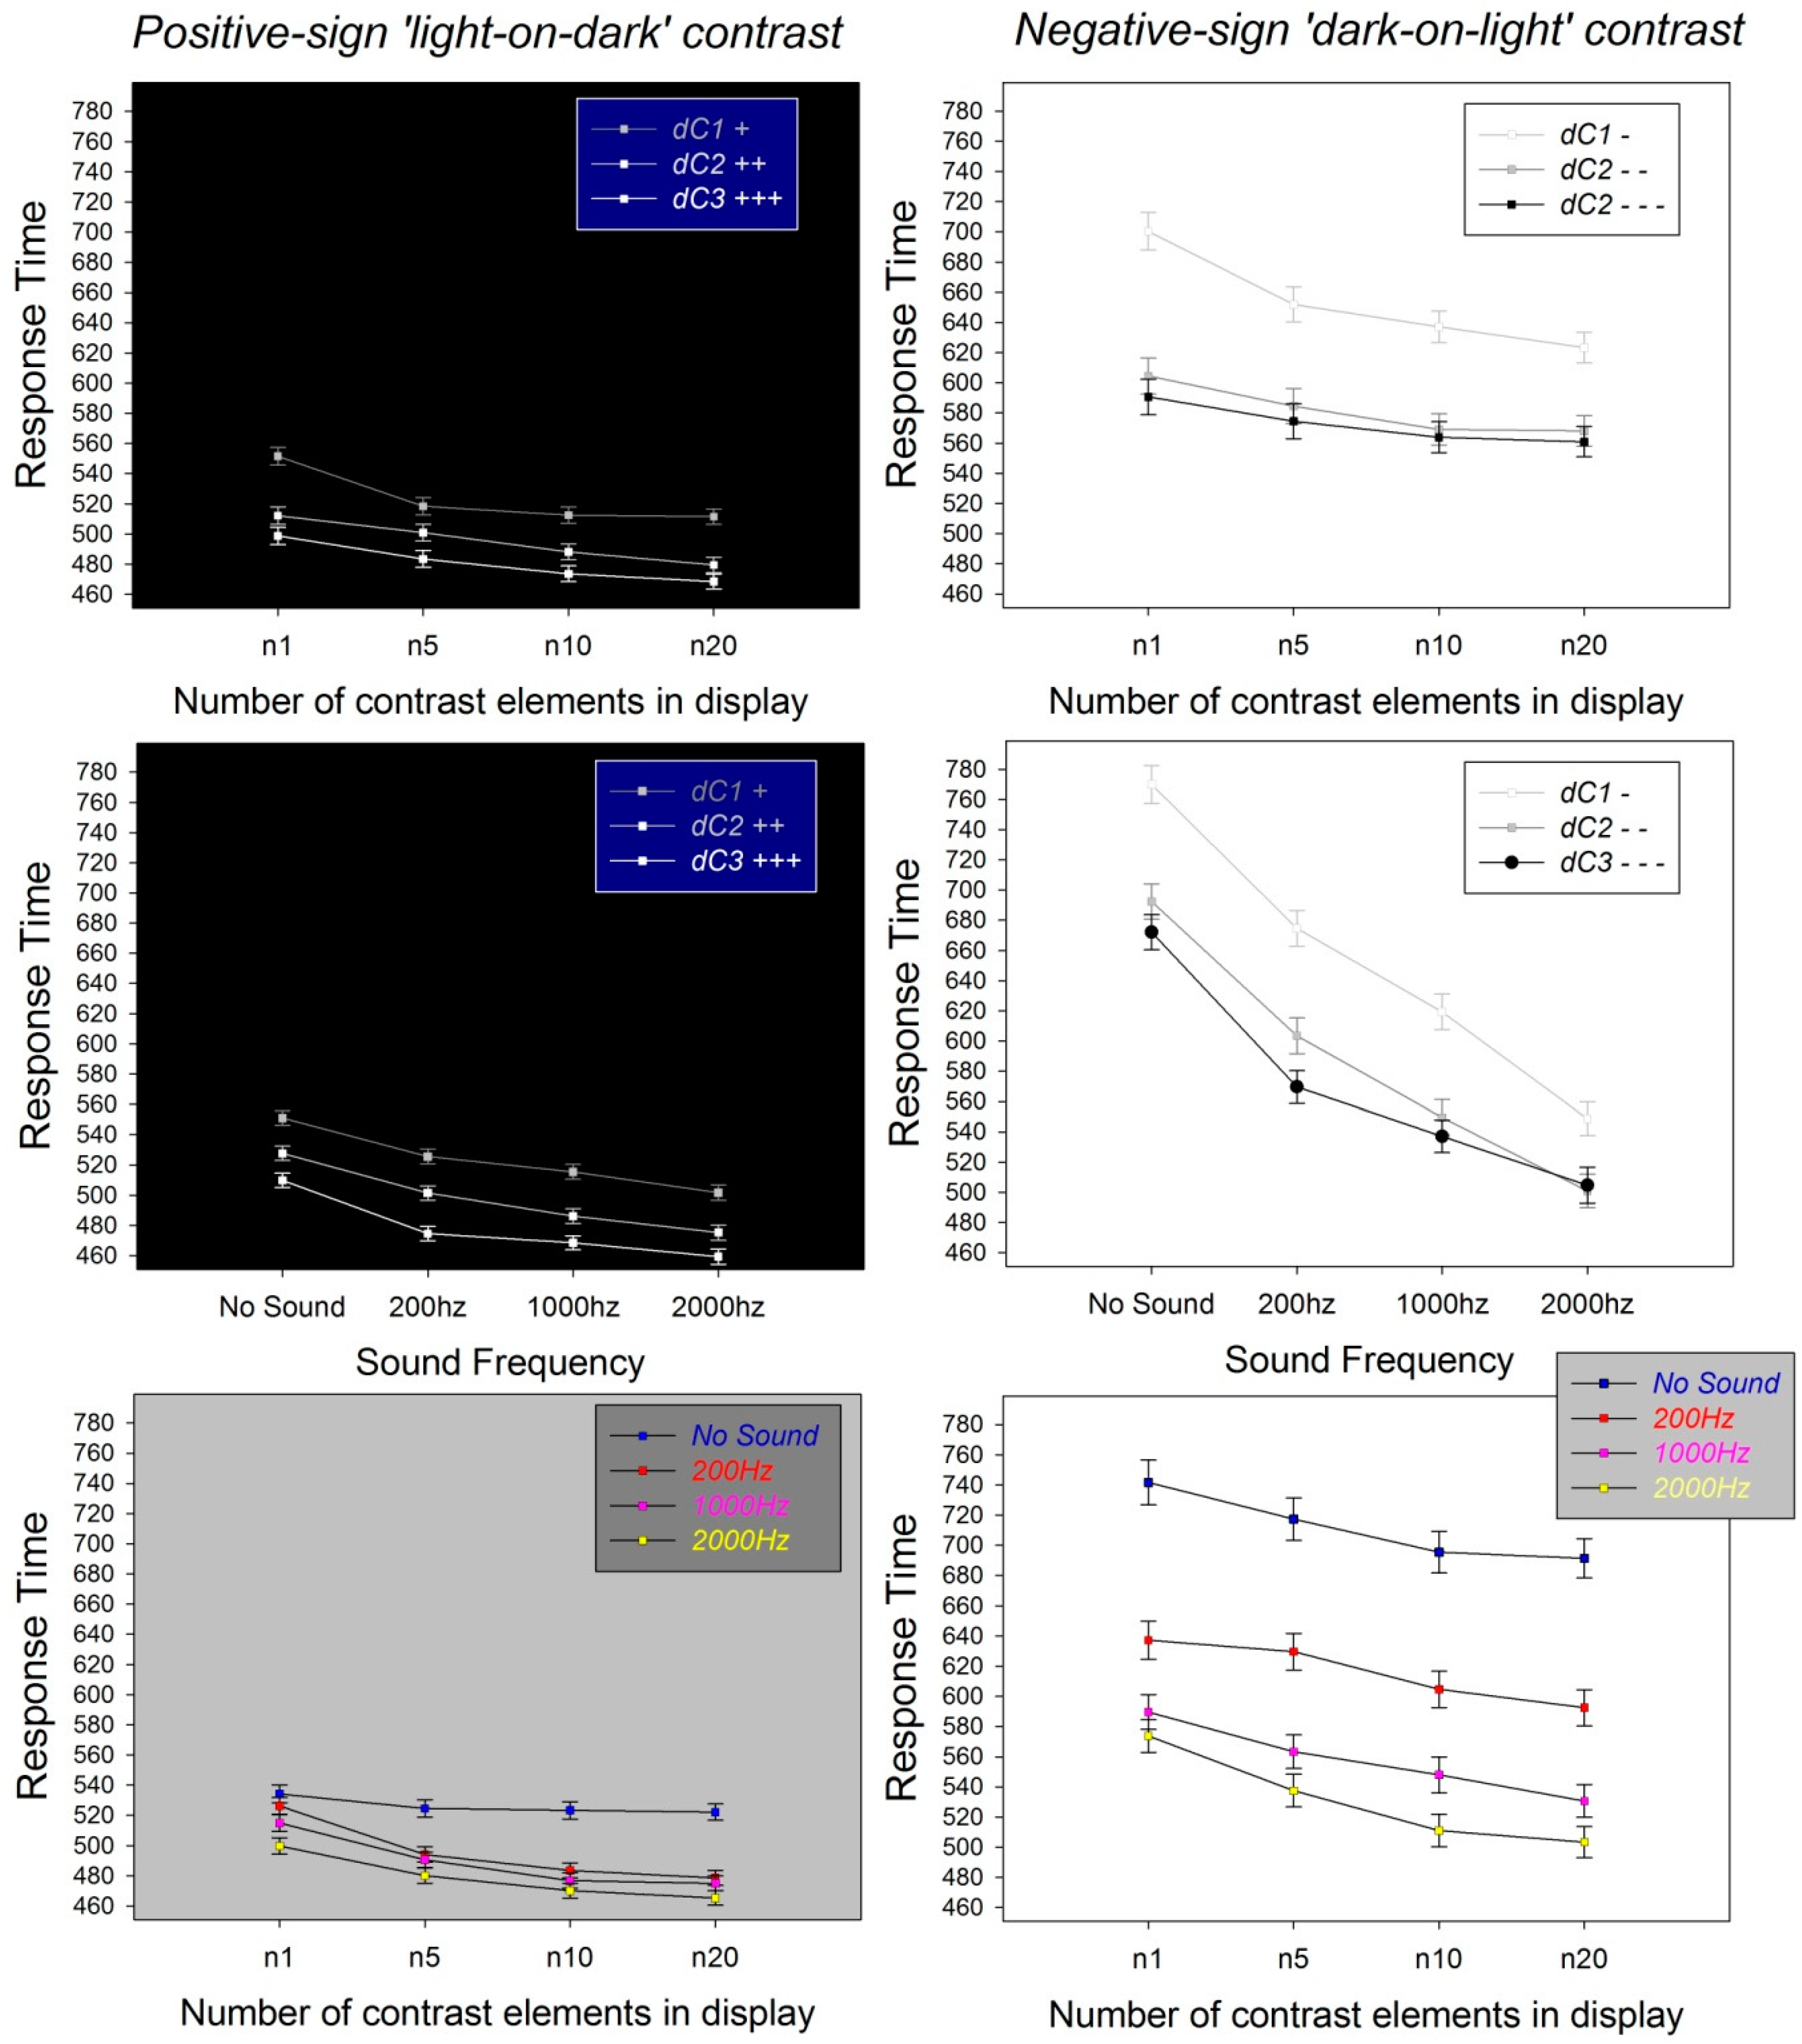
3.3. Contrast Polarity

Effects of the polarity of pattern contrast on response times are shown here when comparing the graphs on the left of Figure 3 to the graphs on the right of Figure 3. Positively signed light-on-dark pattern pairs (Figure 3, graphs on left) produced shorter response times in comparison with negatively signed dark-on-light pattern pairs (Figure 3, graphs on right), despite the fact that the pattern pairs with negative contrast sign displayed moderately stronger differences in visual contrast (dC) between patterns in a pair. This effect of contrast polarity was statistically significant (Table 2), which is explained by the well-documented functional asymmetry between the so-called “on” and “off” contrast processing channels in the human brain [19,20,21,22,23,24,25,26,27,30,31,32]. One of the perceptual consequences of this functional asymmetry is that positively signed contrast configurations, processed by the “on” channels of the visual brain, produce stronger effects of figure–ground segregation [24] and relative depth [17], with shorter perceptual decision times, as confirmed by results here.

3.4. Contrast Difference (dC) in a Pattern Pair

Effects of the difference in visual Weber contrast (dC) between two patterns of a pair on response times are displayed in the two graphs on top as a function of contrast sign and number of contrast elements, and in the two graphs in the middle of Figure 3 as a function of contrast sign and sound frequency. These plots show that response times consistently decreased as the dC increased, both in pattern pairs with a positive contrast sign (Figure 3, top and middle left) and in pattern pairs with a negative contrast sign (Figure 3, top and middle right). This effect of dC on response times reflecting perceptual decisions for relative depth (“nearer”) was statistically significant (Table 2) and predicted by results from previous studies [17,18], as explained in the introduction, and are summarized further below in the discussion.

3.5. Number of Contrast Elements in a Pattern Pair

Effects of the number of contrast elements in a pattern pair on perceptual response times for “nearer” are displayed in the two graphs on top of Figure 3 as a function of contrast sign and number of contrast elements, and in the two graphs at the bottom of Figure 3 as a function of contrast polarity and sound frequency. These plots show that response times consistently decreased as the number of contrast elements in the patterns increased, both in pattern pairs with a positive contrast sign (Figure 3, top and bottom left) and in pattern pairs with a negative contrast sign (Figure 3, top and bottom right). This effect of the number of contrast elements in the patterns on response times was also statistically significant (Table 2), and it was explained by spatial probability summation in the “on” and “off” contrast processing channels of the visual brain, as pointed out again further below in the discussion.

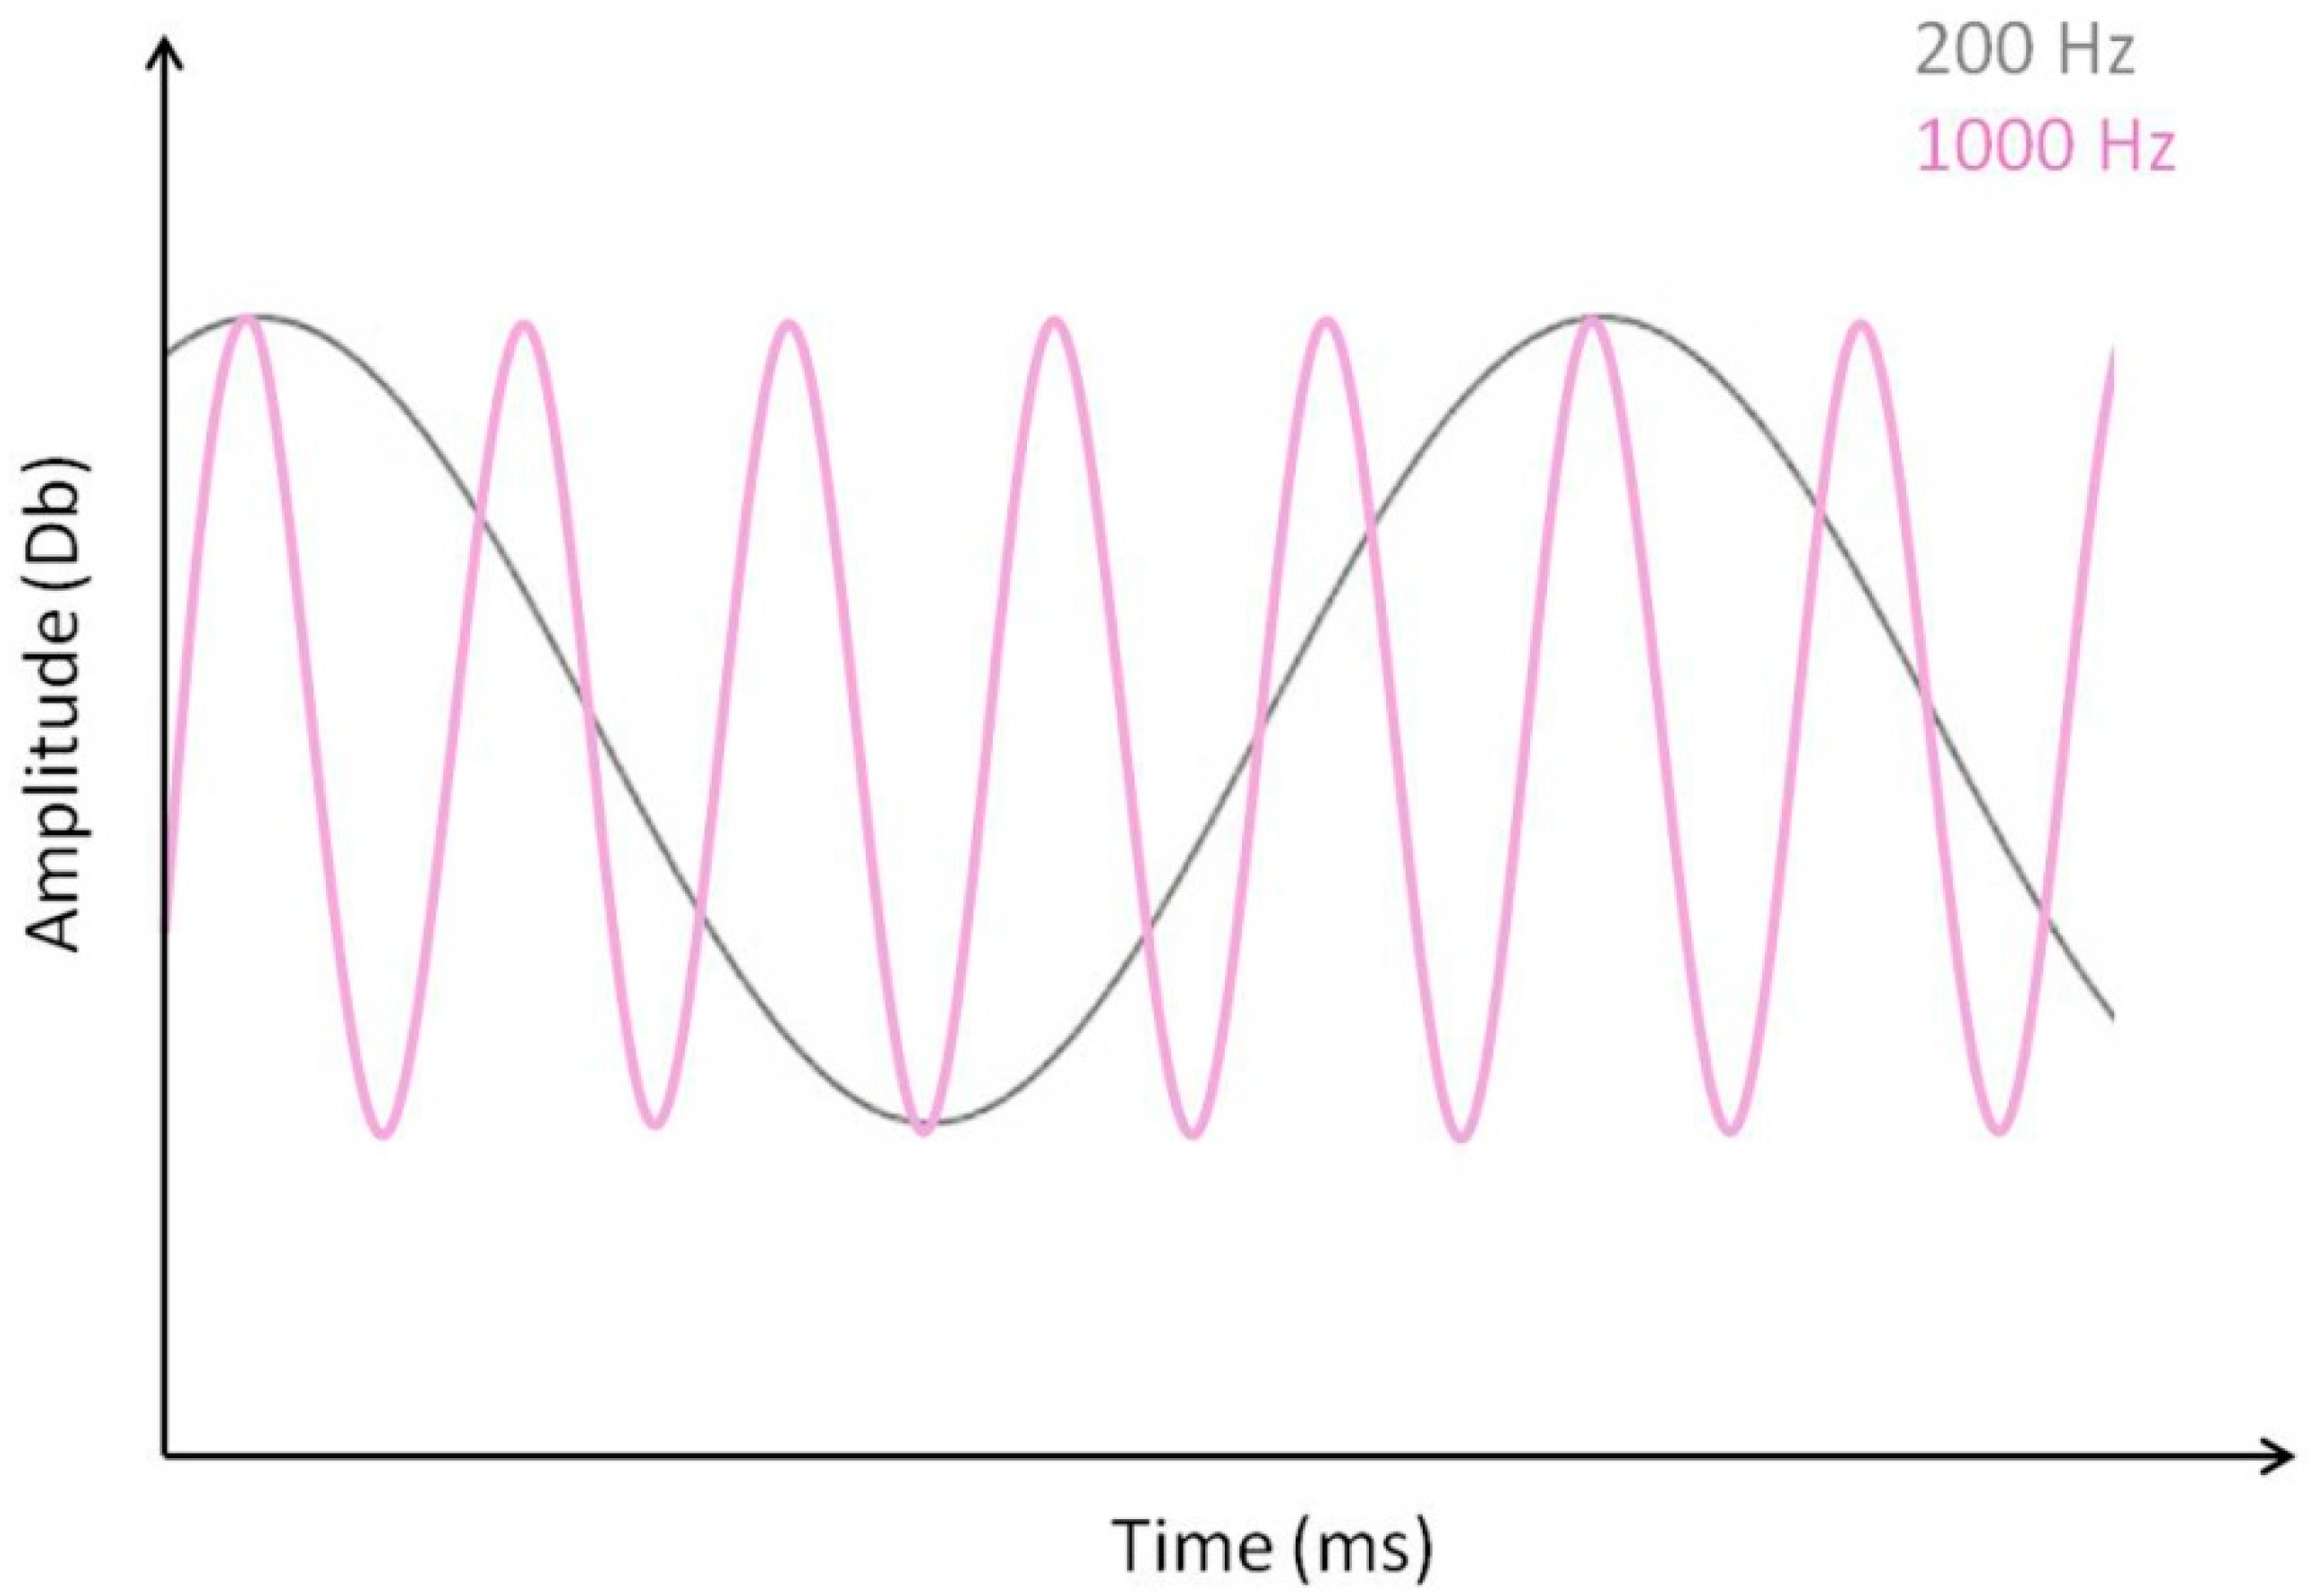
3.6. Sound Frequency

Effects of sound frequency on perceptual response times for “nearer” are displayed in the two graphs in the middle of Figure 3 as a function of contrast sign, and in the two graphs at the bottom of Figure 3 as a function of the number of contrast elements. These plots show that response times consistently decreased as the sound frequency increased, both in pattern pairs with a positive contrast sign (Figure 3, middle and bottom left) and in pattern pairs with a negative contrast sign (Figure 3, middle and bottom right). The effect of sound frequency on response times was statistically significant (Table 2).

3.7. Interactions

Possible interaction between effects of the factors tested here are shown graphically in Figure 3. There was no significant interaction between the number of contrast elements (Nelements) and any of the other three factors (Table 2), nor was there a significant interaction between the sound frequency and the difference in visual contrast (dC) of patterns in a pair (Table 2). Interactions between dC and contrast polarity, and between sound frequency and contrast polarity, were statistically significant (Table 2). Post hoc paired comparisons (Holm-Sidak tests) and their associated power tests were computed for factor levels relative to the significant interactions to unravel which paired comparisons between factor levels yielded statistical significance. The results from these analyses are provided in Table S3 of the Supplementary Materials.

4. Discussion

As predicted by probability summation [1,2,3,4,7,8], combinations of visual contrast and sounds of varying frequency should produce additive effects on choice response times. This prediction was confirmed by the results of the experiments here. Variations in luminance contrast were used to manipulate relative depth in 2D images producing perceptual decisions for “nearer” [17,18]. It is shown that stronger contrasts combined with higher sound frequencies led to faster perceptual decisions [17,18]. This facilitating effect of sound frequency on response times for “nearer” was consistently stronger in the positively signed, light-on-dark, contrast configurations, as predicted by functional asymmetries between the “on” and “off” contrast processing channels of the visual brain [19,20,21,22,23,24,25,26,27,30,31,32]. Moreover, as the number of contrast elements in the 2D patterns increased, the effect of sound on response times also increased statistically, regardless of the contrast sign of the patterns, as predicted by spatial probability summation in the “on” and “off” contrast processing channels of the visual brain. There was no interaction between number of contrast elements in the patterns and their contrast polarity. These results led to conclude that sound frequencies can be effectively used to produce faster decisions in specific visual tasks where the processing of contrast information is critical. The pure tone sound signals preceding the visual contrast stimuli here had three different sound frequencies and identical amplitudes, generated to manipulate the speed with which the sound wave propagates and determines the perceived pitch of each sound [29]. Within the audible frequency range, higher-pitch sounds are generally perceived as “sharper” or “louder” than lower-pitch sounds of the same amplitude. After the experimental trials here, all subjects in the post-test debriefing stated having perceived some of the tones as considerably “sharper” or “louder” than others. In terms of the effect of the different tones on the times taken to reach perceptual decisions for “nearer”, the 2000 Hz tones with the most wave energy, potentially yielding the highest pitch, consistently produced the strongest facilitation effects on response times compared with the no-sound control condition.
The results here are consistent with and extend the results of [28] by showing probability summation in the effect of visual contrast combined with a brief sound of varying frequency, where summation is stronger for stronger contrasts combined with higher sound frequencies. As also pointed out in [28], cross-modal integration is not necessary for these effects. They can be explained by an increased readiness to respond, due to increased attention or awareness [28], to the visual stimulus when a sound announces the stimulus. This readiness to respond seems optimal with alert sound frequencies at 2000 Hz combined with a strong visual contrast, as our data here tend to suggest. The human brain has to analyze and react in real time to an enormous amount of information from the eyes, ears, and other senses. How all this information is efficiently represented and processed in the nervous system is a complex topic in nonlinear and complex systems research. It has been suggested that dynamical attractors may form the basis of all neural information processing [29,30,31,32]. The auditory and visual systems are, indeed, complex and highly nonlinear physiological systems. The combined processing of information from different sensory channels carries perceptual and functional meaning, as highlighted again by the results from this study here.

Supplementary Materials

The following are available online at https://www.mdpi.com/2078-2489/10/11/346/s1, Table S1: Raw data (individual response times) with labels for all factor levels for the different experimental conditions as fed into the 4-Way ANOVA. Table S2: Results of the post hoc paired comparisons (Holm–Sidak tests) between factor levels and their associated power tests. Table S3: Results of the post hoc paired comparisons (Holm–Sidak tests) between factor levels and their associated power tests for interactions. Table S4: Least-squares group means and standard errors associated with each factor.

Author Contributions

Conceptualization, B.D.-L.; methodology, B.D.-L.; software, M.M. validation, M.M., B.D.-L.; formal analysis, M.M., B.D.-L.; investigation, M.M., B.D.-L.; resources, B.D.-L.; data curation, M.M.; writing—original draft preparation, B.D.-L., M.M.; writing—review and editing, B.D.-L., visualization, M.M., B.D.-L.; internal funding acquisition, B.D.-L.

Funding

This research received no external funding.

Acknowledgments

The authors are grateful to the students who volunteered as participants and provided post-test insights with comments and suggestions for future experiments.

Conflicts of Interest

The authors declare no conflicts of interest.

References

  1. Piéron, H. The Sensations; Yale University Press: New Haven, CT, USA, 1952. [Google Scholar]
  2. Pins, D.; Bonnet, C. On the relation between stimulus intensity and processing time: Pieron’s law and choice reaction time. Percept. Psychophys. 1996, 58, 390–400. [Google Scholar] [CrossRef] [PubMed]
  3. Bonnet, C.; Gurlekian, J.; Harris, P. Reaction time and visual area: Searching for the determinants. Bull. Psychon. Soc. 1992, 30, 396–398. [Google Scholar] [CrossRef] [Green Version]
  4. Cattell, J.M. The influence of the intensity of the stimulus on the length of the reaction time. Brain 1886, 8, 512–515. [Google Scholar] [CrossRef]
  5. Exner, S. Ueber die zu einer Gesichtswahrnehmung noetige Zeit. Sitz. Der Kais. Akad. Der Wiss. 1868, 57, 601–632. [Google Scholar]
  6. Wundt, W. Grundzüge der Physiologischen Psychologie; Engelmann: Leipzig, Germany, 1874. [Google Scholar]
  7. Chocholle, R. Variation des temps de réaction auditifs en fonction de l’intensité a diverses fréquences. L’année Psychol. 1940, 41, 65–124. [Google Scholar] [CrossRef]
  8. Stevens, S.S. Psychophysics: Introduction to Its Perceptual Neural and Social Prospects; Wiley: New York, NY, USA, 1975. [Google Scholar]
  9. Altmann, J. Acoustic weapons: A prospective assessment. Sci. Glob. Secur. 2001, 9, 165–234. [Google Scholar] [CrossRef]
  10. Beckerman, J. The Sonic Boom. How Sound Transforms the Way We Think, Feel, and Buy; Houghton Mifflin Harcourt: Boston, MA, USA; New York, NY, USA, 2014. [Google Scholar]
  11. Hanes, D.; Schall, J. Neural control of voluntary movement initiation. Science 1996, 274, 427–430. [Google Scholar] [CrossRef]
  12. Batmaz, A.U.; de Mathelin, M.; Dresp-Langley, B. Getting nowhere fast: Trade-off between speed and precision in training to execute image-guided hand-tool movements. BMC Psychol. 2016, 4, 55. [Google Scholar] [CrossRef]
  13. Batmaz, A.U.; de Mathelin, M.; Dresp-Langley, B. Seeing virtual while acting real: Visual display and strategy effects on the time and precision of eye-hand coordination. PLoS ONE 2017, 12, e0183789. [Google Scholar] [CrossRef]
  14. Dresp-Langley, B. Principles of perceptual grouping: Implications for image-guided surgery. Front. Psychol. 2015, 6, 1565. [Google Scholar] [CrossRef]
  15. Farnè, M. Brightness as an indicator to distance: Relative brightness per se or contrast with the background? Perception 1977, 6, 287–293. [Google Scholar] [CrossRef] [PubMed]
  16. Egusa, H. Effects of brightness, hue, and saturation on the perceived depth between adjacent regions in the visual field. Perception 1983, 12, 167–175. [Google Scholar] [CrossRef] [PubMed]
  17. Dresp, B.; Durand, S.; Grossberg, S. Depth perception from pairs of overlapping cues in pictorial displays. Spat. Vis. 2002, 15, 255–276. [Google Scholar] [PubMed] [Green Version]
  18. Guibal, C.; Dresp, B. Interaction of color and geometric cues in depth perception: When does “red” mean “near”? Psychol. Res. 2004, 10, 167–178. [Google Scholar] [CrossRef] [PubMed]
  19. Qiu, F.T.; Sugihara, T.; von der Heydt, R. Figure-ground mechanisms provide structure for selective attention. Nat. Neurosci. 2007, 11, 1492–1499. [Google Scholar] [CrossRef] [PubMed]
  20. Dresp, B.; Fischer, S. Asymmetrical contrast effects induced by luminance and colour configurations. Percept. Psychophys. 2001, 63, 1262–1270. [Google Scholar] [CrossRef]
  21. Dresp-Langley, B.; Reeves, A. Simultaneous brightness and apparent depth from true colors on grey: Chevreul revisited. See. Perceiving 2012, 25, 597–618. [Google Scholar] [CrossRef]
  22. Dresp-Langley, B.; Reeves, A. Color and figure-ground: From signals to qualia. In Perception Beyond Gestalt: Progress in Vision Research; Magnussen, S., Greenlee, M., Werner, J., Geremek, A., Eds.; Psychology Press: Abingdon, UK, 2014; pp. 159–171. [Google Scholar]
  23. Dresp-Langley, B.; Reeves, A. Effects of saturation and contrast polarity on the figure-ground organization of color on gray. Front. Psychol. 2004, 5, 1136. [Google Scholar] [CrossRef]
  24. Dresp-Langley, B.; Grossberg, S. Neural Computation of Surface Border Ownership and Relative Surface Depth from Ambiguous Contrast Inputs. Front. Psychol. 2016, 7, 1102. [Google Scholar] [CrossRef]
  25. Von der Heydt, R. Figure–ground and the emergence of proto-objects in the visual cortex. Front. Psychol. 2015, 6, 1695. [Google Scholar] [CrossRef]
  26. Dresp-Langley, B.; Reeves, A. Colour for behavioural success. i-Perception 2018, 9, 1–23. [Google Scholar] [CrossRef] [PubMed]
  27. Spillmann, L.; Dresp-Langley, B.; Tseng, C.H. Beyond the classic receptive field: The effect of contextual stimuli. J. Vis. 2015, 15, 7. [Google Scholar] [CrossRef] [PubMed]
  28. Pápai, M.S.; Soto-Faraco, S. Sounds can boost the awareness of visual events through attention without cross-modal integration. Sci. Rep. 2017, 7, 41684. [Google Scholar] [CrossRef] [PubMed]
  29. Oxenham, A.J. Pitch perception. J. Neurosci. 2012, 32, 13335–13338. [Google Scholar] [CrossRef] [PubMed]
  30. Green, D.M.; Swets, J.A. Signal Detection Theory and Psychophysics; Krieger Publishing: Huntington, NY, USA, 1973. [Google Scholar]
  31. Wandeto, J.M.; Dresp-Langley, B. The quantization error in a Self-Organizing Map as a contrast and color specific indicator of single-pixel change in large random patterns. Neural Netw. 2019, 119, 273–285. [Google Scholar] [CrossRef] [PubMed]
  32. Schiller, P.H.; Sandell, J.H.; Maunsell, J.H. Functions of the ON and OFF channels of the visual system. Nature 1986, 322, 824–825. [Google Scholar] [CrossRef]
Figure 1. Forty-eight paired image configurations with variable contrast intensities used as stimuli in the experiments. Twenty-four pairs had positive (a) and 24 pairs had negative (b) contrast polarity. Each pair was preceded by a 70 dB pure tone sound signal (200, 1000, or 2000 Hz) in test conditions with sound.
Information 10 00346 g001
Figure 2. Illustration of a 200 Hz and a 1000 Hz sound wave of identical amplitude (Db). Within the audible frequency range (20 to 20,000 Hz) for humans, higher-frequency (higher pitch) sounds of a given amplitude are perceived as “sharper” than lower-frequency sounds of identical amplitude.
Information 10 00346 g002
Figure 3. Graphic representation of the effects of relative visual contrast between patterns in a pair (dC), contrast sign, number of contrast elements, and sound on perceptual decision times from this study. Mean response times and their standard errors are plotted to show effect sizes and interactions.
Information 10 00346 g003
Table 1. RGB values and luminance parameters (Lum) in candela per square meter (cd/m2) for patterns with positive (light on dark) and negative (dark on light) contrast sign (polarity). Lighter and darker patterns were paired in the image configurations (Figure 1) and displayed to the left and to the right. LumC corresponds to Weber contrasts, calculated as given in (1). The difference between the Weber contrasts (dC) of two patterns in a pair determines the perceived difference in relative pattern depth.
RGBLumLumCdC
Dark image background5552.5 (cd/m2)
Light image background25025025095 (cd/m2)
Positive-sign light-on-dark pairs
‘dC +’lighter patterns25025025095 (cd/m2)37
darker patterns15015015052 (cd/m2)2017
‘dC ++’lighter patterns25025025095 (cd/m2)37
darker patterns10010010030 (cd/m2)1126
‘dC +++’lighter patterns25025025095 (cd/m2)37
darker patterns50505010 (cd/m2)334
Negative-sign dark-on-light pairs
‘dC –’darker patterns5552.5 (cd/m2)37
lighter patterns50505010 (cd/m2)8.528.5
‘dC– –’darker patterns5552.5 (cd/m2)37
lighter patterns10010010030 (cd/m2)2.234.8
‘dC– – –’darker patterns5552.5 (cd/m2)37
lighter patterns15015015052 (cd/m2)0.836.2
Table 2. Results from the 4-way ANOVA on the response time data (n = 1920) with F statistics relative to effects of factors and their interactions, degrees of freedom (df) of the given comparison, and statistical probability limits (p).
FactordfFp
Polarity1231.926<0.001
Nelements33.397<0.017
dC224.990<0.001
Sound Frequency349.835<0.001
Location12.4040.121 NS
Interactions
Nelements × dC60.8720.515 NS
Nelements × Sound Frequency90.3070.973 NS
dC × Sound Frequency60.7270.628 NS
Nelements × Polarity30.8450.535 NS
dC × Polarity23.891<0.021
Sound Frequency × Polarity320.880<0.001

