
Effects of COVID-19 Pandemic on University Students’ Learning


1
Department of Management and Quantitative Methods in Economics, University of Plovdiv Paisii Hilendarski, 4000 Plovdiv, Bulgaria
2
Intelligent Systems Department, Institute of Information and Communication Technologies, 1113 Sofia, Bulgaria
*
Author to whom correspondence should be addressed.
Information 2021, 12(4), 163; https://doi.org/10.3390/info12040163
Submission received: 19 March 2021
/
Revised: 6 April 2021
/
Accepted: 7 April 2021
/
Published: 11 April 2021
(This article belongs to the Section Information Processes)
Abstract
:The risk of COVID-19 in higher education has affected all its degrees and forms of training. To assess the impact of the pandemic on the learning of university students, a new reference framework for educational data processing was proposed. The framework unifies the steps of analysis of COVID-19 effects on the higher education institutions in different countries and periods of the pandemic. It comprises both classical statistical methods and modern intelligent methods: machine learning, multi-criteria decision making and big data with symmetric and asymmetric information. The new framework has been tested to analyse a dataset collected from a university students’ survey, which was conducted during the second wave of COVID-19 at the end of 2020. The main tasks of this research are as follows: (1) evaluate the attitude and the readiness of students in regard to distance learning during the lockdown; (2) clarify the difficulties, the possible changes and the future expectations from distance learning in the next few months; (3) propose recommendations and measures for improving the higher education environment. After data analysis, the conclusions are drawn and recommendations are made for enhancement of the quality of distance learning of university students.
1. Introduction
In 2020, the COVID-19 pandemic has become a severe ordeal for the human population, resulting in urgent measures to limit the spread of the disease and adversely affecting many sectors of the economy. During the lockdowns, alternatives have been quickly found for a lot of economic activities and public services. The closures of entire businesses and travel restrictions caused serious damage to the global economy and fully changed lifestyles worldwide.
The risk of COVID-19 in higher education has affected all its degrees and forms of training. Unexpectedly, a whole generation of young people has had to continue its education in a different way in an unusual situation. New factors and rules have appeared and have exerted influence over the successful completion of the current level of their education [1,2,3]. The transmission of coronavirus reflected not only on the training but also on the safety and the professional realization of the students, especially for vulnerable young people. These changes have manifested themselves worldwide with varying degrees depending on country-specific characteristics [4,5,6,7]. Due to the social significance of the pandemic, it is necessary to investigate the changes in teaching–learning–examination and their impact on the efficiency of training in universities.
The aim of this study is to assess the influence of the COVID-19 pandemic over distance learning in universities in Southern Bulgaria, represented by Plovdiv University Paisii Hilendarski—the largest academic institution in the region. In order to achieve the research goal, an online survey was conducted during the second COVID-19 wave at the end of 2020 among students at Plovdiv University.
The analysis of the collected data reveals important patterns and allows one to compare the obtained results with those from other universities and to monitor dynamic changes in time-course.
The main tasks of the research are as follows:
- assess the attitude and the degree of readiness of students for distance learning during the lockdown;
- collect student dataset (students’ learning characteristics, residential area, income, attitudes, specific problems);
- create a new conceptual framework which facilitates the systematic analysis of the collected data;
- reveal hidden relationships in the student data through the proposed framework;
- clarify the difficulties, the possible changes and the future students’ expectations from distance learning in the next few months;
- propose some recommendations and measures for improving the university educational environment.
The main contribution of the paper is the development of a conceptual framework for evaluation, comparison and prediction of student attitudes towards the COVID-19 crisis based on classical and intelligent methods with symmetric and asymmetric data. This reference framework for data exploration allows one to systematically assess students’ perceptions and readiness for distance learning in the electronic environment. Early detection of problems could not only save cost and time for universities, but also prevent some further social and economic consequences for university students.
The rest of this paper is structured as follows. The study starts with a literature review of investigations of students’ opinions about distance learning under the COVID-19 pandemic. Section 3 introduces a new unified framework for evaluation of the students’ perceptions of the impact of the current health crisis on learning process. In Section 4, the proposed framework is applied to a real dataset for students’ opinion about peculiarities of distance learning in the electronic environment. Finally, the last section concludes and presents future research plans.
2. Related Work
Since the beginning of the pandemic, many studies have been conducted on the impact of COVID-19 on higher education in various parts of the world. According to the literature review, research carried out falls into the following thematic areas:
- learning process and higher education at regional or national level;
- peculiarities of distance learning by subjects of studies, specialties or faculties;
- technological innovations for distance learning in electronic environment.
The focus of our interest is the first area, revealing dependencies on a territorial principle. For example, Sun et al. have analysed the results of a statistical survey conducted among 39,854 students at Southeast University, to measure the effectiveness of large-scale online Chinese education. Though COVID-19 has had a severe impact on normal educational progress, universities in China may take this unforeseen opportunity to detect deficiencies and speed up reform of online education through innovative course content, state-of-the-art technology and efficient management [1].
To assess the impact of lockdown amidst COVID-19 on undergraduate and postgraduate learners of various colleges and universities of West Bengal, India, Kapasia et al. conducted an online survey to collect the information. A total of 232 students provided complete information regarding the survey. Students have been facing various problems related to depression, anxiety, poor internet connectivity and an unfavourable study environment at home [4].
Pham and Ho have discussed the impact of the COVID-19 pandemic on Vietnamese universities and policy makers, paying particular attention to the growing appreciation for the merits of e-learning and related technology-based educational modalities. Some possible avenues for the adoption of e-learning in higher education institutions in Vietnam in a post-COVID-19 environment have been also outlined [5].
Kabanova et al. have evaluated the transition of educational process in Russia to distance education in the context of the pandemic, to identify the factors that hinder the development of learning. The research method was a questionnaire survey on distance learning using information technologies in higher education [6].
Nenko et al. have collected data on Ukrainian students’ attitudes and needs for distance learning during COVID-19 quarantine with an online survey, which involved 540 respondents. The findings revealed the most used distance learning tools, duration of learning, types of leisure activities, readiness of participants in the educational process for distance learning, factors that affect distance learning (skills, internet speed, emotions) [7].
Minghat et al. have surveyed 136 students spread across various universities regarding e-learning systems applied during the COVID-19 outbreak in Indonesia and Malaysia in 2020. According to the authors, e-learning has a positive impact and has become an alternative learning process for lecturers and students [8].
Lassoued et al. have revealed the obstacles to achieving quality in distance learning during the COVID-19 pandemic, based on a large sample of professors and students at universities in the Arab world (Algerian, Egyptian, Palestinian and Iraqi). The researchers have used an exploratory descriptive approach through a questionnaire with a sample of 400 professors and students’ returns. The results indicated that the professors and students have faced self-imposed obstacles, as well as pedagogical, technical, financial or organizational obstacles [9].
According to Al-Okaily et al., university students in Jordan have had to handle several kinds of environmental, electronic and mental struggles due to COVID-19. To represent the current circumstances of more than two hundred thousand Jordanian university students during COVID-19, 587 respondents filled-in an online survey using universities’ portals and websites [10].
According to the presented literature review, a significant part of the research on the consequences of the forced transition to distance learning for students from different countries concerns certain aspects of the educational process and applies specific methods for processing of educational data. Unfortunately, this approach makes it difficult to compare the results obtained in different countries. To overcome this problem, we propose to follow a unified way applying a new reference framework for educational data processing.
3. New Conceptual Framework for Educational Data Analysis
Before introducing the conceptual framework, we give a brief overview of some contemporary methods for analysis of learning process data.
3.1. Intelligent Methods for Processing and Analyzing of Educational Data
Applying modern methods towards the investigation and problem solving of teaching–learning–assessment of university students is not a new idea and it is already used by several researchers [11,12,13,14].
The research methods for investigation of relationships and dependencies between educational indicators, objects or processes could be divided into three main groups:
- Machine learning;
- Multi-criteria decision making (MCDM);
- Analysis of big (streaming) data.
The first group of methods is appropriate for exploratory data analysis, predictive analytics (classification and regression) and text analysis. Exploratory data analysis is an approach to analysing data sets to summarize their main characteristics, often with visual methods (clustering). Predictive analytics focuses on the application of statistical models for forecasting or classification. Machine learning methods for text analytics applies statistical and linguistic techniques to extract and classify information from textual sources.
Various supervised learning algorithms and neural networks from the first group are applicable for educational data: for example, J48, Non-Nested Generalisation (NNge) and Multilayer Perceptron (MLP) [15], Random Forest [16], ensemble [17], Deep Learning [18,19]. Clustering methods like k-means [20,21], document frequency method and support vector machines [22] for students’ data also belong to this group.
The methods for multi-criteria decision analysis with crisp and fuzzy numbers refer to the second group of research methods. MCDM has been an important part of decision sciences since 1960. It is used to define ranking and offers a selection of the most suitable candidates among a set of alternatives, which are evaluated by multiple criteria.
The advantages of MCDM methods are as follows:
- They are appropriate even on a small number of observations, while the alternative probabilistic methods are suitable only for a large quantity of homogenous objects.
- The alternatives could be evaluated both with crisp values and uncertain estimates (linguistic variables).
- They work in both individual and group decision-making mode.
The literature review indicates that many researchers apply MCDM methods to examine educational data. For example, Huzaifa Marina Osman et al. have conducted a study to investigate adoptions factors of ubiquitous learning with Near Field Communication (NFC) and have ranked them using an Analytical Hierarchy Process (AHP) in a MCDM approach [23].
To solve the problem of how to select the right and most suitable e-learning systems, Çelikbilek and Tüylü have inquired into the relations of the system components and have prioritized them in detail for stakeholders. The authors have revealed causal relations among the systems’ parts by using fuzzy DEcision MAking Trial and Evaluation Laboratory (DEMATEL) [24].
Naveed et al. have employed AHP and fuzzy AHP methods with group decision-making to study the diversified factors from different dimensions of the web-based e-learning system [25].
Ilieva and Yankova have proposed a new decision-making methodology for early students’ failure detection in fuzzy environment. High school background, subjects studied in the university and activities in learning management systems (LMS) were determined as factors influencing students’ performance [26].
The last group encompasses the methods for big data analysis. The transitioning to distance learning and online development of knowledge and skills during the pandemic have accelerated the introduction of LMS and e-testing in universities. The growth of educational data volumes has increased their role in planning and decision making. Big data analytics helps the students’ data to be summarized by various attributes (university, faculty, major, year of study, syllabus, subject, study topic or test) in real time; for example, by using streaming algorithms. After analysis of the obtained results, the learning content could be personalized and optimized, being adapted to the individual learning style of each student. For instance, the early prediction of risk of dropping out informs instructors which students require more attention. The data footprints which the students leave about themselves on social networks, forums or Internet sites may also be used to increase the effectiveness of learning; for instance, to predict the future career of each student.
Through the big data technologies, the educators could create optimal learning environment for every student as follows:
- offer flexible, relevant and personalized e-content;
- assess objectively from distance in reliable examination environment [27];
- recommend courses and practices, appropriate for career development.
This group of methods includes also streaming data algorithms, related to data processing continuously rather than in batches. The huge amount of data, their sequential access and the restriction that data should be examined in only one pass, require streaming processing. Streaming data analysis can detect patterns in students’ behaviour in real time, and this information could be sent to alert instructors. Commonly used algorithms for streaming data are Very Fast Decision Tree, Hoeffding Adaptive Trees, Stream Clustering (CluSTREAM) and Stream k-means for classification [28,29,30,31].
The described three groups of methods are suitable for analysis of different volumes of both structured and unstructured data, as well as data with various attributes (continuous, discrete and categorical types), which also could be measured with symmetric and asymmetric fuzzy estimates.
3.2. The Framework for Smart Processing of Educational Data
There is a multitude of studies dedicated to the creation of unified frameworks for intelligent data analysis [26,32,33,34,35]. Their disadvantages are as follows:
- They do not include all the mandatory stages of data processing according to data science.
- They cover one or few data analysis algorithms listed in Section 3.1.
- They rely only on paid technologies accessible for a limited number of users.
Regardless of the large number of previous studies, there is still no generally accepted system for intelligent processing of educational data. In this section, we offer a new detailed framework (Figure 1), which incorporates classical and modern algorithms for data analysis for a variety of educational data with specialized software or packages and libraries for programming languages like R and Python.
The new framework for unified analysis of educational data consists of eight stages, as follows:
- Stage 1. Data Collection
This stage includes various methods for educational data collecting—surveys and automatic data collection from existing information systems for university data, learning management systems, cookies on websites, reviews, likes, comments and shares on social media networks.
- Stage 2. Data Storage
The collected structured data are imported in a relational database or in a single table (dataset). In case of large volumes of data and/or unstructured data (text data, images, audio and video files), they are handled thorough distributed NoSQL databases or could be continuously accessed via a dynamic stream (for example, real-time acoustic or video streams, sensor data streams).
- Stage 3. Data Encoding
Coding rules are defined and the data are arranged by category or labelled to the correct data type (numerical or categorical crisp data, classical fuzzy sets or their modern modifications).
- Stage 4. Data Preprocessing
Once collected and organized, data could be incomplete and contain duplicates or errors. In this stage, data inconsistency should be avoided. The data should be cleaned, missing values added and instances selected. The most frequently used algorithms for estimation of missing values include Predictive Mean Matching, Polytomous Logistic Equation. In this stage, redundant attributes are also determined using well-known statistical instruments for dimensionality reduction as follows:
- feature selection—correlation analysis and discriminant analysis;
- feature extraction—principal component analysis and linear discriminant analysis.
When collecting sensitive data, this stage is aimed also at ensuring that any confidential information in the data remains private. The original data should be concealed with random or false data without compromising their privacy.
- Stage 5. Basic Statistical Analysis
Methods of exploratory data analysis are used at this stage (descriptive statistics and standard statistical analysis for symmetric and asymmetric data). According to the number of investigated features (one or many), the following classical statistical methods are applied:
- univariate analysis—central tendency, dispersion and other methods to shape the data distribution, percent distribution;
- multivariate analysis—cross-tabulations, quantitative measures of dependence (analysis of variances, t-test, chi-square test), descriptions of conditional distributions to clarify the relationship between each pair of variables;
- text analysis—word frequency analysis, collocation analysis, concordance analysis.
- Stage 6. Selection of methods for data analysis
The user selects the appropriate group of methods from the three main categories according to the proposed taxonomy (Section 3.1), the results from Stage 5, the goal set and the available data.
- Stage 7. Data Processing
The processing of educational data continues in the following manner:
- Stage 7.1. Machine learning methods
In case of machine learning methods, the procedure consists of six steps:
- Dataset preprocessing;
- Feature selection (selection of the dependent variable in case of classification);
- Dataset splitting into training and testing subsets (only in case of classification);
- Machine learning algorithm selection;
- Validation of results;
- Future values prediction (only in case of classification).
The analysis starts with preprocessing according to the requirements of the selected machine learning method and/or software peculiarities.
In the case of unbalanced data (categories contain an unequal number of observations and thus, the sample is not representative), data balancing methods should be applied, like extracting an equal number of observations for each category. The numerical data should be normalized and transformed via standardization (z-score, t-score).
In the case of a text dataset, the preprocessing includes the following actions:
- spelling normalization—to correct incorrectly written words;
- data cleaning—to remove unnecessary characters;
- case folding—to change all letters to lowercase;
- stop words removing;
- stemming—to extract the root of the word and transforming it into a normal form;
- part of speech tagging—to determine the parts of speech (nouns, verbs, adverbs, adjectives, etc.).
The most common machine learning algorithms are shown in Table 1.
- Stage 7.2. Multi-criteria decision making
The main steps involved in a MCDM procedure are the following:
- Establishing a system of evaluation criteria that relate to the goal of decision analysis;
- Developing a set of alternatives for attaining the goals;
- Evaluating alternatives according to criteria;
- Calculating relative weight of each criterion;
- Applying a multi-criteria analysis method;
- Keeping the first alternative in ranking as optimal;
- Sensitivity analysis.
If the evaluations are made via linguistic variables (Likert scale questions), then the elements of the decision matrix are fuzzy values (Step 3). After fulfilment of the decision matrix, it should be normalized. The estimates are normalized by using different techniques according to the preferred method (vector normalization, linear sum-based normalization, linear max normalization and linear max–min normalization).
Next, the weight coefficients are calculated via statistical methods (such as variation, mean squared error and entropy method) or via multi-criteria methods (Analytic Hierarchy Process (AHP), Best Worst Method (BWM), DEcision MAking Trial and Evaluation Laboratory (DEMATEL) and Measuring Attractiveness by a Categorical-Based Evaluation Technique (MACBETH)) (Step 4). The most widely used MCDA techniques are VIseKriterijumska Optimizacija I Kompromisno Resenje (VIKOR), Multi-Objective Optimization on the basis of Ratio Analysis (MOORA), Technique for the Order Preference by Similarity to Ideal Solution (TOPSIS), Evaluation based on Distance from Average Solution (EDAS) (Step 5 and Table 1).
- Stage 7.3. Streaming data analysis
The main steps in stream analysis process are as follows:
- Create new streaming dataset and collect the dataset with the streaming data.
- Select features of streaming dataset from streaming data source.
- Visualize and analyse streaming dataset.
- Real time monitoring of the obtained results.
- Stage 8. Results analysis and interpretation
This is the point where the decision maker decides how to implement the revealed dependencies in the management of the educational processes.
If the final solution is not accepted or more processing is needed, the scientist should gather new information and should go to the next iteration of data processing. In the other case, this is the end of data analysis and the results should be interpreted.
4. Illustrative Example
To demonstrate the proposed new framework for processing of dataset for students’ learning data, a list of tasks was formulated.
- Task 1. Collect data from an online survey of students’ opinion about the impact of COVID-19 on the learning process. The respondents are undergraduate and graduate students at Plovdiv University Paisii Hilendarski.
- Task 2. Clarify which are the main characteristics of the survey participants.
- Task 3. Identify groups of students who share similar learning characteristics and groups of variables/indicators with similar impact on the students’ opinions and attitude.
- Task 4. Predict which students are at risk to discontinue their studies.
- Task 5. Determine the attitude of students towards distance learning.
- Task 6. Estimate the degree of readiness of the students for distance learning.
Task 1. Collect data from an online survey of students’ opinion about the impact of COVID-19 on the learning process. The respondents are undergraduate and graduate students at Plovdiv University Paisii Hilendarski.
Solution to Task 1
The solution to Task 1 follows the instructions from Stage 1–Stage 3 of the proposed framework.
Stage 1. Students’ data collection
The data about distance learning was collected through an anonymous online survey during the period from 17 November to 5 December 2020. The questionnaire was created in Google forms and contains 26 questions [36]. The information about the survey and the link to the questionnaire were announced through social networks (Facebook groups) and by e-mail. The questionnaire was correctly filled in by 134 students.
Stage 2. Data storage
The questionnaire and the answers of the students are available online [36].
Stage 3. Data encoding
The developed rules for coding and coded data are also accessible online [36].
Out of all the 26 answers, 21 have been coded. The five text answers (municipality, major, platforms for online learning, platforms for sharing of learning materials and platforms for examination) have not been coded. These answers have been additionally processed.
Task 2. Clarify which are the main characteristics of survey participants.
Solution to Task 2
The solution to Task 2 incorporates the instructions from Stage 4–Stage 5 of the new reference framework.
Stage 4. Data preprocessing
The preprocessing was made and the dataset quality was examined for accuracy and consistency.
Stage 5. Basic statistical analysis
To clarify the profile of the participants in the survey, a classical statistical analysis (percentage distribution of responses, descriptive statistics and correlation analysis) has been performed.
4.1. Demographic Characteristics of Students in Sample
Table 2 shows the demographic profile of the survey participants. Of the 134 students, almost 80% were under the age of 22 with a median of 21 years and a mean age of about 20.5 years. A significant part of the respondents are female (78%). The sample is dominated by students from the Economics major (64.9%).
The distribution of students by geographical districts and regions is shown in Table 3. The highest share of students is from Plovdiv district (60.4), followed by Pazardzhik (10.4%) and Stara Zagora (6%) and the South Central region (81.3%), followed by the South East region (13.4%).
4.2. Information about COVID-19
Table 4 shows the students’ awareness of the current state of epidemic emergency in Bulgaria. Out of 134 participants, 86 students (64.2%) learned about this disease in January 2020. Approximately the same number of students received information about COVID-19 from television and social media, 47.8% and 44.8%, respectively, which shows their awareness of the disease. The majority of students (65.7%) reported staying in their own homes during the lockdown period. The students who are not living at their own home (staying in relatives’ home, rented house, dormitory or combined with their home) were facing more difficulties than students who are living at their home—some difficulties (80.4% and 67.0% respectively), financial (45.7% and 21.6%), learning (6.5% and 3.4%), food (4.3% and 0%).
4.3. Learning Status during the Lockdown
Several questions were asked to determine students’ learning characteristics during the lockdown (mode of learning, the time spent for learning and separate study room) (Table 5). During the second COVID-19 wave, 54 (40.3%) students continued their education in a mixed form (independently with textbooks and in an electronic environment), and 80 (59.3%) students studied entirely in an electronic environment. About a third or 40 (29.9%) students report spending more time than before coronavirus. Out of 134 students, 41 (30.6%) do not have a separate room for studying.
4.4. Information about Online Courses
Among the surveyed students, 15 (11.2%) participate in online lessons fewer than 3 days a week, 84 (62.7%) are engaged more than 3 days a week and 35 (26.1%) attend online classes daily. A figure of 36 (26.9%) students study only through their smartphones. Most of the respondents, 83 (61.9%), use a laptop for e-learning, and the remaining 15 (11.2%) work with a computer. A total of 61.9% of the students learn on their own laptops, while 23 (17.2%) of the students use electronic devices of family members to attend online classes. An insignificant part (0.7%) of the students enriches their knowledge by hired gadgets. Most of the students (88.1%) had no previous experience in e-learning, as they had not used digital learning platforms (LMS) prior to the outbreak of COVID-19 (Table 6).
4.5. Platforms for Online Classes, Sharing Materials and Examination
The students utilize various platforms for training, learning material sharing and assessment (Table 7). The results show that the majority of respondents (85%) use Google Meet to attend e-classes, followed by Zoom (6.8%), YouTube (5.3%) and Microsoft Team (3%). The students rely on different platforms to receive study materials during the lockdown period. It is noted that an insignificant part of the students (3.8%) received shared study materials by e-mail. The majority of the respondents apply Google Classroom and Moodle for this purpose, 55.6% and 36.8%, respectively. The lecturers rapidly mastered not only a variety of platforms for digital teaching and learning, but also for students’ assessment: Moodle (57.9%), Google Classroom (29.3%) and Google form (9.8%). It is worth mentioning that more than half of the students have been examined through a specialized training platform.
The participation in digital learning through various digital platforms due to the COVID-19 pandemic indicates that the learning process is not interrupted, regardless of the critical situation.
4.6. Economic Impact of COVID-19 on Students Learning
Out of 134, 95 students inform us that the standard of living of their families will be affected by the COVID-19 pandemic, and for 77 students, reduced family income due to coronavirus shall exert an adverse impact over their education. Further to that, 34 students respond that the pandemic could result in their withdrawal from the university (Table 8).
4.7. Problems Related to Learning during Lockdown
During this period of lockdown, it was reported that students suffer mostly from problems caused by the quality of Internet connectivity (32.4%). Students also face problems related to the lack of study room (20.5%) and the lack of sufficient interest among lecturers to teach online (18.1%). It was announced also during this period of lockdown that students suffer from depression and anxiety (13.3%). Students also face problems related to the lack of a suitable communication device (8.1%). Students living in rural and remote areas faced more often slow internet connection. The low economic status is a reason for the lack of appropriate physical learning environment (Table 9).
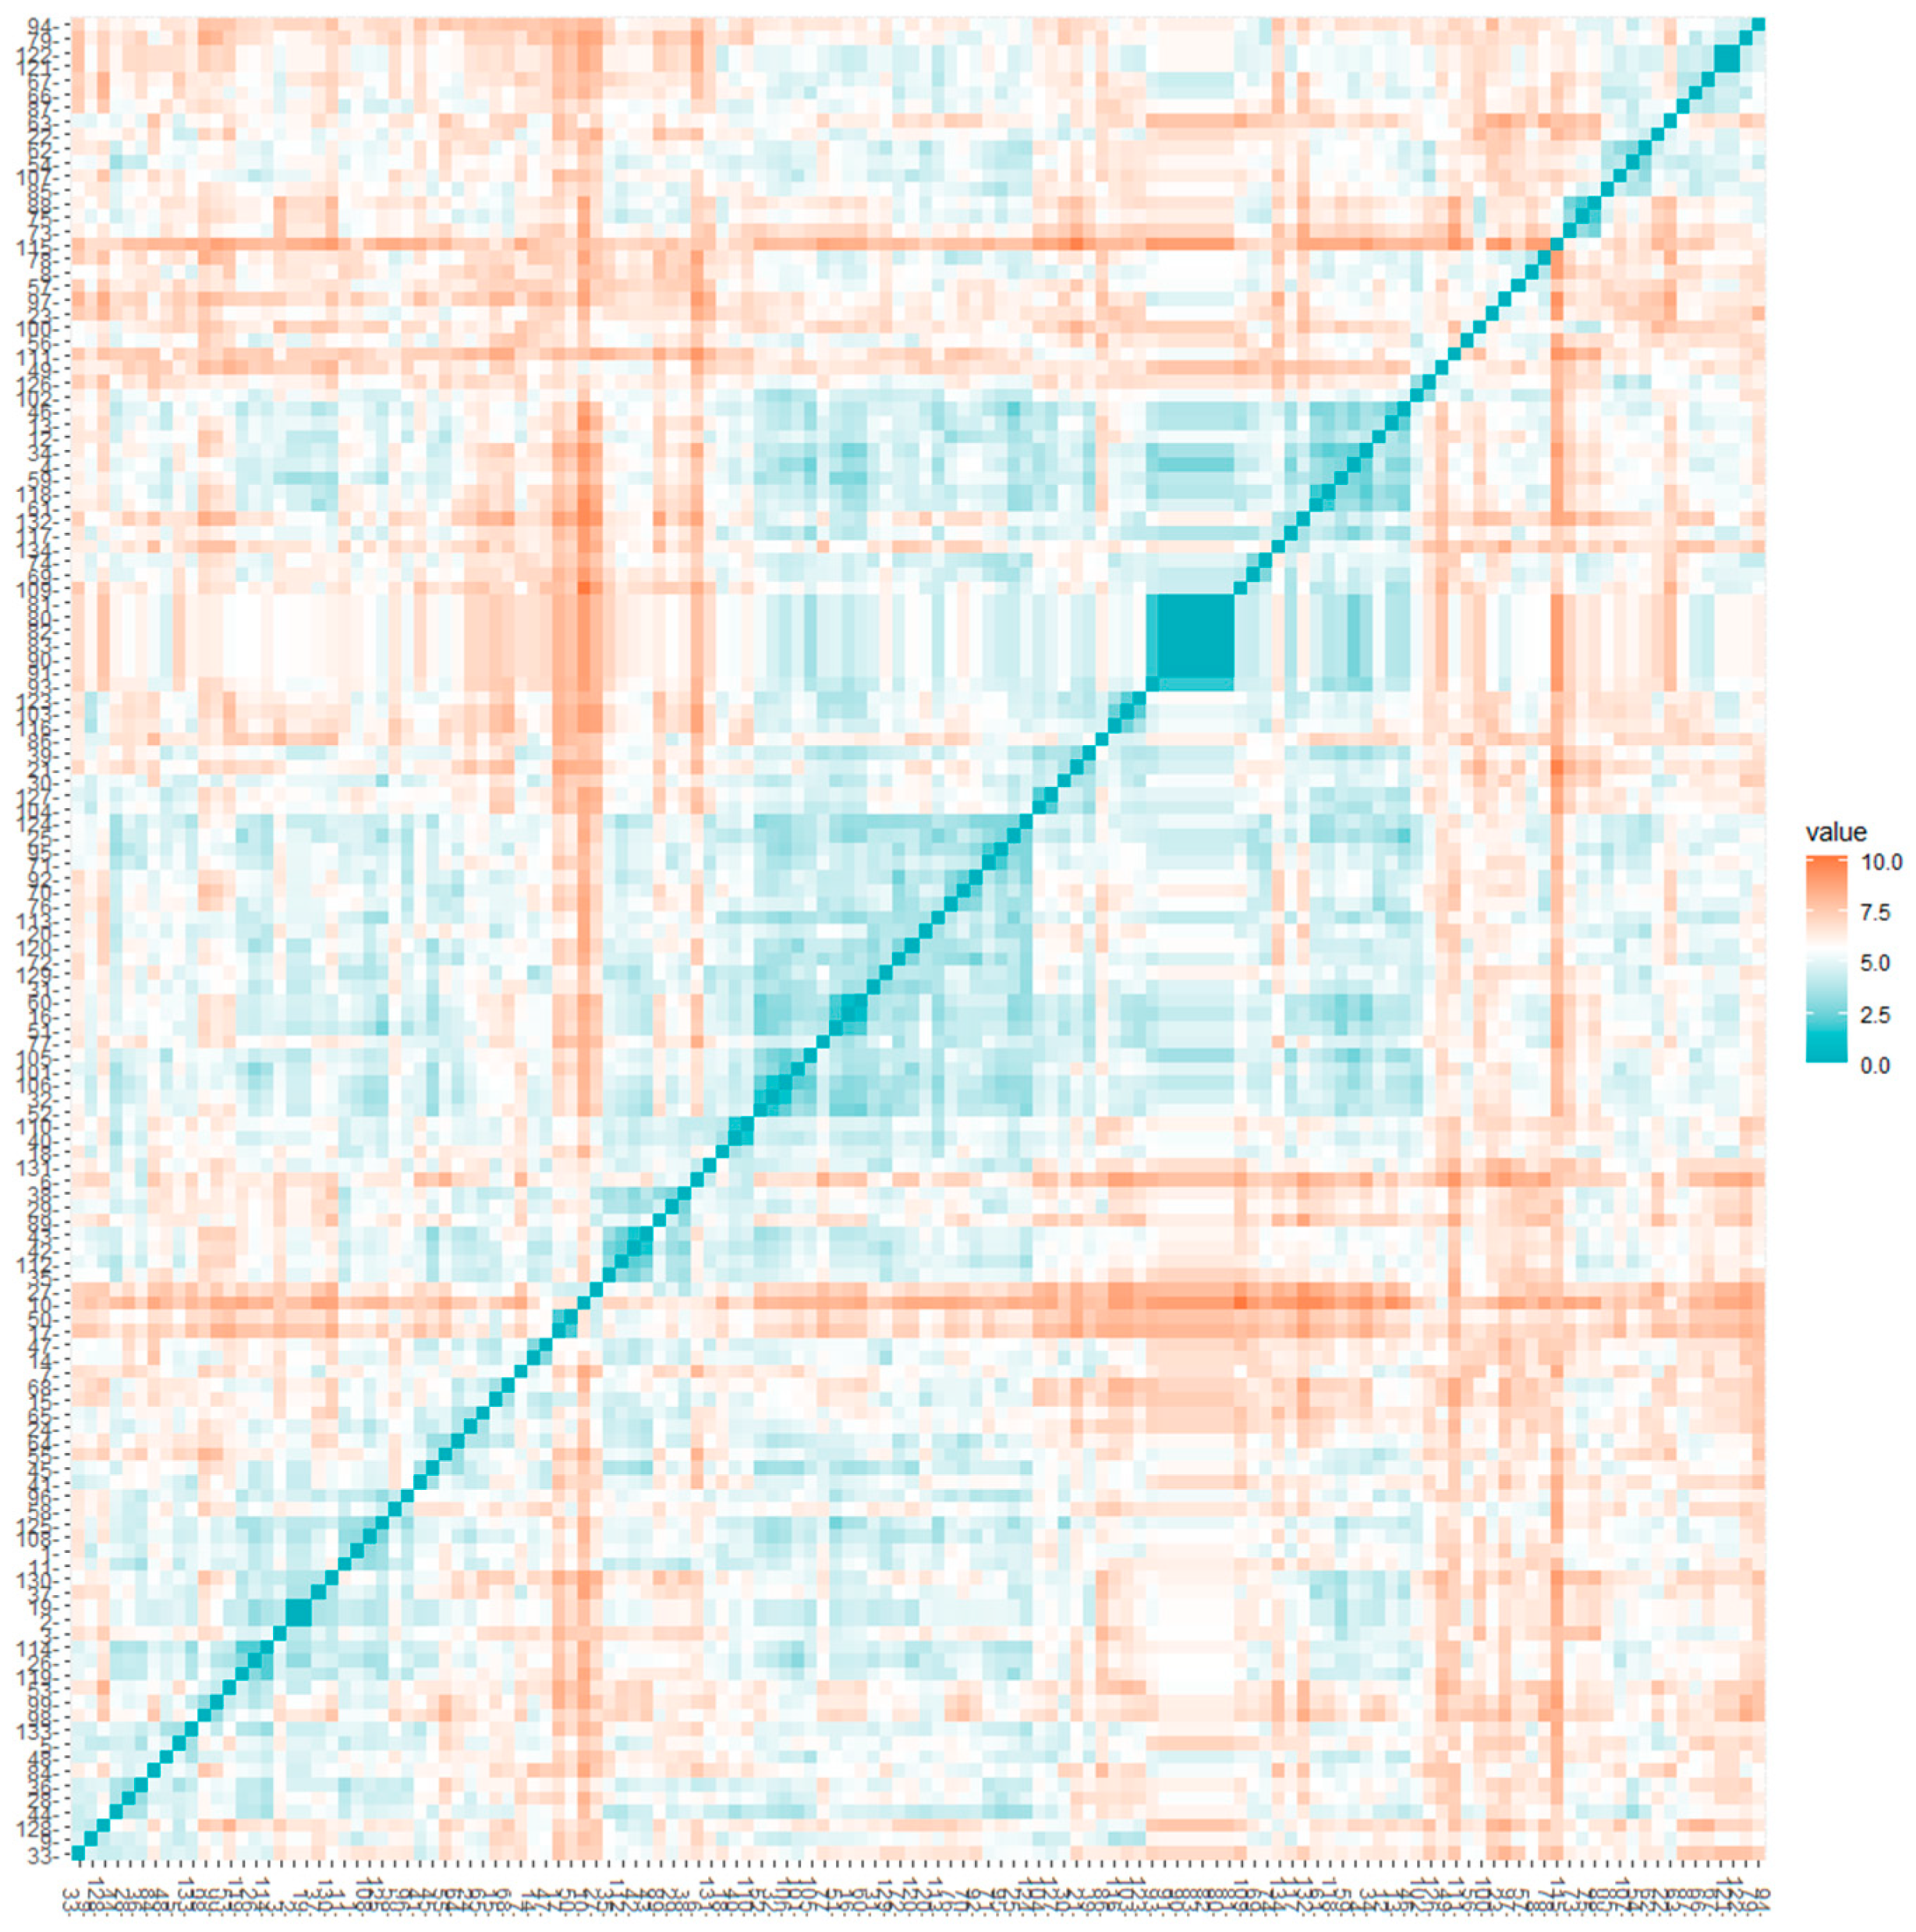
4.8. Duplicate Record Identification
The checking for duplicates assesses redundancy across dataset records. Three groups of duplicate records are established, two of them with two records each (#2 and #19, #121 and #122 students ID respectively), and the third with six records (#80, #81, #82, #83, #90 and #91).
Remark: The students are represented by their dataset identification numbers (ID).
As these answers were given by different IP addresses and the coincidence is solely in the coded fields, these records will participate in the further analysis. Further to that, correlation analysis and analysis of the distances between the records on the coded fields were performed (Figure 2) to establish the degree of similarity. The closer the distance, the smaller the difference between the individuals. The figure shows this degree with different colours: from full coincidence with a value of 0 and blue colour to a maximum difference with a value of 10 and orange colour.
4.9. Feature Selection
During the feature selection step, a correlation analysis by columns was conducted. The results showed strong dependency between some of the attributes. The correlation coefficient between variables “1. What is your age?” and “6. What year are you in university?” is 0.61 (strong correlation) and students’ age attribute was excluded from further processing. There was also a strong relationship established between “5. What is your level of study (academic degree)?” and “6. What year are you in university?”. We chose to skip the field with students’ academic degree. The answers to the questions “9. When did you hear about COVID-19 for the first time?” and “10. What is the source of the information you first learned about COVID-19 from?” do not exert direct impact over distance learning and we did not include them in the analysis either.
To visualize the different attitudes to the distance learning in a compact manner, we have applied the heat map method for hierarchical clustering to measure the similarity between individuals’ opinion (Figure 3) and attributes (Figure 4). The colour depth of the heat map represents the standardized values (the minimum value is about −4.44 in light orange colour and the maximum value is about 2.72 in crimson colour). The hierarchical structure at the top of Figure 3 shows the students’ grouping and the similarity of learners’ attitudes. The dendrogram of attributes (variables) (Figure 4, right) shows their similarity. The correlation between the variables is commented upon in detail in Task 3. To create the heat maps, we have applied Orange 3.22 software.
Task 3. Identify groups of students who share similar learning characteristics and groups of variables with similar impact on students’ opinions and attitude.
Solution to Task 3
The solution to Task 3 follows the instructions in Stage 7.1. of the proposed framework.
To determine the optimal number of clusters, we apply Elbow, Silhouette and Gap Statistic methods for k-means clustering. Unfortunately, the first method did not recommend an optimal solution for a number of clusters between 2 and 15. According to the Silhouette method, however, the optimal number of clusters is two. As may be seen from Figure 5, at k = 2, the overlap of the clusters is minimal. The conclusion is that the k-means method offers a feasible solution to the problem of identifying clusters of students with a similar attitude to distance learning. Additionally, the characteristics of the two clusters should be compared.
Task 4. Predict which students are at risk to discontinue their study.
Solution to Task 4
The solution to Task 4 follows the instructions from Stage 7.1. of the proposed framework.
To find the students who feel threatened with interruption of their education, we apply three methods from the decision trees type group (ClAssification and Regression Trees (CART), Random Forest (RF), Conditional inference Trees (CTREE)) and Support Vector Machines (SVM) method. The reason to choose these four classifiers is that they are among the most popular machine learning algorithms due to their transparency and simplicity.
To assess the quality of the obtained classification models, we apply the following criteria: accuracy, precision, recall and specificity. The obtained results are shown in Table 10. According to them, the forecasts obtained with the RF and SVM models are the best. The RF model shows the highest scores on the four metrics in the group of decision tree methods but loses the first place to SVM in terms of precision and specificity criteria. The program code for clustering and classification is written on R 4.0.3 programming language.
Task 5. Determine the attitude of students towards distance learning.
Solution to Task 5
The solution to Task 5 includes the instructions in Stage 7.1. of the proposed framework.
The last question, which was an open-ended one, received 41 replies. After preprocessing, 37 answers remained, and answers of the type “Yes/No” were dropped. After conducted sentiment analysis, the responses were classified as follows:
- positive—25, average value 0.74;
- neutral—5, average value 0.52;
- negative—7 (actually 6, because one of the negative opinions has score 0), average value 0.20.
The students support distance learning as a temporary way to deal with the situation. Some of the advantages of distance learning are listed. The students, who expressed a negative attitude, mainly insist on full and free access to all study materials and face-to-face training. Neutral opinions support teachers’ efforts but indicate some weaknesses in online learning. The sentiment analysis has been conducted by using the Azure Machine Learning add-in MS Excel.
Task 6. Estimate the degree of readiness of the students for distance learning.
Solution to Task 6
The solution to Task 6 follows the instructions in Stage 7.2. of the proposed framework.
To determine weight coefficients, we apply the entropy method according to the following algorithm:
(a) for all criteria (maximizing and minimizing) according to the formula:
(b) The conversion of the criterion type is performed only for the minimizing criteria according to the formula .
Step 3. The entropy () is calculated for each of the criteria by the formula:
, where and .
Step 4: The weights of the criteria are calculated by the formula:
, where , where () is the degree of diversification of the j-th criterion [37].
Remark: The lower the entropy, the greater the relative weight of the respective criterion as compared to the weights of the other criteria in the decision-making process.
After calculations, we obtain the following 17 weight coefficients corresponding to the given criteria.
W = (0.08, 0.02, 0.06, 0.07, 0.07, 0.07, 0.08, 0.06, 0.06, 0.07, 0.07, 0.07, 0.08, 0.00, 0.06, 0.06, 0.03).
Then, we calculate the state for readiness for distance learning according to the SAW method. In it, each alternative is evaluated by the formula: . The alternatives are sorted in descending order of the obtained scores.
According to the integrated assessments for readiness, the students are divided into two equal groups. The first group includes students with a high degree of readiness, and the second, those with a low degree. The members of both groups are represented by their dataset identification numbers:
Group 1 (Rank 1–67):
116 ≻ 120 ≻ 45 ≻ 52 ≻ 72 ≻ 77 ≻ 31 ≻ 106 ≻ 60 ≻ 101 ≻ 103 ≻ 16 ≻ 41 ≻ 32 ≻ 64 ≻102 ≻ 34 ≻ 43 ≻ 8 ≻ 14 ≻ 124 ≻ 78 ≻ 113 ≻ 123 ≻ 56 ≻ 93 ≻ 47 ≻ 105 ≻ 129 ≻ 57 ≻ 20 ≻ 70 ≻ 74 ≻ 51 ≻ 133 ≻ 86 ≻ 42 ≻ 4 ≻ 92 ≻ 80 ≻ 81 ≻ 82 ≻ 83 ≻ 90 ≻ 91 ≻ 26 ≻ 108 ≻ 39 ≻ 118 ≻ 9 ≻ 67 ≻ 97 ≻ 61 ≻ 59 ≻ 99 ≻ 55 ≻ 95 ≻ 48 ≻ 112 ≻ 121 ≻ 122 ≻ 49 ≻ 98 ≻ 126 ≻ 104 ≻ 107 ≻ 24
Group 2 (Rank 68–134):
76 ≻ 35 ≻ 111 ≻ 25 ≻ 13 ≻ 132 ≻ 21 ≻ 109 ≻ 71 ≻ 65 ≻ 33 ≻ 69 ≻ 117 ≻ 114 ≻ 75 ≻ 30 ≻ 88 ≻ 85 ≻ 15 ≻ 66 ≻ 17 ≻ 2 ≻ 19 ≻ 128 ≻ 29 ≻ 125 ≻ 1 ≻ 23 ≻ 62 ≻ 44 ≻ 50 ≻ 89 ≻ 79 ≻ 7 ≻ 38 ≻ 84 ≻ 127 ≻ 100 ≻ 5 ≻ 131 ≻ 94 ≻ 22 ≻ 40 ≻ 46 ≻ 119 ≻ 68 ≻ 18 ≻ 28 ≻ 73 ≻ 134 ≻ 54 ≻ 12 ≻ 11 ≻ 110 ≻ 130 ≻ 53 ≻ 37 ≻ 36 ≻ 96 ≻ 63 ≻ 27 ≻ 87 ≻ 3 ≻ 115 ≻ 58 ≻ 10 ≻ 6
The entropy method and SAW were preferred over MCMD methods because of their simplicity and time complexity.
The analysis of the mean values per students’ groups (Table 11) shows significant differences in the responses to the following questions: “8. What is your monthly income per person?”, “11. Where do you reside during the lockdown?”, “13. What is your mode of learning?”, “14. What time do you spent studying during the lockdown?” and “15. Do you have a separate room to study in?”.
The Mode (13) and Room (15) attributes with differences of 0.025 and 0.022 between the two groups exert the most significant influence over the readiness for distance learning. This showed that the students whose education is technologically secured and who have their own room do better.
Despite the large number of studies in different countries, the comparison of obtained educational data is difficult due to differences in both datasets and in analysis methodology. Our study is most similar to previous research conducted in Indian universities during the first COVID-19 wave [4]. Digital platforms for distance learning were used by students in both countries, but in Bulgaria, LMS were much more common. In both countries, many respondents have faced huge challenges in online study (for example, 30% and 51% have financial difficulties, in Bulgaria and India, respectively). There is a significant difference in the demographic profile of students in terms of residential area (86% and 30% of students come from urban areas in the Bulgarian and Indian cases, respectively). Indian students were informed later about COVID-19 by an equal mix of information sources (classical and online ones), while Bulgarian students preferred electronic media. According to Indian students, the impact of COVID-19 on domestic economic conditions and educational attendance is perceived as much more significant than the impact according to Bulgarian students’ expectations. Had our proposed integral framework been applied in this study, it would have been easier to compare the obtained results.
The main advantages of distance learning in Bulgarian universities during the pandemic are as follows:
- −
- almost 100% fixed broadband Internet coverage with decent speeds countywide (at least 30 Mbps for download);
- −
- wide application of LMS in teaching–learning–examination process;
- −
- available free access for Google Classroom and Meet, MS Teams, Office 365 and OneDrive for Bulgarian students, teachers and professors.
The results of our study show that there are some problems in distance learning as follows:
- -
- lack of legal regulations—In March 2021, an Ordinance on the state requirements for organizing distance learning in Bulgaria was adopted, coming into force in September 2021. This Ordinance regulates individual and group e-learning activities and e-administrative services for students’ lifecycle management.
- -
- lack of motivation and technological training of some lecturers—Some lecturers do not want to change their stereotypes of teaching and examining. In this case, motivation is needed to help them to perceive the positive effects of distance learning. Other lecturers are not technologically prepared and need training to employ contemporary online tools in distance learning.
- -
- lack of technological training and financial support for some of the universities’ students—In order to overcome the digital divide among students, it is necessary to organize courses for their technological training and to provide the necessary funding for their technology equipment.
- -
- lack of effective control over the quality of teaching and the objectivity in assessment—The universities should implement a quality assessment methodology to improve distance learning and remote online proctoring platforms to prevent cheating during examinations.
- -
- lack of Internet access in small towns and in remote and sparsely populated areas—Although the speed of the Internet in the big cities of Bulgaria is high, in the small towns, remote and sparsely populated areas there is no Internet access. Government intervention is needed to ensure that students from small settlements have access to the virtual learning environment.
5. Conclusions
In this work, we propose a basic framework, which unifies the analysis of educational data. The conceptual framework allows revealing dependencies between learning mode and students’ perceptions and performance, identifying good practices and proposing measures for improving the quality of education.
The new framework was applied to studying the effect of the COVID-19 pandemic on distance learning at Plovdiv University Paisii Hilendarski. Our research shows that a significant number of students have faced enormous challenges and a proportion of them are unable to attend online classes. Low-income students who do not live at home face more difficulties in distance learning due to poor Internet connection or lack of an electronic device. Poverty further exacerbates the problem of digitalisation of education in this health crisis.
The obtained solutions could by summarized as follows:
Task 2: According to the demographic analysis of the survey data, 86% of respondents originate from urban residential area, 82% are under the age of 22, 78% are female and 40% declare an average or higher monthly income. The sample is dominated by students studying for Bachelor degrees (99%) and 65% of them are pursuing majors in Economics. Many students reported some difficulties related to financial problems (30%) and health (27%).
Task 3: The students were grouped into two statistically significant clusters with main differences in residential area, time spent studying from distance, availability of a separate room and gadget used to attend in online classes.
Task 4: According to machine learning predictions, the students at risk of discontinuing their education are those who do not have a separate room and spend less time studying during the lockdown than the rest of the students.
Task 5: The sentiment analysis of students’ opinions shows that the majority (68%) demonstrates a positive attitude to distance learning as a temporary measure for coping with the COVID-19 pandemic.
Task 6: According to the multi-criteria decision analysis, the students who have their own rooms and average or higher income, live at home, learn online and spend more time studying, are better prepared for distance learning.
As mentioned earlier, the limitations of our study are as follows: (1) only students from Plovdiv University participated in the empirical research; (2) not all steps included in the proposed framework were tested; for example, experiments with algorithms for streaming data analysis are missing; (3) the data were analysed statically, at the moment, as there is no information available from the previous period (first COVID-19 wave).
In this regard, in the future we plan to: (1) extend the set of participants in our questionnaire on distance learning in COVID-19; (2) compare the obtained results with those from similar studies from other countries by different attributes (major, course, academic degree, university or region); (3) shed light on changes and the evolution of distance learning during lockdowns to come (if any).
Author Contributions
The contribution of all the authors to the creation of this article (including development of the concept, application and analysis of the experimental results, and writing of the article) is equal. All authors have read and agreed to the published version of the manuscript.
Funding
The research is partially supported by the grants No. FP19-FESS-014 Contemporary tools and approaches for economic and business analysis and No. BG05M2OP001-1.002-0002-C02 Digitization of the economy in an environment of Big Data.
Data Availability Statement
The data stored as csv files are publicly available at http://dx.doi.org/10.17632/wt8g7dth8y.1 (accessed on 10 April 2021).
Conflicts of Interest
The authors declare no conflict of interest.
References
- Sun, L.; Tang, Y.; Zuo, W. Coronavirus pushes education online. Nat. Mater. 2020, 19, 687. [Google Scholar] [CrossRef]
- Coman, C.; Țîru, L.G.; Meseșan-Schmitz, L.; Stanciu, C.; Bularca, M.C. Online Teaching and Learning in Higher Education during the Coronavirus Pandemic: Students’ Perspective. Sustainability 2020, 12, 10367. [Google Scholar] [CrossRef]
- Popa, D.; Repanovici, A.; Lupu, D.; Norel, M.; Coman, C. Using Mixed Methods to Understand Teaching and Learning in COVID 19 Times. Sustainability 2020, 12, 8726. [Google Scholar] [CrossRef]
- Kapasia, N.; Paul, P.; Roy, A.; Saha, J.; Zaveri, A.; Mallick, R.; Barman, B.; Das, P.; Chouhan, P. Impact of lockdown on learning status of undergraduate and postgraduate students during COVID-19 pandemic in West Bengal, India. Child. Youth Serv. Rev. 2020, 116, 105194. [Google Scholar] [CrossRef]
- Pham, H.-H.; Ho, T.-T.-H. Toward a ‘new normal’ with e-learning in Vietnamese higher education during the post COVID-19 pandemic. High. Educ. Res. Dev. 2020, 39, 1327–1331. [Google Scholar] [CrossRef]
- Kabanova, E.E.; Vetrova, E.A.; Evstratova, T.A.; Radchenko, L.E. Remote education development trends during pandemic in Russia. Rev. Univ. Zulia 2020, 11, 536–549. [Google Scholar] [CrossRef]
- Nenko, Y.; Kybalna, N.; Snisarenko, Y. The COVID-19 Distance Learning: Insight from Ukrainian students. Rev. Bras. Educ. Ccedil Campo 2020, 5, 1–19. [Google Scholar] [CrossRef]
- Minghat, A.D.; Ana, A.; Purnawarman, P.; Saripudin, S.; Muktiarni, M.; Dwiyanti, V.; Mustakim, S.S. Students’ Perceptions of the Twists and Turns of E-learning in the Midst of the Covid 19 Outbreak. Rev. Rom. Pentru Educ. Multidimens. 2020, 12, 15–26. [Google Scholar] [CrossRef]
- Lassoued, Z.; Alhendawi, M.; Bashitialshaaer, R. An Exploratory Study of the Obstacles for Achieving Quality in Distance Learning during the COVID-19 Pandemic. Educ. Sci. 2020, 10, 232. [Google Scholar] [CrossRef]
- Al-Okaily, M.; Alqudah, H.; Matar, A.; Lutfi, A.; Taamneh, A. Dataset on the Acceptance of e-learning System among Universities Students’ under the COVID-19 Pandemic Conditions. Data Brief 2020, 32, 106176. [Google Scholar] [CrossRef]
- Asif, R.; Merceron, A.; Ali, S.A.; Haider, N.G. Analyzing undergraduate students’ performance using educational data mining. Comput. Educ. 2017, 113, 177–194. [Google Scholar] [CrossRef]
- Aldowah, H.; Al-Samarraie, H.; Fauzy, W.M. Educational data mining and learning analytics for 21st century higher educa-tion: A review and synthesis. Telemat. Inform. 2019, 37, 13–49. [Google Scholar] [CrossRef]
- Agrusti, F.; Bonavolontà, G.; Mezzini, M. University Dropout Prediction through Educational Data Mining Techniques: A Systematic Review. J. eLearn. Knowl. Soc. 2019, 15, 161–182. [Google Scholar]
- Marques, H.R.; Gomes, L.G.; Zambalde, A.L.; Grützmann, A. Educational Data Mining to Improve E-learning Management: A Systematic Literature Review. Teor. Prát. Adm. TPA 2020, 10, 42–57. [Google Scholar] [CrossRef]
- Imran, M.; Latif, S.; Mehmood, D.; Shah, M.S. Student academic performance prediction using supervised learning techniques. Int. J. Emerg. Technol. Learn. 2019, 14, 92–104. [Google Scholar] [CrossRef] [Green Version]
- Behr, A.; Giese, M.; Theune, K. Early Prediction of University Dropouts—A Random Forest Approach. Jahrbücher Natl. Stat. 2020, 240, 743–789. [Google Scholar] [CrossRef]
- Vidhya, R.; Vadivu, G. Towards developing an ensemble based two-level student classification model (ESCM) using advanced learning patterns and analytics. J. Ambient. Intell. Humaniz. Comput. 2020, 1–11. [Google Scholar] [CrossRef]
- Dien, T.T.; Hoai, S.; Thanh-Hai, N.; Thai-Nghe, N. Deep Learning with Data Transformation and Factor Analysis for Student Performance Prediction. Int. J. Adv. Comput. Sci. Appl. 2020, 11, 711–721. [Google Scholar] [CrossRef]
- Doleck, T.; Lemay, D.J.; Basnet, R.B.; Bazelais, P. Predictive analytics in education: A comparison of deep learning frameworks. Educ. Inf. Technol. 2020, 25, 1951–1963. [Google Scholar] [CrossRef]
- Chang, W.; Ji, X.; Liu, Y.; Xiao, Y.; Chen, B.; Liu, H.; Zhou, S. Analysis of University Students’ Behavior Based on a Fusion K-Means Clustering Algorithm. Appl. Sci. 2020, 10, 6566. [Google Scholar] [CrossRef]
- Moubayed, A.; Injadat, M.; Shami, A.; Lutfiyya, H. Student Engagement Level in an e-Learning Environment: Clustering Using K-Means. Am. J. Distance Educ. 2020, 34, 137–156. [Google Scholar] [CrossRef]
- Chien, Y.C.; Liu, M.C.; Wu, T.T. Discussion-record-based prediction model for creativity education using clustering methods. Think. Ski. Creat. 2020, 36, 100650. [Google Scholar] [CrossRef]
- Osman, H.M.; Singh, M.M.; Shariff, A.R.M.; Bakar, A.A.; Plasencia, M.S. Enhanced Analytical Hierarchy Process for U-Learning with Near Field Communication (NFC) Technology. Int. J. Adv. Comput. Sci. Appl. 2018, 9, 12. [Google Scholar] [CrossRef]
- Yakup, Ç.; Tüylü, A.N. Prioritizing the components of e-Learning systems by using fuzzy DEMATEL and ANP. Interact. Learn. Environ. 2019, 1–22. [Google Scholar] [CrossRef]
- Naveed, Q.N.; Qureshi, M.R.N.; Tairan, N.; Mohammad, A.; Shaikh, A.; Alsayed, A.O.; Shah, A.; Alotaibi, F.M. Evaluating critical success factors in implementing E-learning system using multi-criteria decision-making. PLoS ONE 2020, 15, e0231465. [Google Scholar] [CrossRef]
- Ilieva, G.; Yankova, T. Early Multi-criteria Detection of Students at Risk of Failure. TEM J. 2020, 9, 344–350. [Google Scholar]
- Fischer, C.; Pardos, Z.A.; Baker, R.S.; Williams, J.J.; Smith, P.; Yu, R.; Slater, S.; Baker, R.; Warschauer, M. Mining Big Data in Education: Affordances and Challenges. Rev. Res. Educ. 2020, 44, 130–160. [Google Scholar] [CrossRef] [Green Version]
- Domingos, P.; Hulten, G. Mining high-speed data streams. In Proceedings of the Sixth ACM SIGKDD International Conference on Knowledge Discovery and Data Mining—KDD’00, Boston, MS, USA, 20–23 August 2000; pp. 71–80. [Google Scholar]
- Bifet, A.; Gavaldà, R. Adaptive Learning from Evolving Data Streams. In Advances in Intelligent Data Analysis VIII. IDA 2009. Lecture Notes in Computer Science, 5772; Adams, N.M., Robardet, C., Siebes, A., Boulicaut, J.F., Eds.; Springer: Berlin/Heidelberg, Germany, 2009. [Google Scholar]
- Aggarwal, C.C.; Yu, P.S.; Han, J.; Wang, J. A Framework for Clustering Evolving Data Streams. In Proceedings of the 2003 VLDB Conference, Berlin, Germany, 9–12 September 2003; Elsevier: Amsterdam, The Netherlands, 2003; pp. 81–92. [Google Scholar]
- Ackermann, M.R.; Raupach, C.; Lammersen, C.; Sohler, C.; Märtens, M.; Swierkot, K. StreamKM++: A Clustering Algorithm for Data Streams. In Proceedings of the Twelfth Workshop on Algorithm Engineering and Experiments (ALENEX 2010), Austin, TX, USA, 16 January 2010; pp. 173–187. [Google Scholar]
- Udupi, P.K.; Sharma, N.; Jha, S.K. Educational data mining and big data framework for e-Learning environment. In Proceedings of the 2016 5th International Conference on Reliability, Infocom Technologies and Optimization (Trends and Future Directions) (ICRITO), Noida, India, 7–9 September 2016; pp. 258–261. [Google Scholar]
- Mimis, M.; El Hajji, M.; Es-Saady, Y.; Guejdi, A.O.; Douzi, H.; Mammass, D. A framework for smart academic guidance using educational data mining. Educ. Inf. Technol. 2018, 24, 1379–1393. [Google Scholar] [CrossRef]
- Villegas-Ch, W.; Palacios-Pacheco, X.; Luján-Mora, S. A Business Intelligence Framework for Analyzing Educational Data. Sustainability 2020, 12, 5745. [Google Scholar] [CrossRef]
- Klisarova-Belcheva, S.; Ilieva, G. Business intelligence and analytics—Contemporary system model. Trakia J. Sci. 2017, 15, 298–304. [Google Scholar] [CrossRef]
- Ilieva, G.; Yankova, T.; Klisarova-Belcheva, S.; Ivanova, S. Impact of lockdown on university students’ learning process during the COVID-19 pandemic in Southern Central Bulgaria. In Mendeley Data 2021; Elsevier: Amsterdam, The Netherlands, 2021. [Google Scholar]
- Wu, J.; Sun, J.; Liang, L.; Zha, Y. Determination of weights for ultimate cross efficiency using Shannon entropy. Expert Syst. Appl. 2011, 38, 5162–5165. [Google Scholar] [CrossRef]
Figure 1.
Framework for intelligent processing and analysis of educational data.

Figure 2.
The matrix of distances between students’ answers.

Figure 3.
Hierarchical group heat map by students (top).

Figure 4.
Hierarchical group heat map by variables (right).

Figure 5.
Students’ clusters by k means (k = 2, 3, 4, 5).


Table 1.
Data Processing methods (Stage 7).
| Machine Learning Methods | Multi-Criteria Decision Making | Streaming Data Analysis |
|---|---|---|
| 1. Unsupervised methods (clustering, association) 2. Supervised methods (a) linear classifiers (linear regression, support vector machines) (b) non-linear classifiers (decision trees) (c) neural networks, deep learning (d) rule based classifiers (e) probabilistic classifiers 3. Text analysis (a) the above methods plus sentiment analysis, topic analysis, content tagging (b) lexicon based methods (dictionary and corpus based methods) (c) meaning extraction | 1. Weight determination with crisp and various fuzzy evaluations (a) Analytical Hierarchy Process (AHP) (b) Decision-making Trial and Evaluation Laboratory (DEMATEL) (c) Step-wise Weight Assessment Ratio Analysis (SWARA) (d) Entropy method (e) Best–Worst Method (BWM) (f) Full Consistency Method (FUCOM) 2. Decision analysis with crisp and various fuzzy evaluations (a) Simple Additive Weighting (SAW) (b) Multi-criteria optimization and compromise solution (VIKOR) (c) COmplex PRoportional ASsessment (COPRAS) (d) Technique for Order Preference by Similarity to Ideal Solution (TOPSIS), (e) Evaluation based on Distance from Average Solution (EDAS) | 1. Unsupervised methods 2. Supervised methods (a) Very Fast Decision Tree (b) Hoeffding Adaptive Trees (c) CluSTREAM (d) Stream k-means |
Table 2.
Demographic profile of students in sample (n = 134).
| Characteristics | Frequency (n) | Percentage (%) |
|---|---|---|
| Age of students | ||
| 21 years and below | 110 | 82.1 |
| 22 years and above | 24 | 17.9 |
| Sex | ||
| Female | 105 | 78.4 |
| Male | 29 | 21.6 |
| Residential area | ||
| Rural | 19 | 14.2 |
| Urban | 115 | 85.8 |
| Household monthly income per family member (BGN) | ||
| Below 363 | 22 | 16.4 |
| 363–626 | 59 | 44.0 |
| Above 626 | 53 | 39.6 |
| Academic degree | ||
| Bachelor | 132 | 98.5 |
| Master | 2 | 1.5 |
| Major | ||
| Economics | 87 | 64.9 |
| Business and administration | 9 | 6.7 |
| Physics | 2 | 1.5 |
| Mathematics | 1 | 0.7 |
| Computer science | 17 | 12.7 |
| Pedagogics | 10 | 7.5 |
| Philology | 8 | 6.0 |
Table 3.
Movement of students for their study.
| Home Province (NUTS * 3) | Students (%) | Home Planning Region (NUTS 2) | Students (%) |
|---|---|---|---|
| Blagoevgrad | 2 (1.5) | North Western | 3 (2.2) |
| Burgas | 5 (3.7) | South Central | 109 (81.3) |
| Haskovo | 5 (3.7) | South Eastern | 18 (13.4) |
| Kardzhali | 5 (3.7) | South Western | 4 (3) |
| Montana | 1 (0.7) | ||
| Pazardzhik | 14 (10.4) | ||
| Pernik | 1 (0.7) | ||
| Pleven | 1 (0.7) | ||
| Plovdiv | 81 (60.4) | ||
| Sliven | 3 (2.2) | ||
| Smolyan | 4 (3) | ||
| Sofia (province) | 1 (0.7) | ||
| Stara Zagora | 8 (6) | ||
| Vidin | 1 (0.7) | ||
| Yambol | 2 (1.5) |
* According to the NUTS classification (Nomenclature of territorial units for statistics) of economic territory of the EU and the UK, NUTS 2 includes basic regions for the application of regional policies and NUTS 3 includes small regions for specific diagnoses.
Table 4.
Knowledge and attitudes regarding COVID-19.
| Knowledge and Attitudes | Frequency (n) | Percentage (%) |
|---|---|---|
| Time when heard about COVID-19 for the first time | ||
| January 2020 | 86 | 64.2 |
| February 2020 | 31 | 23.1 |
| March 2020 | 17 | 12.7 |
| Source of information about COVID-19 | ||
| Newspaper | 0 | 0.0 |
| Personal Interaction | 10 | 7.5 |
| Social media | 60 | 44.8 |
| Television | 64 | 47.8 |
| Place residing during the lockdown | ||
| At own home | 88 | 65.7 |
| Other places (relatives home, rented house, dormitory) | 25 | 18.7 |
| Combined | 21 | 15.7 |
| Difficulties faced during lockdown (46—who are not at home/88—at home) | ||
| Financial | 21/19 | 45.7/21.6 |
| Health | 10/26 | 21.7/29.5 |
| Learning | 3/3 | 6.5/3.4 |
| Food | 2/0 | 4.3/0.0 |
| No problems | 9/29 | 19.6/33.0 |
Table 5.
Learning status during the lockdown.
| Variables | Frequency (n) | Percentage (%) |
|---|---|---|
| Mode of learning | ||
| Both textbook and online | 54 | 40.3 |
| Online studying | 80 | 59.7 |
| Reading textbook with own effort | 0 | 0.0 |
| Time spent for study during the lockdown | ||
| Less than normal situation | 47 | 35.1 |
| More than a normal situation | 40 | 29.9 |
| Some like a normal situation | 47 | 35.1 |
| Separate room to study in | ||
| Yes | 93 | 69.4 |
| No | 41 | 30.6 |
Table 6.
Information about online classes.
| Variables | Frequency (n) | Percentage (%) |
|---|---|---|
| Online classes attended per week | ||
| Below 3 days per week | 15 | 11.2 |
| Above 3 days per week | 84 | 62.7 |
| Daily | 35 | 26.1 |
| Gadgets for attendance in online classes | ||
| Android mobile | 36 | 26.9 |
| Laptop | 83 | 61.9 |
| Computer | 15 | 11.2 |
| Possession of gadgets for online classes | ||
| Own | 110 | 82.1 |
| Hired from neighbour | 1 | 0.7 |
| Hired from family members | 23 | 17.2 |
| Attendance of online classes before the outbreak of COVID-19 | ||
| Yes | 16 | 11.9 |
| No | 118 | 88.1 |
Table 7.
Platforms for online classes, materials sharing and assessment.
| Variables | Frequency (n) | Percentage (%) |
|---|---|---|
| Platforms for online classes | ||
| Google Meet | 113 | 85.0 |
| Zoom | 9 | 6.8 |
| Jitsi Meet | 7 | 5.3 |
| Microsoft Teams | 4 | 3.0 |
| Platforms for sharing of learning materials | ||
| Google Classroom | 74 | 55.6 |
| Moodle | 49 | 36.8 |
| 5 | 3.8 | |
| Zoom | 3 | 2.3 |
| YouTube Live | 1 | 0.8 |
| Microsoft Teams | 1 | 0.8 |
| Platforms for students’ assessment and examination | ||
| Moodle | 77 | 57.9 |
| Google Classroom | 39 | 29.3 |
| Google Forms | 13 | 9.8 |
| 2 | 1.5 | |
| Jitsi Meet | 2 | 1.5 |
Table 8.
Impact of COVD-19 on economic status and educational attendance.
| Opinion | Frequency (n) | Percentage (%) |
|---|---|---|
| Do you think that the standard of living of your family will be affected by COVID-19 pandemic? | ||
| Yes | 95 | 70.9 |
| No | 39 | 29.1 |
| Do you think that if your family income lowered during COVID-19 pandemic and this would affect your education? | ||
| Yes | 77 | 57.5 |
| No | 57 | 42.5 |
| Do you think that the COVID-19 pandemic may cause you to discontinue your education? | ||
| Yes | 34 | 25.4 |
| No | 100 | 74.6 |
Table 9.
Problems related to the study during the lockdown.
| Problems | Frequency (n) | Percentage (%) |
|---|---|---|
| Internet connection problems | 68 | 32.4 |
| No room to study at home | 43 | 20.5 |
| Professors are not interested in teaching online | 38 | 18.1 |
| Feeling anxious or depressed | 28 | 13.3 |
| I have no gadgets with online capability | 17 | 8.1 |
Table 10.
Models’ evaluation of training and validation sets by classification methods.
| Performance Measure | Training Dataset | Validation Dataset | ||||||
|---|---|---|---|---|---|---|---|---|
| ClAssification and Regression Trees (CART) | Random Forest (RF) | Conditional inference Trees (CTREE) | Support Vector Machines (SVM) | CART | RF | CTREE | SVM | |
| Accuracy | 78% | 100% | 75% | 88% | 84% | 88% | 78% | 88% |
| Precision | 41% | 100% | 62% | 72% | 40% | 60% | 60% | 80% |
| Sensitivity | 71% | 100% | 55% | 84% | 50% | 60% | 38% | 57% |
| Specificity | 80% | 100% | 84% | 90% | 89% | 93% | 92% | 96% |
Table 11.
Comparison between students’ groups by attributes *.
| Summary | Sex (2) | Residential (3) | Year (6) | Income (8) | Reside (11) | Type (12) | Mode (13) | Time Spent (14) | Room (15) |
| Average | 0.004 | 0.063 | 0.023 | 0.043 | 0.052 | 0.056 | 0.035 | 0.029 | 0.045 |
| Average (1–67) | 0.005 | 0.067 | 0.024 | 0.052 | 0.060 | 0.060 | 0.048 | 0.035 | 0.057 |
| Average (68–134) | 0.004 | 0.059 | 0.023 | 0.035 | 0.043 | 0.053 | 0.023 | 0.023 | 0.034 |
| Difference | 0.002 | 0.008 | 0.001 | 0.017 | 0.017 | 0.007 | 0.025 | 0.012 | 0.022 |
| Summary | Days (16) | Gadget (17) | Ownership (18) | Before (19) | Standard (23) | Education (24) | Stop (25) | Difficulties (26) | Sum |
| Average | 0.042 | 0.028 | 0.071 | 0.000 | 0.047 | 0.033 | 0.007 | 0.055 | 0.6319 |
| Average (1–67) | 0.045 | 0.032 | 0.073 | 0.000 | 0.047 | 0.032 | 0.005 | 0.059 | 0.7006 |
| Average (68–134) | 0.039 | 0.023 | 0.069 | 0.000 | 0.044 | 0.033 | 0.009 | 0.051 | 0.3464 |
| Difference | 0.007 | 0.009 | 0.004 | 0.000 | 0.003 | −0.001 | −0.004 | 0.008 | 0.3542 |
* The number in parentheses is the question’s number.
Publisher’s Note: MDPI stays neutral with regard to jurisdictional claims in published maps and institutional affiliations. |
© 2021 by the authors. Licensee MDPI, Basel, Switzerland. This article is an open access article distributed under the terms and conditions of the Creative Commons Attribution (CC BY) license (https://creativecommons.org/licenses/by/4.0/).
Share and Cite
MDPI and ACS Style
Ilieva, G.; Yankova, T.; Klisarova-Belcheva, S.; Ivanova, S. Effects of COVID-19 Pandemic on University Students’ Learning. Information 2021, 12, 163. https://doi.org/10.3390/info12040163
AMA Style
Ilieva G, Yankova T, Klisarova-Belcheva S, Ivanova S. Effects of COVID-19 Pandemic on University Students’ Learning. Information. 2021; 12(4):163. https://doi.org/10.3390/info12040163
Chicago/Turabian StyleIlieva, Galina, Tania Yankova, Stanislava Klisarova-Belcheva, and Svetlana Ivanova. 2021. "Effects of COVID-19 Pandemic on University Students’ Learning" Information 12, no. 4: 163. https://doi.org/10.3390/info12040163
Note that from the first issue of 2016, this journal uses article numbers instead of page numbers. See further details here.