
Sustainable Mobility as a Service: Dynamic Models for Agenda 2030 Policies

Dipartimento di Ingegneria dell’Informazione, delle Infrastrutture e dell’Energia Sostenibile, Università degli Studi Mediterranea di Reggio Calabria, 89124 Reggio Calabria, Italy
Information 2022, 13(8), 355; https://doi.org/10.3390/info13080355
Submission received: 22 June 2022
/
Revised: 20 July 2022
/
Accepted: 21 July 2022
/
Published: 25 July 2022
(This article belongs to the Special Issue Emerging Research in Urban Computing and Intelligent Transport Systems)
Abstract
:Growth trends in passenger transport demand and gross domestic product have so far been similar. The increase in mobility in one area is connected with the increase in GDP in the same area. This increase is representative of the economic and social development of the area. At the same time, the increase in mobility produces one of the most negative environmental impacts, mainly determined by the growth of mobility of private cars. International attention is given to the possibilities of increasing mobility and, therefore, social and economic development without increasing environmental impacts. One of the most promising fields is that of MaaS: Mobility as a Service. MaaS arises from the interaction of new user behavioral models (demand) and new decision-making models on services (supply). Advanced interaction arises from the potentialities allowed by emerging ICT technologies. There is a delay in the advancement of transport system models that consider the updating of utility and choice for the user by means of updated information. The paper introduces sustainability as defined by Agenda 2030 with respect to urban passenger transport, then examines the role of ICT in the development of MaaS formalizing a dynamic model of demand–supply interaction explicating ICT. Finally, the advanced Sustainable MaaS, defined SMaaS, is analyzed, evidencing the contribution to achieving the goals of Agenda 2030.
1. Introduction
The increase in mobility is, historically, statistically connected with the increase in Gross Domestic Product (GDP) per capita in the area concerned [1], and with the conditions of collective welfare. GDP and collective welfare are representative of the economic and social development of the area. At the same time, the increase in mobility is one of the most important elements of environmental impact, for the production of greenhouse gases (GHG) and on an urban scale of Particulate Matter of diameter x (PMx).
The impacts for emissions are mainly of two types: those on the air that the people breathe and those that cause global warming; PMx is considered representative for the former, CO2 for the latter. Just as examples: road transport accounts for 95% of CO2 emissions in the transport sector in the EU (682 million of the total 712 million tons) and is the main source of environmental pollution [2]; PM10 causes disorders of the respiratory tract and cardiovascular system and increases cancer risk and mortality rate. In Switzerland, about 25% of the air pollution caused by PMx is attributed to motorized transport [3].
Mobility is a positive decisive factor for the social and economic development of urban structures, and, at present, a negative factor for environmental impacts. Due to environmental impacts, many cities have introduced charging policies for entry. These policies contribute to the reduction of environmental impacts but have negative impacts on economic and social development.
Economic, social and environmental impacts are the founding elements of a sustainable development strategy, defined by the Brundtland report [4], which introduced social and economic issues into sustainable development, while previously, sustainability was theorized only with respect to environmental issues.
The Brundtland report has allowed for a wide debate at the international level among the countries that have different levels of development. On the basis of the results of the international discussion, a document was formulated, called Agenda 2030, which found wide consensus [5].
Agenda 2030 specifies the sustainability of development in terms of 17 goals that must be pursued by the signatory countries. Quantitative targets are specified for each goal. The mobility of passengers and goods is one of the crucial elements in pursuing the targets. The mobility policies that can be used for the Agenda 2030 targets concern interventions on vehicles, tangible and intangible infrastructures and governance, in order to enhance the positive impacts and reduce the negative ones. Great attention should be given to the development policy of new generation transport services on an urban scale, because it allows the pursuit of different goals with their respective targets. In this context, the most promising field is that of MaaS: Mobility as a Service. In the following, the goals and targets on which MaaS can have a significant direct or indirect impact will be examined.
MaaS arises from the interaction of new user behavioral models (demand) and new decision-making models regarding services developed by the managers of public and private urban transport companies (supply). Advanced interaction arises from the potentialities allowed by emerging Information and Communication Technologies (ICT). They are identified as emerging regarding use in MaaS, because they are widely developed in other fields. These ICTs, used in this way, are, in fact, advanced Intelligent Transportation Systems (ITSs): Internet of Things; big data; Blockchain (Internet of value); and Artificial Intelligence.
The current state of development of MaaS is determined by the advanced use of ICT technologies, of which there is an extensive literature. The literature on MaaS and the technologies used is all very recent; a subsequent section is dedicated to it where it is treated in detail.
It is useful here to recall some references, at an international level, which can be considered topical points in the development of MaaS: the prototype experience, carried out in the city of Helsinki since 2014, with the design of the first platform with four bundles [6]; the in-depth theoretical development of the services model, with the expansion of the bundles offered to users, carried out starting from 2017 by a group of Australian researchers [7]; the Italian experience, currently underway [8], which, in addition to the integration of services, to offer bundles, is integrating more cities, introducing for the first time, on an operational level, an ICT architecture shared between all cities.
The choice models proposed in the reference literature, to simulate user behavior, are all static. That is, they do not consider, during the user’s path, the modifications of the supply that may induce modifications in the choice made at the beginning of the path by the user. In the literature, there are no works that report the study of user behavior in the daily choice of the path-service when the user is supported by emerging ICT technologies, and then there are no dynamic models that consider the evolution of behavior due to available ICTs. Likewise, there are no models that consider the scheduled services components of the supply, and finally, there are no dynamic models for interaction. That is, models that consider the update of the user’s utilities, the update of his choices and, therefore, the interactions between the updated choices and the actualized conditions of the supply.
As part of the supply models, considering the central role given by the chaining of schedules, the basis for all travel planners of MaaS, it is necessary to use networks that explicitly consider all the runs, with the relative schedules, of all collective lines.
To coordinate services by offering more attractive bundles for users, it is necessary to have supply–demand interaction models of dynamic nature that explicitly consider the information provided by ICT both in the actualization of network conditions and in the actualization of user choices.
It therefore appears that the modelling structures, supply and demand and their interaction, currently used and defined in the context of Transport System Models (TSM) do not allow the consideration of possibilities offered by MaaS in dynamic aspects. The problem is to have an advanced formalization, in terms of dynamic models, based on current knowledge of dynamic processes within TSM, which allows you to use the system of models for two application areas: to be able to study MaaS in its daily use; and to plan the components to identify policies aimed at the defined objectives.
The theme becomes identifying the indicators of Agenda 2030 that require the use of TSM to verify, ex ante in the planning stage, the policies to be implemented. Advanced modeling tools are, therefore, required to verify the results of public policies aimed at achieving the goals of Agenda 2030: both for goals on which MaaS directly impacts, and for goals on which it impacts indirectly. On the line of research, which evolves MaaS towards sustainability, an internally deeply integrated literature is proposed, in which the different aspects of the MaaS–TSM relationship are explored: the interaction between supply and demand is deepened considering all the contributions to the development of the theoretical model [9]; the basic components of the supply and their bundled organization are studied in real cases where the supply is more extensive [10]; MaaS demand is analyzed, starting from the real cases, in the different components considering also the induced demand, and with different specifications [11]; on the basis of supply, demand and their interaction, the network design modeling is proposed, setting sustainability objectives [12]; after the tactical–operational scale investigated with network design, the impact of MaaS in the strategic planning of the smart city is considered [13].
With the topics mentioned, MaaS evolved in the TSM field, which therefore allows the study of the impacts on sustainability, and can be defined as Sustainable MaaS, indicated with SMaaS.
In relation to the three problems schematized, the paper after the introduction is divided into three main sections. In Section 2, the main characteristics of MaaS are first recalled, then the goals and targets of Agenda 2030 are identified, for which MaaS can contribute. International targets and indicators are analyzed for each goal with the operational indicators that individual countries must produce. Reference is made to the indicators that are estimated annually for Italy. The set of Italian indicators is chosen because, among the countries that have signed Agenda 2030, it is one of the most complete examples of sets of indicators, calculated and published for all targets. For many countries, the set of indicators is not public or the values of the individual indicators for each year are not calculated and published. In the third section, referring to the TSM approach in the literature, the role of emerging ICT technologies (new ITS) in the development of MaaS is examined. A dynamic formalization of the TSM is proposed that explains the ICT components. In the next section, the integration of the two previous sections is proposed. It is highlighted how MaaS, called SMaaS, with the integration of ICT and TSM, allows us to study the policies that target sustainability. It analyzes how the different categories of interventions can contribute to the achievement of the sustainable objectives of Agenda 2030. In the final discussion, the main elements of the paper are highlighted and different ideas are provided for the further development of theoretical and applied research.
The main novelties of the paper consist of:
- Analysis of the goals and targets of Agenda 2030 and highlighting those for which MaaS can contribute to the pursuit;
- Formulation of a dynamic model in the TSM field, with the formalization of emerging ICT technologies not present in the literature, in the demand model, in the supply model and in the interaction model, with the use of a schedule-service model for the supply;
- Use of TSM models existing in the literature, and proposed in the paper, for the quantitative evaluation of MaaS development policies with respect to the targets of Agenda 2030.
This paper is of interest to researchers in the field because it opens up a series of research directions useful for formalizing next-generation MaaS. It is useful for MaaS operator technicians because it allows updates in real time of the information necessary for the user to update the choices.
The structure of the note follows the classic canons that allow the reader to follow the purpose and novelty of the paper. Section 2 presents the first part of the methodology, deepening the quantitative aspects connected from one side to MaaS and from the other to Agenda 2030, identifying the targets and indicators on which to verify the progress of the goals obtainable with MaaS. In Section 3, the crucial part of the methodology is developed by proposing a dynamic model for simulating user behavior in the MaaS context. Section 4 presents the results of the application of the model proposed with respect to Agenda 2030. In the last section, the results are discussed and some conclusions are drawn, identifying the prospects for research development.
2. Mobility and Agenda 2030
2.1. Main International Experiences of MaaS
Different definitions have been proposed for MaaS. As with other organizational phenomena of services, the various definitions do not coincide and are sometimes contradictory.
A definition for similarity can be given considering what happens in freight transport with intermodality, which is configured, starting from the international definition of Multimodal Transport Operator, as a new alternative. In the same way, MaaS with the definition of MaaS Operators, increasingly assumes the autonomy of a new alternative, with respect to the transport services that compose it.
MaaS developed in the second decade of the twenty-first century, starting from the first forms of fares integrations between public transport services.
It is useful to recall the main international experiences of MaaS with distinctive features. It is useful to recall the experiences that have contributed to the development of MaaS both theoretically and in terms of application: in Finland, UK, Australia and in Switzerland. It is necessary to recall the experience that is developing in Italy, which brings new issues to the attention of the international debate.
The Finnish experience is among the first where MaaS is proposed, also introducing the term itself. The experience has succeeded in developing both the public and private components. The knowledge and skills have been strengthened with the experiences developed in the capital. Helsinki is a global reference city for the development of ITS [6]. The development is specified, in the public sphere, in an integrated way in various fields: compact development of the city along the railway axes; C-ITS-connected vehicles; integration of services with the transition from private to shared vehicles, MaaS; e-commerce and city logistics; and autonomous vehicles. In the development of MaaS, Finland has produced an operator that has managed to establish itself in other countries as well. MaaS Global has created an advanced system between hardware and software, called Whim [14]. From the Finnish experience, the first distinctive element can be drawn: MaaS should change user perception of car ownership by moving from private ownership to other forms such as shared and carpooling.
In London [15], the first Stated Preference survey is carried out that highlights the user’s decision process in the purchase of MaaS products. In this way, the researchers begin to hypothesize that MaaS is identified as an alternative when perceived by the user.
Among the remarkable experiences at the international level is that of Switzerland. An experiment was conducted in Zurich to analyze “the potential success of MaaS bundles follows consumer valuation of the bundles as compared to valuation of stand-alone services” [16]. Experience is important because it introduces the perception of MaaS as a new alternative. The authors hypothesize that there are two necessary and sufficient conditions for a system to be MaaS: “(1) transportation service bundling and (2) a mobility platform (with a multimodal journey planner) that acts as a unified gateway (the ability to pay with a single account, i.e., payment integration, is implied in service bundling)”.
Another remarkable experience is the Australian one. The city of Sydney has put in place a MaaS project whose crucial element is the development of the bundle offered to users. It goes from Whim, which offers four bundles, to the possibility of extending bundles much more widely, according to what users want [17]. For the first time, the theme of the contribution that the MaaS can provide “in a broader sense to achieving societal goals that have a sustainability focus” [7] is stated.
An important experience is that developed in Italy. Analyzing what has been implemented in other countries, it emerged that it leaves the development of MaaS to the initiatives of individuals alone, generating inefficiencies related to the multiplication of components and similar activities, also with reference to the activities of transport operators [8,18]. The problem is solved by introducing a level of disintermediation (business-to-business), where data and services of transport operators are aggregated for MaaS Operators. The structures implemented internationally with the star connections of the individual MaaS operators with the transport operators are the reference. On this basis, the Italian structure is developed with the inclusion of the level of intermediation. The intermediation layer is prepared on the basis of the UITP indications [19]. The layer is called the National Access Point (NAP) and is developed with the creation of an open platform, integration layer and standard interface between the various operators, which are called Data Sharing and Service Repository Facilities (DS&SRF). The architecture built on a DS&SRF basis allows the creation of a system with additional actors. A first group of aggregators/territorial integrators for data is the RAP (Regional Access Points). A second group of territorial aggregators/integrators of a technological type consists of sales platforms (PV) that can integrate multiple transport/mobility operators for all types of service sales. The Italian experience brings together the best results obtained at an international level both in terms of the overall theoretical business model and in terms of implementation carried out in 10 cities of different dimensional and socio-economic characteristics.
MaaS is, therefore, currently at a remarkably advanced state with regard to technological architectures and business models. MaaS, using the collective service as a supporting structure and car sharing as a feeder service, allows mobility to grow but reduces negative environmental impacts.
It is necessary to research which goals, and which specific indicators of Agenda 2030, are influenced by mobility directly and indirectly. The issue concerns mobility in private cars, which fails to respond positively to the indicators of Agenda 2030, while MaaS could improve socio-economic indicators without worsening environmental ones.
2.2. Goals, Targets and Indicators Influenced by MaaS
Agenda 2030 is the shared international reference for sustainable development. A major international debate preceded and followed the signing of the most important documents that contain precise commitments for the signatory countries.
The first definition of sustainable development was given in 1987 in the report prepared by the World Commission for the Environment and Development, known as the Brundtland report, which highlights the three main fields of sustainable development: society, economy and environment. Almost 30 years later, in September 2015, 193 UN member states endorsed the document Transforming our world: the 2030 Global Agenda for Sustainable Development [5]. Agenda 2030 identifies 17 sustainable development goals (Figure 1). For each goal, specific targets have been defined to be pursued, obtaining a total number of 189 targets. In 2018, specific indicators were defined for each of the targets, resulting in 216 indicators (Figure 2) [20]. Each country has identified its own national statistical center to take care of the ex post evaluation. Each country has linked the single indicator with one or more variables periodically estimated, at least annually, in its statistical system (for Italy [21]).
The goals have expanded, updated and deepened the sustainability specification set by the Brundtland report. In the goals of Agenda 2030, it is possible to identify some homogeneous groups that define structural elements of different countries [22,23]:
Group “Vital Needs”: considers the three objectives that should be guaranteed to all in order to lead a qualitatively dignified life. End poverty in all its forms everywhere (1); End hunger, achieve food security and improved nutrition and promote sustainable agriculture (2); Ensure healthy lives and promote well-being for all at all ages (3).
Group “Optimal needs”: consider the three objectives to be pursued for the collective well-being. Ensure inclusive and equitable quality education and promote lifelong learning opportunities for all (4); Achieve gender equality and empower all women and girls (5). Ensure availability and sustainable management of water and sanitation for all (6).
Group “Classic Sustainability”: follows the guidelines of the Brundtland report. Promote sustained, inclusive and sustainable economic growth, full and productive employment and decent work for all (8, economic); Reduce inequality within and among countries (10, social); Take urgent action to combat climate change and its impacts (13, environmental).
The first two groups, Vital Needs and Optimal Needs, are, or can be, pursued with general policies and indicate the overall level of sustainable development of each country.
In Agenda 2030, the problem of mobility is present in an important way. Some goals are directly related to urban mobility (Table 1), i.e., the value of the indicators depends precisely on the level and type of urban mobility. Since MaaS is increasingly a protagonist of urban mobility, its importance in Agenda 2030 is remarkable.
Goal 11. Make cities and human settlements inclusive, safe, resilient and sustainable.
Goal 11, with Target 11.2 and Indicator 11.2.1, explicitly refers to the role of public transport in cities for different categories of users. Both the demand in the different user segments and the supply are considered. It is the main target that is given to urban mobility and the policies that must be pursued.
Goal 3. Ensure healthy lives and promote well-being for all at all ages.
Goal 3, with Target 3.6, refers directly to the organization of mobility. In European countries, much progress has been made on road safety on motorways. On an urban scale, the target is, in fact, pursued with modal change, increasing the number of users of collective transport.
Some goals are linked to urban mobility and to MaaS in indirect form (Table 2); that is, in addition to MaaS, they need other types of intervention, which must be carried out with other policies. A first group of goals concerns the economic and social components of development.
Goal 8. Promote sustained, inclusive and sustainable economic growth, full and productive employment and decent work for all.
Goal 8, with Target 8.4 and related indicators, refers directly to the need to make the best use of resources. The decoupling of economic growth and environmental degradation is cited as a key element. On this issue, the EU had already expressed itself precisely in reference to mobility and the decoupling between economic and mobility growth. In this case, as seen before for safety, the possibility of enhancing mainly the systems in a reserved location allows a growth of mobility decoupled from environmental degradation. Fixed-route collective transport systems allow the integration of urban areas, favoring the growth of PIL and the development of higher standards of productivity both through technological progress and through job creation.
Goal 9. Build resilient infrastructure, promote inclusive and sustainable industrialization and foster innovation.
Goal 9, through Target 9.1 and Indicator 9.1.2, refers to the quality of infrastructure to resilience considering transhipment infrastructures, to support economic development and access for all. Transhipment infrastructures are explicitly included in this objective. It should be noted that MaaS bases its existence on the possibility of better integrating the different basic modes and services available and integration can only be done if adequate transhipment infrastructures are available that easily allow the modal exchange between bikes, cars, buses and metro.
Goal 10. Reduce inequality within and among countries.
Goal 10 expressly calls for the reduction of inequalities. Mobility management is one of the most important tools for addressing inequalities. These often manifest themselves with poor accessibility both active and passive. Further, in this case, strengthening collective transport systems in the most disadvantaged areas makes it possible to bridge inequalities. Note that the goal considers inequalities both between different countries and within individual countries. Inequalities in urban areas are often very obvious. It is interesting to note that only for this target, among all those envisaged, the evaluation mode has been expressly included. The Gini coefficient is indicated, which is a measure that describes how homogeneous or unequal income or wealth is distributed among the population of a country, which can be applied to urban areas. Note that a specific variable between the Italian variables is not currently calculated. The implementation of transport systems in marginalized areas, if it does not resolve inequalities, does not allow them to grow.
Finally, specific goals are linked to urban mobility and, therefore, to MaaS in an indirect form (Table 3), and concern the role that mobility has in environmental impacts, from production to consumption of energy sources.
Goal 7: Ensure access to affordable, reliable, sustainable and modern energy for all.
Goal 7, with Targets 7, Amendments Nos. 2 and 7 and Amendment No. 3, refers to the need to secure an increasing amount of energy from renewable sources and to have better efficiency in the use of energy. Urban mobility can also contribute to these targets, but the contribution is indirect. The metropolitan rail system is designed to be a viable alternative to private transport by car and public transport by road. The latter is adapting to the possibility of using electric or hydrogen vehicles and, therefore, energy from renewable sources. The metro allows the use of renewable energy, improves energy efficiency, and guarantees the use of clean energy and complete control of emissions.
Goal 13. Take urgent action to combat climate change and its impacts.
Goal 13, with the Target 13.2, expressly refers to climatic changes due to greenhouse gases. In this case, specific policies relating to vehicles and urban transport systems make it possible to pursue the goal. It should be noted that still most of the movements in urban areas take place mainly by cars with a single passenger, which is the mode with the highest impact on greenhouse gases emitted per passenger per km transported.
3. Transportation System Models for MaaS
3.1. Direction of Advancement for Transport Sector
From what is presented in Section 2, the significant impact of mobility on the goals of Agenda 2030 is highlighted.
From the available scientific and technical literature, the technological advancement of passenger cars emerges strongly [24,25]. Technology is evolving in an increasingly important way, developing an increasingly autonomous and connected motor vehicle. Autonomy and connection advance with different speeds and with different intensity in large automotive groups, according to the different business logics. Sometimes the two directions complement each other. Another highly innovative field is that concerning engines and braking systems with the introduction of increasingly advanced ICT components that flow into the so-called mechatronics. To complete the framework, significant innovations concern the profound changes in propulsion systems that increasingly point towards electric motors [26].
At the same time, there is a strong advance with important investments in the field of infrastructure, particularly in road infrastructure. Various countries have prepared regulations and guidelines to allow homogeneous development of the various components, trying to reconcile the needs of a free market with those of a unification of systems. Regulations and guidelines for European countries refer to EU indications [27,28]. Innovation is driven by the increasingly pervasive presence of ICT.
For vehicles and infrastructures, interaction with the driver becomes a central element and determines the subsequent generations of both autonomous and connected vehicles and intelligent infrastructure.
The strong technological advancement of vehicles and infrastructure is directly reflected in the modal distribution, increasing the share of the private car compared to public transport systems.
At the same time, the possibility of using emerging technologies to encourage modal choices that have collective public transport as a reference has emerged.
This possibility was born with the first integrations between the tickets issued by companies operating in different territorial segments in the same region. As a prototype example, the ticket “UNICO” Campania [29] is cited. Campania is a region of Italy where, since the last decade of the twentieth century, it is possible with a single ticket to use all means of public transport, from regional trains, to subways, to city buses. Together with the fares integration, the integration of timetables began to be experimented on. The two types of integrations had, at the beginning (and in many realities, still today), resistance from public transport companies, who had to share some choices with other companies.
A further important process is the one that has concerned (and is concerning) the regulatory evolution relating to the ownership of the single means of transport and shared use. Without wishing to go into the merits of the various forms present today worldwide, we consider that shared mobility is enriched every day with new international experiences. Regarding the car, the market today goes from the purchase (i.e., with transfer of ownership) to the temporary rent that was once daily or in any case of a few days, and today offers a great temporal variety from a few hours to several years. The modification of the ownership structure has started important processes of sharing the same vehicle.
These advances have implied the possibility of integrating the various systems and means. Today, the most advanced synthesis is MaaS, as seen in the focal papers recalled in the introduction for Helsinki [6], Sydney [7] and for Italy [8]. Various definitions have been given of MaaS [30] and various experiments are underway. The minimalist interpretation defines MaaS as an app. The most advanced interpretation defines MaaS as the integration of different modes of transport; MaaS differs from the basic modes precisely because of the direct relationship it has with the user. As in intermodality for freight, the user no longer sees the individual transport operator. MaaS is increasingly becoming such a profound integration that it is perceived as a new alternative, as observed in freight with intermodality.
MaaS must evolve from the current situation, which sees it as a field of application for the integration of different ICT technologies in the transport system, to a new situation. In the new situation, MaaS actively participates and with its own defined physiognomy in the transport system, posing as a new alternative for the user [9,12].
The study of transport systems has led to the definition of a fundamental core of equations, called the Transportation System Model (TSM), which are used both for system planning and to carry out local supply control such as at traffic lights.
To evolve MaaS, it is necessary to define theoretical advances that explicitly insert the emerging ICT in the TSM. This evolution allows us to both plan MaaS, and to manage information flows in real time. An overall picture of the supply [11] and demand [10] models that are used in MaaS is present in the literature. This type of advancement allows the public decision maker to obtain with MaaS strong changes in the modal percentages of the basic systems, in line with Agenda 2030. The public decision maker must consider the impacts that MaaS has on the evolution of the urban structure [13], allowing an advance in TOD (Transit Oriented Development) strategies, and in the Sustainable Urban Mobility Plan perspective [31,32].
In the following paragraph, a model of integration of ICT in the TSM is presented, which allows the public decision maker to implement policies appropriate to the pursuit of the objectives.
3.2. ICT and TSM Integration
3.2.1. Emerging ICT
The current attention in the development of MaaS is given to the inclusion of emerging ICT technologies to organize the supply that, as mentioned, can go from a simple fares integration to a new alternative.
The theme concerns the perception of the user and, therefore, his evaluations and his choices.
For the integration between ICT and TSM, some ICT technologies are considered here which, although mature on an industrial level, can be considered emerging with regard to their application in transport systems, in particular, for urban-scale travel.
Internet of Things (IoT): allows the exchange of data between objects. One of the first formulations is given in [33,34], then three evolutionary phases, defined as generations, can be identified [35], each characterized by three elements: key enabling technologies; main reference architectural solutions; and functions related to the evolution of stakeholders and objects.
Big data (BD): allows the management of large amounts of data in real time. The set of data and the tools to manage it are defined in literature big data [36]. Recently, the most advanced study proposes approaches to handling huge, unstructured numbers of data sources previously building internal structures [37].
Blockchain (BC): allows all transactions in value or sensitive data between decision makers; in this sense, it is also called the Internet of value. BC is adopted to support the implementation of the IoT [38], because IoT technology is being impeded by some issues, such as data privacy and security issues, that BC solves [39].
Artificial intelligence (AI): allows decisions to be made between sets of alternatives; it is useful to recall the two main decision-making approaches: according to whether the basic information comes from a single homogeneous set and arrives at a single decision, or comes from several sets and provides different decisions [40]. Multiple developments have been released for AI; one of the most important fields of study, close to that of transport decisions, is that of online purchases [41,42].
These technologies are sometimes flanked by others such as the Digital Twin, but their evolution for integration into TSM and for a valid contribution to their development is still marginal. The technologies recalled are used with different degrees of penetration in various transport sectors, mainly in ports [43,44] and in urban systems [45] considering passengers [46,47] and freight [48].
3.2.2. TSM Dynamic Processes: Supply
Within the TSM, the formulation currently used in the study of transport systems is the static formulation of supply, demand and supply–demand interaction models [49]. Equilibrium models allow the study of the relevant state of the system in the various planning time scenarios [50].
In the case under study, considering the evolution of the system in real time, it is necessary to switch to other classes of models that allow us to follow the evolution of the system in subsequent periods. A class of models that allows us to follow the evolution of the system is given by dynamic process models. Dynamic process models, seen as generalizations of equilibrium models, can have configurations in which they stop their evolution. These models can, therefore, perform the dual function of: supporting the real-time choices made by the user and system decision makers; and support the choices of planners in the definition of tactical and operational choices.
The formulations used for the equilibrium model should be extended here to consider the changes that take place in the system.
As for the supply model, it is useful to switch to a diachronic network formulation [51,52]. The network is defined by means of a diachronic graph Ω, which is composed of three different subgraphs:
- A demand subgraph Ωd, in which each node represents a temporal centroid, therefore capable of generating/attracting demand from/to the defined place and time; in which each node, as in the service subgraph, other than the spatial coordinates, also has a time coordinate
- A subgraph of access/egress Ωae that allows the connection of the subgraph of the demand with that of the service, in which the service available continuously are considered.
For each type of arc belonging to each subgraph, adequate cost functions are specified in the literature [54,55].
The path cost gk is generally given by the sum of:
- gkADD the link additive cost, and
- gkNA the non-additive cost
obtaining:
or in matrix form considering all the paths:
where:
gk = gkADD + gkNA = Σa δak × ca + gkNA
g = Δ′ × c + gNA
- g is the path cost vector, whose elements are the costs of paths gk;
- gNA is the non-additive path cost vector;
- c is the link cost vector, whose elements are the costs of links ca;
- Δ is the link–path incidence matrix relative to graph Ω, whose elements are the δak, where δak = 1 if the link a belongs to path k and δak = 0 otherwise; the matrix must contain all the paths that can be generated in the considered time period.
Considering the generic instant τ of day t, it is possible to rewrite (1) highlighting its temporal evolution:
g[τ, t] = Δ′ × c[τ, t] + gNA[τ,t]
It should be noted that, in the literature, different expressions are used to highlight the structure of the dynamic process in relation to the evolution that is considered: between states or between times. In general, in the case of a temporal process, the variable that defines the point where the process is located is “t”, and is placed as a superscript, as a subscript or inside square brackets []. In this paper, the expression in square brackets is preferred, because it allows us to highlight the different temporal processes to which the system is subject at the same time.
The changes to specify a dynamic process model concern two aspects, which require the specification of appropriate models:
- Utility update model, i.e., how the user updates his perception of the utilities of the different alternatives, considering his current and previous knowledge and the information that ICT makes available to him;
- Choice update model; that is, how the choices made in the previous days and in the previous instants can affect the choices that the user must make in the generic instant of the generic day.
3.2.3. TSM Dynamic Processes: Updating Utilities
The update model of the utilities of the generic path k, vk[t], for the generic day t expresses the relationship between the utility vk[t − 1] of the generic path k evaluated in the previous day (t − 1) and the cost experienced in the day (t − 1)
vk[t] = v(vk[t − 1], gk[t − 1])
Extending to all paths k, of all origin–destination pairs od:
where:
v[t] = v(v[t − 1], g[t − 1]) ∨ k, ∨ od
v is the path utility vector, whose elements are the utility of paths vk.
A formulation often used for updating the utility is that of the exponential filter [48]. With this formulation, there is a convex combination of estimated utility and cost detected in the previous day:
where:
vk[t] = (1 − β) × vk[t − 1] + β × gk[t − 1]
β ∈ (0,1), is the weight attributed by users to the costs that occurred on day t − 1; if β = 1, the expected cost coincides with the costs that occurred on day t − 1 and, therefore, the costs of the previous days do not intervene in the specification of day t.
The availability of emerging technologies allows us to greatly expand the user’s knowledge about what happened the day before on the whole network. So, if you use a filter of the type indicated in Equation (4), knowledge is expanded to what happened in all paths and not only in the one experienced in t − 1. Due to the expansion of knowledge at the cost of all paths, by means of BD, the value to be used for β is particularly important.
Indicating with gkBD[t − 1] the information relating to the sum of all costs on the path k and with vkBD[t − 1] the information on the utilities, it is obtained:
vkBD[t] = (1 − β) × vkBD[t − 1] + β • gkBD[t − 1]
Equation (5) can be registered for all routes available to the couple od as:
vodBD[t] = (1 − β) × vodBD[t − 1] + β × godBD[t − 1] ∨ od
This is similar to (3), with only the explication that the path utility vectors refer to all od pairs.
Note that the formulation of (6) implies an important modification in the subsequent model of choice. In fact, (6), due to the use for all users of the information relating to the costs in the previous day, allows the formalization of the path choice model with all the available alternatives known. This is important in the study of transition sequences. The hypothesis implicitly made in equilibrium models is that the user knows on average all the costs of all paths and, therefore, is able, at equilibrium, to choose with a deterministic or stochastic model, but while always knowing the costs of all the available alternatives. This hypothesis is particularly burdensome if the study of the process concerns precisely the updating of utilities and the updating of choices.
Extending to all origin–destination pairs od and, therefore, to all users, the Formula (6), the model expressed by (3), can finally be specified as:
vBD[t] = (1 − β) × vBD[t − 1] + β × gBD[t − 1]
Emerging technologies, therefore, allow the sharing of knowledge about what happened, detected and stored in the previous days. Other technologies allow us to know what is happening in links of the network different from the one on which the generic user is passing.
The IoT of different classes and types allows the user to have information at the generic time τ on what happens in the other arcs. It is possible to hypothesize a further process of actualization of the utilities in which, at any moment τ, the user can update the utility related to the path he is using and those of the others not used, but on which he could deviate using the information produced and transmitted over time τ − 1.
For the generic path k it can be written:
vk[τ] = v(vk[τ − 1], gk[τ − 1])
The nature of the two parts of (8) is now changed by the presence of emerging technologies that support a strong expansion of knowledge. The first part of the equation, vk[τ − 1], is updated with the use of BD on the basis of what has been seen before; that is, the information received in the previous days t and in the previous moments τ. The second part, gk([τ − 1], is updated with the use of IoT. Considering the daily and instantaneous knowledge and the different sources of information BD and IoT, (8) can be written as:
vk[t, τ] = v(vkBD[t, τ − 1], gkIoT[t, τ − 1])
Equation (9) can be rewritten in various forms, in relation to the type of BD and IoT available in real cases. The formulation depends on BD’s ability to process IoT-derived information in the previous moments, as assumed in (9).
At the current state of technology, it can be assumed that BD can process the data of the day before as in (7) and that this data can be filtered with those coming from the IoT. In this case, (9) can be explained [56,57] as:
where:
vk[t, τ] = (1 − ξ) × vkBD[τ − 1] + ξ × gkIoT[τ − 1]
ξ ∈ (0,1), is the weight attributed by users to the costs that occurred at the instant τ − 1; if ξ = 1, the expected cost coincides with the costs that occurred at instant τ − 1; therefore, the costs of the previous instants and previous days do not intervene in the specification of instant τ and day t. On the contrary, low values of ξ determine a greater propensity of the user to keep the previously estimated utility stable and to be little influenced by the updates that the system provides for utility.
Extending to all k paths of all pairs od and, therefore, to all users, the Formula (10), the final model, at the current state of technology, can be specified as:
v[t, τ] = (1 − ξ) × vBD[τ − 1, t − 1] + ξ × gIoT[τ − 1, t − 1]
Equation (11) allows us to update the utility at the time τ of the day t, based on the information obtained, stored and processed by the various ICT technologies available.
3.2.4. TSM Dynamic Processes: Updating Choice
The other update process to be explained is the one that concerns the user’s choices and the ways in which the user considers those made previously.
It is not immediate to use the most common models of choice that are based on random utility [58] or advanced models of the sentiment [59] and quantum [60,61] typology. This would imply a correlation between the random residuals of the t days and the previous moments.
The scientific literature has proposed several models to study the updating of choices in the field of dynamic models. Among the models for choice updating are those useful for the model that is formulated in this paper: models that originate in the sociological field that study the sequences of behaviors and that have had a notable statistical study [62,63]; as well as theoretical models developed in the context of the evolution of the general theory of TSM [49,64].
In the sequential approach, a transition frequency matrix [62,65,66] of events is defined in which the element fij quantifies the frequency with which event i is followed by event j. Similarly, the frequency with which event i, occurring in the time interval t − 2, is followed by an event j, in the interval t, is constructed. The number of intervals considered between event i and event j is called lag. One can construct the frequency of the generic lag relative to the frequency with which the event i, occurring in t − lag, is followed by the event j to the instant t.
From the frequency transition matrix, calculated for the generic lag, it is possible to derive the matrix of the transition probability, of equal lag, by calculating the value of the generic probability ij, pij[lag] as the ratio between the frequency in ij and the sum of the frequencies of i.
The hypothesis that a phenomenon can have a dynamic behavior such as the one mentioned above must be verified with experimental elements. To this end, different tests have been developed that allow us to investigate the nature of the phenomenon within the sample examined. In order to know the validity of resorting to some of the past events to reduce uncertainty about future ones, this study forms the core of sequential analysis [62,63,67,68]. The main tests are three:
- Significance, evaluates the significance of the hypothesis of lag 1 sequences;
- Stationary, evaluate if the sequence is the same regardless of the start time;
- Homogeneity, assess whether the sequential data is identical among all the subjects considered.
The hypotheses posed introduces:
hk[θ]: the flow on the path k at time θ, where θ is the combination of generic t and τ;
h[θ]: the path flow vector at time θ,
and given that S[θ − lag] is the matrix of transition probabilities for generic θ and lag, it can be written:
h[θ] = S[θ − lag] × h[θ − lag]
Formula (12) can be specified in various forms; following [54], different specifications can be reached in relation to the hypotheses that are made:
- On the behavior of the user in redoing the choice at the time [θ] (switching choice behavior): this behavior is formalized with the probability of reconsidering the choice of the previous day that can be dependent or independent of the alternative chosen to the previous time [θ − lag];
- On the behavior of the user in deciding which alternative to choose at the time [θ] (path choice behavior): this behavior is formalized with the probability of choosing an alternative to the time [θ] for users who have reconsidered the choice, which can be dependent or independent of the alternative chosen at the previous time [θ − lag].
The combination of behaviors involves specifying three models:
- Independent–independent: it is the simplest model. It allows the use of known formulations for the equilibrium model;
- Independent–dependent: it is a more complex model. For the first choice, one can assume that independence is for all the chosen alternatives and for all times;
- Dependent–dependent: is the model that allows the evaluation of dynamic changes in the choices.
The hypotheses on the combination of behaviors, therefore, allow the specification of the matrix S[θ − lag], as a combination of two matrices, on which it is considered that the process is of specific lag, independently from θ:
- W[lag]: switching choice matrix defined by the probability of reconsidering the choice of the previous time [θ − lag];
- R[lag]: path choice matrix, defined by the probability of choosing an alternative to time θ dependent on the chosen path to time [θ − lag].
The S[θ − lag], therefore, depends on the utility of the users updated according to the model previously presented and expressed by (10).
Recalling that [θ] = [t, τ], considering the formulation of g given in (2), inserted in (12), and the Equation (9) extended to the generic lag in general, the equation process can be written as:
h[θ] = S[θ − lag] (vBD[θ − lag], gIoT[θ − lag]) × h[θ − lag]
v[ϑ] = v(vBD[θ − lag], gkIoT[θ − lag])
Note that the expression in θ allows us to consider even more advanced technologies than those available today, allowing the updating of both the v and the g, in the time t and τ.
In the event that the utility is updated according to the model expressed by (10), and lag is considered only on t, it can be written:
h[t, τ] = S[t − lag, τ] (vBD[t − lag, τ], gIoT[t − lag, τ]) • h [t − lag, τ ]
v[t, τ] = v(vBD[t − lag, τ], gkIoT[t − lag, τ])
Formulas (14a,b) is the one that, at present, allows us to study the overall functioning of the MaaS system, with the specification of time in relation to the evolutionary state of the technologies available in the single specific realization.
The proposed formulation allows us to consider the components of BC starting from the relationship (2) by internalizing in the link costs the transactions mandatory for the user. In the same way, the development of BD, in relation to the internalization of IoT for each τ, must be treated through AI.
The relation (14a,b) is used both to simulate the evolution of the system and to search for the convergence towards stationary conditions of the dynamic process. Under different hypotheses related to the dynamic process, this can be interpreted as deterministic or stochastic. By adequately specifying Equations (14a,b), convergence exists [49,64,65].
4. Models for Policy
4.1. Classification of Measures
The convergence solution makes it possible to study the indicators to which MaaS wants to contribute: both those that directly affect the goals and those that indirectly affect them. The possibility of having a model that estimates the results of the introduction of MaaS allows us to analyze and design classes of measures. The project follows the scheme of “what if”. It is necessary to introduce a classification of the policy measures that can be implemented, and to verify the use of the model in relation to the different classes of measures. The proposed model allows us to analyze the modifications related to Goals 11 and 3, because it allows us to know the uses of the basic means that make up MaaS, and allows us to know the modal modification between the different modal alternatives in the presence of MaaS.
- Material infrastructures: new infrastructures to optimize MaaS (from the enhancement of particular segments of public transport, to the parking areas for the different classes of vehicles: owned or shared); they must be prepared by the public administration or by the managers of transport services; usually, they are interventions of strategic scale;
- Non-material infrastructures: teaching, training and research infrastructures; ICT interventions of the various types described above are usually included in this class, both because they are directly linked to training and research active in a territory, and because they have times of obsolescence similar to those of research; they must be prepared by the competent public bodies, have a strategic perspective if we consider structural investments, and they must have a tactical perspective on the achievable results; in this sense, they are those most directly related to MaaS, and require the use of adequate models, such as the one presented in the previous paragraph, unlike the models designed to study the changes in the material infrastructures;
- Vehicles or more general equipment: new generation vehicles both for private transport (also shared) and for local public transport; the modifications in the vehicles have a strategic character and range from the constraints required for the environmental and safety components to the optimality introduced to make the vehicle connected and autonomous;
- Governance: consisting of actions relating to regulations and traffic limits for cars (e.g., time windows for access to different areas, limited traffic zones for different categories of vehicles, access for shared vehicles, etc.) and optimization procedures for public services.
In addition to the individual measures for the categories mentioned, there are cross-cutting measures, such as those relating to cooperation between different types of vehicles involving non-material measures and governance measures.
4.2. Spatial Economic Models and Environmental Impact Functions
The model described in Section 3 allows us to evaluate the interventions of the various categories by estimating the indicators relating to some goals.
The same model is a decisive part of a more complex model system to be used to evaluate indicators compared to other goals.
The most complex systems to consider, which are recalled here in an extremely synthetic way, referring to the specific literature, are:
- Spatial economic models (SEM);
- Environmental impact functions (EIF).
SEM model systems arise from the study of the relationships between economic space and transport systems. One of the main directions of research is the one relative to Space Economic Transport Interactions (SETI). In these models, the economic space determines the conditions of transport demand; the transport system determines the spatial and economic organization in terms of location [49,70,71,72,73].
These relationships are described in the literature by the SETI models, which are compactly expressed by:
where:
x = T(v) × A × x + T × y
- x is the production vector;
- T is the trade coefficients matrix;
- v is the transport utilities vector;
- y is the final demand vector;
- A is the technical coefficients matrix.
The analysis of the (15) relationship, without the need for further specification, allows us to highlight the central role that the TSM has in spatial interactions.
Following the approach of [74], SETI models are classifiable, in relation to the spatial scale in which they are used, into models:
- NETI (interaction of national economic transport): estimate the competitiveness of the different activities, through the interactions between localized levels of production and consumption and transport infrastructures and services;
- LUTI (Land Use Transport Interaction): estimate the competitiveness of residential locations and urban-scale activities by means of the interactions between these locations and the transport system.
In relation to the study of MaaS in their current spatial configuration, the models to be used are those of the LUTI class, developed starting from the Lowry model [75].
The environmental impacts to be considered are both those suffered by users, but which do not affect mobility choices, and those on non-users of the system. Functions that relate physical and functional parameters of the transport system to flows are called impact functions, and are often referred to by the specific impact they measure. They are specified for each link of the network, and take the form:
where:
e* = e(f, λ) = e(Δ × h, λ)
- e* is the impact value vector;
- e is the impact function vector;
- f is the link flows vector;
- h is the path flows vector;
- Δ is the link–path incidence matrix;
- λ is the set of physical and functional parameters.
A particularly important research field is that of the calibration of λ parameters. For the general formulation with a specific state of the art, see [49,69]—among the most recent works, see [76]. The analysis of the Equation (16), as already seen for (15), immediately highlights the decisive role that the TSM has in the study of the environmental impacts produced by transport.
4.3. Policy to Sustainable Goals
The measures defined in Section 4.1 intervene in the pursuit of the goals and are measurable with the modification of the national indicators. Reference is made to the indicators used by Italy reported in Table 1, Table 2 and Table 3.
Public policies can push MaaS to become an instrument for relaunching the systems that make up local public transport. MaaS can play an important role in increasing the accessibility of various areas of the city, using for the last mile smart modes such as feet and bikes, and can be decisive in changing the modal choice, reducing the use of private cars.
With the proposed modeling framework, it is possible to build a SMaaS, which is aimed at sustainability, using a “what if” approach.
In line with what is presented in [12], the following are data: the observed values of the indicators and the set of resources; rules and regulations available to develop adequate policies other than the socio-economic and land use information; and transport infrastructures with flows and performances (Figure 4). If the policy results meet the required level of indicators, the process ends. If they are not satisfied, the ex ante values that can be obtained with the policies are evaluated through TSM, SEM and EIF. The cycle repeats until the resulting indicator values meet the required levels.
With infrastructure resources unaltered and with the same current means, the policies that support the pursuit of Goals 11 and 3 (Table 1) are pursued with classes of measures transversal to governance and non-material infrastructure. Typical examples of interventions are [77,78,79]:
- Traffic management and control systems: network of traffic lights with coordinated fixed planes, plan selection, implemented by traffic, adaptive, parking addressing;
- Systems for the management of fleets of public transport vehicles: planning system, integrated electronic ticketing system, information system for public transport users;
- Systems for access and demand management: access control to the limited traffic zone, access and zone-30 control, cordon pricing/congestion pricing, electronic tolling.
These interventions have an impact on the indicators of Table 1, modifying their quantitative values, which can be evaluated ex ante through the TSM.
MaaS has the possibility to indirectly affect other goals. For example, economic and social goals (Table 2) can be affected by the use of new vehicles and infrastructures.
Goal 8 is the one mainly aimed at economic impact. In this case, the main category of interventions is that concerning the increase in accessibility. Using territorial economic evaluation models, it is possible to estimate the increase in consumption and GDP of the areas less connected at present. In this case, both the strengthening of collective transport infrastructures at a fixed route and the increase in vehicles serving the less-connected areas make it possible to improve the level of the indicator.
Goal 9 covers sustainable industrial development and resilient infrastructure. The category of interventions most affected is obviously that of physical infrastructures. MaaS has an indirect relationship with the indicators. Furthermore, in this case, the proposed theoretical model allows us to study the impacts on modal changes and the importance of specific policies for the development of subway networks. The evolution of MaaS from a mainly urban alternative to an alternative for regional and national travel, increasingly involves MaaS in the pursuit of this objective.
Goal 10 is mainly about social impact and pays particular attention to countries lagging behind in development, and lagging areas in developed countries. The goal has no specific indicators calculated Target 10.3, which is of direct interest to MaaS. The Gini coefficient for Target 10.4 is indicated, although the assessment of this coefficient is not yet defined in the national indicators. However, the same criterion introduced for goal 8 can be used. In this case, attention is given to the accessibility of urban areas whose development is lagging behind. MaaS can make a considerable contribution, because it allows the individual to use a valid and economical alternative of movement without having to commit a considerable capital to the purchase of his own car. In this case, the categories concerned are that of the purchase of vehicles and that of infrastructure.
MaaS has the possibility to indirectly affect Goals 7 and 13 (Table 3), which are the most markedly environmental.
The impact on Goal 7 takes place directly with the modification of the vehicle fleet, moving to vehicles powered by energy from renewable sources, then interventions related to the “vehicles” category. There is also an indirect impact that results from modal change. Collective transport in a reserved route is, in fact, the readiest way to use energy from renewable sources, precisely because it is usually powered by a fixed electricity grid. In this case, the upgrading of collective transport systems at a fixed route is crucial.
Goal 13 concerns the environmental impact on the climate and, in particular, greenhouse gases. This is also an indirect objective. MaaS can allow the use of means of collective transport with low emission of pollutants; other specific policies can address vehicles that are used in a shared form, which must have low emission of pollutants.
From the synthetic analysis carried out, it emerges that the TSM modeling tools are central to the evaluation of all the indicators envisaged by Agenda 2030 and aimed at mobility. It also emerges that SEM models and EIF functions, jointly with TSM, are decisive downstream of TSMs, to evaluate different groups of indicators.
In Figure 5, a summary of the formal results obtained is proposed. On the left side, the four main classes of interventions are identified, while on the right side are the goals, identified by a number and a keyword, which the MaaS systems can affect. In the central part, the three groups of models that allow you to design in a “what if” way are reported.
The arcs indicate how the categories of intervention must be inserted in the different models; that is, how the outputs of the interventions are the elements that the models transform into: outcomes and goals. The proposed process is “what if”, so if the level of indicators obtained for the different goals with the proposed interventions is considered optimal, the process stops; otherwise, you have to return to the interventions, proceed to a new design and restart the process.
5. Discussion and Conclusions
The results obtained are of considerable interest to evolve MaaS towards sustainability, that is, towards an SMaaS.
The current focus in the development of MaaS systems is on hard and soft technological tools and on the commercial component seen by service providers. MaaS has developed in various forms, but an evolutionary main axis is identified that follows from the simple bundle of Helsinki [6,14], to the complex bundle of Sydney [7,17], to the Italian shared intermediate layer [8,19]. In the face of this remarkable advancement that took place in a few years on a technological level, there has been no advancement in the study of the new role of the user within the MaaS and, specifically, of the dynamic components of behaviors within MaaS. The dynamic components are crucial both for the current management of MaaS and, therefore, for the best use by the user, and for the planning of all transport services connected with MaaS, in order to pursue the objectives of Agenda 2030.
The formulation proposed in this note is located downstream of the literature on TSM, equilibrium conditions and dynamic process conditions. The contribution of the work is to explicitly include in the dynamic formulation of the TSM the components relating to the emerging technologies that qualify the current generation of MaaS.
By carrying out a comparative analysis between the models presented in similar studies carried out on the evolution of MaaS and the one proposed, some main results emerge:
- The introduction of information derived or processed by new technologies in the behavioral models of users;
- The formalization of a supply model that considers both scheduled services and those available continuously;
- The formalization of an updated utility model;
- The formalization of an updated choice model.
The formulation proposed in Section 3 allows us to know the conditions of progress of the overall system at each moment, considering both what happened in the identical moments of the previous days and in the previous moments of the same day.
The same formulation allows us to study the convergence towards stationary conditions. These solutions are those that can be used in the context of SMaaS planning in the different planning horizons.
From the proposed work, different lines of research can be highlighted. The first concerns the theoretical aspects: the study of specific cases for which it is possible to determine stationary conditions must be developed, and the general conditions of convergence of SET models in the presence of MaaS must be developed. A second group of research directions concerns the calibration of specific models for updating choices, both with regard to switching choice and path choice. In this context, both the different distributions of residuals and the levels of independence considered in the S(lag) matrix must be investigated. The third group of research directions is connected with further advances in technologies. It is a matter of specifying the utility update model in relation to advances in the management of BDs and, therefore, the possibility of rewriting the (10) relationship, based on the speed of response of the BDs to the insertion of data obtained through IoT in time (t, τ − lag). This direction appears promising because it would allow dynamic processes to be traced back to the use of a single time variable subjected to two different lags.
The work presented can be useful to technical planners and technical managers, allowing them to explicitly consider the different technologies introduced into MaaS. The work can also be useful to researchers because it allows them to direct study towards dynamic conditions that consider, in addition to the dynamics characteristic of the transport system, the dynamics generated in demand, supply and their interaction by the presence of emerging technologies.
Funding
This research is partially supported by DIIES—Università di Reggio Calabria and by the project “La Mobilità per i passeggeri come Servizio–MyPasS”, Fondi PON R&I 2014–2020 e FSC, Progetti di Ricerca PNR 2015–2020, codice identificativo ARS01_01100.
Data Availability Statement
Not applicable.
Acknowledgments
The author would like to thank all researchers of the transport group at DIIES, for the long and deep discussions; evidently, any errors are by the author. In this, the author feels intimately in agreement with Popper’s approach, according to which a theory has a scientific character only when it is susceptible to being disproved by the facts. The author also wishes to thank the reviewers both for the careful analysis of the proposed formulations and for the strong request to anchor each crucial step in the comparison with the most advanced international scientific literature.
Conflicts of Interest
The author declares no conflict of interest.
References
- European Environment Agency 2022. Available online: https://www.eea.europa.eu/data-and-maps/daviz/trends-in-passenger-transport-demand-7#tab-chart_1 (accessed on 20 July 2022).
- Eurostat 2022. Available online: https://ec.europa.eu/eurostat/databrowser/view/ENV_AIR_GGE__custom_3040396/default/table?lang=en (accessed on 9 July 2022).
- FOEN. Impacts of the Mobility on the Environment; Federal Office for the Environment: Ittigen, Switzerland, 2018. Available online: https://www.bafu.admin.ch/bafu/en/home/topics/nutrition-housing-mobility/mobility/impacts.html (accessed on 9 July 2022).
- Brundtland Report. Available online: https://sustainabledevelopment.un.org/content/documents/5987our-common-future.pdf (accessed on 9 July 2022).
- UN. United Nations: Transforming Our World the 2030 Agenda for Sustainable Development. Available online: https://sustainabledevelopment.un.org/post2015/transformingourworld/publication (accessed on 11 June 2022).
- CoH—City of Helsinki. Helsinki Intelligent Transport System Development Programme 2030. Developing Traffic Information, New Mobility Services and Automation; Urban Environment Division: Helsinki, Finland, 2019; Available online: https://www.hel.fi/static/liitteet/kaupunkiymparisto/julkaisut/julkaisut/julkaisu-16-19-en.pdf (accessed on 9 July 2022).
- Hensher, D.A.; Ho, C.Q.; Reck, D.J. Mobility as a service and private car use: Evidence from the Sydney Ma9aS trial. Transp. Res. Part A 2021, 145, 17–33. [Google Scholar] [CrossRef]
- MITD. Ministro per l’Innovazione Tecnologica e la Transizione Digitale. Mobility as a Service; Indirizzi per l’attuazione del progetto: “MaaS for Italy”, 2022. Roma. Available online: https://assets.innovazione.gov.it/1652949192-indirizzi-per-l-attuazione-del-progetto-maas-for-italy-1.pdf. (accessed on 9 July 2022).
- Musolino, G.; Rindone, C.; Vitetta, A. Models for Supporting Mobility as a Service (MaaS) Design. Smart Cities 2022, 5, 206–222. [Google Scholar] [CrossRef]
- Rindone, C. Sustainable Mobility as a Service: Supply analysis and case studies. Information 2022, 13, 351. [Google Scholar] [CrossRef]
- Musolino, G. Sustainable Mobility as a Service: Demand analysis and case studies. Information, 2022; under review. [Google Scholar]
- Vitetta, A. Sustainable Mobility as a Service: Framework and Transport System Models. Information 2022, 13, 346. [Google Scholar] [CrossRef]
- Panuccio, P. Sustainable Mobility as a Service: Smart city and planning. Information, 2022; under review. [Google Scholar]
- MG—MaaS Global. Whim, 2022. Available online: https://whimapp.com/maas-global/ (accessed on 9 June 2022).
- Matyas, M.; Kamargianni, M. Survey design for exploring demand for Mobility as a Service plans. Transportation 2019, 46, 1525–1558. [Google Scholar] [CrossRef] [Green Version]
- Guidon, S.; Wicki, M.; Bernauer, T.; Axhausen, K. Transportation service bundling—For whose benefit? Consumer valuation of pure bundling in the passenger transportation market. Transp. Res. Part A Policy Pract. 2020, 131, 91–106. [Google Scholar] [CrossRef]
- Ho, C.Q.; Hensher, D.A.; Reck, D.J.; Lorimer, S.; Lu, I. MaaS bundle design and implementation: Lessons from the Sydney MaaS trial. Transp. Res. Part A Policy Pract. 2021, 149, 339–376. [Google Scholar] [CrossRef]
- TTS Italia. Linee Guida per lo Sviluppo dei Servizi MaaS in Italia, 2021. Available online: https://www.ttsitalia.it/wp-content/uploads/2021/07/Linee-guida-per-lo-sviluppo-dei-servizi-MaaS-in-Italia_web.pdf (accessed on 22 June 2022).
- UITP. Policy Brief MaaS, 2019. Available online: https://cms.uitp.org/wp/wp-content/uploads/2020/07/Policy-Brief_MaaS_V3_final_web_0.pdf (accessed on 10 June 2022).
- UN—United Nations. Global Indicator Framework for the Sustainable Development Goals and Targets of the 2030 Agenda for Sustainable Development; Off Doc Syst United Nations; United Nations: New York, NY, USA, 2018; pp. 1–21. [Google Scholar]
- Available online: https://www.istat.it/it/benessere-e-sostenibilit%C3%A0/obiettivi-di-sviluppo-sostenibile/gli-indicatori-istat (accessed on 10 July 2022).
- Russo, F. Which High-Speed Rail? LARG Approach between Plan and Design. Future Transp. 2021, 1, 202–226. [Google Scholar] [CrossRef]
- Russo, F.; Rindone, C. Regional Transport Plans: From Direction Role Denied to Common Rules Identified. Sustainability 2021, 13, 9052. [Google Scholar] [CrossRef]
- Fondazione Caracciolo. Per una Transizione Ecorazionale della Mobilità Automobilistica Italiana; ACI: Roma, Italy, 2021; Available online: https://fondazionecaracciolo.aci.it//app/uploads/2022/05/Per_una_transizione_ecorazionale_della_mobilita_automobilistica_italiana_2021.pdf (accessed on 15 June 2022).
- Comi, A.; Rossolov, A.; Polimeni, A.; Nuzzolo, A. Private Car OD Flow Estimation Based on Automated Vehicle Monitoring Data: Theoretical Issues and Empirical Evidence. Information 2021, 12, 493. [Google Scholar] [CrossRef]
- Croce, A.I.; Musolino, G.; Rindone, C.; Vitetta, A. Traffic and energy consumption modelling of electric vehicles: Parameter updating from floating and probe vehicle data. Energies 2022, 15, 82. [Google Scholar] [CrossRef]
- UE. Direttiva 2010/40 del Parlamento Europeo e de Consiglio del 7 Luglio 2010. 2010. Gazzetta Ufficiale dell’Unione Europea. 6 August 2010. Available online: https://eur-lex.europa.eu/LexUriServ/LexUriServ.do?uri=OJ:L:2010:207:0001:0013:it:PDF. (accessed on 15 June 2022).
- Schroten, A.; Van Grinsven, A.; Tol, E.; Leestemaker, L.; Schackmann, P.P.M.; Vonk Noordegraaf, D.M.; van Meijeren, J.; Kalisvaart, S. The Impact of Emerging Technologies on the Transport System, Study Requested by the TRAN Committee; European Parlament: Bruxelles, Belgium, 2020; Available online: https://repository.tudelft.nl/islandora/object/uuid:b379c1c3-85e6-4986-9387-21a57fe76b86 (accessed on 15 June 2022).
- Pezzillo Iacono, M.; Martinez, M.; Mangia, G.; Canonico, P.; Nito, E.D. Coping with power of control: The role of IS in an Italian integrated tariff system. In Organizational Change and Information Systems; Springer: Berlin/Heidelberg, Germany, 2013; pp. 313–325. [Google Scholar]
- Hensher, D.A.; Mulley, C.; Ho, C.; Nelson, J.; Smith, G.; Wong, Y. Understanding Mobility as a Service (MaaS)—Past, Present and Future; Elsevier: Amsterdam, The Netherlands, 2020; p. 204. ISBN 9780128200445. [Google Scholar]
- Panuccio, P. Smart Planning: From City to Territorial System. Sustainability 2019, 11, 7184. [Google Scholar] [CrossRef] [Green Version]
- Cirianni, F.; Monterosso, C.; Panuccio, P.; Rindone, C. A Review Methodology of Sustainable Urban Mobility Plans: Objectives and Actions to Promote Cycling and Pedestrian Mobility. In Proceedings of the International Conference on Smart and Sustainable Planning for Cities and Regions, Bolzano, Italy, 22–24 March 2020. [Google Scholar]
- Atzori, L.; Iera, A.; Morabito, G. The Internet of Things: A survey. Comput. Netw. 2010, 54, 2787–2805. [Google Scholar] [CrossRef]
- Tran-Dang, H.; Kim, D.-S. An Information Framework for Internet of Things Services in Physical Internet. IEEE Access 2018, 6, 43967–43977. [Google Scholar] [CrossRef]
- Atzori, L.; Iera, A.; Morabito, G. Understanding the Internet of Things: Definition, potentials, and societal role of a fast evolving paradigm. Ad Hoc Netw. 2017, 56, 122–140. [Google Scholar] [CrossRef]
- Zhu, L.; Yu, F.R.; Wang, Y.; Ning, B.; Tang, T. Big Data Analytics in Intelligent Transportation Systems: A Survey. IEEE Trans. Intell. Transp. Syst. 2019, 20, 383–398. [Google Scholar] [CrossRef]
- Cauteruccio, F.; Giudice, P.L.; Musarella, L.; Terracina, G.; Ursino, D.; Virgili, L. A lightweight approach to extract interschema properties from structured, semi-structured and unstructured sources in a big data scenario. Int. J. Inf. Technol. Decis. Mak. 2020, 19, 849–889. [Google Scholar] [CrossRef]
- Buccafurri, F.; Lax, G.; Nicolazzo, S.; Nocera, A. Overcoming limits of blockchain for IoT applications. ACM Int. Conf. Proc. Ser. Part F 2017, 26, 1–6. [Google Scholar]
- Lax, G.; Russo, A.; Fascì, L.S. A Blockchain-based approach for matching desired and real privacy settings of social network users. Inf. Sci. 2021, 557, 220–235. [Google Scholar] [CrossRef]
- Veres, M.; Moussa, M. Deep Learning for Intelligent Transportation Systems: A Survey of Emerging Trends. IEEE Trans. Intell. Transp. Syst. 2020, 21, 3152–3168. [Google Scholar] [CrossRef]
- Abduljabbar, A.; Dia, H.; Liyanage, S.; Bagloee, S.A. Applications of Artificial Intelligence in Transport: An Overview. Sustainability 2019, 11, 189. [Google Scholar] [CrossRef] [Green Version]
- Bakach, I.; Campbell, A.M.; Ehmke, J.F. Robot-Based Last-Mile Deliveries With Pedestrian Zones. Front. Futur. Transp. 2022. [Google Scholar] [CrossRef]
- Russo, F.; Musolino, G. The role of emerging ICT in the ports: Increasing utilities according to shared decisions. Front. Futur. Transp. 2021, 2, 722812. [Google Scholar] [CrossRef]
- Russo, F.; Musolino, G. Emerging ICT in port operations: Case studies. In Trends in Maritime Technology and Engineering, 1st ed.; Guedes Soares, C., Santos, T.A., Eds.; Taylor and Francis CRC Press: Boca Raton, FL, USA, 2022; Volume 2. [Google Scholar]
- RTC. The Impact of Emerging Technologies on the Transport System; Research for Tran Committee, Policy Department for Structural and Cohesion Policies, Directorate-General for Internal Policies: Brussels, Belgium, 2020. [Google Scholar]
- Nikitas, A.; Michalakopoulou, K.; Njoya, E.T.; Karampatzakis, D. Artificial Intelligence, Transport and the Smart City: Definitions and Dimensions of a New Mobility Era. Sustainability 2020, 12, 2789. [Google Scholar] [CrossRef] [Green Version]
- Battaglia, G.; Musolino, G.; Vitetta, A. Freight Demand Distribution in a Suburban Area: Calibration of an Acquisition Model with Floating Car Data. J. Adv. Transp. 2022, 2022, 1535090. [Google Scholar] [CrossRef]
- Comi, A.; Russo, F. Emerging Information and Communications Technologies: The Challenges for the Dynamic Freight Management in City Logistics. Front. Futur. Transp. 2022. [Google Scholar] [CrossRef]
- Cascetta, E. Transportation Systems Engineering: Theory and Methods, 1st ed.; Springer Science & Business Media: Berlin/Heidelberg, Germany, 2013; Volume 49. [Google Scholar]
- Cascetta, E.; Russo, F.; Vitetta, A. Stochastic user equilibrium assignment with explicit path enumeration: Comparison of models and algorithms. IFAC Proc. Vol. 1997, 30, 1031–1037. [Google Scholar] [CrossRef]
- Nuzzolo, A.; Russo, F.; Crisalli, U. Transit Network Modelling: The Schedule-Based Dynamic Approach; Franco Angeli: Milan, Italy, 2003. [Google Scholar]
- Nuzzolo, A.; Comi, A. Dynamic optimal travel strategies in intelligent stochastic transit networks. Information 2021, 12, 281. [Google Scholar] [CrossRef]
- Nuzzolo, A.; Russo, F. Departure time and path choice models for intercity transit assignment. In Travel Behaviour Research: Updating the State of Play; Jara-Diaz, S., Ortuzar, J.D., Hensher, D.A., Eds.; Elesevier: Amsterdam, The Netherlands, 1998. [Google Scholar]
- Russo, F. Schedule-based dynamic assignment models for public transport networks. In Schedule-Based Dynamic Transit. Modeling: Theory and Applications; Wilson, N.H.M., Nuzzolo, A., Eds.; Springer: Boston, MA, USA, 2004; Volume 28, pp. 79–93. [Google Scholar]
- Birgillito, G.; Rindone, C.; Vitetta, A. Passenger mobility in a discontinuous space: Modelling Access/Egress to maritime barrier in a case study. J. Adv. Transp. 2018, 2018, 6518329. [Google Scholar] [CrossRef]
- Russo, F.; Comi, A. Sustainable urban delivery: The learning process of path costs enhanced by information and communication technologies. Sustainability 2021, 13, 13103. [Google Scholar] [CrossRef]
- Russo, F.; Comi, A. Providing dynamic route advice for urban goods vehicles: The learning process enhanced by the emerging technologies. Transp. Res. Procedia 2022, 62, 632–639. [Google Scholar] [CrossRef]
- Ben-Akiva, M.E.; Lerman, S.R. Discrete Choice Analysis: Theory and Application to Travel Demand; MIT Press: Cambridge, MA, USA, 1985; Volume 9. [Google Scholar]
- Vitetta, A. Sentiment analysis models with bayesian approach: A bike preference application in metropolitan cities. J. Adv. Transp. 2022, 2022, 2499282. [Google Scholar] [CrossRef]
- Di Gangi, M.; Vitetta, A. Specification and Aggregate Calibration of a Quantum Route Choice Model from Traffic Counts. In New Trends in Emerging Complex Real Life Problems; Springer: Berlin/Heidelberg, Germany, 2018; pp. 227–235. [Google Scholar]
- Di Gangi, M.; Vitetta, A. Quantum utility and random utility model for path choice modelling: Specification and aggregate calibration from traffic counts. J. Choice Model. 2021, 40, 100290. [Google Scholar] [CrossRef]
- Gottman, J.M.; Roy, K.A. Sequential Analysis; Cambridge University Press: New York, NY, USA, 1990. [Google Scholar]
- Bakeman, R.; Gottman, J.M. Observing Interaction. An Introduction to Sequential Analysis; Cambridge University Press: New York, NY, USA, 1997. [Google Scholar]
- Cantarella, G.E.; Cascetta, E. Dynamic processes and equilibrium in transportation networks: Towards a unifying theory. Transp. Sci. 1995, 29, 305–329. [Google Scholar] [CrossRef]
- Cantarella, G.E.; Velonà, P. Assegnazione a Reti di Trasporto: Modelli di Processo Deterministico, 1st ed.; Franco Angeli: Roma, Italy, 2019; pp. 1–209. [Google Scholar]
- Cantarella, G.E.; Watling, D.; de Luca, S.; Di Pace, R. Dynamics and Stochasticity in Transportation Systems, Tools for Transportation Network Modelling, 1st ed.; Elsevier: Amsterdam, The Netherlands, 2019. [Google Scholar]
- Russo, F.; Chilà, G. Dynamic approaches to demand model in evacuation conditions. In Proceedings of the Urban. Transport XVI, Urban Transport and the Environment in the 21st Century, Limassol, Cyprus, 5–7 May 2010; Brebbia, C.A., Ed.; WIT Press: Southampton, UK, 2010; pp. 303–312. [Google Scholar]
- Russo, F.; Chilà, G. A sequential dynamic choice model to simulate demand in evacuation conditions. In WIT Transactions on Information and Communication Technologies; WIT Press: Southampton, UK, 2010; Volume 43, pp. 431–442. [Google Scholar]
- Russo, F.; Comi, A. Urban Freight Transport Planning towards Green Goals: Synthetic Environmental Evidence from Tested Results. Sustainability 2016, 8, 381. [Google Scholar] [CrossRef] [Green Version]
- Chenery, H.B. Regional analysis. In The Structure and Growth of the Italian Economy; Chenery, H.B., Clark, P., Cao-Pinna, V., Eds.; Greenwood Press: Westport, Fairfield County, CT, USA, 1953; pp. 97–116. [Google Scholar]
- Moses, L.N. The stability of interregional trading patterns and input-output analysis. Am. Econ. Rev. 1955, 45, 803–832. [Google Scholar]
- Leontief, W. The Structure of American Economy, 2nd ed.; Oxford University Press: New York, NY, USA, 1941. [Google Scholar]
- Leontief, W.; Strout, A. Multi-Regional Input—Output Analysis. In Structural Interdependence and Economic Development; Barna, T., Ed.; McMillan: London, UK, 1963; pp. 119–150. [Google Scholar]
- Russo, F.; Musolino, G. A unifying modelling framework to simulate the Spatial Economic Transport Interaction process at urban and national scales. J. Transp. Geogr. 2012, 24, 189–197. [Google Scholar] [CrossRef]
- Lowry, I.S. A Model of Metropolis; Report RM 4125-RC; Rand: Santa Monica, LA, USA, 1964. [Google Scholar]
- Terrada, L.; Khaïli, M.E.; Ouajji, H.; Daaif, A. Smart Urban Traffic for Green Supply Chain Management. In Proceedings of the 2020 IEEE 2nd International Conference on Electronics, Control, Optimization and Computer Science (ICECOCS), Kenitra, Morocco, 2–3 December 2020; pp. 1–6. [Google Scholar] [CrossRef]
- TTS Italia. L’Impatto Degli ITS per la Riduzione del CO2; TTS Italia: Roma, Italy, 2010; Available online: https://www.ttsitalia.it/wp-content/uploads/2010/07/ITS%20per%20CO2_Finale_DEF.pdf (accessed on 15 June 2022).
- Fondazione Caracciolo. Mobitaly as a Service: Mobilità Condivisa Nelle Grandi Città Italiane; ACI: Roma, Italy, 2020; Volume I, Available online: https://fondazionecaracciolo.aci.it//app/uploads/2022/05/MOBITALY_AS_A_SERVICE_Volume-I.pdf (accessed on 22 June 2022).
- Fondazione Caracciolo. Mobitaly as a Service: Mobilità Condivisa Nelle Grandi Città Italiane; ACI: Roma, Italy, 2020; Volume II, Available online: https://fondazionecaracciolo.aci.it//app/uploads/2022/05/MOBITALY_AS_A_SERVICE_Volume_II.pdf (accessed on 22 June 2022).
Figure 1.
Goals of Agenda 2030 [5].
Figure 1.
Goals of Agenda 2030 [5].

Figure 2.
Numerical structure of Agenda 2030.

Figure 3.
Diachronic network of service subgraph Ωs.

Figure 4.
SMaaS—Sustainable policies and goals.

Figure 5.
Policy interventions to Agenda 2030 Goals, through TSM, SET, EIF.


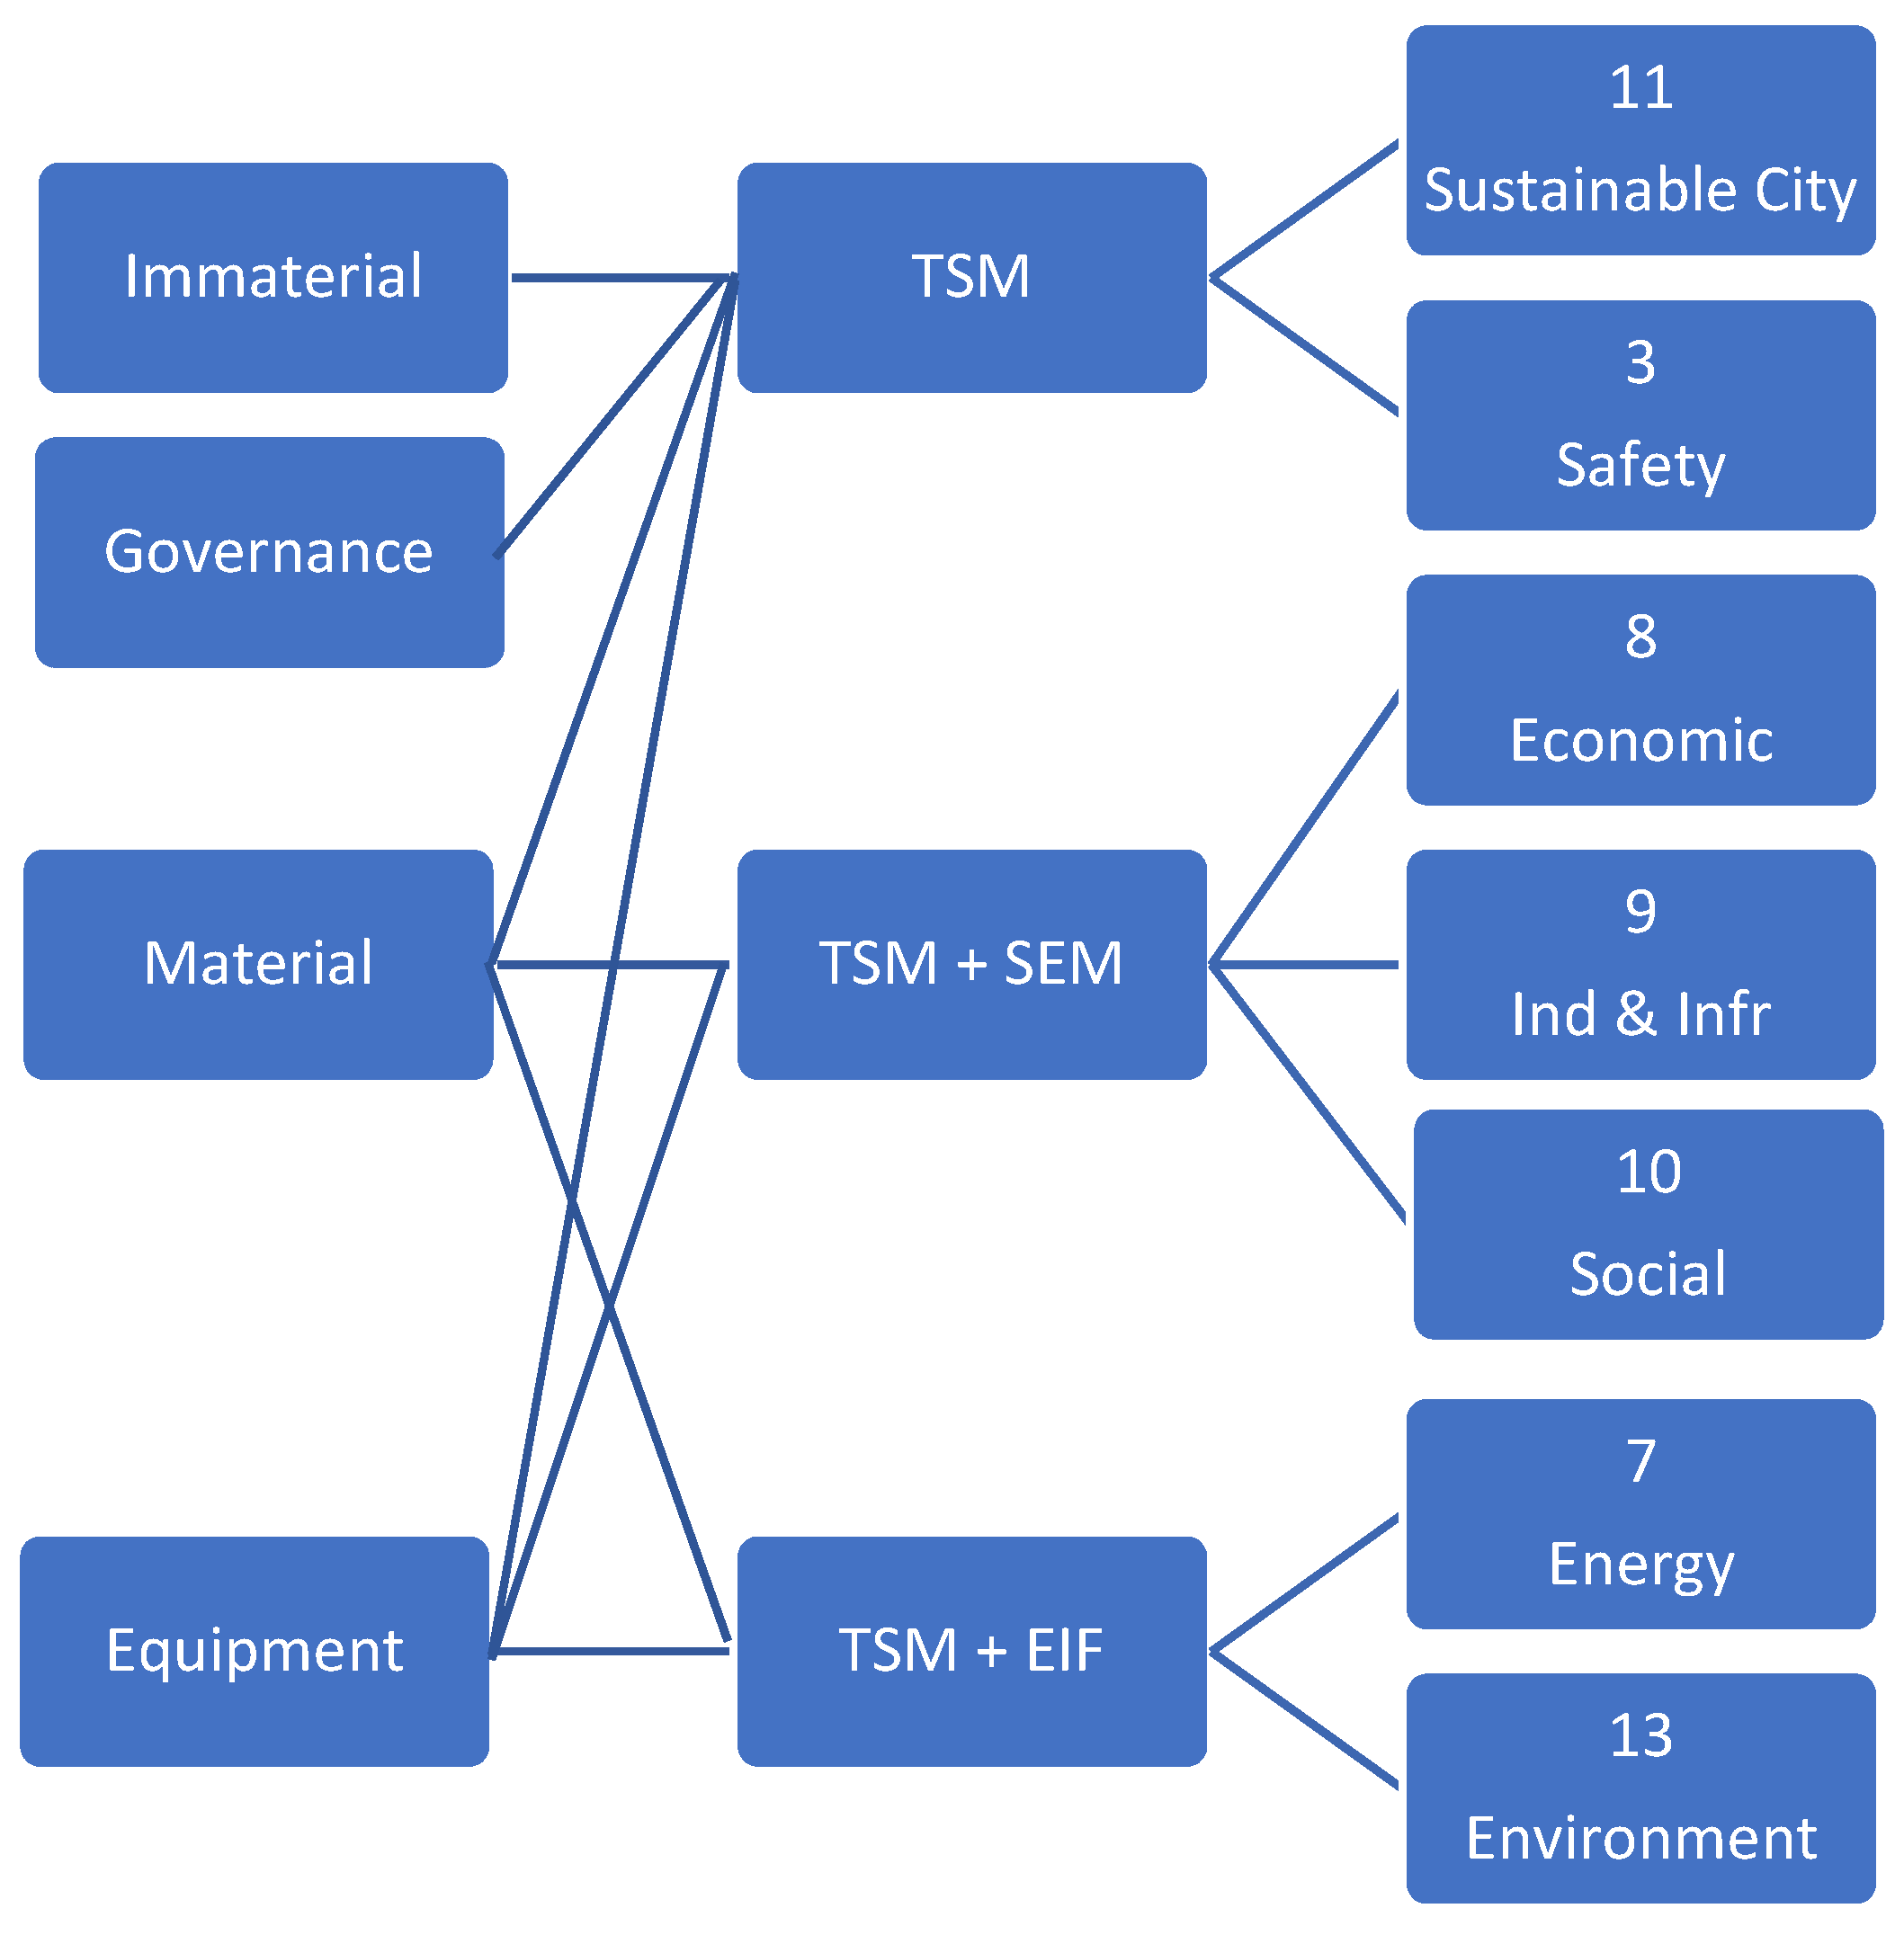
Table 1.
Agenda 2030 direct indicators to mobility.
| Goal | Target | Indicator | National Attribute |
|---|---|---|---|
| 11. Make cities and human settlements inclusive, safe, resilient and sustainable | 11.2. By 2030, provide access to safe, affordable, accessible and sustainable transport systems for all, improving road safety, notably by expanding public transport, with special attention to the needs of those in vulnerable situations, women, children, persons with disabilities and older persons | 11.2.1. Proportion of population that has convenient access to public transport, by sex, age and persons with disabilities | Families who declare difficulties in connecting with public transport in the area in which they reside Students who usually travel to reach the place of study only by public transport People who habitually travel to reach the workplace only by private means Seats-km offered by public transport Frequent users of public transport |
| 3. Ensure healthy lives and promote well-being for all at all ages | 3.6. By 2020, halve the number of global deaths and injuries from road traffic accidents | 3.6.1. Death rate due to road traffic injuries | Road fatality rate Number of deaths in road accidents Serious injuriousness rate in road accidents |
Table 2.
Agenda 2030 indirect indicators to mobility (economic and social).
| Goal | Target | Indicator | National Attribute |
|---|---|---|---|
| 8. Promote sustained, inclusive and sustainable economic growth, full and productive employment and decent work for all | 8.4. Improve progressively, through 2030, global resource efficiency in consumption and production and endeavor to decouple economic growth from environmental degradation, in accordance with the 10-year framework of programs on sustainable consumption and production, with developed countries taking the lead | 8.4.1. Material footprint, material footprint per capita, and material footprint per GDP 8.4.2. Domestic material consumption, domestic material consumption per capita, and domestic material consumption per GDP | Domestic material consumption per capita Domestic material consumption per unit of GDP Domestic material consumption |
| 9. Build resilient infrastructure, promote inclusive and sustainable industrialization and foster innovation | 9.1. Develop quality, reliable, sustainable and resilient infrastructure, including regional and transborder infrastructure, to support economic development and human well-being, with a focus on affordable and equitable access for all | 9.1.2. Passenger and freight volumes, by mode of transport | Transported volumes of passengers Transported volumes of goods Kilometers of railway network per 10,000 inhabitants Kilometers of railway network per 10,000 hectares High-speed networks on the total rail networks Double- or multiple-track rail networks on total rail networks Electrified rail networks on total rail networks |
| 10. Reduce inequality within and among countries | 10.3. Ensure equal opportunity and reduce inequalities of outcome, including by eliminating discriminatory laws, policies and practices and promoting appropriate legislation, policies and action in this regard | ___ | ___ |
| 10.4. Adopt policies, especially fiscal, wage and social protection policies, and progressively achieve greater equality | 10.4.2. Redistributive impact of fiscal policy (The Gini coefficient will be reported as a second series in the database, as it is a component of this indicator) | ___ |
Table 3.
Agenda 2030 indirect indicators to mobility (environmental).
| Goal | Target | Indicator | National Attribute |
|---|---|---|---|
| 7. Ensure access to affordable, reliable, sustainable and modern energy for all | 7.2. By 2030, increase substantially the share of renewable energy in the global energy mix | 7.2.1. Renewable energy share in the total final energy consumption | Share of energy from renewable sources in gross final energy consumption Consumption of energy from renewable sources (excluding transport sector) as a percentage of gross final energy consumption Consumption of energy from renewable sources in the thermal sector (as a percentage of gross final energy consumption) Electricity from renewable sources Consumption of energy from renewable sources in the transport sector (as a percentage of gross final energy consumption) |
| 7.3. By 2030, double the global rate of improvement in energy efficiency | 7.3.1. Energy intensity measured in terms of primary energy and GDP | Energy intensity Energy intensity of the Industry sector | |
| 13. Take urgent action to combat climate change and its impacts | 13.2. Integrate climate change measures into national policies, strategies and planning | 13.2.2. Total greenhouse gas emissions per year | Total greenhouse gases according to the National Emission Inventory Balance between total greenhouse gas emissions due to transport activities carried out in the Rest of the World by residents and in Italy by non-residents Total greenhouse gases according to national air emission accounts Emissions of CO2 and other climate-altering gases |
Publisher’s Note: MDPI stays neutral with regard to jurisdictional claims in published maps and institutional affiliations. |
© 2022 by the author. Licensee MDPI, Basel, Switzerland. This article is an open access article distributed under the terms and conditions of the Creative Commons Attribution (CC BY) license (https://creativecommons.org/licenses/by/4.0/).
Share and Cite
MDPI and ACS Style
Russo, F. Sustainable Mobility as a Service: Dynamic Models for Agenda 2030 Policies. Information 2022, 13, 355. https://doi.org/10.3390/info13080355
AMA Style
Russo F. Sustainable Mobility as a Service: Dynamic Models for Agenda 2030 Policies. Information. 2022; 13(8):355. https://doi.org/10.3390/info13080355
Chicago/Turabian StyleRusso, Francesco. 2022. "Sustainable Mobility as a Service: Dynamic Models for Agenda 2030 Policies" Information 13, no. 8: 355. https://doi.org/10.3390/info13080355
Note that from the first issue of 2016, this journal uses article numbers instead of page numbers. See further details here.