
Sustainable Mobility as a Service: Demand Analysis and Case Studies


Dipartimento di Ingegneria dell’Informazione, delle Infrastrutture e dell’Energia Sostenibile, Università degli Studi Mediterranea di Reggio Calabria, 89124 Reggio Calabria, Italy
Information 2022, 13(8), 376; https://doi.org/10.3390/info13080376
Submission received: 22 June 2022
/
Revised: 1 August 2022
/
Accepted: 2 August 2022
/
Published: 5 August 2022
(This article belongs to the Special Issue Emerging Research in Urban Computing and Intelligent Transport Systems)
Abstract
:Urban mobility is evolving today towards the concept of Mobility as a Service (MaaS). MaaS allows passengers to use different transport services as a single option, by using a digital platform. Therefore, according to the MaaS concept, the mobility needs of passengers are the central element of the transport service. The objective of this paper is to build an updated state-of-the-art of the main disaggregated and aggregated variables connected to travel demand in presence of MaaS. According to the above objective, this paper deals with methods and case studies to analyze passengers’ behaviour in the presence of MaaS. The methods described rely on the Transportation System Models (TSMs), in particular with the travel demand modelling component. The travel demand may be estimated by means of disaggregated, or sample, surveys (e.g., individual choices) and of aggregate surveys (e.g., characteristics of the area, traffic flows). The surveys are generally supported by Information Communication System (ICT) tools, such as: smartphones; smartcards; Global Position Systems (GPS); points of interest. The analysis of case studies allows to aggregate the existing scientific literature according to some criteria: the choice dimension of users (e.g., mode, bundle and path, or a combination of them); the characteristics of the survey (e.g., revealed preferences or stated preferences); the presence of behavioural theoretical background and of calibrated choice model(s).
1. Introduction
Passenger mobility plays an important and changing role in the economy and society. According to [1], four main tendency scenarios of passenger mobility, not mutually exclusive, may be identified due to the widespread diffusion of emerging technologies: individual point-to-point trips in personally owned connected and automated vehicles; shared and personal on-demand and mass transport modes with network optimization and integration; lifestyle based on mass transit, flexible and active transport; and travel reduction due to the diffusion of remote activities.
It is foreseen that the above scenarios will generate a disruption in the transport sector similar to that which occurred in the manufacturing sector, where technology has radically transformed the value-added profile of products and services [2]. The transformation of the transport ‘production’ is underway due to the progressive penetration of emerging technologies, in order to make transport services more efficient, by reducing the unit costs of transport supply; effective, by unlocking value and increasing utility of transport users; and sustainable, defined according to the three economic, social and environmental pillars. There is great potential to be unlocked in the transport value chain. In the ‘pre-production’ phase, the combination of (emerging) Information and Communication Technologies (ICT) and Decision Support Systems (DSSs) may increase the connections among communities by designing a more customer-centric transport network and services. The methodology presented in [3] supports the estimation of origin–destination flows through basic information extracted from floating car data. The study presented in [4] addresses the search for a run-based dynamic optimal travel strategy to be supplied through mobile devices (apps) to travelers. Some methods for the design of an integrated transport service system are presented in [5], with the aim of estimating the effects of decision-makers’ actions on MaaS. In the ‘post-production’ phase, ICT could enhance the transport experience of the users by providing rich, interactive and tailored information and services [1].
One of the main elements that could embody the above disruption process in transport is represented by MaaS, defined as [6]: “A framework for delivering a portfolio of multi-modal mobility services that places the user at the center of the offer. MaaS frameworks are ideally designed to achieve sustainable policy goals and objectives. MaaS is an integrated transport service brokered by an integrator through a digital platform.” The above definition characterizes the three main elements of MaaS: the design of customer-centered supply, the sustainable goals, and the (emerging) technology adoption. The study presented in [7] emphasizes the role of the Mobility-as-a-Service business model for urban transport development and sustainability. According to [8], an important role is played by public authorities, which should support the diffusion of MaaS through regulation reforms, technology developments and investments in trials. Among the existing methods, the one that generally supports the decision-making process inside the transport-planning activity is based on Transport System Models (TSMs) [9,10,11]. TSMs simulate a transport system through a process, in which transport supply and travel demand interact. TSMs are considered as the reference modelling framework for the design of sustainable transport services and for ex ante and ex post evaluations. The research presented in [12] aimed to investigate a transport system in cities in order to pursue sustainability goals, by modelling the traffic in the city’s transport network. The methodology proposed in [13] is based on four-stage modelling with trip-based travel-demand models.
In the sphere of TSMs, the travel demand models simulate user choices based on the performance of transport infrastructures and services such as MaaS. The goals of travel demand models are, among the others, the support of mobility management or demand management activities, in order to achieve sustainable objectives. Mobility management generally includes the adoptions of a set of measures aiming to alter the perception of travel alternatives by transport users. The decision to choose an alternative may be strengthened by means of three classes of demand management measures: information, strategies and incentives. Information may include campaigns about travel services and tariffs, about travel plans and feedback mechanisms. Strategies can assume the form of incentives for users that provide a reward for exhibiting desired travel behaviour, or disincentives to discourage undesirable travel behaviour. It is demonstrated ([14] and the references included) that the three classes are frequently used in combination as they can provide more effective results.
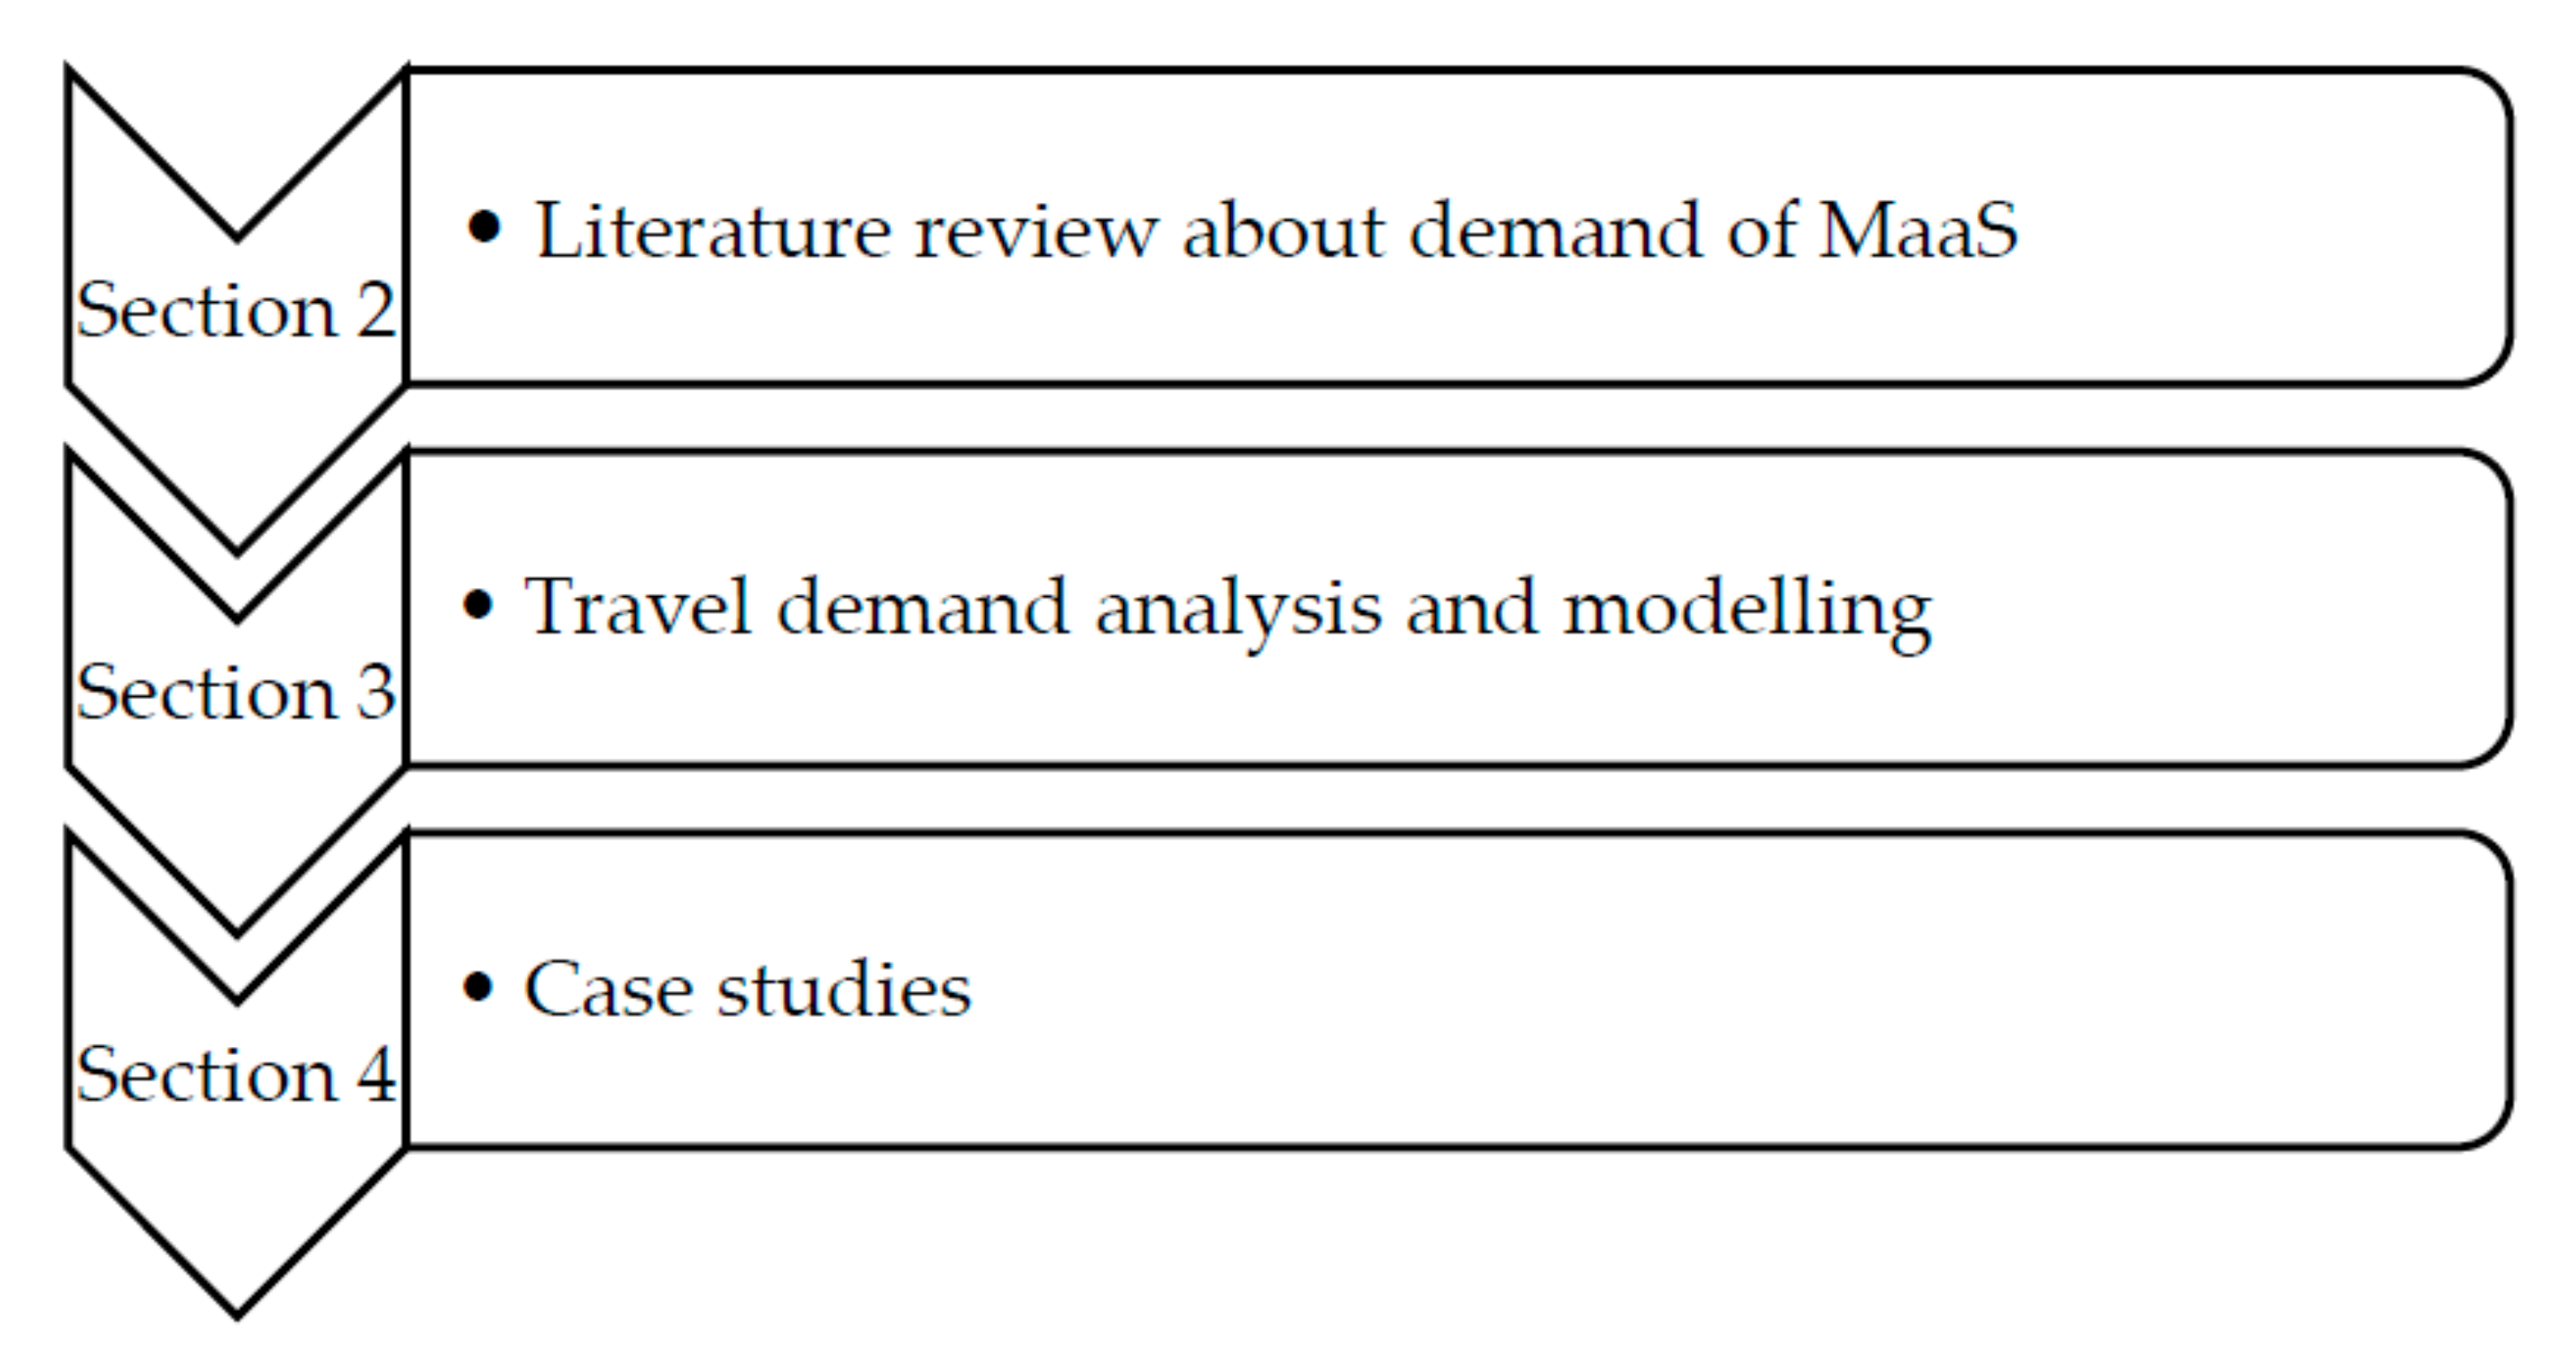
The objective of the paper is to build a state-of-the-art of methods for demand analysis through the description of the main case studies connected to the analysis of passengers’ travel choices in the presence of MaaS. According to the above objective, the remaining part of the paper is articulated in line with the steps of the research methodology adopted (Figure 1). The first step (Section 2) concerns the literature review about demand of MaaS, with a classification of studies existing in literature finalized to estimate the demand of MaaS. The second step (Section 3) deals with travel demand analysis and modelling, presenting the main models and methods that could support travel demand management in an MaaS environment. The third step (Section 4) reports some case studies about demand analysis in the presence of MaaS. The case studies have been identified among the selected studies of the literature review that present a more comprehensive travel demand analysis of MaaS. The last section reports the conclusions and the research perspectives.
The paper belongs to a chain of papers, describing a larger study, composed of the following papers. Vitetta [15] studies MaaS on behalf of sustainability objectives and goals to be achieved by means of methodologies adopted in the transport system engineering. Russo [16] introduces sustainability as defined by Agenda 2030 with respect to urban passenger transport, then examines the role of ICT in the development of MaaS formalizing a dynamic model of demand–supply interaction. Rindone [17] focuses on Maas in relation to the main components of transport supply (governance, immaterial, material, equipment) and on its role in the entire transport system. Panuccio [18] analyzed MaaS in the context of integration between a sustainable transport system and smart city and proposed a broader vision of urban planning in the context of the smart city, defined through the three pillars of the ICT, transport and energy.
2. Literature Review about Demand of MaaS
Several studies in literature are finalized to estimate the demand of MaaS. Without being exhaustive, some of them have been selected and classified according to the following criteria (see Table 1). The first criterion concerns the choice dimension of users: bundle mode-service and path, or a combination of them. The second regards the survey, which may be based on Revealed Preferences (RPs), or on Stated Preferences (SPs). The third concerns the development of a travel demand model(s), based on a behavioural theoretical background (e.g., Random Utility, RU) theory or the execution of a statistical sampling analysis. Some papers present calibrated models. The study area may be a city, such as London (UK) or Nanjing (China), a region (Cambridge, USA) or a whole country (Australia, The Netherland).Some insights about the acceptance of MaaS bundles among travelers inside the Grater London area were presented in [14,19]. The authors calibrated a first model to identify the preferred modes of travelers in their MaaS plans, according to socio-demographic and mobility characteristics. A second model was calibrated with only those travelers that were interested in purchasing their chosen MaaS plan. The survey included a stated preference (SP) experiment. Matyas [20], finally, identified potential ways that MaaS could support behavioural change, by understanding the barriers of using alternative transport modes for the travelers of the Greater London area. Xie et al. [21] proposed a modelling framework to quantify the impacts of real-time on-demand system’s on travelers’ behaviour, able to capture heterogeneity among travelers. The framework includes choice models of choice service subscription, of service access, of menu product choice. The methodology was developed in the Boston–Cambridge region (USA) in order to support the definition of incentives for the selection of more sustainable travel options. Data were collected through a smartphone-based stated preference survey. Alonso-González et al. [22] identified five groups of travelers in relation to their individual inclinations to adopt MaaS in the context of urban mobility. The group with the highest inclination to adopt future MaaS schemes (which is the largest) have multimodal weekly mobility patterns, while the group with the least availability is mainly comprised by unimodal car users. Feneri et al. [23] analyzed the willingness to change behaviour in terms of transportation mode, of travelers in the presence of MaaS. The authors calibrated an error components logit model simulating the mode choice within an MaaS bundle from a sample of observations of travelers’ choices in Rotterdam, Amsterdam, and Utrecht (the Netherlands). Reck et al. [24] systematically analyzed and compared design, methods and outcomes of studies on MaaS bundle design, and identified the main design dimensions of the MaaS bundle: modes, metrics, geography, reference market segment, subscription tine validity. The objectives of the paper of Vij et al. [25] are twofold: to explore the consumer preferences in relation to MaaS, with a particular emphasis on the Australian context; and to support the development of suitable MaaS systems for the Australian community. De Luca and Mascia [26] proposed a novel behavioural concept called hypermode, to simulate the decision process of travelers in the presence of MaaS. The hypermode, according to the authors, allows one to schematize the adaptive mode choice decision process in the presence of real-time events occurring during the trip, unpredictable before the departure, and then simulate the travelers’ adaptive behaviour. Some real-time factors were identified during a pilot study in the city of London. Song et al. [27] faced the whole day multimodal path planning problem considering user-specific modal preference in the presence of an MaaS platform. The dynamic mode choice behaviour and the set of feasible mode chains of travelers are estimated by means of a dynamic discrete choice model that accounts for unobservable heterogeneity. The proposed models were calibrated and verified by means of a household travel survey data of Nanjing (China). Kim et al. [28] analyzed the relationships between people’s lifestyles and their willingness to adopt MaaS schemes. The authors proposed a hierarchical latent variable and latent class models, where sample individuals were associated to one of the latent classes based upon their lifestyle, schematized via individual activity-travel patterns. The models were calibrated with data obtained during a stated choice and a lifestyle survey in the province of North Brabant (The Netherlands). Bushell et al. [29] explored travelers’ preferences in both intra-city and inter-city transport options, considering long distance transport components such as air services. The calibrated logit models showed that travelers seem to prefer door-to-door travel options resulting from operators’ collaboration, both for trips inside the city and for inter-city trips. The results suggest the definition of an advanced MaaS (2.0) to create better value for travelers inside a more extended transport eco-system. Vitetta et al. [30] presented a pilot survey for estimating the travelers’ choices in the presence of a (hypothetical) MaaS scheme operating in the Messina Strait (Italy). The study area, including the cities of Reggio Calabria and Messina, was characterized by the presence of land, sea and air transport modes; the presence of a barrier represented by the stretch of sea that separates the two cities (see details in [31]); the presence of different public and private operators of mobility infrastructures and services.
From the literature review, it emerges that several scientific studies about travel demand models have been proposed. However, there is the need to further develop them in order to support the quantitative estimations of MaaS on users’ choices. The goal is the assessment of the potential effects of a Sustainable MaaS (S-MaaS), in order to verify that sustainability goals are pursued. The role of travel demand models, as part of TSMs, is crucial for S-MaaS planning, as they drive the definition of demand management activities, through the three main classes of measures: information, strategy and incentives.
3. Travel Demand Analysis and Modelling
This section is articulated into three parts. The first part reports a brief introduction of Transport System Models (TSMs), which are commonly considered as the reference modelling framework that support the decision-making process of transport-planning activity. The second reports the basic characteristics of travel demand models for MaaS. The third presents the categories of surveys and of technological tools that support the data acquisition necessary for travel demand analysis.
3.1. Transport System Models (TSMs)
Transport System Models (TSMs) [9,10,11] simulate a transport system through a process, in which transport supply and travel demand interact. TSMs are comprised by the three modelling components (Figure 2).
The transport supply model simulates the costs (disutilities) of users deriving from the use of transport infrastructures and services. The most commonly used approach is the topological model, given by a network model, with links, nodes and cost functions (e.g., link macroscopic fundamental diagram, time–flow relationship).
The travel demand model simulates user choices based on the performance of infrastructure and services [32]. Travel demand models can be behavioural or non-behavioural. In the behavioural approach, demand models can be stochastic or deterministic according to whether the disutility associated with each user’s choice is a random variable or a deterministic variable.
The supply–demand interaction model allows for simulating the interaction between the user’s choices and the performance of the infrastructure and the service. The most common models are based on the topological-behavioural paradigm. They can be classified into [11]: static vs. dynamic and equilibrium vs. dynamic process. The models may be static or dynamic, depending on whether they simulate a transport system in stationary or in dynamic conditions. In the latter case, they capture the variations of travel demand flows and of supply capacity inside a reference time period. They may be based on equilibrium, such as User Equilibrium (UE) and System Optimum (SO) vs. dynamic process.
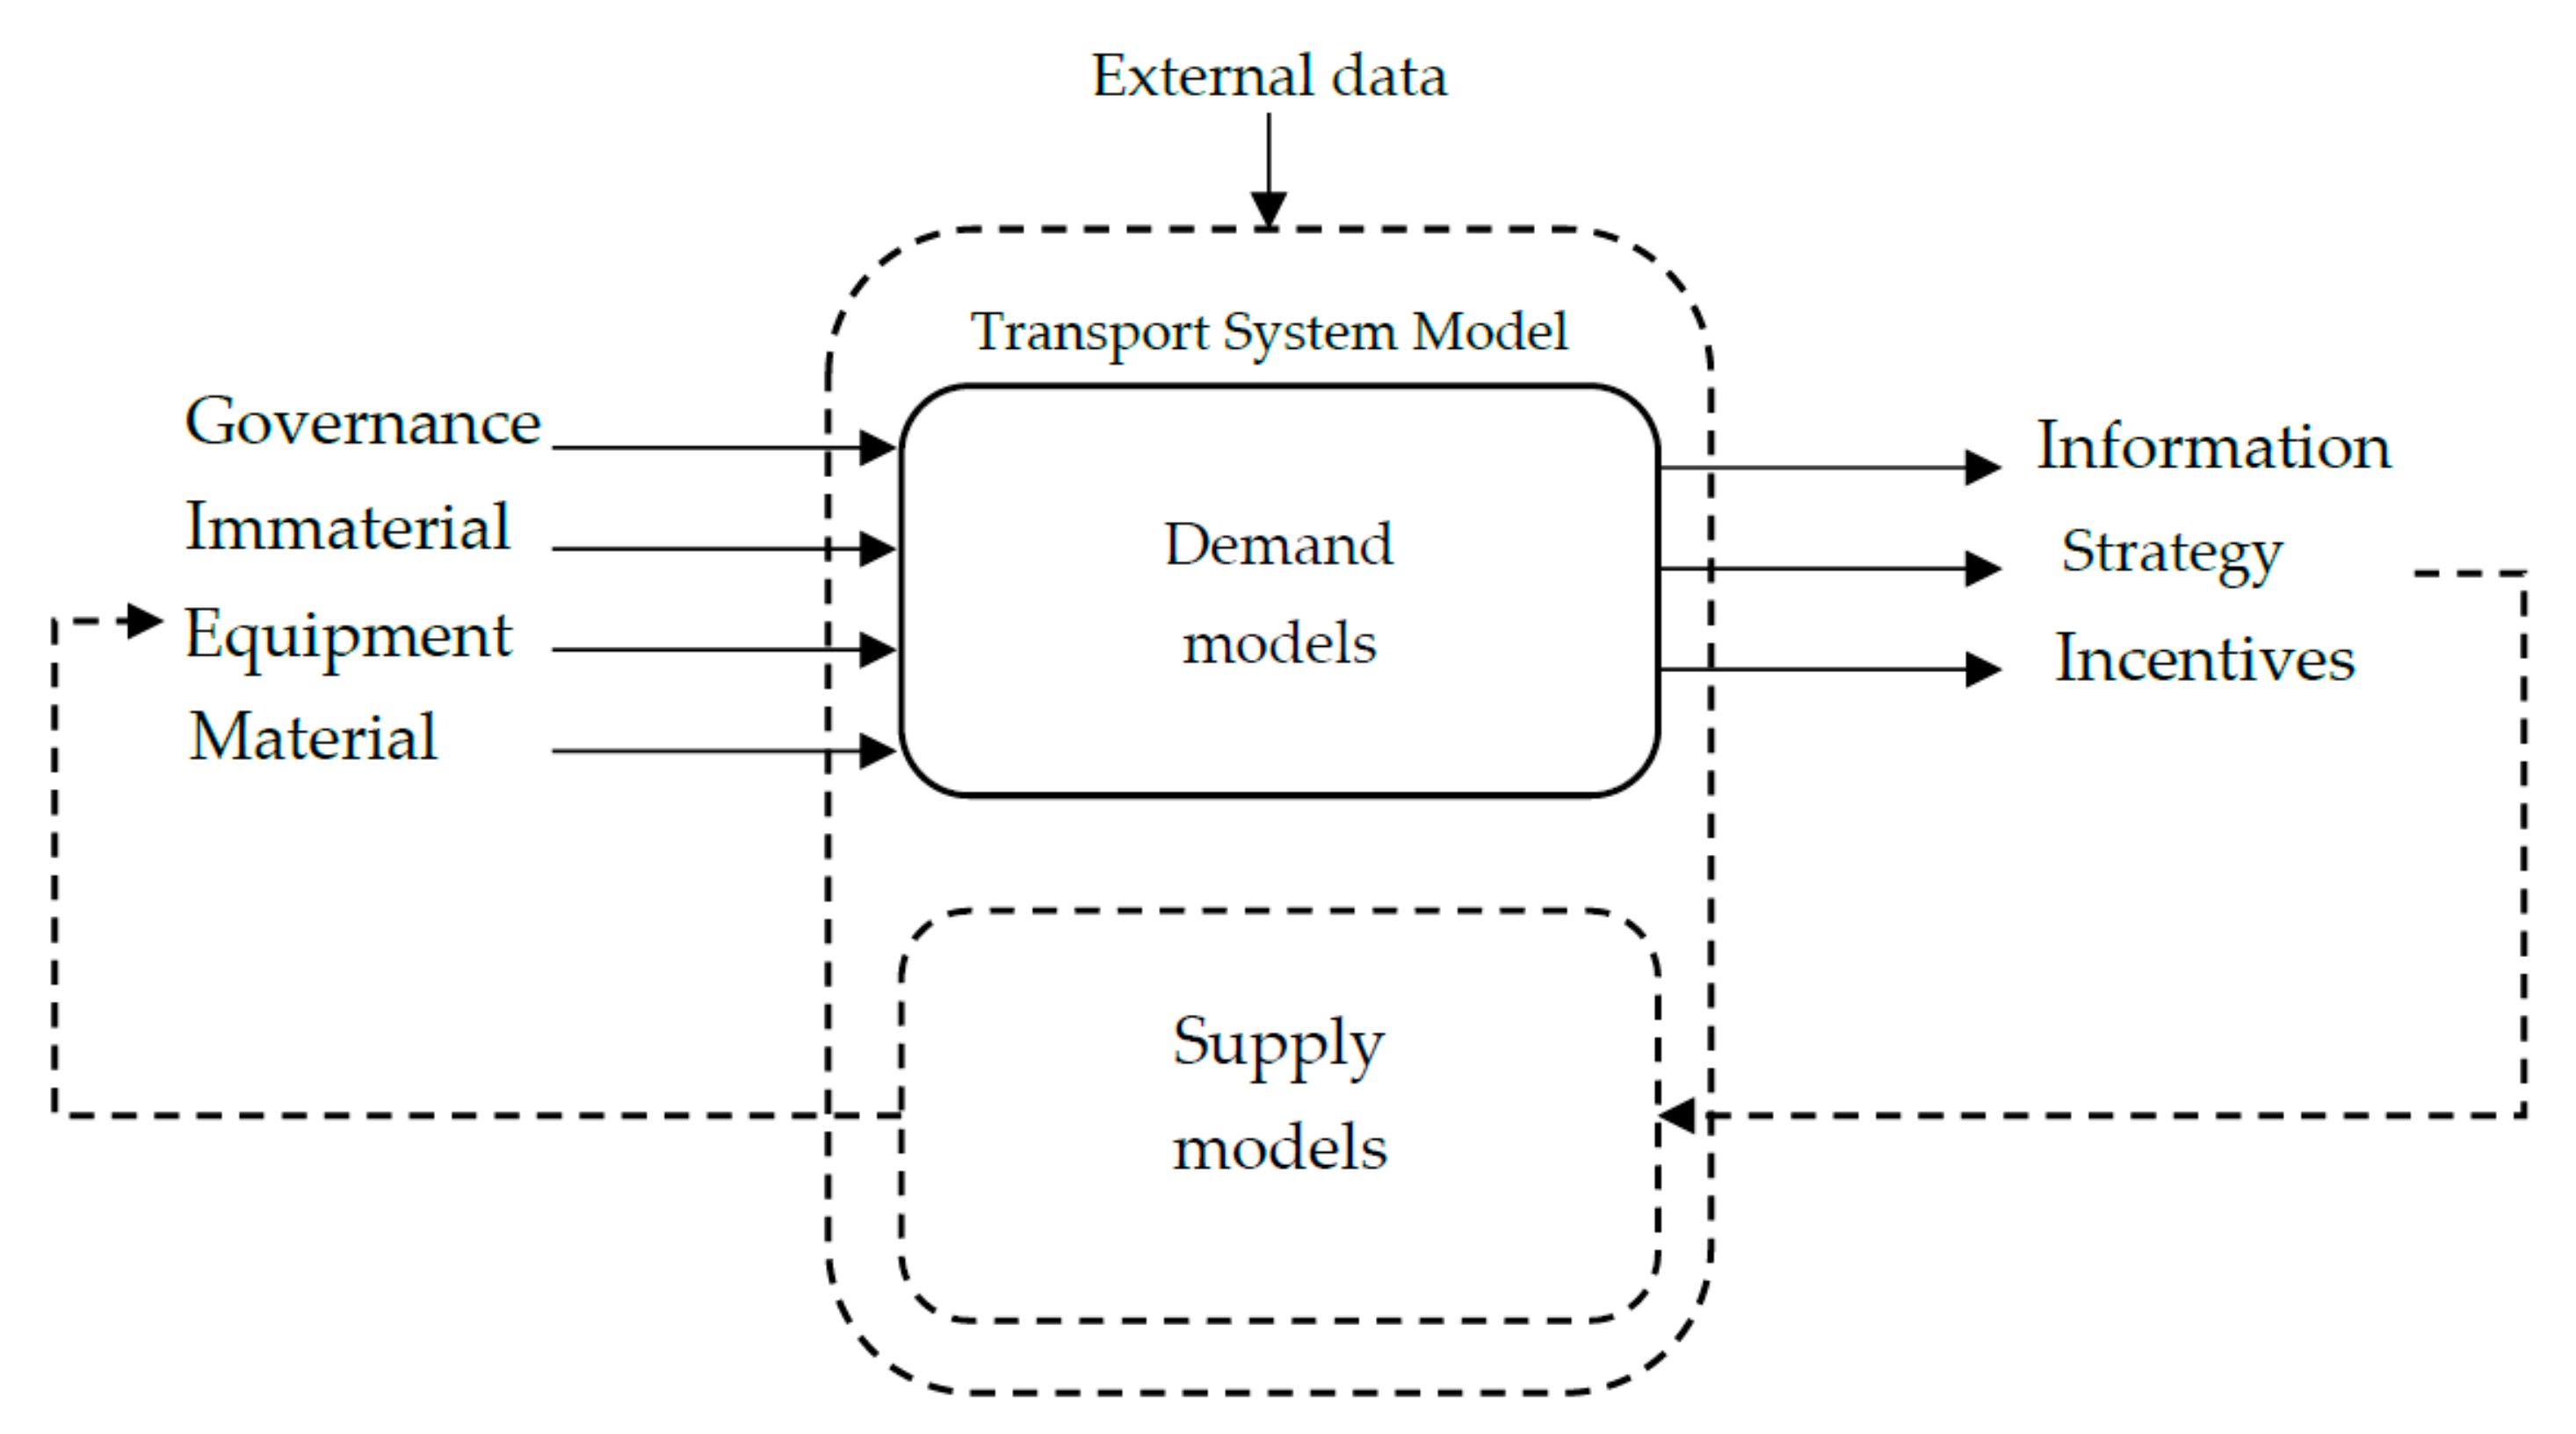
TSMs support the decision-making process in transport-planning activities, as quantitative estimations of potential effects produced by new organizational, technological elements are necessary to verify that social, economic, and environmental sustainability goals are pursued [16]. As reported in the introduction, the support of demand models, a part of TSMs, is crucial in MaaS planning, as demand models receive as input the measures of governance, material, immaterial and of equipment (in terms of modification of level of service attributes) and they drive as output the definition of demand management activities, through the three main classes of measures: information, strategy and incentives (see Figure 3). On the opposite side of Figure 3, supply models receive as input the measures concerning information, strategy and incentives and they support as outputs the definition of measures of governance, material, immaterial and of equipment [17]. Finally, Panuccio [33] analyzed the problem of integration between a sustainable transport system and a smart city and proposed a broader vision of urban planning in the context of the smart city, defined through the three pillars of the ICT, transport and energy. The study presented in [34] aimed to analyze and classify the objectives and actions proposed in the SUMP adopted by European cities, focusing on the policies for improving cycling and pedestrian mobility. In [35], the authors focused the attention on regional transport plans, analyzing the general contents and deepening and comparing the contents related to public transport.
3.2. Travel Demand Models
In the sphere of TSMs (see previous paragraph), travel demand models may be categorized into behavioural and descriptive. Behavioural models rely on theoretical assumptions about transport users’ behaviour, while descriptive models do not explicitly consider users’ behaviour. Both categories are used to estimate travel choices of transport users and to identify the underlying attributes, with their weights, that influence travel choices.
Travel choices. Travel choices of users are multiple: from the choice to do a trip to the choice of the departure time from the origin; from the choice of the elementary destination to the choice of the transport modes-services (or the combination of); from the choice of the method of payments of the transport mode-service to the choice of path (or of a combination of) from the origin to the destination of the trip.
A transport user can undertake several trips during a day, which may be considered part of a daily “trip chain”, characterized by a sequence of trips between origins and destinations with activities carried out in the intermediate locations (or with a different trip purpose between two consecutive trips according to [11]).
As an example, a description of trips of a transport user during a day is given in the following. The first trip from home to the workplace is undertaken by using two mode-services: bus and car-sharing. Once the working activity has ended, the user undertakes a second trip by tram from the workplace to another place for leisure purposes. Finally, he comes back home with a third trip.
The travel choices mainly involved in the MaaS environment are the ones related to the bundle, the mode-choice and the path (see Figure 4). The figure depicts the discrete number of alternatives for each choice dimension.
A “bundle” is a subscription, where two or more separate products are sold in one package. The term product may be used in general for goods and services. The bundle offered in MaaS may be a combination of various modes-services. There is a dispute if MaaS bundles depend, or do not depend, on prior integration of mode-services; in the former case, there is only a price bundle [25].
A “transport mode” is a technological asset that systemically enables users (and freight) to travel by means of services provided with the use of infrastructures, vehicles and organization. Transport modes may belong to three categories. The first is the individual one, if they provide services that are not time-scheduled, exclusive, and continuously accessible in space. The second is the transit one, if they provide services that are time-scheduled, shared and discontinuously accessible in space. The third is the hybrid one, if they provide services with a combination of characteristics belonging to individual and transit ones. Transport modes may be private, public, or mixed depending on the nature of the transport operators providing the services (private or public companies).
A “path” is defined as a sequence of consecutive links (of a network) without loops, which connect an origin of trip and a destination of trip without activities in intermediate locations, in a reference time inside the day. The path is characterized by a dominant trip purpose. The path choice behaviour of a transport user depends on the transport services offered. Several cases can be considered: the pre-trip choice, where the path choice takes place entirely before starting the trip; the pre-trip/en-route choice, where the path choice is completely defined during the trip according to adaptations to events that are unpredictable before undertaking the trip.
Each travel choice described above is defined through the perceived alternatives and the corresponding values of variables called attributes. The main attributes associated to the bundle choice depend on the socio-economic characteristics of travelers, on the mobility habits of travelers (e.g., attitudes towards driving, car ownership, public transport, use of shared modes, new technologies, etc.) on the number and the characteristics of the composing mode-services, on the level of integration of booking and ticketing, and on the characteristics of information (e.g., real-time) received by travelers. The main attributes associated to the mode-service choice depend on the trip purpose, the level of service of the mode-service alternatives available (e.g., the travel time, segmented in different components), and the socio-economic characteristics of the travelers (e.g., working condition). The main attributes associated to paths depend on the purpose of the trip, the disutility (cost) of the available alternatives (e.g., travel time, monetary cost), and the characteristics of common alternatives (e.g., common portions of paths, etc.).
The above attributes are characteristics of the traveler, of the trip alternatives (chosen and perceived), and of the study area.
Travel choice models. From the literature review about demand models for MaaS (Section 2), the most common adopted models for the estimation of the travel choices belong to the class of discrete choice models [36].
The probability of choosing an alternative j, p(j), can be estimated by means of two composing probabilities:
- Probability of choosing the set of alternatives I: p(I);
- Probability of choosing the alternative j, given the set of alternatives I: p(j|I);
where
j is the generic perceived alternative (j∈I);
I = {…, j, …} is the generic set of alternatives (I);
S = {…, I, …} is the set containing all the proper and improper subsets (S⊆R);
R is the set containing all perceived alternatives.
The probability of choosing an alternative j, considering the two composing probabilities, can be estimated as [36]:
p(j) = ΣI∈S p(I) ⋅ p(j|I)
Transport user could perceive all sets, some sets I∈S, or one set I *∈S. In the case that only one set I * is perceived by the transport user, the probability p(I) in (Equation (1)) becomes:
According to Equation (2), Equation (1) is specified as follows:
p(j) = p(j|I *)
The quantity p(I)∈[0,1] may be estimated with choice set perception models, which allow one to build the perceived choice sets (formation level) and to estimate the quantity p(I) (frequency, probability, possibility, or quantum possibility) associated to each perceived choice set (extraction level) (see [37], and references included).
The quantity p(j|I)∈[0,1] may be specified by means of one of the discrete choice models present in literature: Random Utility Models (RUMs) [31], Fuzzy Utility Models (FUMs) [38], and Quantum Utility Models (QUMs) [39]. The study presented in [40] considers the effects of an interference term in addition to the effect of the traditional covariance term in the path choice process. The authors showed that the QUM path choice models can be developed and applied by integrating an interference term into the probability computation.
The model can be calibrated/validated in a disaggregated way (individual users) vs. aggregate (group of users) in relation to the level of aggregation of available observations. From the point of view of the statistical estimator, the calibration/validation of the model can be classical or Bayesian; an example of disaggregated calibration by sentiment and Bayesian approaches is reported in [41].
3.3. Surveys
3.3.1. Sample Surveys
Sample surveys allow one to detect the trip’s characteristics of a selected group (sample) of travelers at home, at trip destination, along the trip, etc. In the past, surveys were carried out by operators travelling on board transit vehicles (e.g., links), at terminals (e.g., nodes), or at home (e.g., at residence place). Today, ICT tools allow one to monitor travelers along their trip with semi-automatic procedures. Some characteristics of the trip that can be detected automatically (e.g., geo-location, use of transit services, etc.). Other characteristics require a direct interaction with the traveler, to detect travel choices (e.g., chosen alternative, available choice set of alternatives, etc.) and individual characteristics of travelers (e.g., trip purpose, desired departure or arrival times, socio-economic conditions, etc.). In the context of the direct interaction, travel choices may be revealed, if they are referred to revealed behaviours (preferences) of travelers in a real context; or stated, if they are referred to stated behaviours (preferences) of travelers in a hypothetical context. In the former case, the survey is called RP (Revealed Preference); in the latter case, the survey is called SP (Stated Preference). Surveys are often hybrid and they are called RP/SP.
A survey requires the identification of the sampling unit, of the extraction sampling method and of the sample size. The sampling unit is, generally, the individual traveler. The extraction sampling method can be the simple random sampling, the stratified random sampling, or the cluster sampling. The sample size may be consistent with the population the observations refer to, in order to obtain an acceptable level of confidence of the results. The monitoring of each traveler may be repeated during several periods (days).
3.3.2. Aggregated Surveys
Aggregate surveys aim to obtaining information of the characteristics of the mobility in the study area, or in a portion of it. The information may be related to the socio-economic conditions and to flows of users and vehicles. The information from the aggregate survey may be grouped into two main categories: socio-economic and flows. The former is indirectly representative of the mobility. For example, the number of people in the resident population, the number of employees, and the number of students in a zone influence the trip generation; while the number of workplaces, the number of school places, and the number of shops in a zone influence the trip attraction. This information can be collected during periodical censuses, and they are present in databases (e.g., open data) provided by statistical institutes. The latter may be directly measured on some elements of the network, or obtained from previous studies (e.g., passengers’ flows in selected sections of transit lines; origin–destination matrices). Flows allow one to capture general patterns of the mobility phenomena.
3.4. ICT Tools
In recent years, ICT tools have allowed one to obtain a large number of observed data (big data). Generally, big data enriches information from traditional data, in terms of volume and variety. ICT tools collect, manage, and process big data within a tolerable elapsed time to provide an adequate representation of the real phenomena and their modelling. In the case of TSMs, big data offer new insights into phenomena related to transport supply and demand components and their interactions [45].
Big data may be obtained from smartphones, smartcards, GPS, and Point-Of-Interest (POI).
Smartphone. Data from a smartphone provide information on a large sample of travelers for long periods of time and at a lower cost than traditional surveys. However, the information has a low spatial resolution, which depends on the phone cell extension. The frequency of updates of the phone user’s position is conditional upon the use by the user himself. The limitation of the data from smartphones lies in the difficulty of extracting reliable travel sequences from scattered and noisy measurements, and the possibility of associating the traveler’s characteristics (e.g., trip purpose) to the travel sequences.
Smartcard. Data from a smartcard are generally obtained from Automated Fare Collection (AFC) systems, commonly used by public transport operators. Beyond ensuring a flexible and secure fare collection, AFCs allow for the collection of space-time information (at the place of the transaction), which constitutes a valuable source of travel data relating to transit transport users. In general, data from a smartcard support the estimation of origin–destination flow matrices by transit modes. Kurauchi and Schmöcker [46] studied smartcard data in estimating passengers’ behaviour and in evaluating the level of service of public transport by means of theoretical frameworks and applications in cities worldwide.
GPS. Due to their high spatial-temporal resolution, GPS data are widely used in mobility applications, such as the monitoring of private vehicles (e.g., cars for insurance companies) and public transport services (e.g., bus fleets). These data support several applications for drivers (e.g., route guidance), for toll collection and mobility surveys. A particular category of GPS data is FCD (Floating Car Data), which derive from survey GPS systems positioned on board vehicles, generally used for insurance purposes.
POI. The data on points of interest, also provided by geo-coded social media, integrate the information obtained with previous sources (e.g., primary locations such as origins/destinations of home/work trips) with information on the purpose of trips to/from for secondary places (e.g., shopping, recreational activities).
4. Case Studies
The case studies presented in this section have been identified among the selected studies of the literature review, which present a more comprehensive travel demand analysis of MaaS.
The analysis of case studies allows for a critical analysis, in order to aggregate the existing scientific literature about MaaS according to the following criteria: surveys, models and results. The case studies presented concern London (UK), Sydney (Australia), Strait of Messina (Italy).
4.1. London (UK)
Some research activities about demand analysis with MaaS scenarios were presented in on the Greater London Area [14,19,20], where a Mobility as a Service is not still available for travelers in the area.
Surveys. The surveys were aimed to gather in-depth data on travel behaviour and on new mobility services [19]. The surveys belonged to three categories: (1) RP survey (questionnaire) about individual characteristics and current mobility patterns; (2) SP survey (questionnaire) on MaaS scenarios, such as attitudes, perceptions and potential impacts of MaaS; (3) smartphone-based travel survey to enhance the quality and quantity of data collected with questionnaires. In category (1), information socio-demographic characteristics, current mobility means ownership and mobility habits of the respondents were collected. In category (2), transport mode and non-mode attributes were investigated. The former includes the existing modes and additional features (e.g., minivan access in car-sharing); the latter includes characteristics of the bundles, with the combination of services and prices. The attributes and levels were determined through an analysis of the existing values. In category (3), respondents were tracked via a smartphone app for a 7-day period, after having filled out the RP survey. The tracking data were elaborated in a mobility record, containing the distance, time, number of trips and costs for each transport mode of each use. The mobility record was used to validate the RP responses, and to support the execution of the SP questionnaire by the respondents.
Models. Two choice models of the MaaS bundle were built [14]. The first allowed one to identify which are the preferred modes of travelers inside the MaaS plans (bundles), in order to rank the different shared modes. The second model was developed upon the subset of respondents, who indicated that they would be interested in actually purchasing their chosen MaaS plan. The second model was used to check the “stability” of choices of the respondent estimated in the first model. The developed models were based on random utility theory [9,11]. The modelling structure adopted was a Mixed Multinomial Nested Logit (MMNL) that allowed one to simulate constant tastes across replications for the same respondent (taste homogeneity among respondents). This, in order to take into account the repeated nature of SP data associated to a single respondent, recorded in multiple-choice situations. The models were calibrated by means of the likelihood minimization method.
Results. As concerns the calibrated models [14,20], the results of the first model based on the entire sample of respondents show that, on average, transport users prefer plans (or bundles) with public transport options, rather than plans including bike sharing, car sharing and taxi options. According to the majority of respondents, public transport should be the backbone of MaaS. The results of the second model were in line with the first one: the subset of respondents who bought their plans still had similar preferences. Finally, some results show that more that 60% of respondents would be willing to try transportation modes they previously did not use if their MaaS plans included them.
4.2. Sydney (Australia)
Some studies about MaaS in Sydney were carried out in [6,8,24,25] with the objective to investigate the role of MaaS in improving the travelers’ experience of using multiple integrated transport services.
Surveys. The survey was executed in order to gather information belonging to five categories: (1) current travel behaviour; (2) preferences for on-demand transport services; (3) preferences for MaaS schemes; (4) attitudes towards car, public transport, MaaS and new technologies and services; (5) socio-economic conditions. MaaS scenarios included an extended set of transport modes: local public transport, long distance public transport, taxis, car rentals, car-share, ride-share and bike-share.
Models. The model developed was a Latent Class Choice Model (LCCM), based on random utility theory [9,11], to estimate travelers’ preferences for MaaS. The LCCMs allowed one to identify the segments inside the sample that vary in terms of their preferences for alternative MaaS schemes. The model had two components: a class membership model, which expressed the probability that a traveler belongs to a specific segment, or class, and a class-specific choice model, which expressed the probability that a traveler chooses a specific alternative, or MaaS scheme, identified in terms of the availability of transport modes and fares. The model allowed one to capture the heterogeneity in the decision-making process across classes.
Results. The results of the model allowed one to identify five classes of users. Individuals of class 1 (14% of the population) had the greatest propensity (87%) of purchasing MaaS, while individuals of class 5 (41% of the population) had a near zero propensity (1%) to purchase whatever MaaS scheme. The highest demand for Maas was generally among young and middle-aged individuals and among individuals who lived in low-income suburban areas and depended on the public transport. The demand for MaaS was lower among older individuals and among individuals who lived in rich car-dependent suburban areas. According to local public transport, taxis and long-distance public transport were the most popular transport services, followed by car rentals and rides-hare services, inside the tested MaaS schemes [22].
4.3. Strait of Messina (Italy)
The Strait of Messina separates the cities of Messina and Reggio Calabria (Italy). Mobility between the two cities, and between Sicily and the rest of Italy, is guaranteed by maritime services that allow one to transport vehicles and people between the two shores. All modes of transport are present in the area: sea, road, rail and air. Transport services are provided by several public and private operators that do not currently operate under modal and tariff integration and that are subject to different legislations [47].
Surveys. A pilot RP/SP survey was carried out on a sample of travelers who undertake urban trips, within each of the two cities, or intercity trips [30]. The sample is composed of 47 users, mainly of workers and, to a lesser extent, of students and unemployed individuals. The questionnaire was subdivided into three sections. The first contained the socio-economic characteristics of the user. In the second (revealed preferences), information about the most frequent trip was requested. In the third section (stated preferences), hypothetical MaaS bundles to be purchased were proposed to respondents, which differ in price, quantity and type of transport services offered.
Results. The results of the sampling analysis (the models are under construction) are briefly reported below. Firstly, analyses show heterogeneous and contrasting perceived preferences towards MaaS scenarios, especially in terms of price congruity and increase in utility for travelers. Secondly, two main trends emerge: (a) the highest percentage of positive attitudes towards MaaS was recorded for inter-city trips; (b) the categories most interested to MaaS were workers and students, and in particular students had more inclination to purchase bundles that enable them to cross the Strait without a car.
4.4. Discussion
The analysis of the above case studies allowed us to aggregate the existing scientific literature about demand analysis for MaaS according to the following criteria: surveys, models and results. The case studies presented concern London (UK), Australia and the Strait of Messina (Italy). From the comparison of the case studies analyzed, the following common elements may be highlighted.
The surveys belonged to RP/SP type: RP aimed to obtain individual characteristics and current mobility patterns of travelers; SP aimed to capture attitudes, perceptions and potential impacts of MaaS scenarios. The travel choices investigated in the case studies regarded mainly the choice of the bundle and of the preferred mode-services among the existing ones, and the attributes that influence choices, with their weights (calibrated parameters).
The models developed were generally discrete choice models, based on random utility theory. The models simulate the choice of MaaS bundle and the choice of preferred modes inside the MaaS bundles, and they are heteroscedastic, able to capture the heterogeneity in the travel choices across different segments of travelers.
The results, in general, allowed us to identify some categories of travelers having a common attitude towards MaaS [19]. “MaaS-ready” travelers have a high inclination towards MaaS schemes with pooled on-demand services. “MaaS-neutrals” travelers are more conservative in their decisions. “Car-lovers” travelers show a clear inclination towards privately owned modes. “Public transport supporters” have a positive attitude towards integrated mobility mode-services, but not towards shared modes. Finally, travelers opposing “new-mobility” paradigms are the ones with the lowest inclination towards integrated mobility mode-services.
At the end, from the comparative analysis of the above case studies, the main elements emerge in relation to the travelers’ propensity towards MaaS.
- (1)
- The majority of potential MaaS travelers think that public transport should be the backbone of MaaS; generally, travelers prefer MaaS bundles with public transport options, rather than bundles including bike sharing, car sharing and taxi options.
- (2)
- The propensity to adopt MaaS scheme increases was recorded for multi-modal and multi-service trips rather that trips undertaken with a single mode-services (e.g., inter-city trips in the Strait of Messina).
5. Conclusions
This paper presented existing methods and case studies concerning the analysis of passengers’ travel choices (demand analysis) in the presence of MaaS. It is foreseen that the widespread diffusion of emerging technologies in the next years will generate a disruption in transport sector, with a modification of the value-added profile of transport ‘production’. The challenge will be to make transport services more efficient, by reducing the unit costs of transport supply; effective, by unlocking value and increasing utility of transport users; and sustainable, defined according to the three economic, social and environmental pillars. MaaS is considered one of the main elements that could embody the above disruption process in transport, as it is characterized by three main pillars: the design of customer-centered supply, the sustainable goals, and the (emerging) technology adoption.
According to the author, the quantitative estimations of potential effects of a Sustainable MaaS (S-MaaS) to verify that sustainability goals are pursued, should be supported by TSMs. TSMs are comprised by the three modelling components: the transport supply model, the travel demand model and the supply–demand interaction model. In particular, the support of travel demand models, as part of TSMs, is crucial for S-MaaS planning, as they drive the definition of demand management activities, through the three main classes of measures: information, strategy and incentives. Travel demand models may be used to estimate travel choices of MaaS travelers and to identify the underlying attributes, with their weights, that influence travel choices. The main travel choices involved in the MaaS environment are related to the choice of the bundle, of the mode-choice and of the path. Each travel choice is defined through the perceived alternatives and the corresponding values of variables called attributes. In the literature, the most common adopted models for the estimation of the travel choices belong to the class of discrete choice models, which may be built with the data obtained via sample or aggregate surveys. Recently, a relevant contribution in the acquisition of a large number of observed data (big data) comes from ICT tools, which are able to collect, manage, and process big data within a tolerable elapsed time to capture and model dynamics related to transport supply and travel demand.
Future development of the research concerns the specification–calibration–validation of travel choice models (bundle and mode-services) in order to capture the heterogeneity of travelers’ attitudes in the presence of MaaS scenarios. The developed travel choice models should drive the analyst in the optimal design of effective demand management measures in order to pursue sustainable objectives inside S-Maas.
Funding
This research is partially supported by DIIES—Università di Reggio Calabria and by the project “La Mobilità per i passeggeri come Servizio–MyPasS”, Fondi PON R&I 2014-2020 e FSC, Progetti di Ricerca PNR 2015-2020, codice identificativo ARS01_01100.
Institutional Review Board Statement
Not applicable.
Informed Consent Statement
Not applicable.
Data Availability Statement
Not applicable.
Acknowledgments
The author is grateful to all the researchers of the transportation group at DIIES for the long and deep discussions. It is evident that errors are the responsibility of the author.
Conflicts of Interest
The authors declare no conflict of interest.
References
- Transport for NSW. Future Transport Technology, Roadmap 2016. Technical Report; 2016. Available online: https://future.transport.nsw.gov.au/sites/default/files/media/documents/2018/Future-Transport-Technology-Overview-Roadmap-2016.pdf (accessed on 12 April 2022).
- Veugelers, R. (Ed.) Manufacturing Europe’s Future; Bruegel Blueprint; Bruegel: Brussels, Belgium, 2013; ISBN 978-90-78910-32-9. [Google Scholar]
- Comi, A.; Rossolov, A.; Polimeni, A.; Nuzzolo, A. Private Car O-D Flow Estimation Based on Automated Vehicle Monitoring Data: Theoretical Issues and Empirical Evidence. Information 2021, 12, 493. [Google Scholar] [CrossRef]
- Nuzzolo, A.; Comi, A. Dynamic Optimal Travel Strategies in Intelligent Stochastic Transit Networks. Information 2021, 12, 281. [Google Scholar] [CrossRef]
- Musolino, G.; Rindone, C.; Vitetta, A. Models for Supporting Mobility as a Service (MaaS) Design. Smart Cities 2022, 5, 206–222. [Google Scholar] [CrossRef]
- Hensher, D.A. Understanding Mobility as a Service (MaaS): Past, Present and Future; Elsevier: Amsterdam, The Netherlands; Cambridge, MA, USA, 2020; ISBN 978-0-12-820044-5. [Google Scholar]
- Sulskyte, D. Mobility-As-A-Service: Concepts and Theoretical Approach. In Proceedings of the 2021 IEEE International Conference on Technology and Entrepreneurship (ICTE), Kaunas, Lithuania, 24 August 2021; pp. 1–6. [Google Scholar]
- Smith, G.; Hensher, D.A. Towards a Framework for Mobility-as-a-Service Policies. Transp. Policy 2020, 89, 54–65. [Google Scholar] [CrossRef] [Green Version]
- Ben-Akiva, M.E.; Lerman, S.R. Discrete Choice Analysis: Theory and Application to Travel Demand; MIT Press Series in Transportation Studies; MIT Press: Cambridge, MA, USA, 1985; ISBN 978-0-262-02217-0. [Google Scholar]
- de Dios Ortúzar, J.; Willumsen, L.G. Modelling Transport, 3rd ed.; John Wiley: Chichester, NY, USA, 2001; ISBN 978-0-471-86110-2. [Google Scholar]
- Cascetta, E. Transportation Systems Engineering: Theory and Methods; Springer: Berlin/Heidelberg, Germany, 2001; ISBN 978-1-4757-6873-2. [Google Scholar]
- Chamier Gliszczyński, N. Sustainable Operation of a Transport System in Cities. KEM 2011, 486, 175–178. [Google Scholar] [CrossRef]
- Karoń, G. Travel Demand and Transportation Supply Modelling for Agglomeration without Transportation Model. In Activities of Transport Telematics; Communications in Computer and Information Science; Mikulski, J., Ed.; Springer: Berlin/Heidelberg, Germany, 2013; Volume 395, pp. 284–293. ISBN 978-3-642-41646-0. [Google Scholar]
- Matyas, M.; Kamargianni, M. The Potential of Mobility as a Service Bundles as a Mobility Management Tool. Transportation 2019, 46, 1951–1968. [Google Scholar] [CrossRef] [Green Version]
- Vitetta, A. Sustainable Mobility as a Service: Framework and Transport System Models. Information 2022, 13, 346. [Google Scholar] [CrossRef]
- Russo, F. Sustainable Mobility as a Service: Dynamic Models for Agenda 2030 Policies. Information 2022, 13, 355. [Google Scholar] [CrossRef]
- Rindone, C. Sustainable Mobility as a Service: Supply Analysis and Test Cases. Information 2022, 13, 351. [Google Scholar] [CrossRef]
- Panuccio, P. Sustainable Mobility as a Service: Smart City and Planning. Information 2022, Submitted. [Google Scholar]
- Matyas, M.; Kamargianni, M. Survey Design for Exploring Demand for Mobility as a Service Plans. Transportation 2019, 46, 1525–1558. [Google Scholar] [CrossRef] [Green Version]
- Matyas, M. Opportunities and Barriers to Multimodal Cities: Lessons Learned from in-Depth Interviews about Attitudes towards Mobility as a Service. Eur. Transp. Res. Rev. 2020, 12, 7. [Google Scholar] [CrossRef] [Green Version]
- Xie, Y.; Danaf, M.; Lima Azevedo, C.; Akkinepally, A.P.; Atasoy, B.; Jeong, K.; Seshadri, R.; Ben-Akiva, M. Behavioral Modeling of On-Demand Mobility Services: General Framework and Application to Sustainable Travel Incentives. Transportation 2019, 46, 2017–2039. [Google Scholar] [CrossRef]
- Alonso-González, M.J.; Hoogendoorn-Lanser, S.; van Oort, N.; Cats, O.; Hoogendoorn, S. Drivers and Barriers in Adopting Mobility as a Service (MaaS)—A Latent Class Cluster Analysis of Attitudes. Transp. Res. Part A Policy Pract. 2020, 132, 378–401. [Google Scholar] [CrossRef]
- Feneri, A.-M.; Rasouli, S.; Timmermans, H.J.P. Modeling the Effect of Mobility-as-a-Service on Mode Choice Decisions. Transp. Lett. 2022, 14, 324–331. [Google Scholar] [CrossRef] [Green Version]
- Reck, D.J.; Hensher, D.A.; Ho, C.Q. MaaS Bundle Design. Transp. Res. Part A Policy Pract. 2020, 141, 485–501. [Google Scholar] [CrossRef]
- Vij, A.; Ryan, S.; Sampson, S.; Harris, S. Consumer Preferences for Mobility-as-a-Service (MaaS) in Australia. Transp. Res. Part C Emerg. Technol. 2020, 117, 102699. [Google Scholar] [CrossRef]
- de Luca, S.; Mascia, M. Adaptive Travel Mode Choice in the Era of Mobility as a Service (MaaS): Literature Review and the Hypermode Mode Choice Paradigm. In Models and Technologies for Smart, Sustainable and Safe Transportation Systems; de Luca, S., Di Pace, R., Fiori, C., Eds.; IntechOpen: Rijeka, Croatia, 2021; ISBN 978-1-83880-802-0. [Google Scholar]
- Song, Y.; Li, D.; Cao, Q.; Yang, M.; Ren, G. The Whole Day Path Planning Problem Incorporating Mode Chains Modeling in the Era of Mobility as a Service. Transp. Res. Part C Emerg. Technol. 2021, 132, 103360. [Google Scholar] [CrossRef]
- Kim, S.; Rasouli, S. The Influence of Latent Lifestyle on Acceptance of Mobility-as-a-Service (MaaS): A Hierarchical Latent Variable and Latent Class Approach. Transp. Res. Part A Policy Pract. 2022, 159, 304–319. [Google Scholar] [CrossRef]
- Bushell, J.; Merkert, R.; Beck, M.J. Consumer Preferences for Operator Collaboration in Intra- and Intercity Transport Ecosystems: Institutionalising Platforms to Facilitate MaaS 2.0. Transp. Res. Part A Policy Pract. 2022, 160, 160–178. [Google Scholar] [CrossRef]
- Vitetta, A.; Rindone, C.; Musolino, G.; Vitale, A. Indagine Pilota Su Scenari Mobility As a Service (MaaS) Nello Stretto Di Messina. LaborEst 2022, 50–56. [Google Scholar] [CrossRef]
- Birgillito, G.; Rindone, C.; Vitetta, A. Passenger Mobility in a Discontinuous Space: Modelling Access/Egress to Maritime Barrier in a Case Study. J. Adv. Transp. 2018, 2018, 6518329. [Google Scholar] [CrossRef]
- Russo, F.; Chilà, G. A Sequential Dynamic Choice Model to Simulate Demand in Evacuation Conditions. In Proceedings of the 7th International Conference on Computer Simulation in Risk Analysis and Hazard Mitigation, Algarve, Portugal, 26 August 2010; pp. 431–442. [Google Scholar]
- Panuccio, P. Smart Planning: From City to Territorial System. Sustainability 2019, 11, 7184. [Google Scholar] [CrossRef] [Green Version]
- Cirianni, F.; Monterosso, C.; Panuccio, P.; Rindone, C. A Review Methodology of Sustainable Urban Mobility Plans: Objectives and Actions to Promote Cycling and Pedestrian Mobility. In Smart and Sustainable Planning for Cities and Regions; Green Energy and Technology; Bisello, A., Vettorato, D., Laconte, P., Costa, S., Eds.; Springer International Publishing: Cham, Switzerland, 2018; pp. 685–697. ISBN 978-3-319-75773-5. [Google Scholar]
- Russo, F.; Rindone, C. Regional Transport Plans: From Direction Role Denied to Common Rules Identified. Sustainability 2021, 13, 9052. [Google Scholar] [CrossRef]
- Manski, C.F. The Structure of Random Utility Models. Theor. Decis. 1977, 8, 229–254. [Google Scholar] [CrossRef]
- Cascetta, E.; Russo, F.; Viola, F.A.; Vitetta, A. A Model of Route Perception in Urban Road Networks. Transp. Res. Part B Methodol. 2002, 36, 577–592. [Google Scholar] [CrossRef]
- Quattrone, A.; Vitetta, A. Random and Fuzzy Utility Models for Road Route Choice. Transp. Res. Part E Logist. Transp. Rev. 2011, 47, 1126–1139. [Google Scholar] [CrossRef]
- Vitetta, A. Quantum Utility Model for Route Choice in Transport Systems. Travel Behav. Soc. 2016, 3, 29–37. [Google Scholar] [CrossRef]
- Di Gangi, M.; Vitetta, A. Quantum Utility and Random Utility Model for Path Choice Modelling: Specification and Aggregate Calibration from Traffic Counts. J. Choice Model. 2021, 40, 100290. [Google Scholar] [CrossRef]
- Vitetta, A. Sentiment Analysis Models with Bayesian Approach: A Bike Preference Application in Metropolitan Cities. J. Adv. Transp. 2022, 2022, 2499282. [Google Scholar] [CrossRef]
- Train, K. Discrete Choice Methods with Simulation, 2nd ed.Cambridge University Press: Cambridge; NY, USA, 2009; ISBN 978-0-521-76655-5. [Google Scholar]
- Nuzzolo, A.; Crisalli, U.; Comi, A.; Rosati, L. Individual Behavioural Models for Personal Transit Pre-Trip Planners. Transp. Res. Procedia 2015, 5, 30–43. [Google Scholar] [CrossRef]
- Nuzzolo, A.; Comi, A. A Subjective Optimal Strategy for Transit Simulation Models. J. Adv. Transp. 2018, 2018, 8797328. [Google Scholar] [CrossRef]
- Croce, A.I.; Musolino, G.; Rindone, C.; Vitetta, A. Transport System Models and Big Data: Zoning and Graph Building with Traditional Surveys, FCD and GIS. IJGI 2019, 8, 187. [Google Scholar] [CrossRef] [Green Version]
- Public Transport Planning with Smart Card Data, 1st ed.; Kurauchi, F.; Schmöcker, J.-D. (Eds.) CRC Press: Boca Raton, FL, USA, 2016; ISBN 978-1-4987-2659-7. [Google Scholar]
- Musolino, D. Characteristics and Effects of Twin Cities Integration: The Case of Reggio Calabria and Messina, ‘Walled Cities’ in Southern Italy. Reg. Sci. Policy Pract. 2018, 10, 315–334. [Google Scholar] [CrossRef]
Figure 1.
Steps of the research methodology.

Figure 2.
Inputs-outputs, components and interactions of TSMs.

Figure 3.
Inputs-outputs of demand models (and dually of supply models) inside the TSM.

Figure 4.
Example of travel choices tree in MaaS.


Table 1.
Literature studies about demand of MaaS.
| Publ. n. | Travel Choice | Survey | Approach | Parameters | City/Nation |
|---|---|---|---|---|---|
| [14] | Bundle | RP/SP | M (behavioural) | X | London (UK) |
| [19] | Bundle | RP/SP | M (behavioural) | X | London (UK) |
| [20] | Bundle | RP/SP | M (behavioural) | X | London (UK) |
| [21] | Mode-service | RP/SP | M (behavioural) | X | Cambridge (USA) |
| [22] | Mode | SP | S (cluster) | -- | The Netherland |
| [23] | Bundle/mode | SP | M (behavioural) | X | The Netherland |
| [24] | Bundle | -- | S | -- | -- |
| [25] | Bundle/Mode | SP/RP | M (behavioural) | X | Australia |
| [26] | Mode | SP/RP | S (sample) | -- | London (UK) |
| [30,31] | Bundle | RP/SP | S (sample) | -- | Strait of Messina (Italy) |
M, Model; S, Statistical Analysis; RP, Revealed Preference; SP, Stated Preference.
Publisher’s Note: MDPI stays neutral with regard to jurisdictional claims in published maps and institutional affiliations. |
© 2022 by the author. Licensee MDPI, Basel, Switzerland. This article is an open access article distributed under the terms and conditions of the Creative Commons Attribution (CC BY) license (https://creativecommons.org/licenses/by/4.0/).
Share and Cite
MDPI and ACS Style
Musolino, G. Sustainable Mobility as a Service: Demand Analysis and Case Studies. Information 2022, 13, 376. https://doi.org/10.3390/info13080376
AMA Style
Musolino G. Sustainable Mobility as a Service: Demand Analysis and Case Studies. Information. 2022; 13(8):376. https://doi.org/10.3390/info13080376
Chicago/Turabian StyleMusolino, Giuseppe. 2022. "Sustainable Mobility as a Service: Demand Analysis and Case Studies" Information 13, no. 8: 376. https://doi.org/10.3390/info13080376
Note that from the first issue of 2016, this journal uses article numbers instead of page numbers. See further details here.