Article

Baseline Structural Connectomics Data of Healthy Brain Development Assessed with Multi-Modal Magnetic Resonance Imaging

1
Department of Computer Science, St. Francis Xavier University, Antigonish, NS B2G 2W5, Canada
2
Department of Computer Science, Memorial University of Newfoundland, St. John’s, NL A1C 5S7, Canada
3
Division of Newborn Medicine, Department of Medicine, Boston Children’s Hospital, Boston, MA 02115, USA
4
Department of Pediatrics, Harvard Medical School, Boston, MA 02115, USA
5
Department of Radiology, Harvard Medical School, Boston, MA 02115, USA
6
Athinoula A. Martinos Center for Biomedical Imaging, Massachusetts General Hospital, Charlestown, MA 02129, USA
7
Research Affiliate, Nova Scotia Health Authority—Research, Innovation and Discovery Center for Clinical Research, Halifax, NS B3J 0EB, Canada
*
Author to whom correspondence should be addressed.
Information 2024, 15(1), 66; https://doi.org/10.3390/info15010066
Submission received: 18 December 2023 / Revised: 16 January 2024 / Accepted: 17 January 2024 / Published: 22 January 2024
(This article belongs to the Special Issue Multi-Modal Biomedical Data Science—Modeling and Analysis)

Abstract

:
Diffusion magnetic resonance imaging (MRI) tractography is a powerful tool for non-invasively studying brain architecture and structural integrity by inferring fiber tracts based on water diffusion profiles. This study provided a thorough set of baseline data of structural connectomics biomarkers for 809 healthy participants between the ages of 1 and 35 years. The data provided can help to identify potential biomarkers that may be helpful in characterizing physiological and anatomical neurodevelopmental changes linked with healthy brain maturation and can be used as a baseline for comparing abnormal and pathological development in future studies. Our results demonstrate statistically significant differences between the sexes, representing a potentially important baseline from which to establish healthy growth trajectories. Biomarkers that correlated with age, potentially representing useful methods for assessing brain development, are also presented. This baseline information may facilitate studies that identify abnormal brain development associated with a variety of pathological conditions as departures from healthy sex-specific age-dependent neural development. Our findings are the result of combining the use of mainstream analytic methods with in-house-developed open-source software to help facilitate reproducible analyses, inclusive of many potential biomarkers that cannot be derived from existing software packages. Assessing relationships between our identified regional tract measurements produced by our technology and participant characteristics/phenotypic data in future analyses has tremendous potential for the study of human neurodevelopment.

1. Introduction

Diffusion MRI (dMRI) tractography is a powerful tool for studying white matter structures in the brain. It is the only non-invasive method that exists for modeling fiber tracts throughout the brain, which is a process known as connectomics. Tractography imaging has demonstrated itself to have considerable potential in neuroscientific analysis [1,2,3]; however, it has yet to become a gold standard analytic technique relied upon clinically.
Current tractography methods do not directly track axons but infer their presence by mapping fiber bundles based on water diffusion profiles between adjacent voxels. This technique offers clear potential value toward a better understanding of the structural organization of the brain [4,5]. These analytic technologies support neuroscientists in testing hypotheses and understanding normative neurodevelopmental trajectories, as well as deviations from them, such as whether individuals on the autistic spectrum exhibit abnormally reduced or increased structural fiber tract connectivity between key brain regions relative to neurotypical controls [6].
Imaging is typically performed on a voxel-by-voxel basis, with each voxel typically measuring a few cubic millimeters. There can be approximately 50,000 neurons in a cubic millimeter [7]. The scale disparity between our macroscale voxel-based measurements and the number of axons involved in the MRI signals acquired results in assumptions and approximations being made when researchers correlate structural connectivity and function. Previous research has demonstrated reasonable agreement between structural, functional, and microanatomy fiber-tracking results [8], suggesting that a simple model of direct anatomical connectivity between regions of interest in the brain can explain much of the observed correlations in neural activity [9]. Traditional diffusion-tensor-imaging-based analyses have also been reported to be unreliable [10,11]. Given imaging and analytic constraints, false positives and negatives are inevitable, especially in regions of heavy fiber crossing or structural complexity.
Building on this foundation, the current study introduces a novel approach to conducting an exhaustive whole-brain tractography analysis. We established a comprehensive suite of indirect measurements of anatomical white matter connections across all region pairs as defined in the Desikan–Killiany–Tourville atlas [12], including capturing differences in hemispheric asymmetry and variability of each measure collected. We integrated results from a substantial Boston Children’s Hospital (BCH) clinical dataset of 642 participants with an additional 167 participants from the Human Connectome Project (HCP), who were scanned under different protocols. Using advanced multimodal imaging techniques applied to the BCH data, we identified variations in measurements across sex and age brackets from the nascent stages of infancy through the formative school-age years, adolescence, and into young adulthood to better understand the development of tractography biomarkers, with a particular focus on identifying potential biomarkers of healthy development. This work was then extended to an adult population through analysis of the HCP dataset.
Our findings suggest that while there are more similarities than differences between sexes in most metrics, specific tracts do show notable variations. Furthermore, the variability in fractional anisotropy measurements in particular appears to be a promising avenue for understanding both age-related and sex-specific nuances in neural development. The overarching goal of this investigation is to provide a thorough baseline of connectomics biomarkers across a range of ages spanning two datasets in support of future work toward characterizing abnormal brain development as a deviation from these expected growth trajectories. These findings may assist in supporting a more detailed understanding of structural variations in brain connectivity across the entire connectome.

2. Materials and Methods

All research conducted in this study was performed in accordance with the ethical principles outlined in the Declaration of Helsinki and approved by the Boston Children’s Hospital (BCH) Institutional Review Board (IRB) at BCH (IRB-P00032682). Ethics approval was obtained from the Boston Children’s Hospital Ethics Committee/IRB for this retrospective analysis. Informed consent was waived due to the lack of risk to the study participants. Examinations from 642 participants retrospectively assessed as healthy/neurotypical [12] were imaged at Boston Children’s Hospital, and participants with a directional diffusion MRI acquisition included as part of their examination were the subjects of a previous analysis [13]. The participant population addressed in this analysis ranged in age from 0.7 to 23.5 years, thus spanning a comprehensive range of neurological development from a pediatric population. The dataset was subject to exclusions based on examinations with a high degree of motion or low-quality images; external artifacts (such as metal dental work); samples without a useful T1 structural MRI volume; and unhealthy participants as assessed at BCH, as previously described [12,13].
An additional dataset was used for analysis based on subjects gathered as part of the publicly available Human Connectome Project (HCP) dataset. A detailed description of the recruitment of individuals for this data, as well as inclusion and exclusion criteria for the dataset, is available in the literature [14]. A cohort of 167 subjects with a complete 3-tesla directional diffusion MRI acquisition was included. All participants were between the ages of 22 and 35. The group consisted of 90 males (27.6 ± 3.41 years) and 69 females (29.9 ± 3.54 years), with an aim to establish a pool that is representative of the ‘healthy’ young adult population at large.
BCH Participants were imaged with clinical 3-tesla MRI scanners (Skyra, Siemens Medical Systems, Erlangen, Germany) at Boston Children’s Hospital, yielding T1 structural volumetric images accessed through the Children’s Research and Integration System [15]. Any samples with substantial motion artifacts or failure of FreeSurfer [16] processing were previously removed [12]. The diffusion MRI data was acquired using diffusion-weighted spin-echo echo-planar imaging. Thirty directional diffusion-weighted measurements (b = 1000 s/mm2) and five non-directional diffusion-weighted measurements (b = 0 s/mm2) were acquired with TR = 10 s, TE = 88 ms, δ = 12.0 ms, Δ = 24.2 ms, field of view = 22 × 22 cm2, matrix size = 128 × 128, iPAT = 2, and spatial resolution 1.72 × 1.72 mm2. Commercial head coils were used with both 32 and 64 channels.
The HCP participants were imaged using a modified Siemens 3T scanner (‘Connectom Skyra’), yielding T1w acquisitions using a tightly fitting 32-channel head coil and magnetization-prepared rapid gradient echo (MPRAGE) sequences. Structural scans were carefully reviewed for quality, motion-related blurring, and ringing artifacts. The diffusion-weighted imaging (DWI) data provided by HCP were publicly available with preprocessing to reduce motion, susceptibility distortions, gradient-nonlinearity-induced geometric distortions, and eddy current artifacts [17]. These datasets had 288 diffusion volumes in the acquisition, with 90 gradient directions acquired for each of the three b-value shells (b = 1000, 2000, and 3000 s/mm2), with 18 b = 0 s/mm2 image volumes interspersed, and a spatial resolution of 1.25 mm3.
Figure 1 exhibits the processing pipeline performed for each subject. Primary diffusion data was registered to the T1 structural image using the Functional Magnetic Resonance Imaging of the Brain (FMRIB) linear registration tool (FLIRT) [18]. The T1 structural images were segmented using an initial automatic segmentation with the native Freesurfer Desikan–Killiany–Tourville (DKT) atlas [19]. The developed pipeline can leverage any atlas for the definition of the regions of interest on the T1 exams or any alternative segmentation software. Eddy current correction [20,21] was applied to the registered diffusion data set to correct for current-induced distortions of the BCH population, whereas the HCP cohort already had the eddy correction completed for the publicly available data. Fractional anisotropy (FA) and apparent diffusion coefficient (ADC) maps were generated with dti_recon [22]. HARDI reconstruction was performed on the BCH data to reconstruct the diffusion orientation distribution function (ODF) using odf_recon [22]. Fiber tracking from the reconstructed ODF data and maps from odf_recon was performed using odf_tracker [22] and then transformed into the FreeSurfer output T1 space using the affine transformations previously computed with FLIRT using tract_transform [22]. However, the TrackVis software (version 0.6.1) that was used in our analysis was incapable of performing HARDI reconstruction with the multi-shell datasets, like those found in the HCP data. As a result, a DTI reconstruction was performed on the HCP data using dti_recon [22]. Fiber tracking from the reconstructed DTI maps was performed with dti_tracker [22] and then transformed into the Freesurfer output T1 space using the affine transformations previously computed with FLIRT using tract_transform [22]. The diffusion-based measurements defined below were derived using track_vis [22] by processing the tract file generated against each combination of pairs of segmented ROIs.
The research goal was to derive quantitative fiber characteristics for tracts connecting any two regions of interest (ROIs). ROIs were identified as any region defined in the native Freesurfer Desikan–Killiany–Tourville atlas [19]. Each ROI was paired against every other ROI for the assessment of the possible existence of fiber tracts connecting the two. Multiple diffusion measurements (identified below) were determined for any segmented tracts identified connecting an ROI pair. Asymmetry indexes were derived for a total of 14 measurements per segmented tract. The asymmetry index was defined as the left hemisphere segmented fiber tract measurement of interest divided by the right hemisphere segmented fiber tract measurement of interest. In total, 65,522 intersection points (181 ROIs × 181 ROIs × 2 (origin/terminating and pass-through tracts) were derived across 14 region-to-region measurements. With pass-through tracts, we considered any tracts that passed through the ROI. With origin/terminating tracts, we considered only those tracts that began or ended in a specific ROI. A total of 912,241 measurements were produced per MRI exam. ROIs corresponding to the ventricles and the choroid plexus were excluded from the analysis.
Aggregate measurements were derived for each fiber tract connecting any two regions (see Appendix A for a list of measurements collected). The connectomic measurements produced in this research generated 912,241 features per MRI exam, which enabled subsequent whole-brain univariate statistical analyses to assess the characteristics of the connectomic biomarkers extracted. This technique supports the extraction of data for multiple use cases and provides mechanisms to integrate per-participant data into the results. Those measurements that exhibited the largest effect sizes between gender/sex, as well as the biomarkers most correlated with participant age, were specifically assessed. These summary statistics may act as measures of neural development and may assist in the characterization of fiber tract maturation.
The software implemented for this study is open-source and publicly available under the Massachusetts Institute of Technology (MIT) License. Interested researchers can access and download the source code from the corresponding GitHub repositories from https://github.com/dmattie/aircrush (accessed on 1 July 2021) and a compantion package at https://github.com/dmattie/aircrush-core-operators (accessed on 1 July 2021). The MIT License permits the use, modification, and distribution of the software, offering the scientific community a legal framework to collaboratively improve and extend the utility of the computational tools developed in this study.

3. Results

A summary of effect size, which compares sexes by measurement type in the BCH cohort, is provided in Table 1. Overall, there were more similarities than differences, where most measurements showed no effect or a small effect. The fractional anisotropy (FA) variability was notable here; in the tracts with a significant difference among sexes, females tended to demonstrate higher variability in fractional anisotropy. Figure 2 exhibits the mean fractional anisotropy standard deviation (SD) for tracts connecting the left pallidum and left insular cortex. The variability also increased with age for all the tracts with larger effect sizes. The standard deviation of FA measures the variability in diffusion directionality along the fiber tract being characterized. The standard deviation of the fractional anisotropy along a fiber tract provides a highly localized measurement of microstructural architecture and is addressed further in the discussion. A similar example of sex dimorphism of fractional anisotropy between tracts connecting the left medial orbitofrontal white matter and left middle temporal white matter regions can be found in Figure 3.
Figure 4 illustrates the mean fractional anisotropy of tracts between the left paracentral cortex and the left precuneus cortex. The tracts exhibited a pattern of initial growth followed by a plateau phase. To model this relationship, we applied both second- and third-order polynomial regression and locally estimated scatterplot smoothing (LOESS) to our data. The LOESS model provided the best fit as determined by having the minimum residual standard error. To identify the inflection points, we calculated the second derivative of the fitted LOESS curve. Inflection points were identified as the ages at which the second derivative of the mean FA with respect to age crossed the zero boundary, indicating a change in the concavity of the fitted curve. These inflection points were determined to be at ages 8.2, 9.1, and 13.3. This could imply that the participants reached a maturational milestone detectable by tract-localized fractional anisotropy by late childhood and should be investigated as part of future longitudinal analyses.
Regional differences were detected in our measurements when assessing the effect size between the sexes. Table 2 highlights the leading measurements exhibiting the largest sex-based effect sizes. In most cases where sex differences existed, a greater average fractional anisotropy in females was observed. Females demonstrated the largest mean FA in tracts extending from the left medial orbitofrontal region (Cohen’s d = −0.495) relative to males. Overall, the majority of effect sizes between sexes were small or negligible.
The effect size of the standard deviation of the apparent diffusion coefficient (ADC) represents the variability of the ADC between males and females along any specific tracts connecting two brain regions. In most cases, there was a negligible difference between genders, with a small overall average effect size of 0.09. The greatest difference was found in higher female ADC variability between the left transverse temporal and left insular regions. Some variation with age was observed in the right pars orbitalis. For the most part, however, variability with age was not observed for those tracts with the largest effect sizes between males and females.
Females demonstrated higher variability in fractional anisotropy in cases where there was a significant difference between the sexes. The variability was also shown to increase with age for all the tracts with larger effect sizes.
Notably, there were substantial differences between males and females in the asymmetry of the variability of directional diffusion (SD FA) along hundreds of specific pathways. Supplementary File S2 lists 51 tracts with an effect size greater than 0.5. Supplementary File S3 presents a more comprehensive list of the largest effect sizes for each measure.
The correlations between participant age and each of the derived measurements across all ages were calculated. Measurements with a high correlation with participant age may represent developmental biomarkers that may have utility in the assessment of neurological maturation.

3.1. BCH Biomarkers

Age-correlated data points where more than 80% of participants had measurable data uncovered 139 fiber tracts within the BCH dataset with a Pearson correlation above 0.5. These tracts are identified in Supplementary File S1. Table 3 identifies the leading correlations of connectomic measurements with age, with Figure 5 and Figure 6 exhibiting scatter plots of representative examples. Table 4 identifies the leading sex-based differences in hemispheric asymmetry for each our connectomic measurements.

3.2. HCP Biomarkers

The HCP biomarkers were extracted and assessed for their correlation with subject age (Table 5). No biomarker measurements demonstrated a strong correlation with age, potentially implying that the biomarker maturational measurements extracted had largely stabilized by early adulthood. Measurement correlations were typically found to be weak or not correlated with the leading r values from the HCP data presented in Table 5. The differences in the strengths of correlations, when compared with the younger BCH datasets, strengthened the literature evidence [12,23,24,25], suggesting that healthy individuals undergo rapid brain maturation in earlier life stages and the brain largely matures as subjects become young adults in terms of the biomarkers under consideration.

4. Discussion

This study analyzed two participant groups totaling 809 neurologically healthy participants and provided detailed measurement results of diffusion characteristics of pathways between all ROI pairs. We investigated tract development to understand the variation in measurements and hemispheric asymmetry among subjects’ ages and sex. The data derived from this study are both revealing and novel. We found patterns of differential development between males and females and uncovered 170 fiber tracts that may be useful in assessing developmental maturation. Overall, the similarities between males and females far outweighed the differences; however, in some cases, we observed substantial sex differences, representing a potentially important baseline from which to establish healthy growth trajectories, facilitating studies that identify abnormal brain development associated with a variety of pathological conditions as departures from healthy sex-specific neural development. These findings are consistent with previous studies of sex differences in white matter maturation [26,27].
We found a strong age correlation with the mean fractional anisotropy of the tract connecting the right putamen and the right insula. Theoretically, increases in average FA imply more directed diffusion along the fiber pathway identified, which is a phenomenon that may be partially indicative of underlying pruning associated with healthy tract development, whereby the removal of tissue through pruning may contribute to more directed diffusion along the pathway. This is supported by research conducted by Gogtay et al. [28] and Schmithorst and Yuan [29]. As the two example regions develop toward improved task coordination, those pathways not helpful for regional coordination may be pruned away by natural developmental processes, which may be reflected in the measurements acquired.
Prior research [30] highlighted the role of the insula and putamen-centered functional connectivity in cognitive fatigue experienced by participants subjected to multitasking conditions. Our study identified structural connections between the insula and putamen and may suggest a possible anatomical basis for the functional connectivity findings previously reported. Future studies could investigate whether the measurements we acquired signify brain development correlated with enhanced motor control. Subsequent studies could also explore diffusion metrics of pathways connecting other brain regions to assess their potential association with a variety of developmental milestones, such as coordination or language acquisition, as well as pathological conditions.
In some cases, we found statistically significant sex differences, representing an important baseline from which to establish healthy growth trajectories and facilitating studies that identify abnormal brain development associated with various pathological conditions as departures from healthy sex-specific neural development. In the current study, we observed sex differences in the microstructure of white matter by examining the variability in fractional anisotropy. Specifically, our findings indicate an overall higher standard deviation in FA among females. This observation is consistent with previous research that demonstrated sexual dimorphism in white matter [31]; however, our study extended these findings by also focusing on the variability of FA values in addition to mean FA levels. This previous work [31] primarily reported on mean FA differences in targeted tracts, with a higher FA observed in the corpus callosum in females and variations linked to the lingual gyrus in males, for example. Our approach highlights the importance of considering the full distribution of measured values when assessing sexual dimorphism in neural architecture. While volumetric differences were suggested as potential confounders in the interpretation of FA results, our study’s observations of FA variability provide a unique contribution to the understanding of white matter variability. Though we did not consider volume, it is acknowledged that volumetric differences may influence mean FA values [32], yet the impact of these differences on the variability of FA has not been widely explored.
Measurements such as tract count and length depend on the directional diffusion pulse sequence selected and analytic choices in fiber tracking, such as seeding. Each pulse sequence has several parameters, such as the time to echo, field of view, and flip angle, which when combined affect the tissue contrast and spatial resolution. We attempted to control this technical variation in two ways. First, we employed a standardized set of MRI diffusion pulse sequences and tractographic analytic approaches for each of our cohorts. Second, we introduced the tract count and tract length (mean and variability) asymmetry biomarkers, which have the potential to overcome some of the standardization problems across diffusion acquisition and tractographic analytic techniques. The reliability of this biomarker in assessing varying acquisition and analytic methods warrants further investigation.
Our study’s reliance on cross-sectional data presents certain limitations. While this approach allows for the analysis of data from a wide range of participants at a single point in time, it inherently restricts our ability to observe how neurodevelopmental measures in individuals change over time. Future work will involve extending these findings to longitudinal analyses.
We identified inflection points at ages 8.2, 9.1, and 13.3 of changes in mean fractional anisotropy between tracts connecting the left paracentral cortex with the left precuneus cortex. It is important to acknowledge the inherent variability and potential limitations within our data. While the LOESS model provided an approach for identifying trends within the data, the precision of the identified inflection points is subject to inherent variability and noise. Specifically, fractional anisotropy can be influenced by factors such as individual biological variability, measurement error, and the resolution of diffusion-weighted imaging. We recommend viewing these findings as indicative rather than conclusive.
Specific details regarding the coil sizes used for different participants in our BCH cohort data are not available. This limitation stems from constraints in data accessibility, as the coil size information was not retained during the data collection phase. The absence of this information presents a limitation to our study, as coil size can influence the signal-to-noise ratio [33], thereby affecting the quality and comparability of the imaging data.

5. Conclusions

We used MRI to measure the diffusion-related properties of hydrogen protons in motion throughout the white and gray matter of 642 MRI examinations of neurologically healthy subjects between the ages of 0.7 and 23.5 years, as well as a young adult population of 167 MRI examinations aged 22–36+ years. Several measurements (e.g., fractional anisotropy and apparent diffusion coefficient) were used to model the streamlines of fiber tracts localized to every combination of region pairs in the Desikan–Killiany–Tourville (DKT) atlas. We found several instances where our measurements may be helpful in characterizing physiological and anatomical changes that may be linked with healthy brain maturation. In some cases, we observed statistically significant sex differences, representing a potentially important baseline from which to establish healthy growth trajectories, facilitating studies that identify abnormal brain development associated with a variety of pathological conditions as departures from healthy sex-specific neural development. Our software packages https://github.com/dmattie/aircrush (accessed on 1 July 2021) and https://github.com/dmattie/aircrush-core-operators (accessed on 1 July 2021) facilitate the extraction of a wide variety of biomarkers, many of which are not available from alternative software packages. Additionally, assessing correlations between these regional fiber tract measurements and any participant characteristic included in analyses and complementary datasets (e.g., intelligence quotient (IQ) and disease status) has tremendous potential for the study of human neurodevelopment.

Supplementary Materials

The following supporting information can be downloaded from https://www.mdpi.com/article/10.3390/info15010066/s1, Supplementary File S1: Age correlation to tract measurements captured between regions. Only those tracts detected in at least 80% of the subject population were considered; Supplementary File S2: Effect size of the Asymmetry Index of STD FA; Supplementary File S3: Leading effect sizes by measurement.

Author Contributions

Conceptualization, D.M. and J.L.; methodology, J.L. and E.T.; software, D.M. and Z.F., validation, D.M. and J.L.; formal analysis, D.M.; investigation, D.M.; resources, J.L. and E.T.; data curation, D.M.; writing—original draft preparation, D.M.; writing—review and editing, J.L.; visualization, D.M.; supervision, J.L. and L.P.C.; funding acquisition, J.L. and E.T. All authors have read and agreed to the published version of the manuscript.

Funding

This study was financially supported by the National Institutes of Health grants R01HD078561, R21MH118739, and R03NS091587 to E.T. This study was also financially supported by a Canada Foundation for Innovation grant, a Nova Scotia Research and Innovation Trust grant, a St. Francis Xavier University research startup grant to J.L., and a Compute Canada Resource Allocation Grant to J.L. Data were provided (in part) by the Human Connectome Project, WU-Minn Consortium (principal investigators: David Van Essen and Kamil Ugurbil; 1U54MH091657), funded by the 16 NIH Institutes and Centers that support the NIH Blueprint for Neuroscience Research and by the McDonnell Center for Systems Neuroscience at Washington University.

Institutional Review Board Statement

All research conducted in this study was performed in accordance with the ethical principles outlined in the Declaration of Helsinki and approved by the Boston Children’s Hospital (BCH) Institutional Review Board (IRB) at BCH (IRB-P00032682). Ethics approval was obtained from Boston Children’s Hospital ethics committee/IRB for this retrospective analysis.

Informed Consent Statement

Informed consent was waived due to the lack of risk to the study participants.

Data Availability Statement

The data generated and/or analyzed from the Boston Children’s Hospital cohort are not publicly available due to IRB restrictions on exporting raw protected health information. Dr. Jacob Levman was responsible for curating the Boston Children’s Hospital dataset [24,31]. He can be contacted with any questions regarding the dataset at [email protected] or [email protected].

Conflicts of Interest

Dr. Levman is the founder of Time Will Tell Technologies, Inc. The authors declare no competing financial interest.

Appendix A

Whole brain measurements:
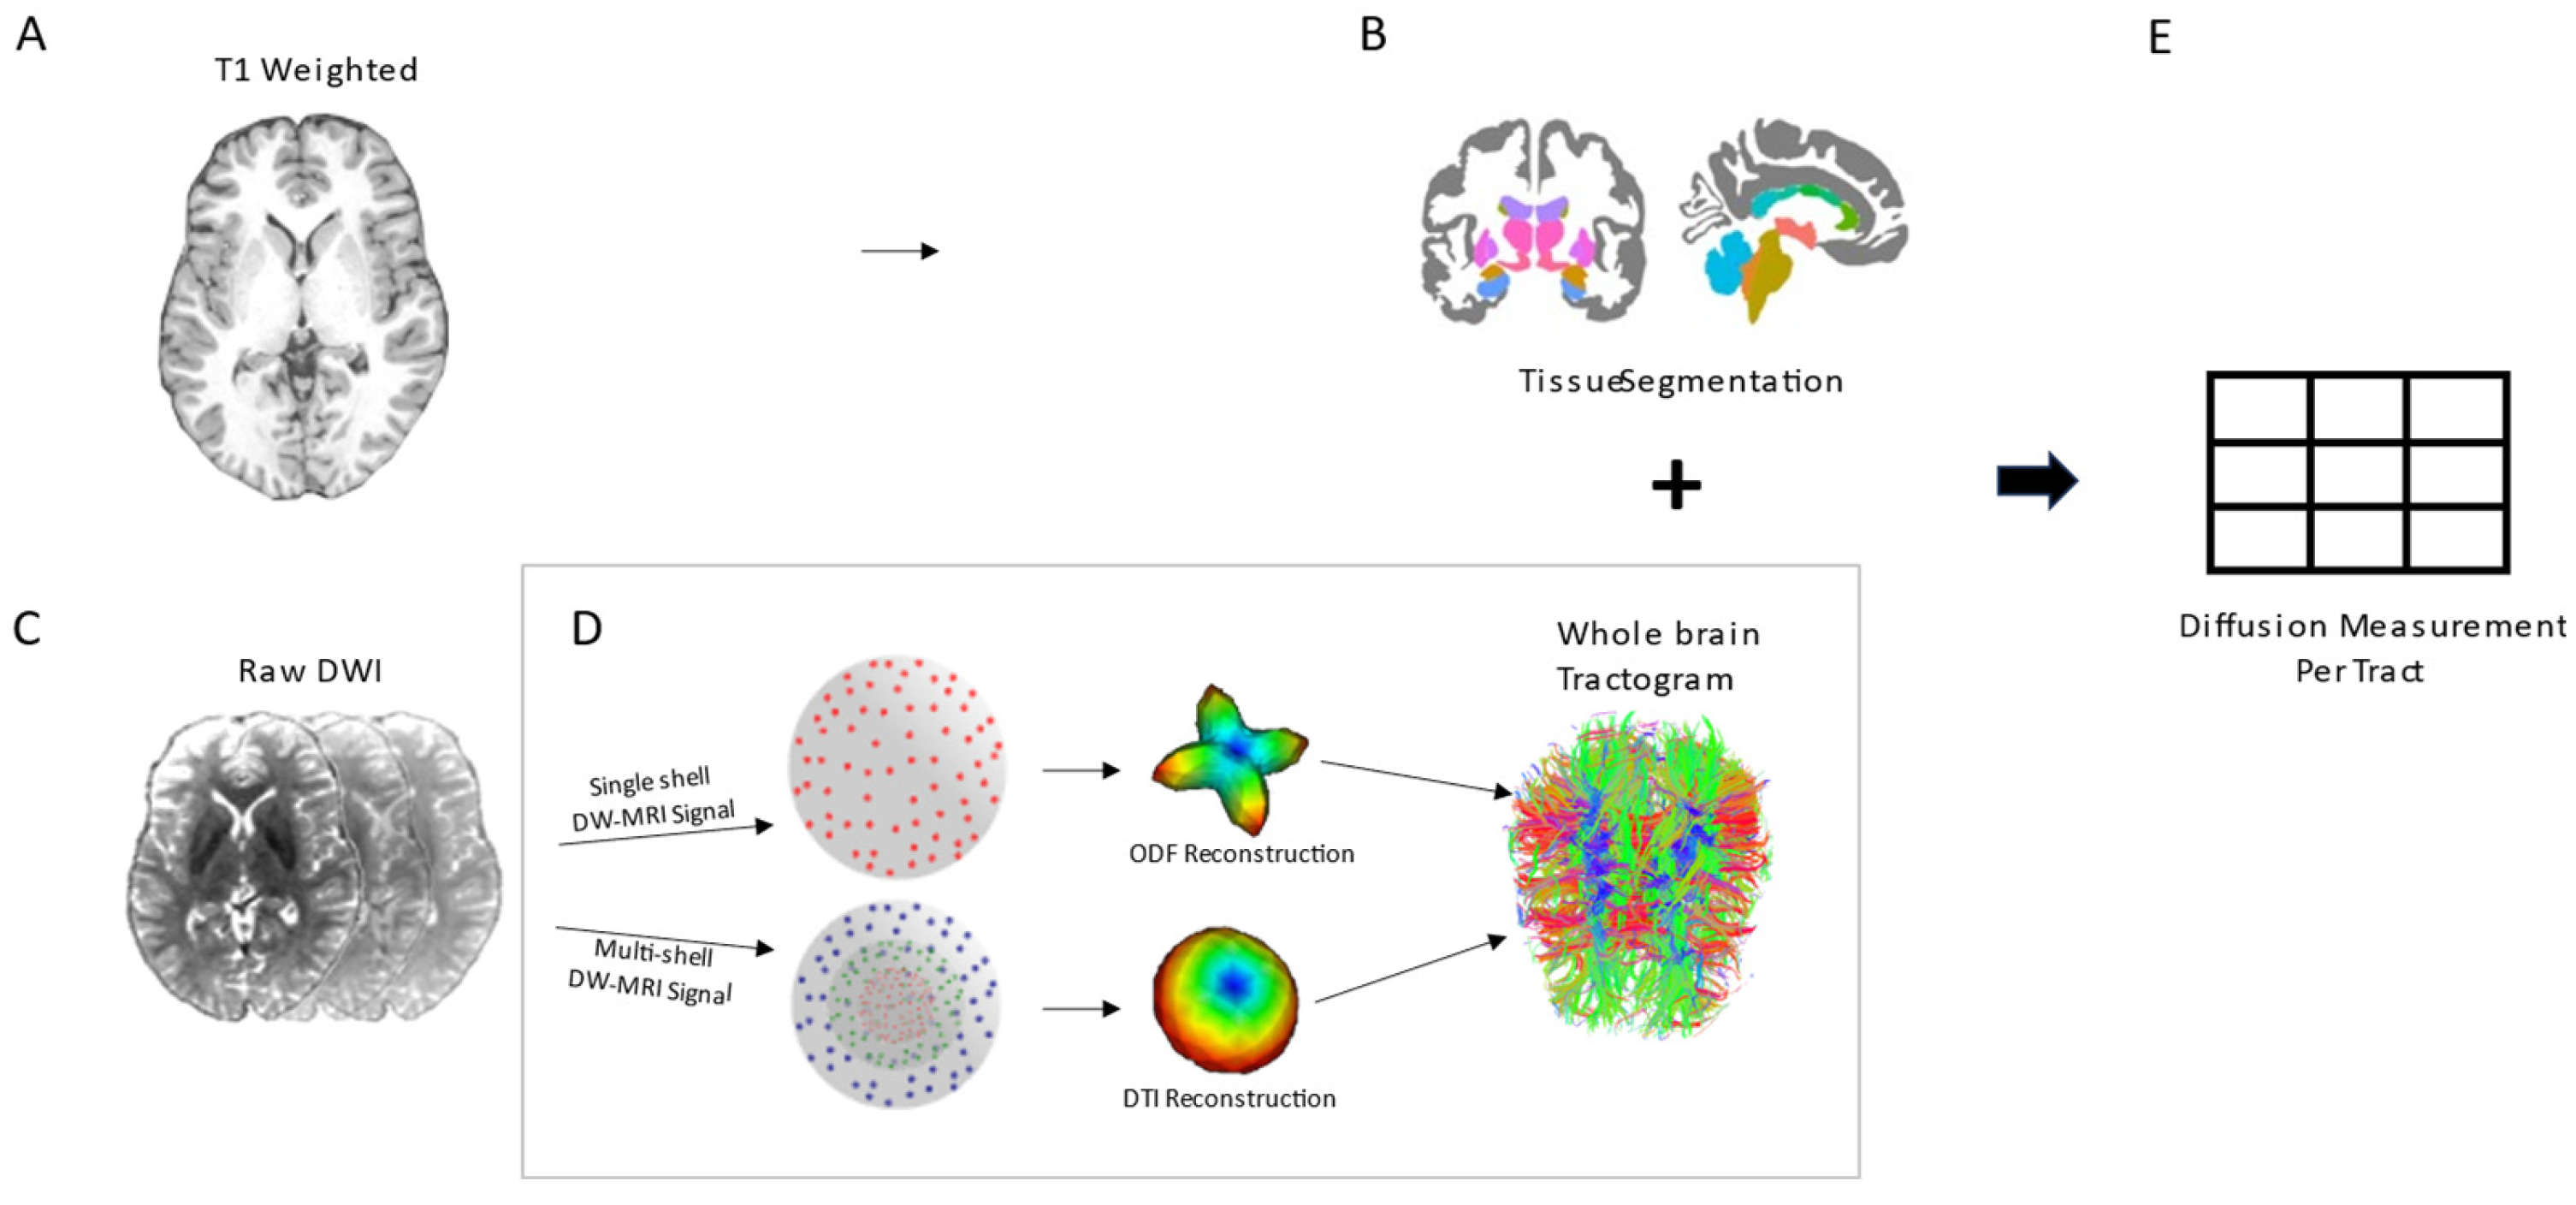
  • Number of tracts detected within the connectome.
Derived measurements per tract:
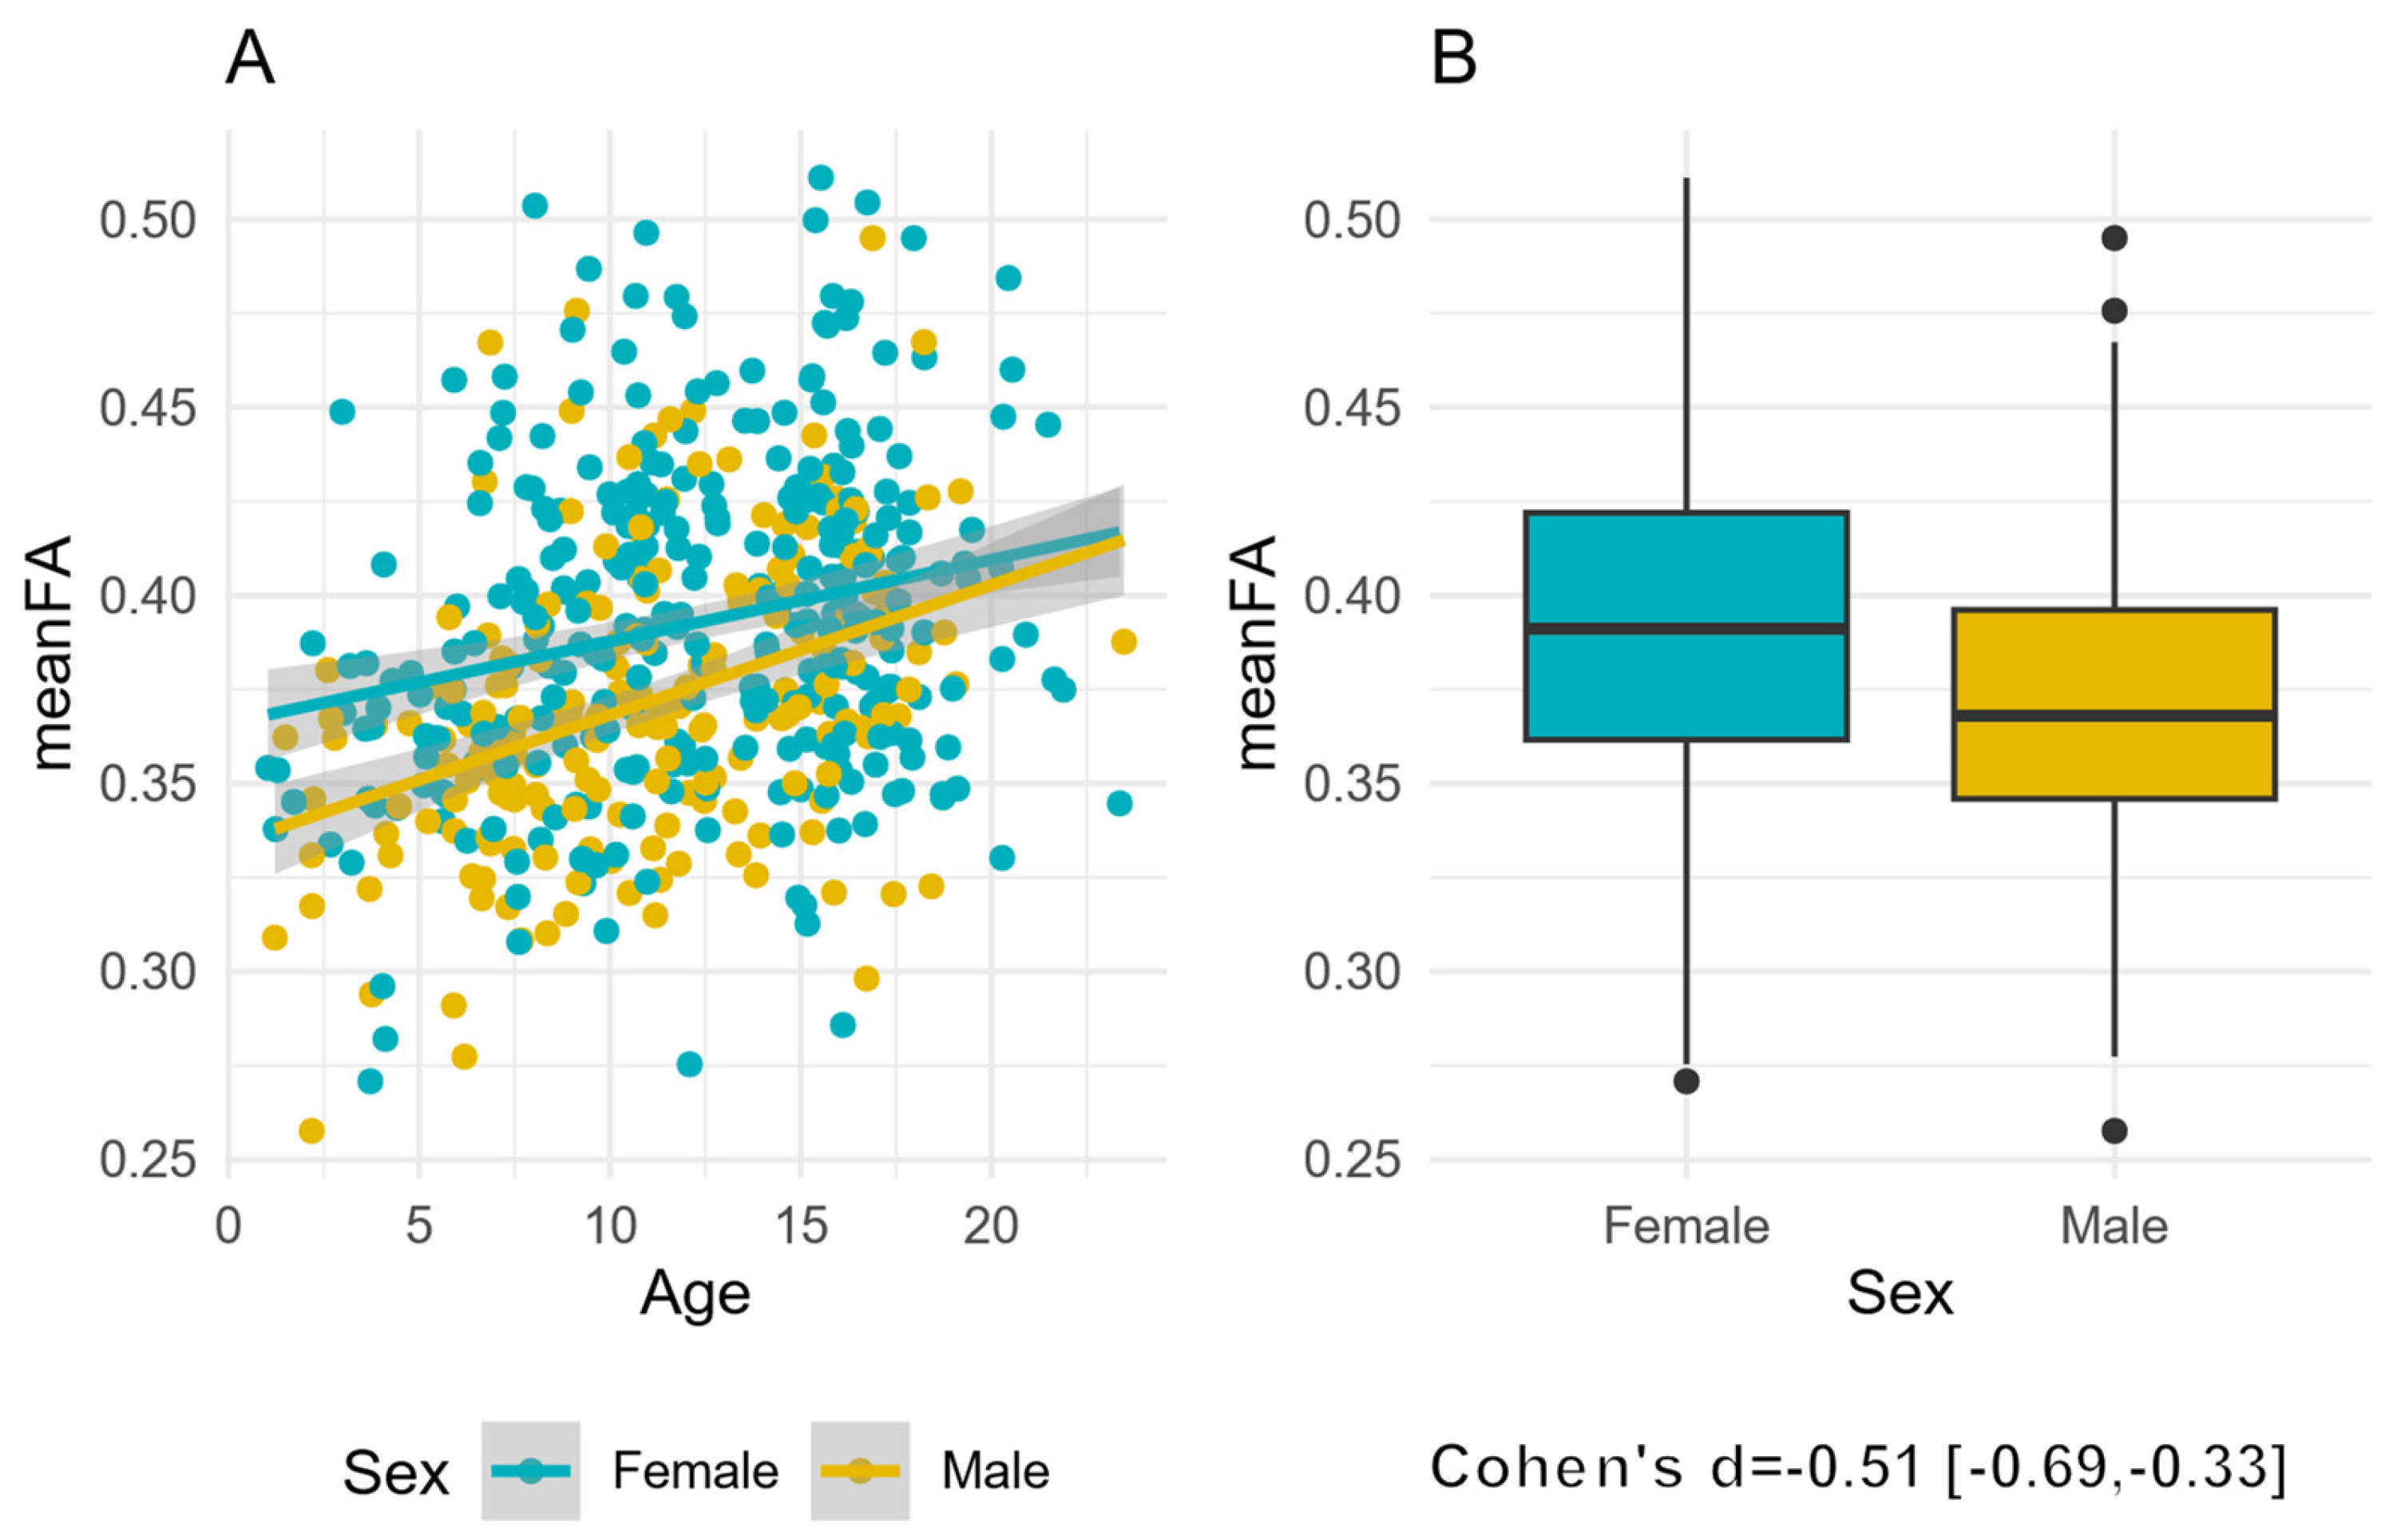
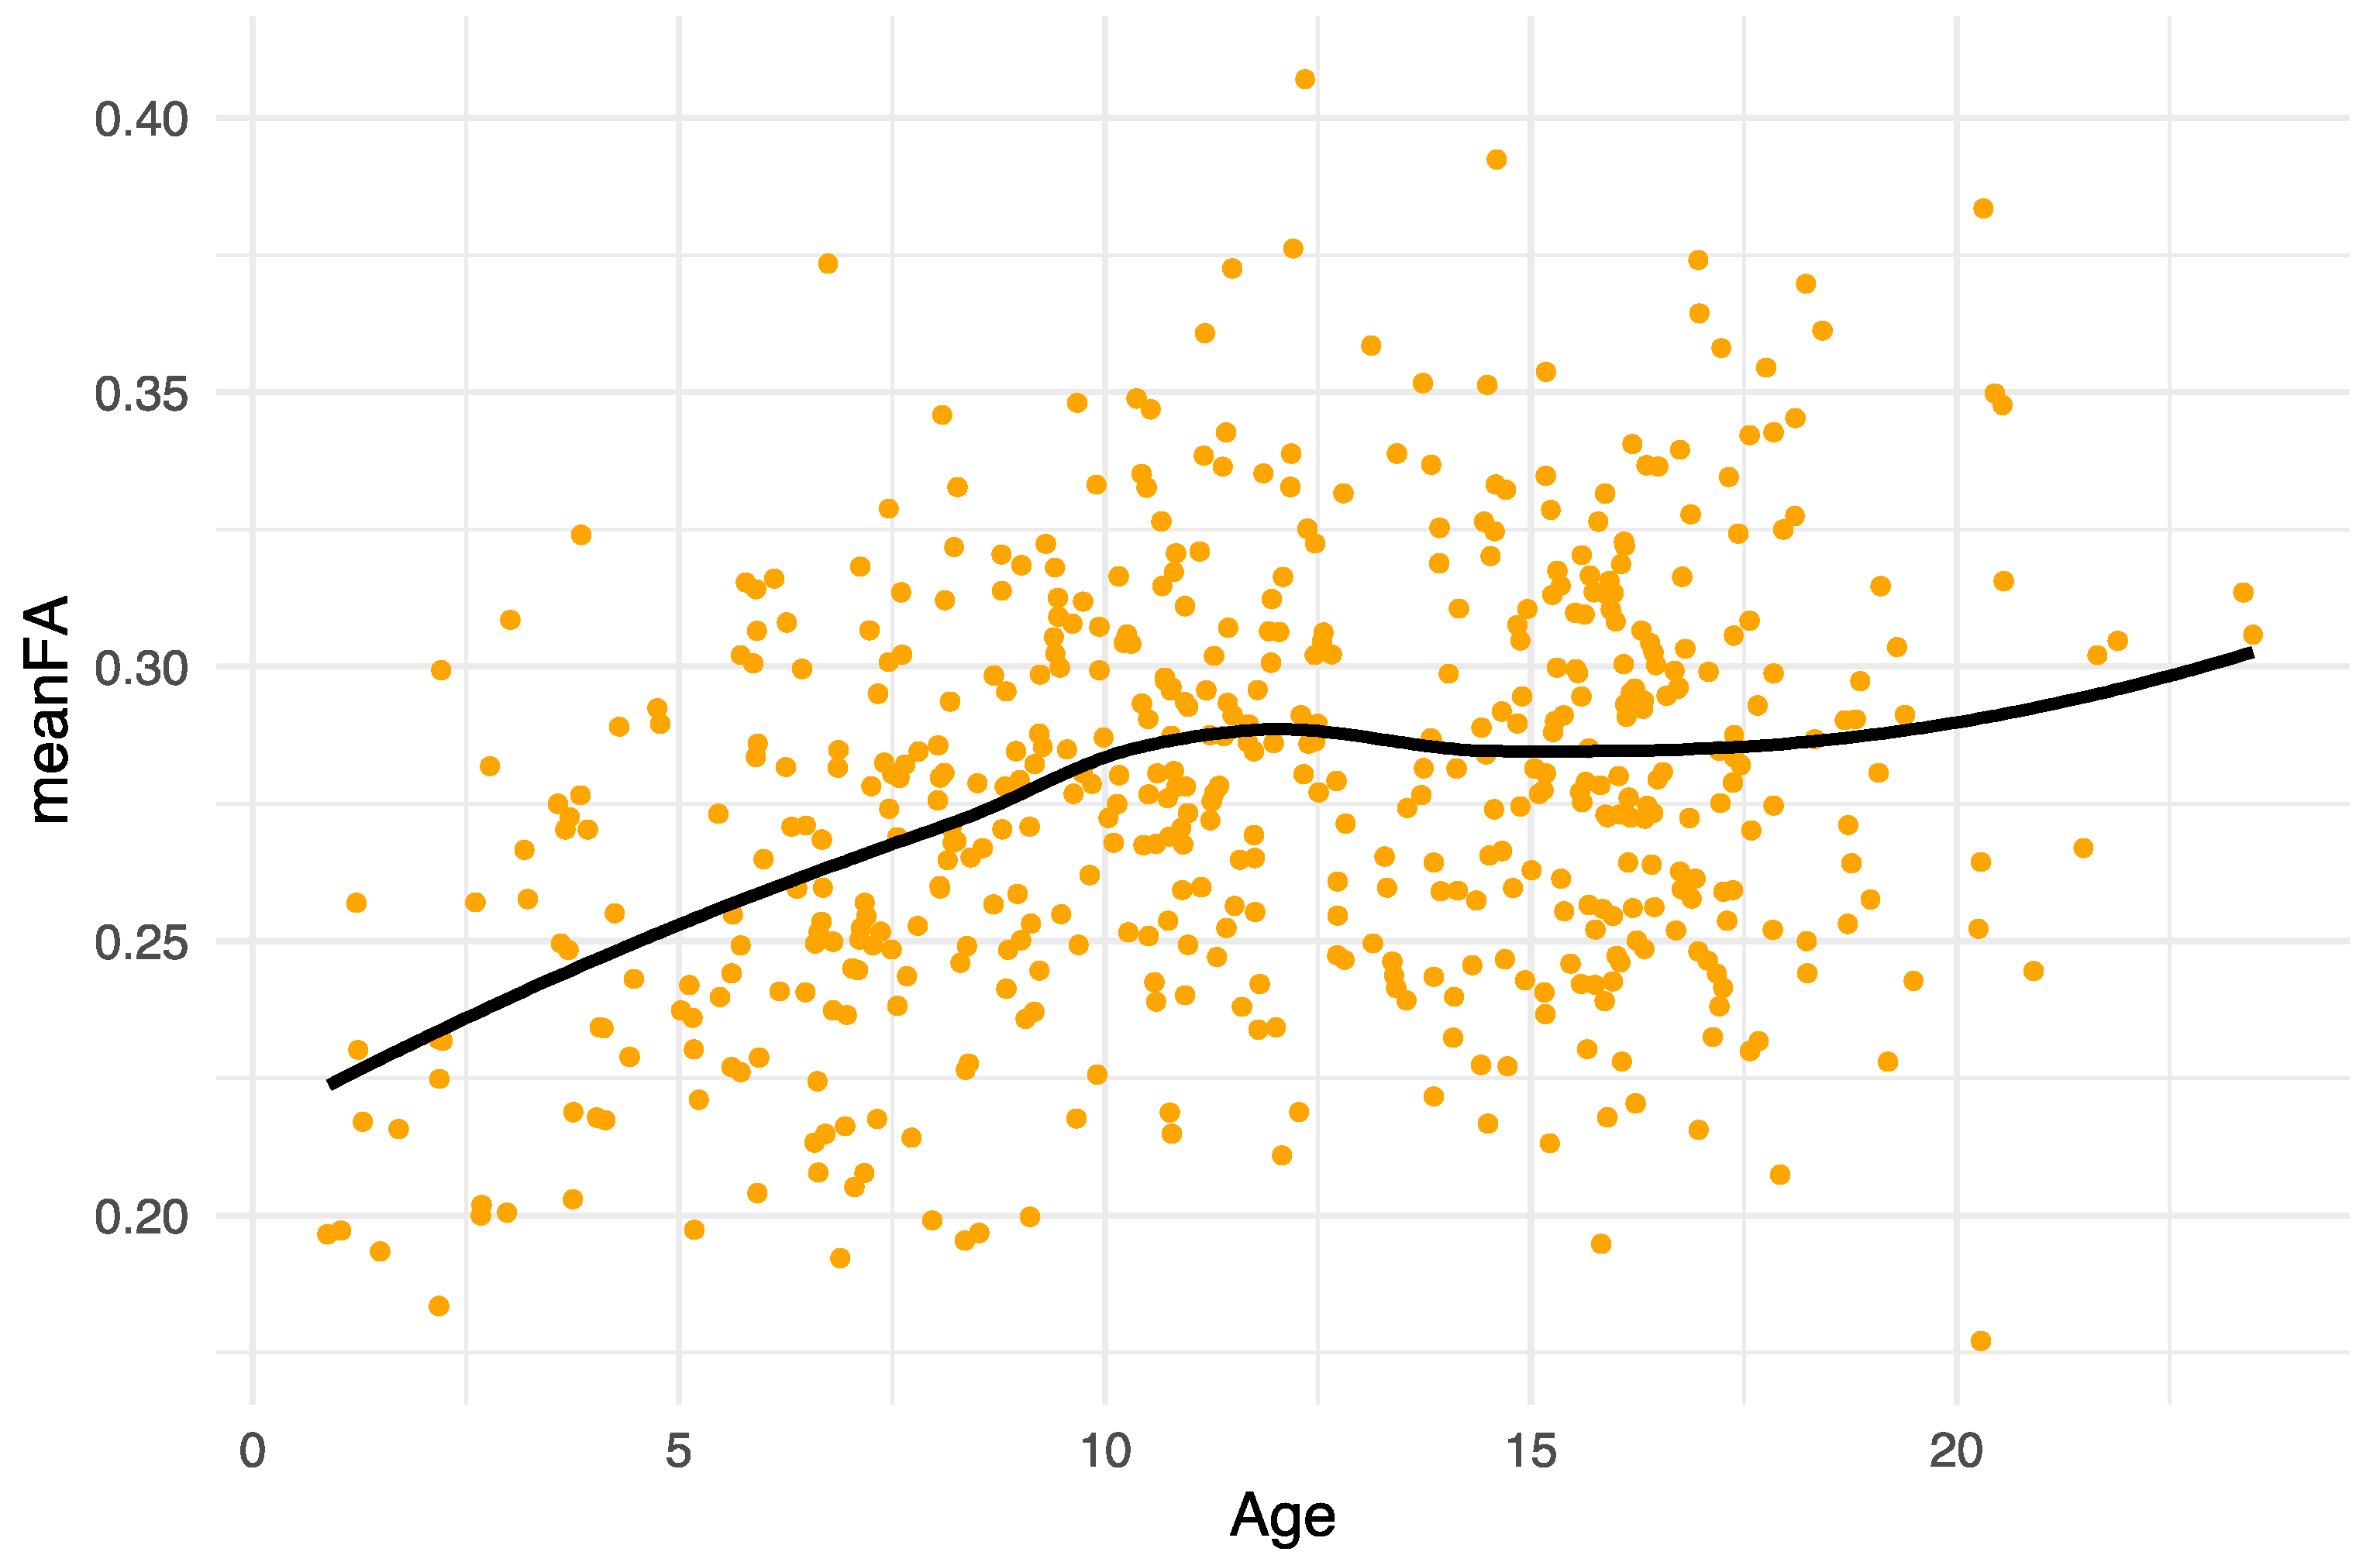
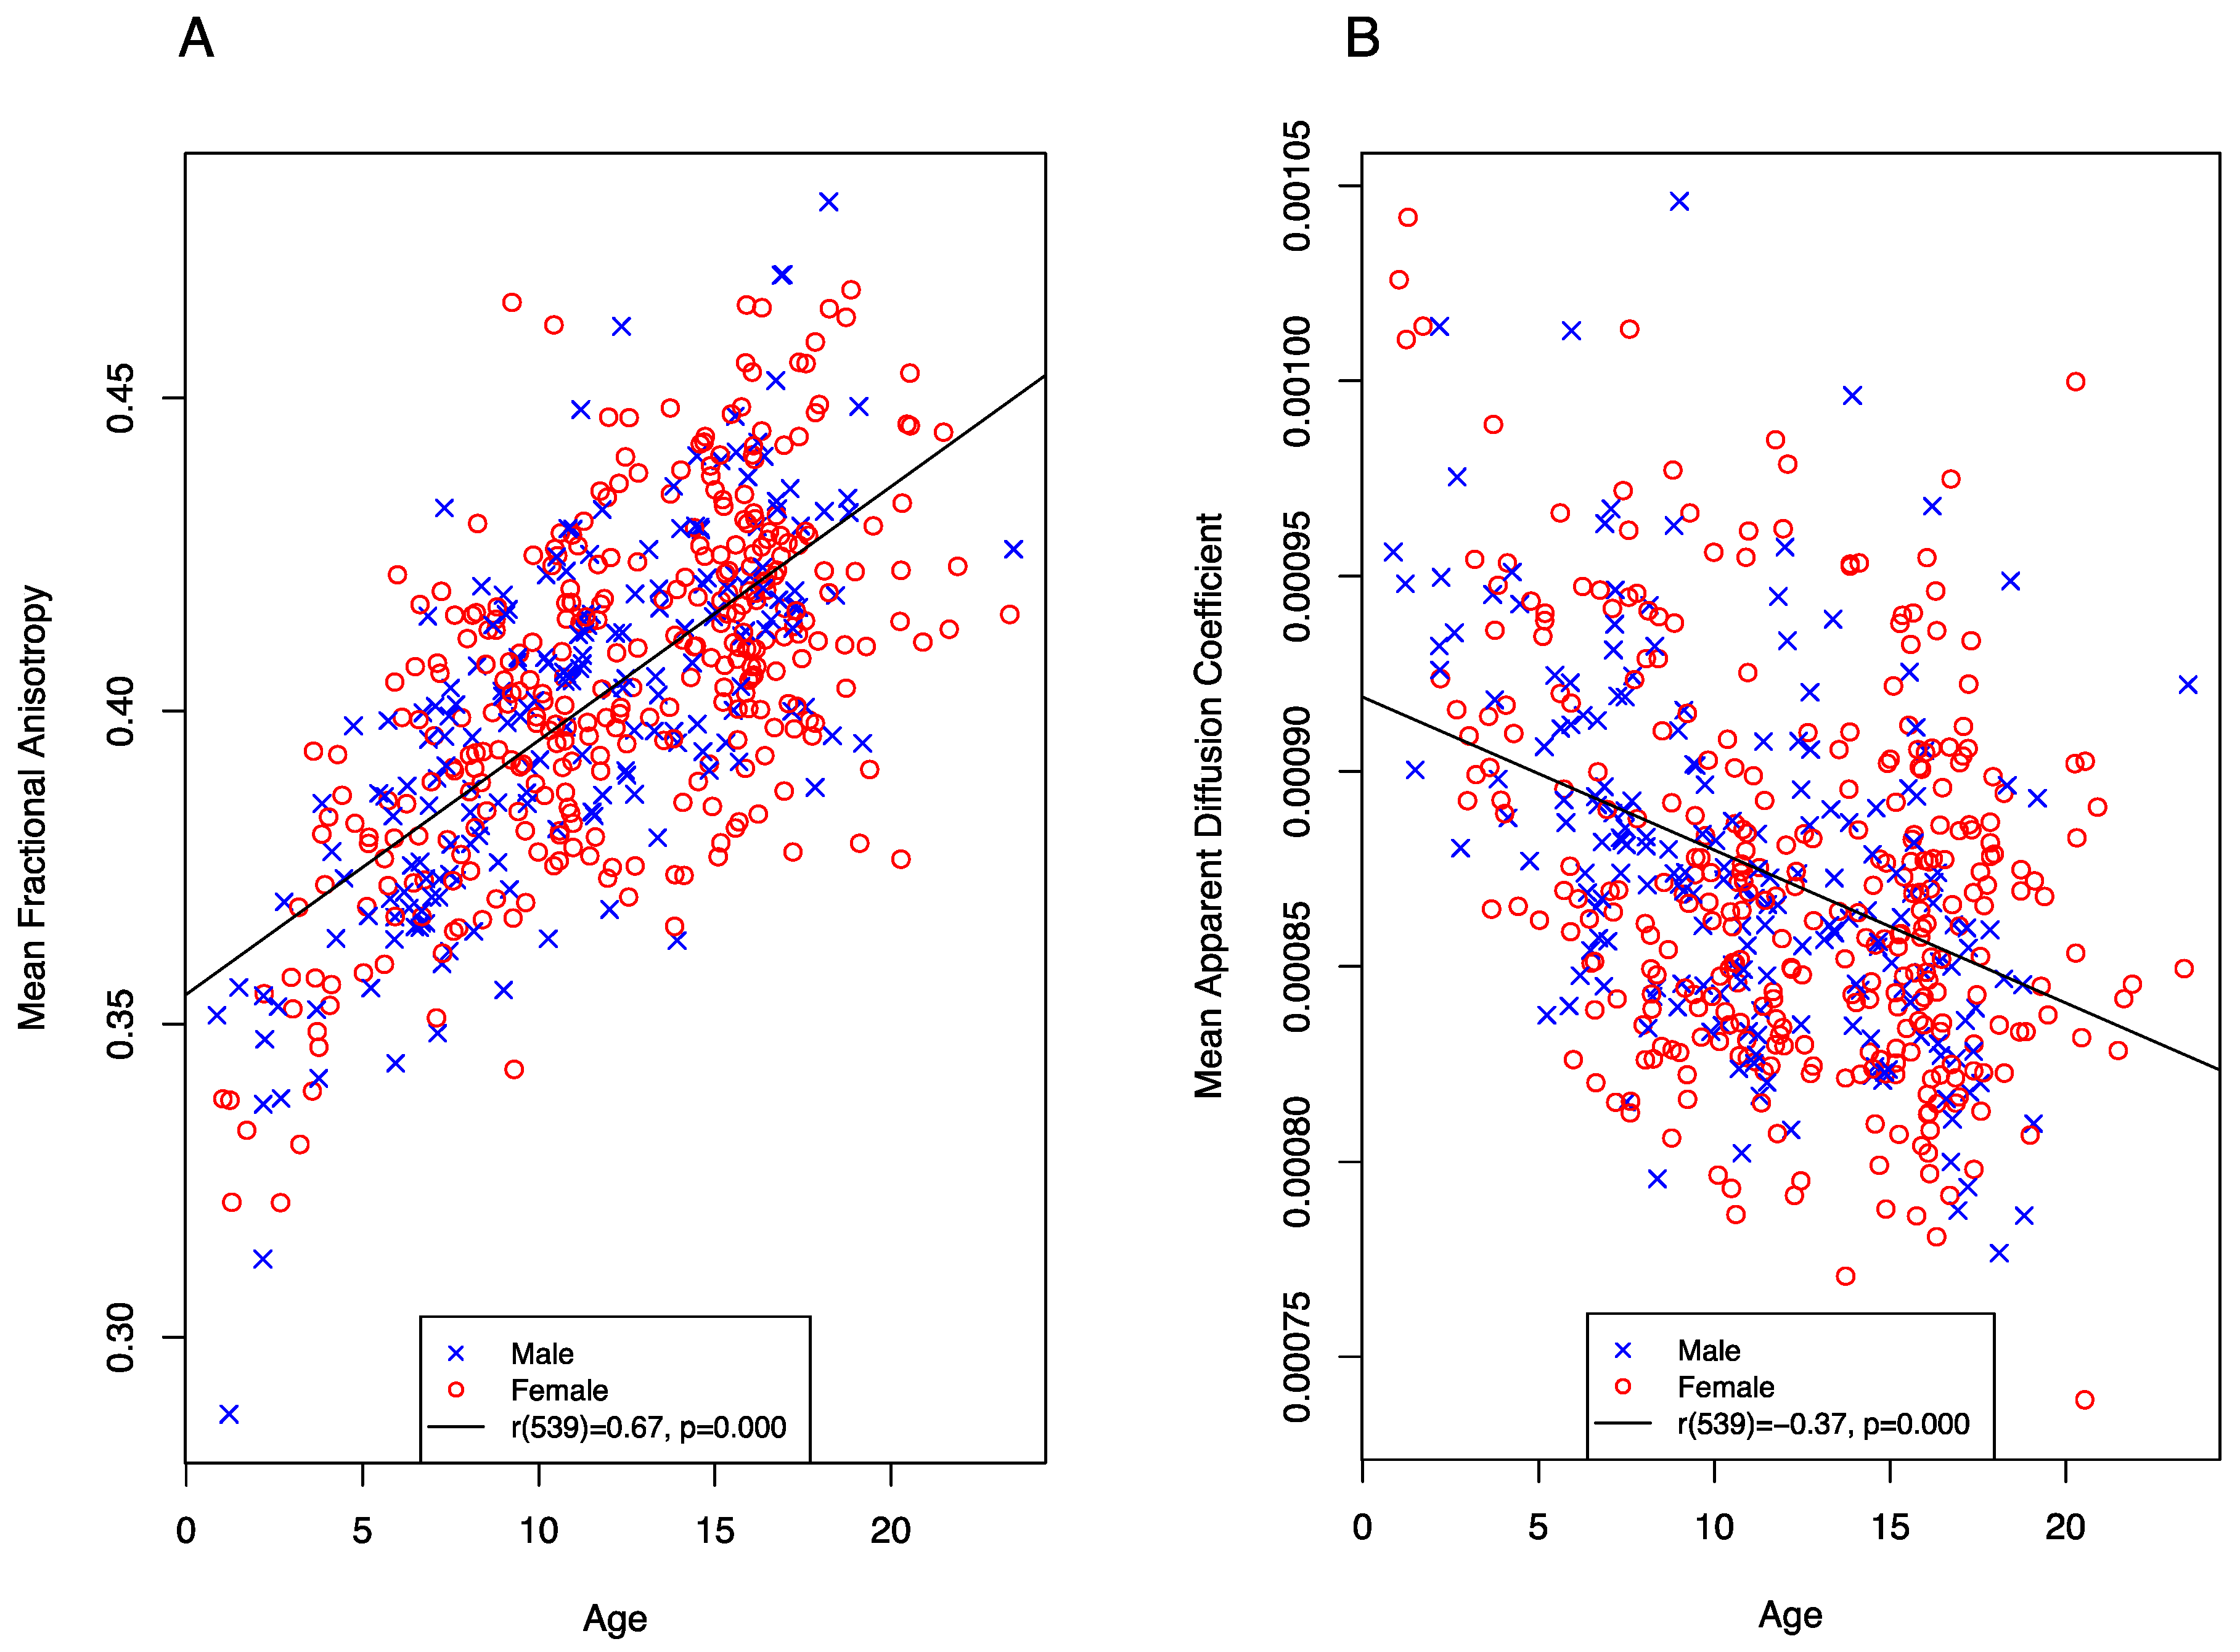
  • Mean fractional anisotropy (FA) is a measure of diffusion directionality. It represents an average of the fractional anisotropy measurement for a specific tract detected between two regions of interest.
  • Mean apparent diffusion coefficient (ADC) is a measure of the average of the ADC.
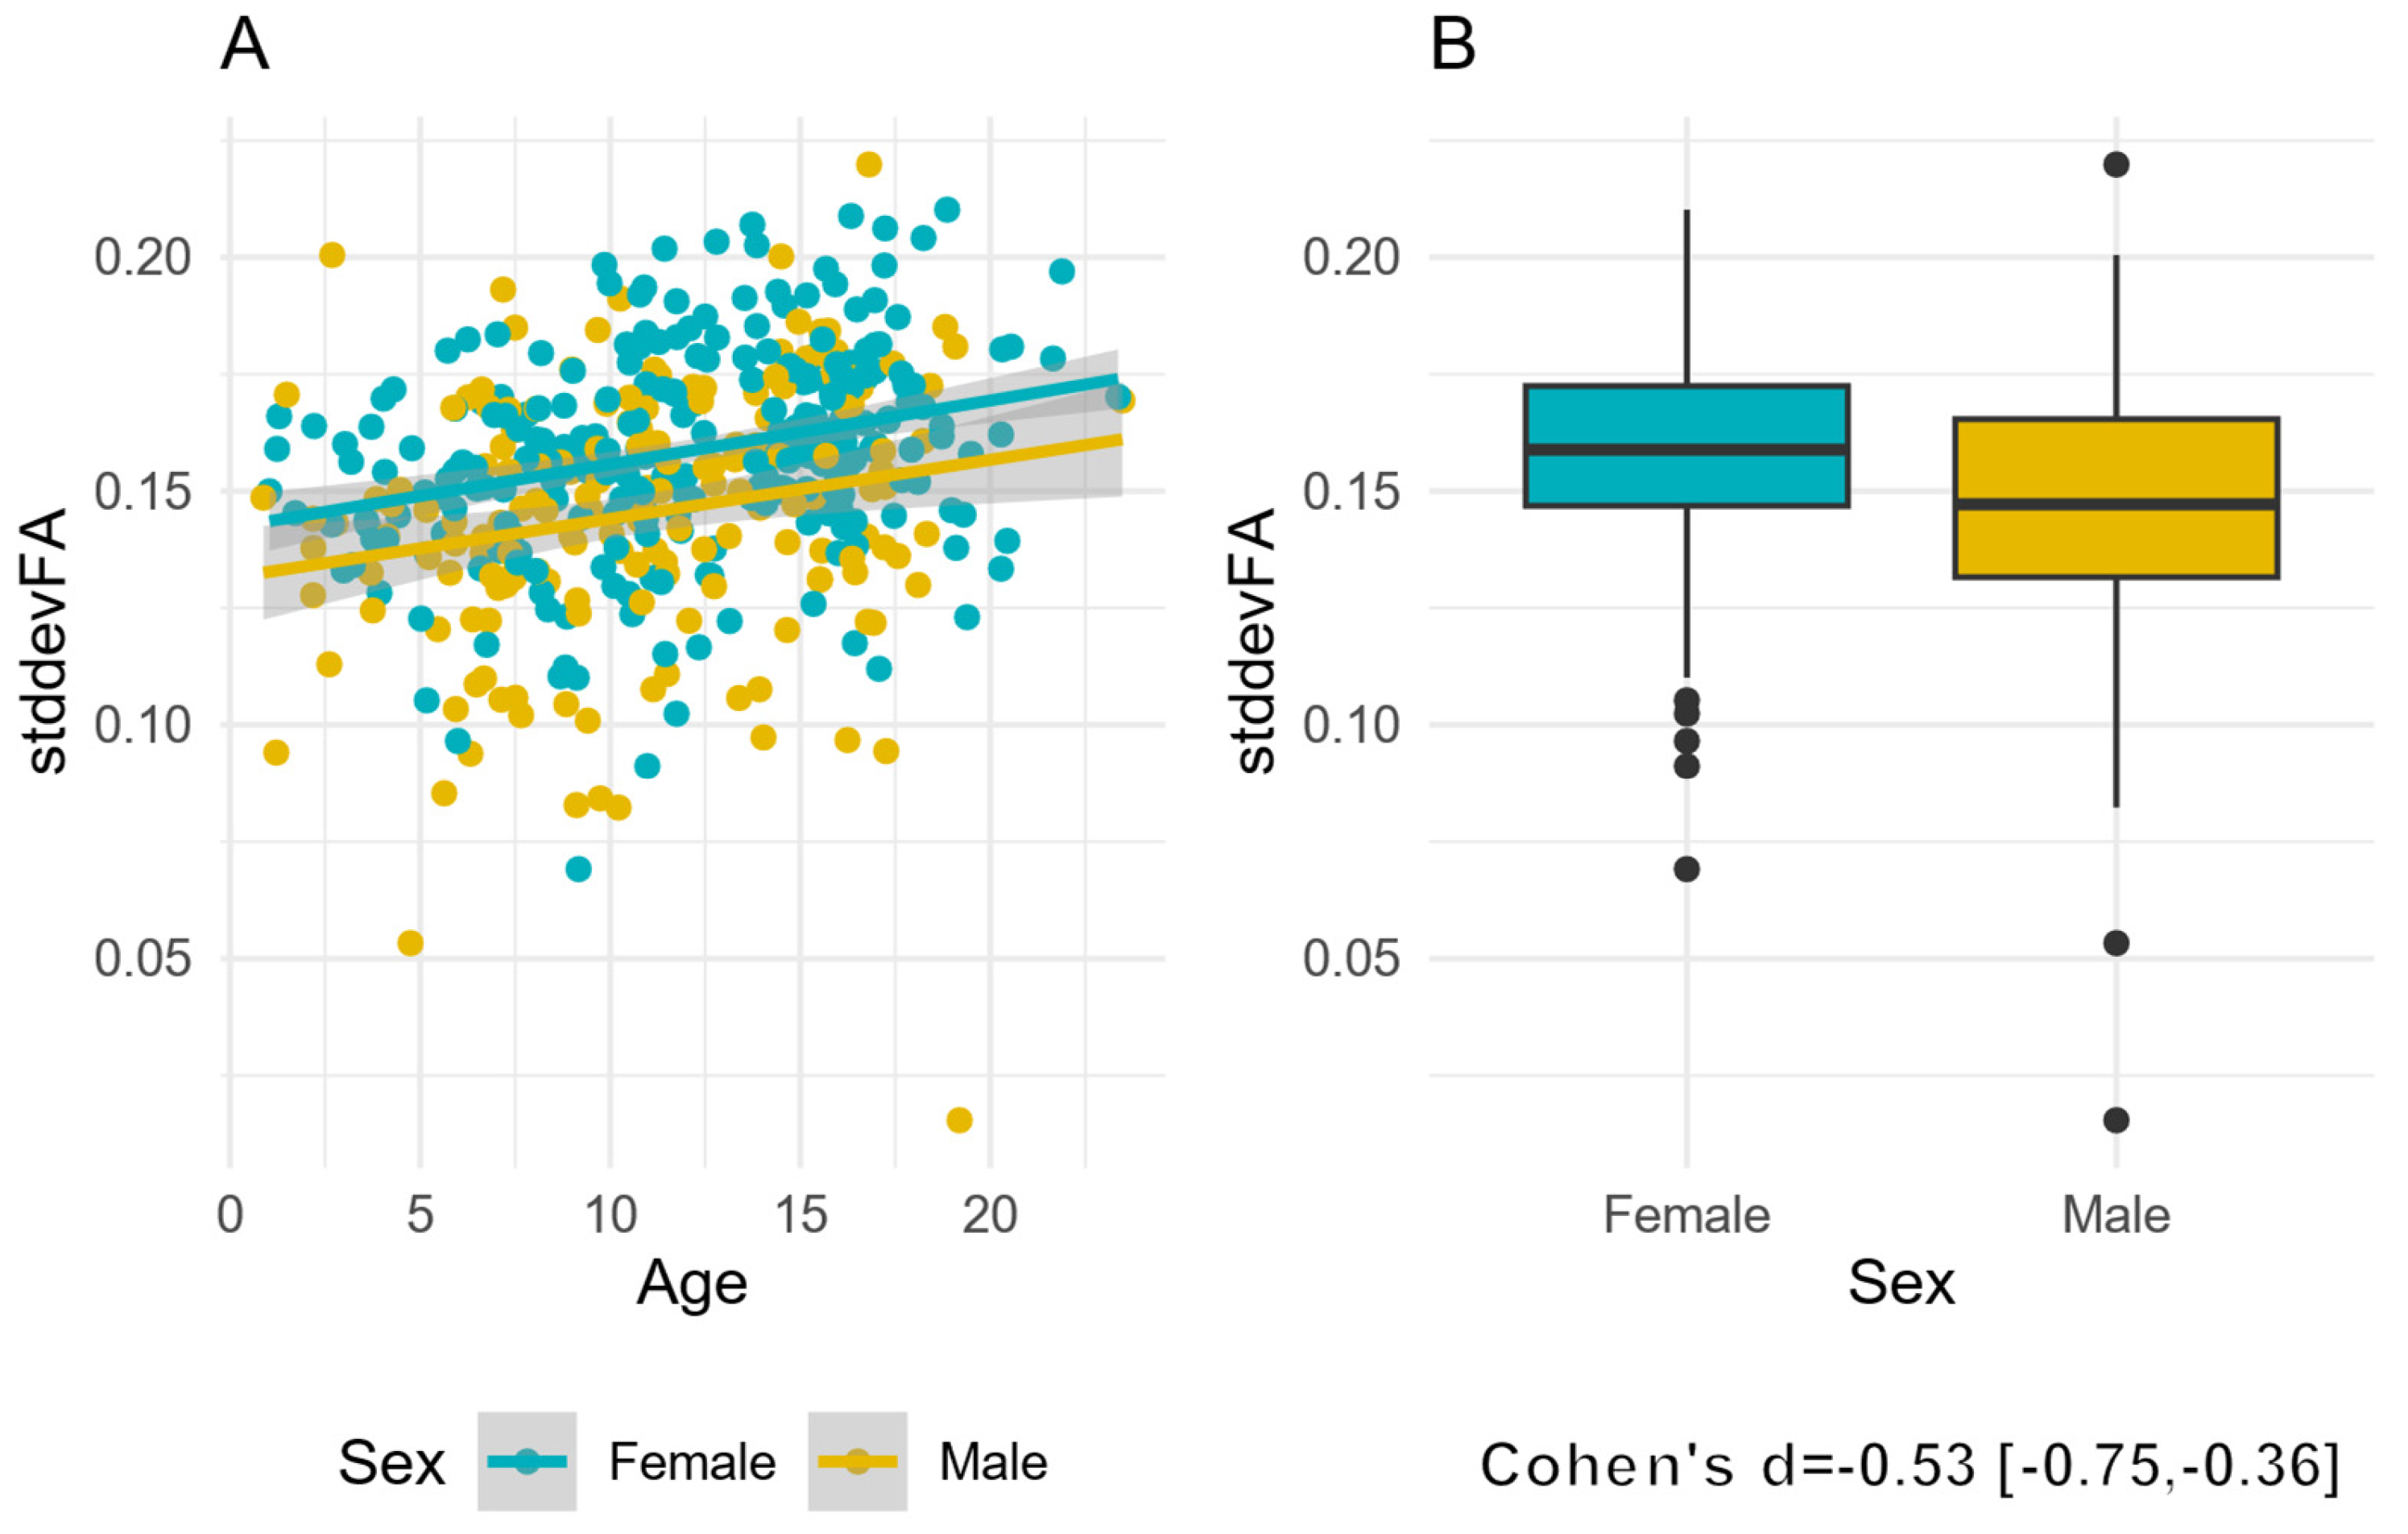
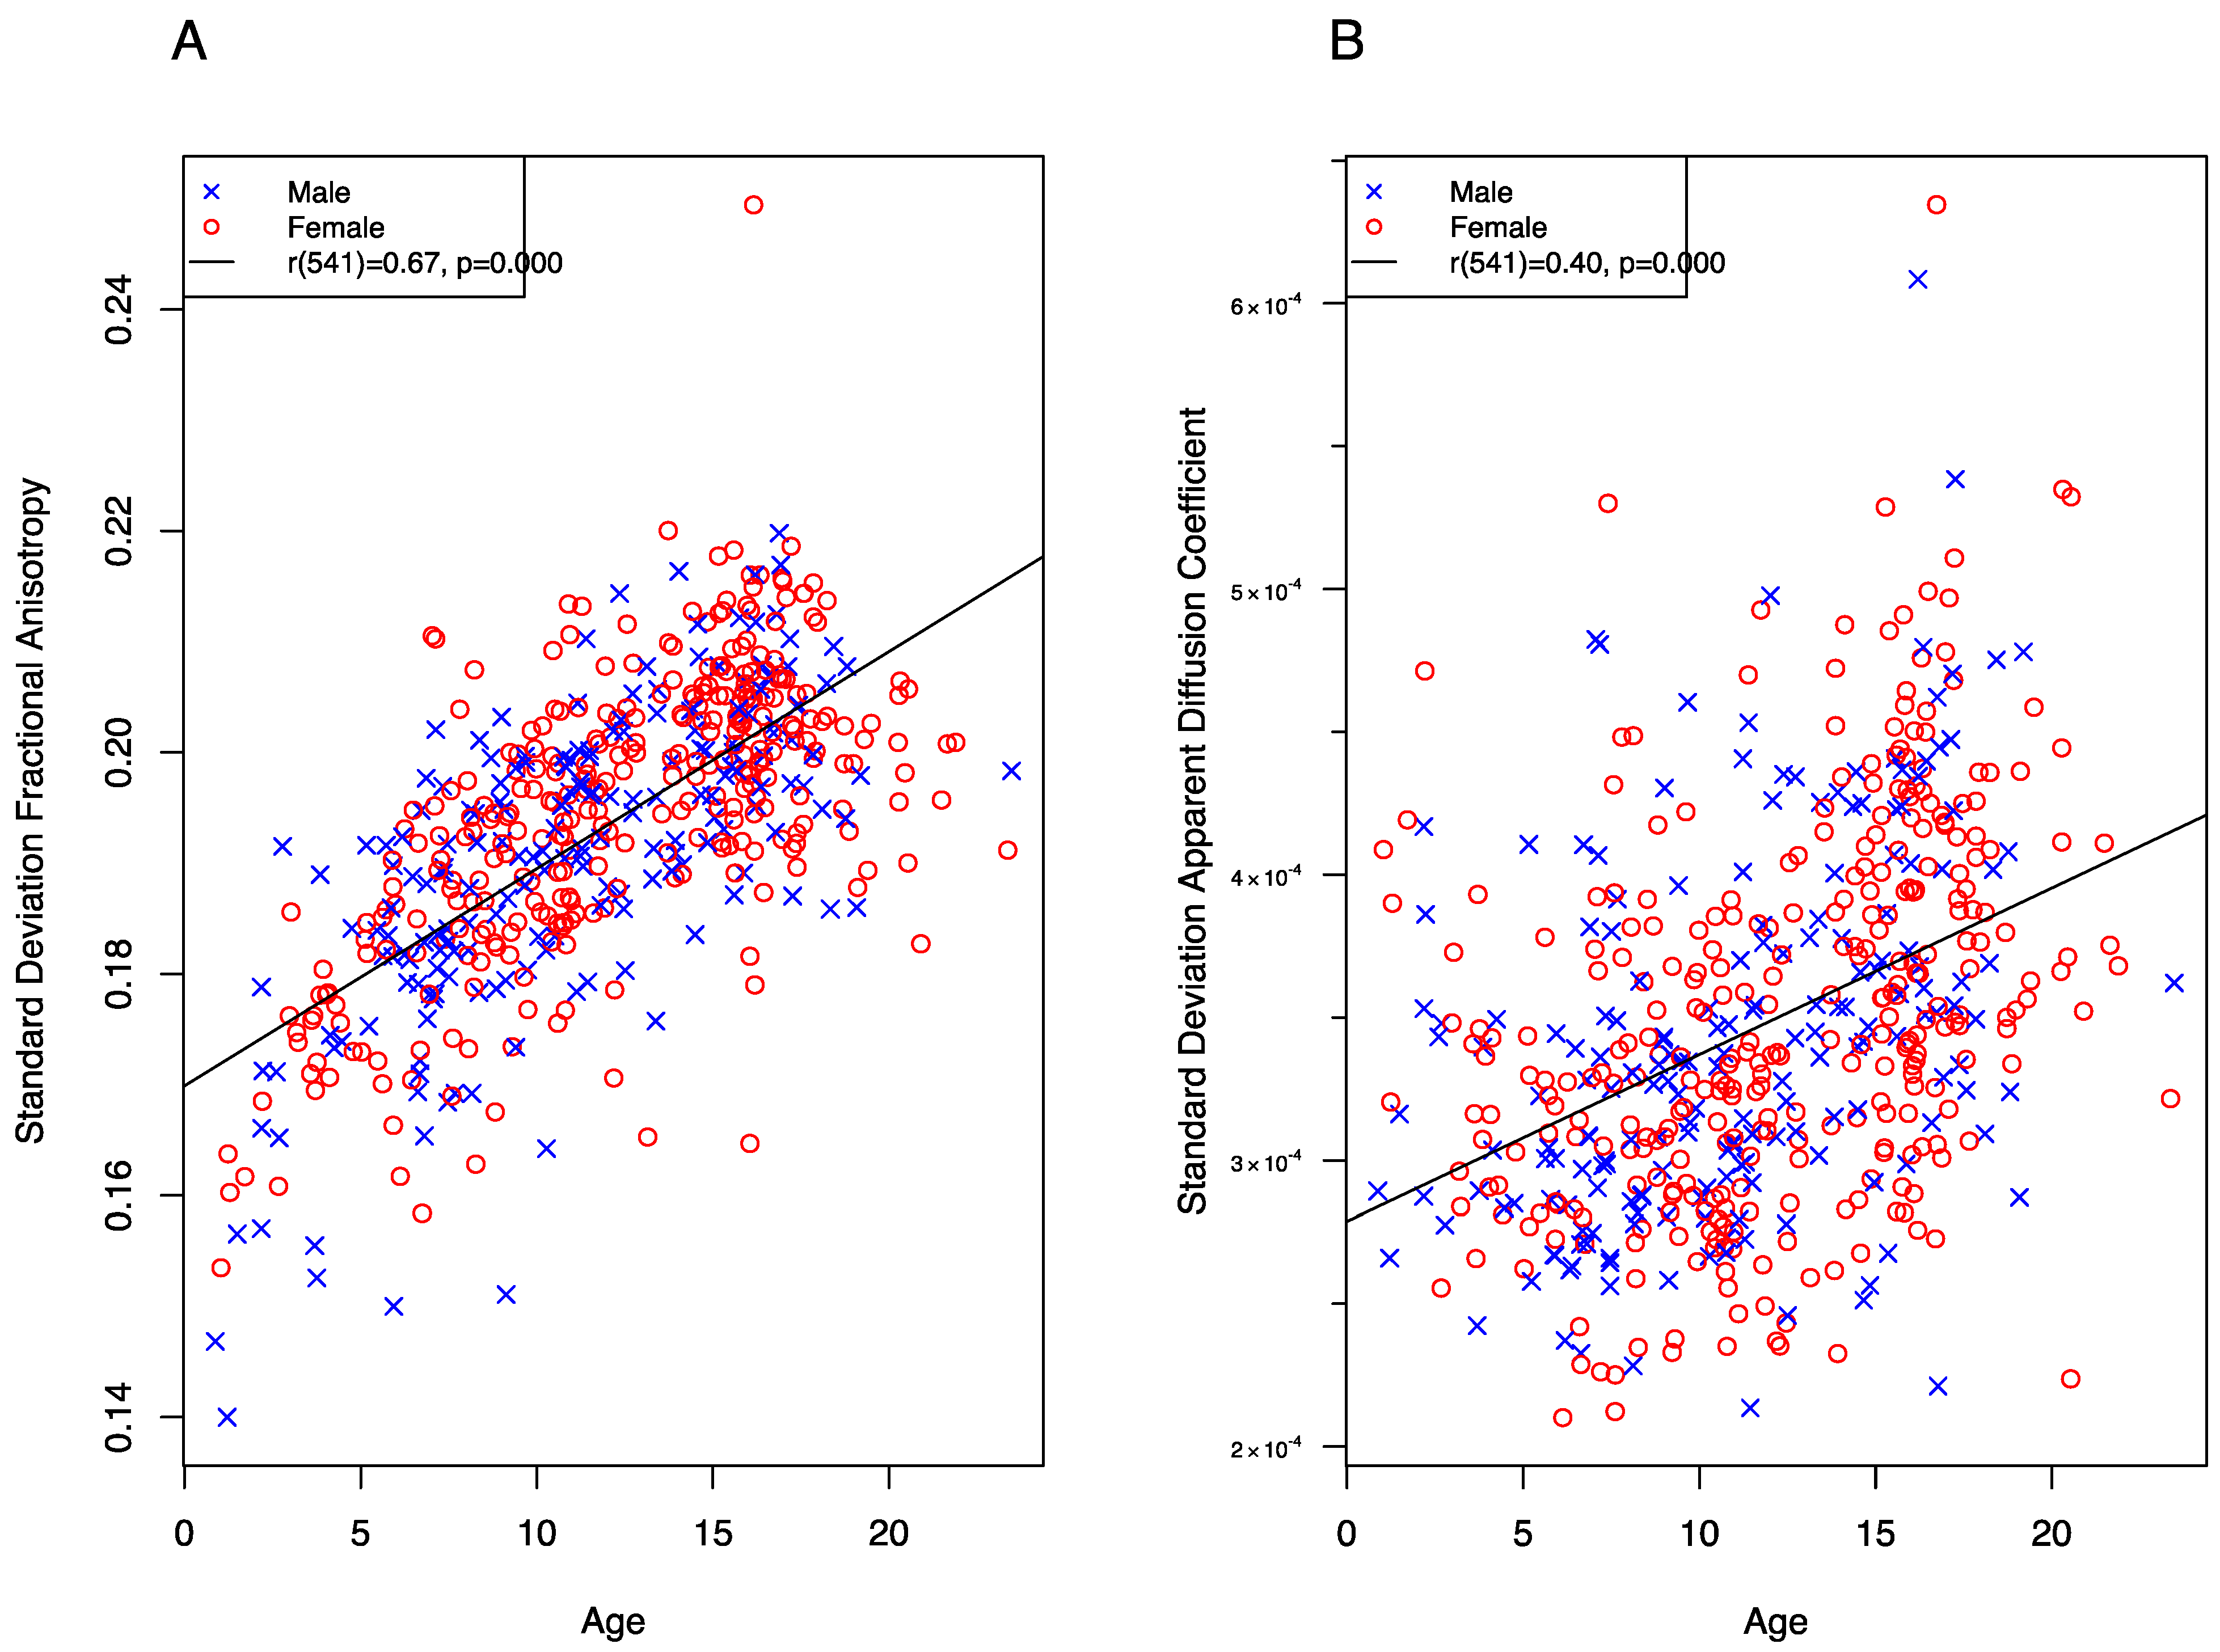
  • Standard deviation of fractional anisotropy (SD FA) measures the variability of the fractional anisotropy within the tract.
  • Standard deviation of the apparent diffusion coefficient (SD ADC) measures the variability of ADC exhibited within the tract.
  • Tracts to render represents the number of distinguishable fiber tracts or streamlines detected between two regions of interest.
  • Mean tract length represents the average length in millimeters for all tracts detected between two regions of interest. The tract length was not computed for the complete BCH data; consequently, it was excluded from those results.
  • Standard deviation of tract length measures the variability of tract lengths for tracts detected between two regions of interest.
  • Asymmetry index of mean fractional anisotropy (FA).
  • Asymmetry index of mean apparent diffusion coefficient (ADC).
  • Asymmetry index of standard deviation of fractional anisotropy (SD FA).
  • Asymmetry index of standard deviation of apparent diffusion coefficient (SD ADC).
  • Asymmetry index of tracts to render.
  • Asymmetry index of mean tract length.
  • Asymmetry index of standard deviation of tract length.

References

  1. Johansen-Berg, H.; Behrens, T.E. Just pretty pictures? What diffusion tractography can add in clinical neuroscience. Curr. Opin. Neurol. 2006, 19, 379–385. [Google Scholar] [CrossRef] [PubMed]
  2. Kreilkamp, B.A.; Weber, B.; Richardson, M.P.; Keller, S.S. Automated tractography in patients with temporal lobe epilepsy using TRActs Constrained by UnderLying Anatomy (TRACULA). NeuroImage Clin. 2017, 14, 67–76. [Google Scholar] [CrossRef] [PubMed]
  3. Taha, A.A.; Hanbury, A. Metrics for evaluating 3D medical image segmentation: Analysis, selection, and tool. BMC Med. Imaging 2015, 15, 29. [Google Scholar] [CrossRef]
  4. Garyfallidis, E.; Côté, M.-A.; Rheault, F.; Sidhu, J.; Hau, J.; Petit, L.; Fortin, D.; Cunanne, S.; Descoteaux, M. Recognition of white matter bundles using local and global streamline-based registration and clustering. NeuroImage 2018, 170, 283–295. [Google Scholar] [CrossRef] [PubMed]
  5. O’Donnell, L.J.; Westin, C.-F. Automatic Tractography Segmentation Using a High-Dimensional White Matter Atlas. IEEE Trans. Med. Imaging 2007, 26, 1562–1575. [Google Scholar] [CrossRef] [PubMed]
  6. Langen, M.; Leemans, A.; Johnston, P.; Ecker, C.; Daly, E.; Murphy, C.M.; Dell’acqua, F.; Durston, S.; Murphy, D.G. Fronto-striatal circuitry and inhibitory control in autism: Findings from diffusion tensor imaging tractography. Cortex 2012, 48, 183–193. [Google Scholar] [CrossRef]
  7. Braitenberg, V.; Schüz, A. Cortex: Statistics and Geometry of Neuronal Connectivity, 2nd ed.; Springer: Berlin/Heidelberg, Germany, 1998. [Google Scholar]
  8. Sotiropoulos, S.N.; Jbabdi, S.; Xu, J.; Andersson, J.L.; Moeller, S.; Auerbach, E.J.; Glasser, M.F.; Hernandez, M.; Sapiro, G.; Jenkinson, M.; et al. Advances in diffusion MRI acquisition and processing in the Human Connectome Project. NeuroImage 2013, 80, 125–143. [Google Scholar] [CrossRef]
  9. Zhang, D.; Snyder, A.Z.; Shimony, J.S.; Fox, M.D.; Raichle, M.E. Noninvasive Functional and Structural Connectivity Mapping of the Human Thalamocortical System. Cereb. Cortex 2009, 20, 1187–1194. [Google Scholar] [CrossRef]
  10. Farquharson, S.; Tournier, J.-D.; Calamante, F.; Fabinyi, G.; Schneider-Kolsky, M.; Jackson, G.D.; Connelly, A. White matter fiber tractography: Why we need to move beyond DTI. J. Neurosurg. 2013, 118, 1367–1377. [Google Scholar] [CrossRef]
  11. Jbabdi, S.; Johansen-Berg, H. Tractography: Where Do We Go from Here? Brain Connect. 2011, 1, 169–183. [Google Scholar] [CrossRef]
  12. Levman, J.; MacDonald, P.; Lim, A.R.; Forgeron, C.; Takahashi, E. A pediatric structural MRI analysis of healthy brain development from newborns to young adults. Hum. Brain Mapp. 2017, 38, 5931–5942. [Google Scholar] [CrossRef] [PubMed]
  13. Levman, J.; Fang, Z.; Zumwalt, K.; Cogger, L.; Vasung, L.; MacDonald, P.; Lim, A.R.; Takahashi, E. Asymmetric Insular Connectomics Revealed by Diffusion Magnetic Resonance Imaging Analysis of Healthy Brain Development. Brain Connect. 2019, 9, 2–12. [Google Scholar] [CrossRef] [PubMed]
  14. Van Essen, D.C.; Smith, S.M.; Barch, D.M.; Behrens, T.E.J.; Yacoub, E.; Ugurbil, K. The WU-Minn Human Connectome Project: An overview. NeuroImage 2013, 80, 62–79. [Google Scholar] [CrossRef] [PubMed]
  15. Pienaar, R.; Rannou, N.; Bernal, J.; Hahn, D.; Grant, P.E. ChRIS- A web-based neuroimaging and informatics system for collecting, organizing, processing, visualizing and sharing of medical data. In Proceedings of the 2015 37th Annual International Conference of the IEEE Engineering in Medicine and Biology Society (EMBC), Milan, Italy, 25–29 August 2015; pp. 206–209. [Google Scholar] [CrossRef]
  16. Fischl, B. FreeSurfer. NeuroImage 2012, 62, 774–781. [Google Scholar] [CrossRef] [PubMed]
  17. Glasser, M.F.; Sotiropoulos, S.N.; Wilson, J.A.; Coalson, T.S.; Fischl, B.; Andersson, J.L.; Xu, J.; Jbabdi, S.; Webster, M.; Polimeni, J.R.; et al. The minimal preprocessing pipelines for the Human Connectome Project. NeuroImage 2013, 80, 105–124. [Google Scholar] [CrossRef]
  18. Jenkinsona, M.; Bannisterab, P.; Bradyb, M.; Smitha, S. Improved Optimization for the Robust and Accurate Linear Registration and Motion Correction of Brain Images. NeuroImage 2002, 17, 825–841. [Google Scholar] [CrossRef]
  19. Klein, A.; Tourville, J. 101 Labeled Brain Images and a Consistent Human Cortical Labeling Protocol. Front. Neurosci. 2012, 6, 171. [Google Scholar] [CrossRef]
  20. Andersson, J.L.R.; Sotiropoulos, S.N. An integrated approach to correction for off-resonance effects and subject movement in diffusion MR imaging. NeuroImage 2016, 125, 1063–1078. [Google Scholar] [CrossRef]
  21. Graham, M.S.; Drobnjak, I.; Zhang, H. Realistic simulation of artefacts in diffusion MRI for validating post-processing correction techniques. NeuroImage 2016, 125, 1079–1094. [Google Scholar] [CrossRef]
  22. Wang, R.; Benner, T.; Sorensen, A.G.; Wedeen, V.J. Diffusion Toolkit: A Software Package for Diffusion Imaging Data Processing and Tractography. Proc. Int. Soc. Mag. Reson. Med. 2007, 15, 3720. [Google Scholar]
  23. Geng, X.; Gouttard, S.; Sharma, A.; Gu, H.; Styner, M.; Lin, W.; Gerig, G.; Gilmore, J.H. Quantitative tract-based white matter development from birth to age 2 years. NeuroImage 2012, 61, 542–557. [Google Scholar] [CrossRef] [PubMed]
  24. Cusack, R.; Ball, G.; Smyser, C.D.; Dehaene-Lambertz, G. A neural window on the emergence of cognition. Ann. N. Y. Acad. Sci. 2016, 1369, 7–23. [Google Scholar] [CrossRef] [PubMed]
  25. Sadeghi, N.; Prastawa, M.; Fletcher, P.T.; Wolff, J.; Gilmore, J.H.; Gerig, G. Regional characterization of longitudinal DT-MRI to study white matter maturation of the early developing brain. NeuroImage 2013, 68, 236–247. [Google Scholar] [CrossRef] [PubMed]
  26. Wang, Y.; Adamson, C.; Yuan, W.; Altaye, M.; Rajagopal, A.; Byars, A.W.; Holland, S.K. Sex differences in white matter development during adolescence: A DTI study. Brain Res. 2012, 1478, 1–15. [Google Scholar] [CrossRef] [PubMed]
  27. Simmonds, D.J.; Hallquist, M.N.; Asato, M.; Luna, B. Developmental stages and sex differences of white matter and behavioral development through adolescence: A longitudinal diffusion tensor imaging (DTI) study. NeuroImage 2014, 92, 356–368. [Google Scholar] [CrossRef] [PubMed]
  28. Gogtay, N.; Giedd, J.N.; Lusk, L.; Hayashi, K.M.; Greenstein, D.; Vaituzis, A.C.; Nugent, T.F.; Herman, D.H.; Clasen, L.S.; Toga, A.W.; et al. Dynamic mapping of human cortical development during childhood through early adulthood. Proc. Natl. Acad. Sci. USA 2004, 101, 8174–8179. [Google Scholar] [CrossRef] [PubMed]
  29. Schmithorst, V.J.; Yuan, W. White matter development during adolescence as shown by diffusion MRI. Brain Cogn. 2010, 72, 16–25. [Google Scholar] [CrossRef] [PubMed]
  30. Anderson, A.J.; Ren, P.; Baran, T.M.; Zhang, Z.; Lin, F. Insula and putamen centered functional connectivity networks reflect healthy agers’ subjective experience of cognitive fatigue in multiple tasks. Cortex 2019, 119, 428–440. [Google Scholar] [CrossRef]
  31. Kanaan, R.A.; Allin, M.; Picchioni, M.; Barker, G.J.; Daly, E.; Shergill, S.S.; Woolley, J.; McGuire, P.K. Gender Differences in White Matter Microstructure. PLoS ONE 2012, 7, e38272. [Google Scholar] [CrossRef]
  32. Takao, H.; Hayashi, N.; Ohtomo, K. Sex dimorphism in the white matter: Fractional anisotropy and brain size. J. Magn. Reson. Imaging 2014, 39, 917–923. [Google Scholar] [CrossRef]
  33. Keil, B.; Alagappan, V.; Mareyam, A.; McNab, J.A.; Fujimoto, K.; Tountcheva, V.; Triantafyllou, C.; Dilks, D.D.; Kanwisher, N.; Lin, W.; et al. Size-optimized 32-channel brain arrays for 3 T pediatric imaging. Magn. Reson. Med. 2011, 66, 1777–1787. [Google Scholar] [CrossRef] [PubMed]
Figure 1. (A) Raw T1-weighted images. (B) Automatic segmentations are performed using Freesurfer. (C) Raw diffusion-weighted images. (D) Reconstruction using Diffusion Toolkit varied depending on whether DWI was single-shell or multi-shell. If multi-shell, DTI reconstruction was performed using Diffusion Toolkit utilities dti_recon and dti_tracker; otherwise, ODF reconstruction was used to establish the whole brain tractogram using a pipeline that leverages Diffusion Toolkit utilities hardi_mat, odf_recon, and odf_tracter. (E) The tractogram was registered to T1w space using tract_transform from Diffusion Toolkit. Subsequently, diffusion measurements between each region pair were collected.
Information 15 00066 g001
Figure 2. Differences in the standard deviation of mean fractional anisotropy within tracts connecting left pallidum ↔ left insular cortex between male and female participants. (A) Exhibits similar increasing trajectories with age between sexes. (B) The effect size, as measured by Cohen’s d, was found to be −0.534, indicating a medium effect size. The 95% confidence interval for the effect size ranged from −0.75 to −0.36, suggesting a statistically significant difference between the two groups.
Information 15 00066 g002
Figure 3. Differences in mean fractional anisotropy within tracts connecting Left medial orbitofrontal WM ↔ left middle temporal WM between male and female participants. (A) Exhibits similar increasing trajectories with age between sexes. (B) The effect size, as measured by Cohen’s d, was found to be −0.51, indicating a medium effect size. The 95% confidence interval for the effect size ranged from −0.69 to −0.33, suggesting a statistically significant difference between the two groups.
Information 15 00066 g003
Figure 4. Mean fractional anisotropy of tracts connecting the left paracentral cortex to the left precuneus cortex with a trend line (black) fitted using locally estimated scatterplot smoothing (LOESS). A smoothing parameter was set at 0.65, which was a value determined iteratively to achieve a balance between overfitting and underfitting the data.
Information 15 00066 g004
Figure 5. (A) Correlation of mean fractional anisotropy with age in tracts connecting the brain stem to the left insula WM. (B) Correlation of mean apparent diffusion coefficient with age in tracts connecting the brainstem with the left insula WM.
Information 15 00066 g005
Figure 6. (A) Correlation of standard deviation of fractional anisotropy with age in tracts connecting the left precentral cortex and left precentral white matter. (B) Correlation of standard deviation of apparent diffusion coefficient with age in tracts connecting the left precentral cortex with left precentral white matter.
Information 15 00066 g006
Table 1. Overall effect size comparing sexes by measurement type in the BCH cohort.
None
(<0.2)
Small
(0.2–0.5)
Medium
(0.5–0.8)
Large
(>0.8)
Average ADC79.90%20.10%0.00%0.00%
Average ADC asymmetry97.30%2.70%0.00%0.00%
Average FA84.50%15.50%0.00%0.00%
Average FA asymmetry97.20%2.80%0.00%0.00%
Number of tracts100.00%0.00%0.00%0.00%
Number of tracts asymmetry100.00%0.00%0.00%0.00%
Standard deviation ADC92.30%7.70%0.00%0.00%
Standard deviation ADC asymmetry97.20%2.80%0.00%0.00%
Standard deviation FA68.70%31.30%0.00%0.00%
Standard deviation FA asymmetry96.20%3.80%0.00%0.00%
Tracts to render91.60%8.20%0.10%0.00%
Tracts to render asymmetry97.20%2.80%0.00%0.00%
FA, fractional anisotropy; ADC, apparent diffusion coefficient.
Table 2. Leading whole-brain measurement effect sizes between males and females for identified tracts connecting the two regions of interest listed. Results from BCH cohort.
TractMale/Female Effect Size
Leading Average FA
L medial orbitofrontal WM ↔ L middle temporal WM−0.510
L medial orbitofrontal cortex ↔ L middle temporal WM−0.489
L rostral middle frontal cortex ↔ L middle temporal WM−0.397
L medial orbitofrontal cortex ↔ L insular WM−0.380
Leading Average ADC
L insular cortex ↔ L lateral occipital WM0.419
L medial orbitofrontal cortex ↔ L insular cortex0.414
L posterior cingulate cortex ↔ L rostral anterior cingulate WM0.410
L lateral occipital WM ↔ L superior temporal WM0.409
Leading Tracts to Render
L superior frontal cortex ↔ L superior frontal WM0.673
R fusiform cortex ↔ R fusiform WM0.645
L precuneus cortex ↔ L precuneus WM0.625
L superior temporal cortex ↔ L superior temporal WM0.624
Leading STD ADC
L transverse temporal cortex ↔ L insular cortex−0.411
L transverse temporal cortex ↔ L insular WM−0.388
R pars orbitalis cortex ↔ R pars triangularis cortex−0.378
R pars triangularis cortex ↔ R rostral middle frontal cortex−0.369
Leading STD FA
L pallidum ↔ L insular cortex−0.534
R rostral middle frontal cortex ↔ L lateral orbitofrontal WM−0.470
R inferior parietal white matter ↔ R lateral occipital WM−0.455
L caudate ↔ L insular WM−0.436
FA, fractional anisotropy; ADC, apparent diffusion coefficient; STD, standard deviation; L, left; R, right; WM, white matter.
Table 3. Leading measurement correlations with age and BCH cohort.
ROI StartMeasurerpdf
Brain stem ↔ L insular WMAvg FA0.670.00533
L precentral cortex ↔ L precentral WMSD FA0.670.00535
R precentral cortex ↔ R precentral WMSD FA0.660.00541
Brain stem ↔ L superior frontal cortexAvg FA0.660.00583
Brain stem ↔ L superior frontal WMAvg FA0.650.00539
Brain stem ↔ L ventral DCAvg FA0.650.00540
L ventral DC ↔ L insular WMAvg FA0.650.00540
Brain stem ↔ L precentral WMAvg FA0.650.00540
L ventral DC ↔ L precentral WMAvg FA0.650.00540
Brain stem ↔ R pallidumAvg FA0.650.00540
L rostral middle frontal cortex ↔ L rostral middle frontal WMSD FA0.650.00539
L thalamus proper ↔ brain stemAvg FA0.650.00538
L postcentral cortex ↔ L post central WMSD FA0.640.00540
R putamen ↔ R insular WMAvg FA0.640.00541
L, left; R, right; WM, white matter; FA, fractional anisotropy; SD, standard deviation.
Table 4. Leading sex-based differences in hemispheric asymmetry.
TractMale/Female Effect Size
Leading Asymmetry Index (Left Divided by Right) for Average FA
Caudal anterior cingulate WM ↔ rostral anterior cingulate WM0.306
Inferior temporal WM ↔ temporal pole WM−0.295
Entorhinal cortex ↔ inferior temporal WM−0.284
Cerebellum cortex ↔ lingual WM0.282
Leading Asymmetry Index (Left Divided by Right)—Average ADC
Caudal anterior cingulate WM ↔ rostral anterior cingulate WM0.345
Cerebellum cortex ↔ superior frontal WM0.316
Caudal anterior cingulate WM ↔ rostral anterior cingulate WM−0.309
Cerebellum cortex ↔ superior frontal WM−0.308
Leading Asymmetry Index (Left Divided by Right)—Tracts to Render
Caudate ↔ lateral orbitofrontal WM0.327
Banks of the superior temporal sulcus ↔ superior temporal cortex0.323
Rostral middle frontal ↔ superior parietal WM0.304
Lateral occipital cortex ↔ middle temporal cortex0.297
Leading Asymmetry Index (Left Divided by Right)—SD ADC
Cerebellum cortex ↔ fusiform cortex0.340
Pars opercularis cortex ↔ post-central WM0.325
Cerebellum cortex ↔ fusiform cortex −0.319
Fusiform cortex ↔ lingual cortex0.307
Leading Asymmetry Index (Left Divided by Right)—SD FA
Inferior parietal cortex ↔ precentral WM1.080
Precentral cortex ↔ inferior parietal WM0.910
Inferior parietal WM ↔ precentral WM0.851
Inferior temporal cortex ↔ banks of the superior temporal sulcus0.831
FA, fractional anisotropy; ADC, apparent diffusion coefficient; SD, standard deviation; WM, white matter.
Table 5. Leading biomarker correlations to age within HCP data.
TractMeasurerpdf
L lateral orbitofrontal WM ↔ L superior frontal WMAvg tract len−0.340.00155
R inferior parietal WM ↔ R insula WMAvg ADC−0.340.00152
L superior frontal GM ↔ L rostral anterior cingulate WMAvg tract len−0.330.00155
R posterior cingulate WM ↔ R precentral WMAvg tract len−0.330.00155
Left parahippocampal GM ↔ R paracentral WMAvg tract len0.320.00155
L rostral middle frontal GM ↔ L lateral orbitofrontal WMSD ADC0.320.00155
L putamen ↔ L medial orbitofrontal WMAvg ADC−0.320.00155
L caudal middle frontal WM ↔ left medial orbitofrontal WMSD Avg tract len −0.320.00155
L putamen ↔ L unsegmented WMAvg ADC−0.310.00155
L thalamus proper ↔ posterior corpus callosumSD ADC0.310.00155
R accumbens area ↔ L unsegmented WMSD ADC0.310.00155
L superior frontal WM ↔ L insula WMAvg ADC−0.310.00154
ADC, apparent diffusion coefficient; SD, standard deviation; L, left; R, right; WM, white matter; GM, grey matter.
Disclaimer/Publisher’s Note: The statements, opinions and data contained in all publications are solely those of the individual author(s) and contributor(s) and not of MDPI and/or the editor(s). MDPI and/or the editor(s) disclaim responsibility for any injury to people or property resulting from any ideas, methods, instructions or products referred to in the content.

