

Detecting Wear and Tear in Pedestrian Crossings Using Computer Vision Techniques: Approaches, Challenges, and Opportunities

 ,
,  ,
,  and
and
Abstract
:1. Introduction
2. Computer Vision Techniques
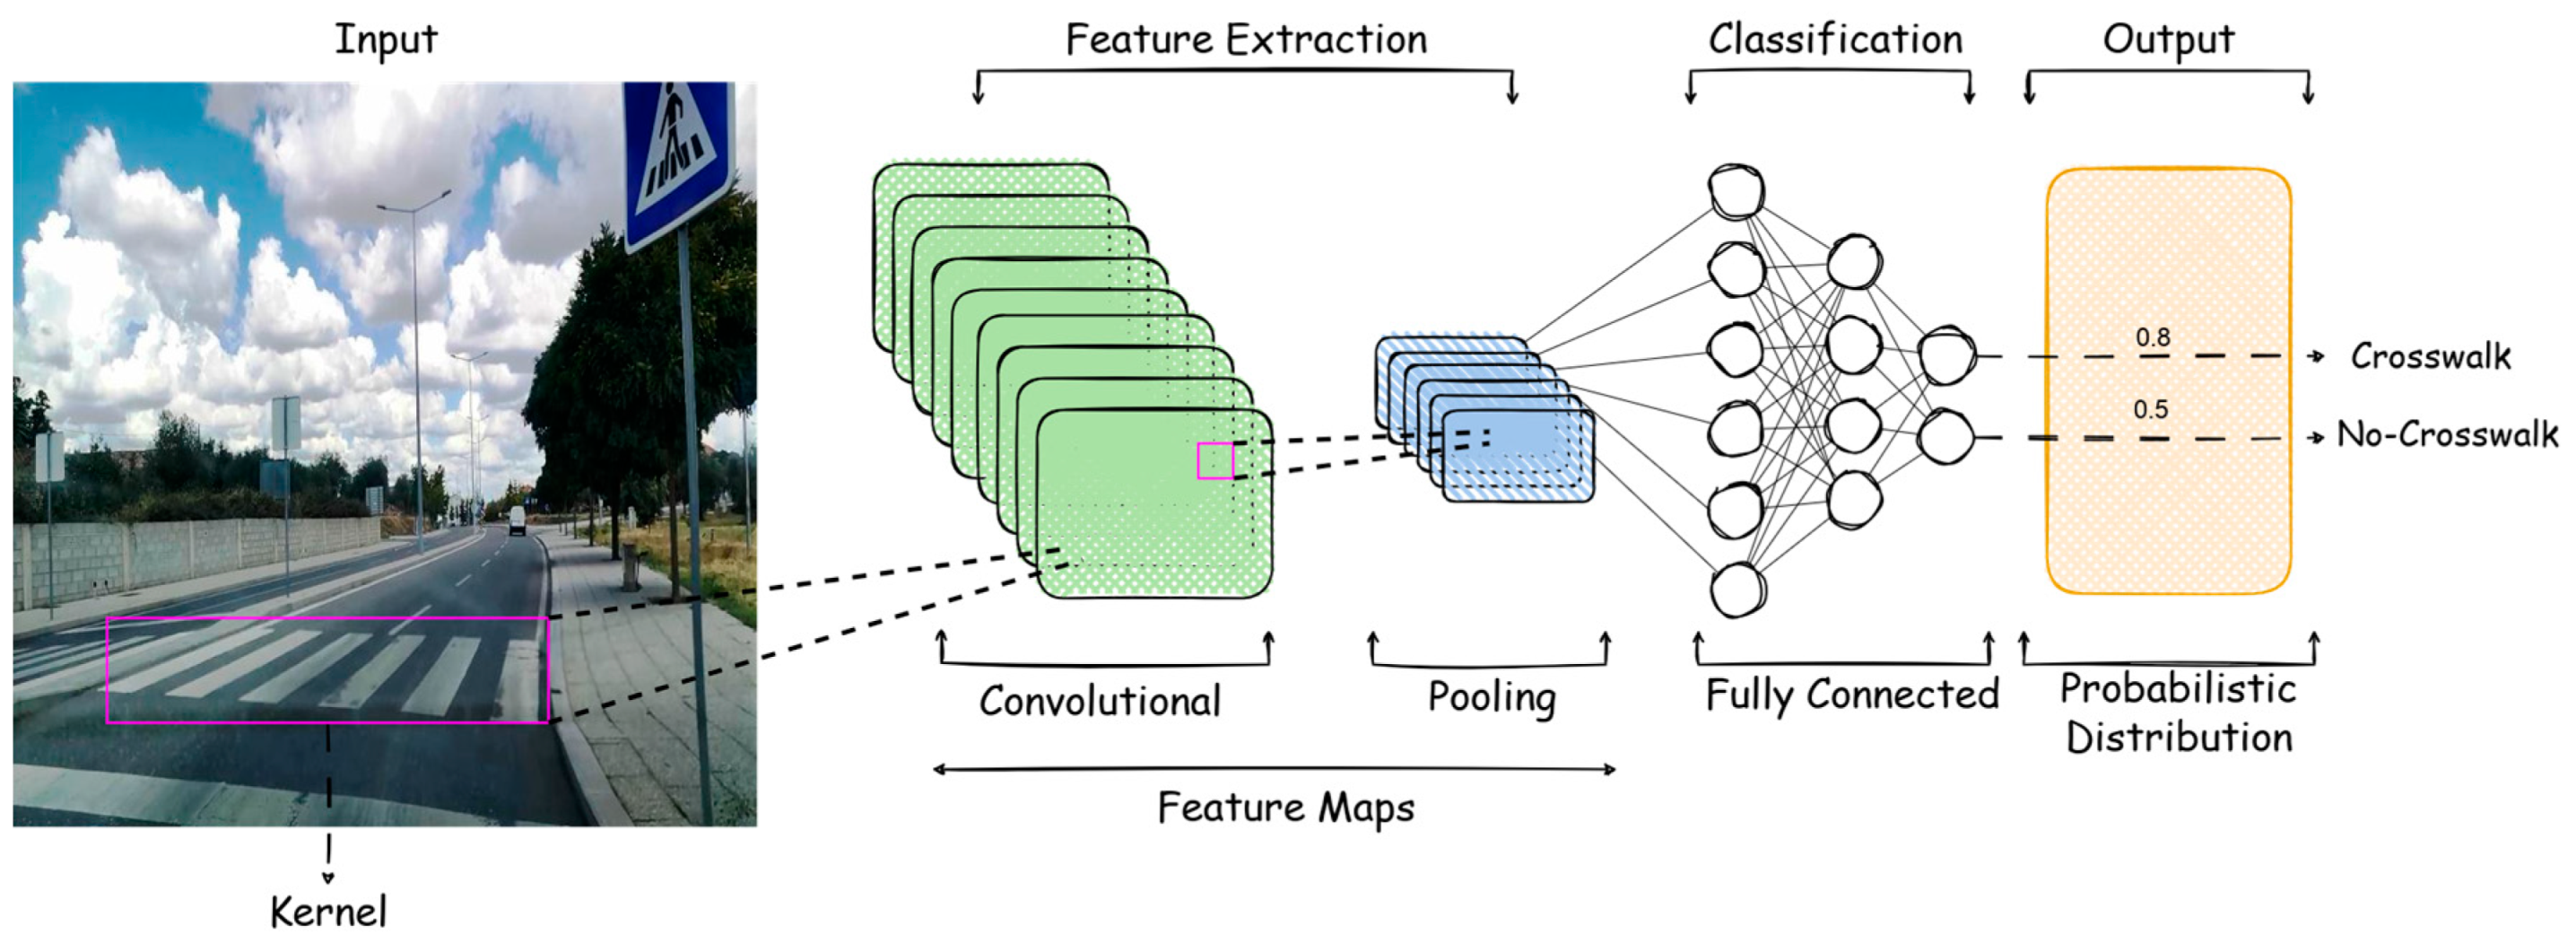
2.1. Convolutional Neural Network Architectures
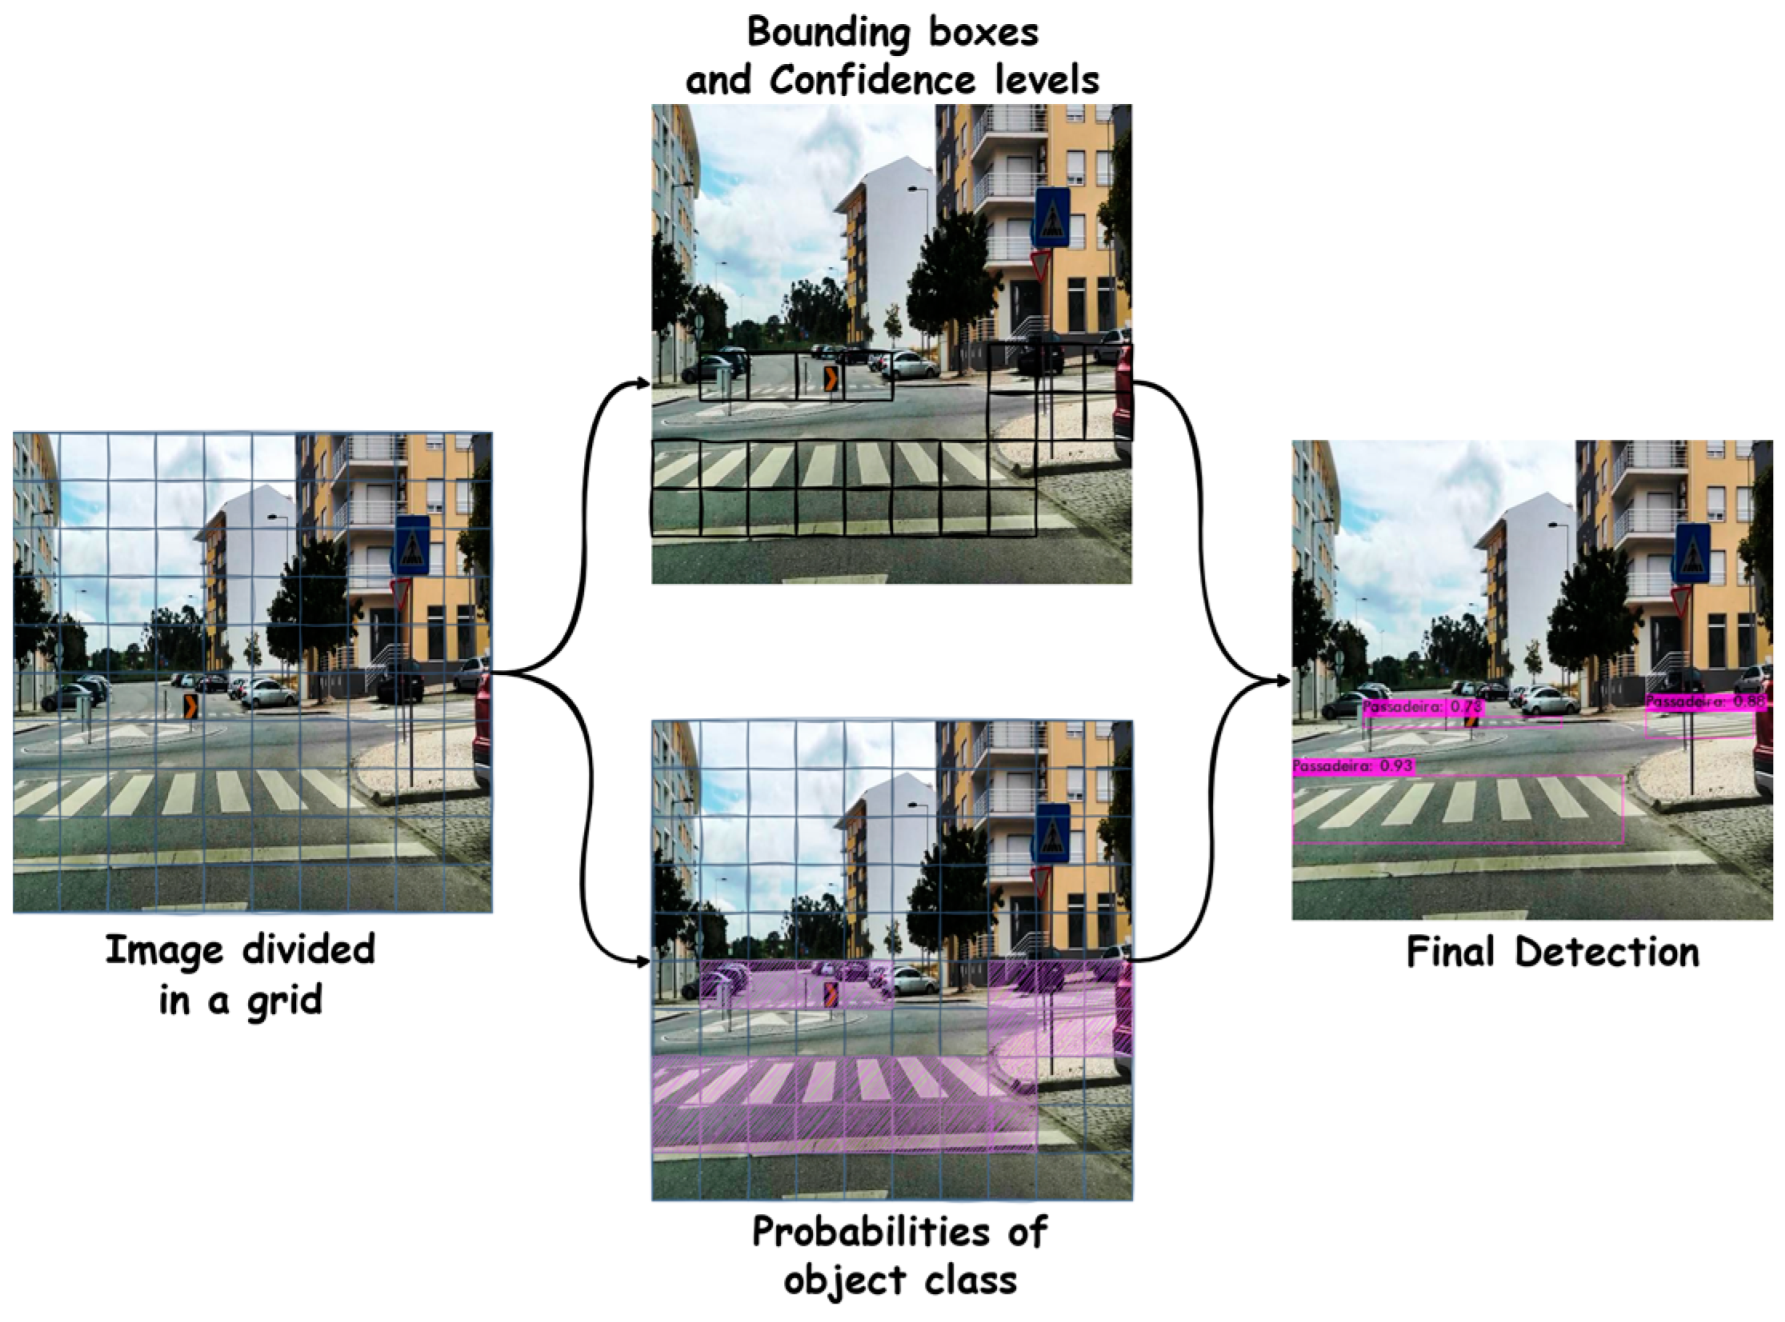
2.1.1. One-Stage Detection
2.1.2. Two-Stage Detection
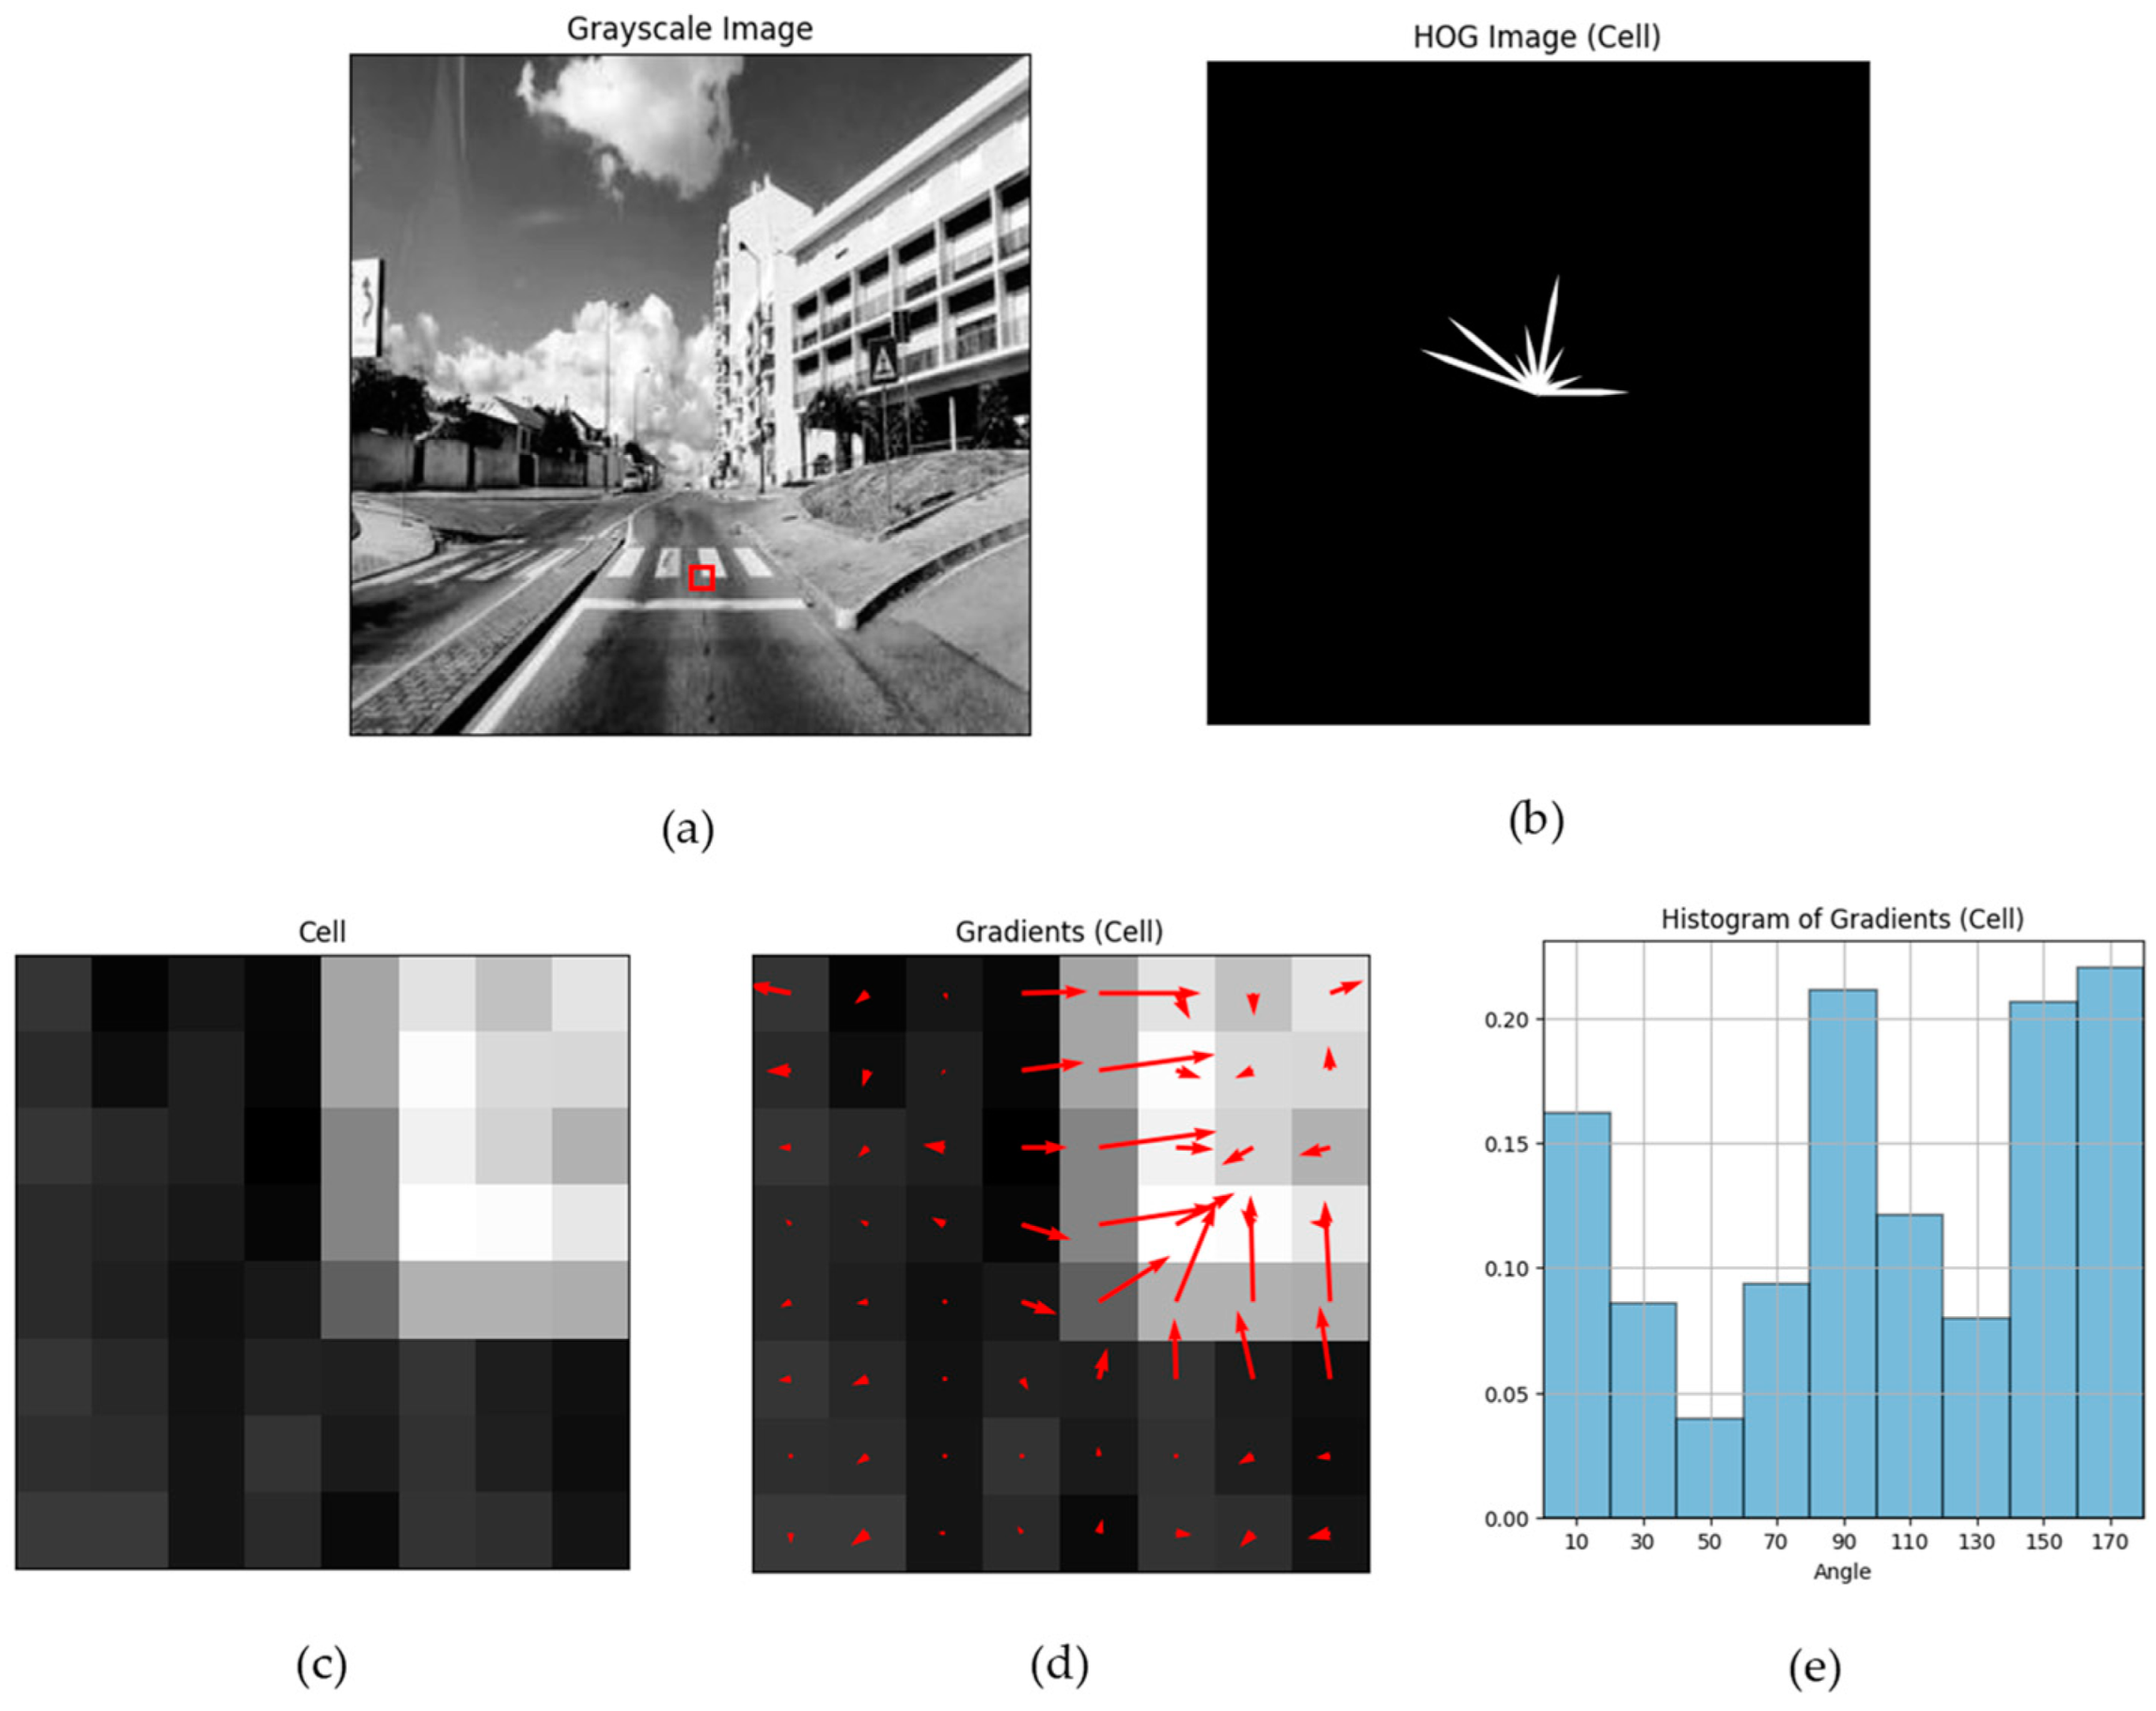
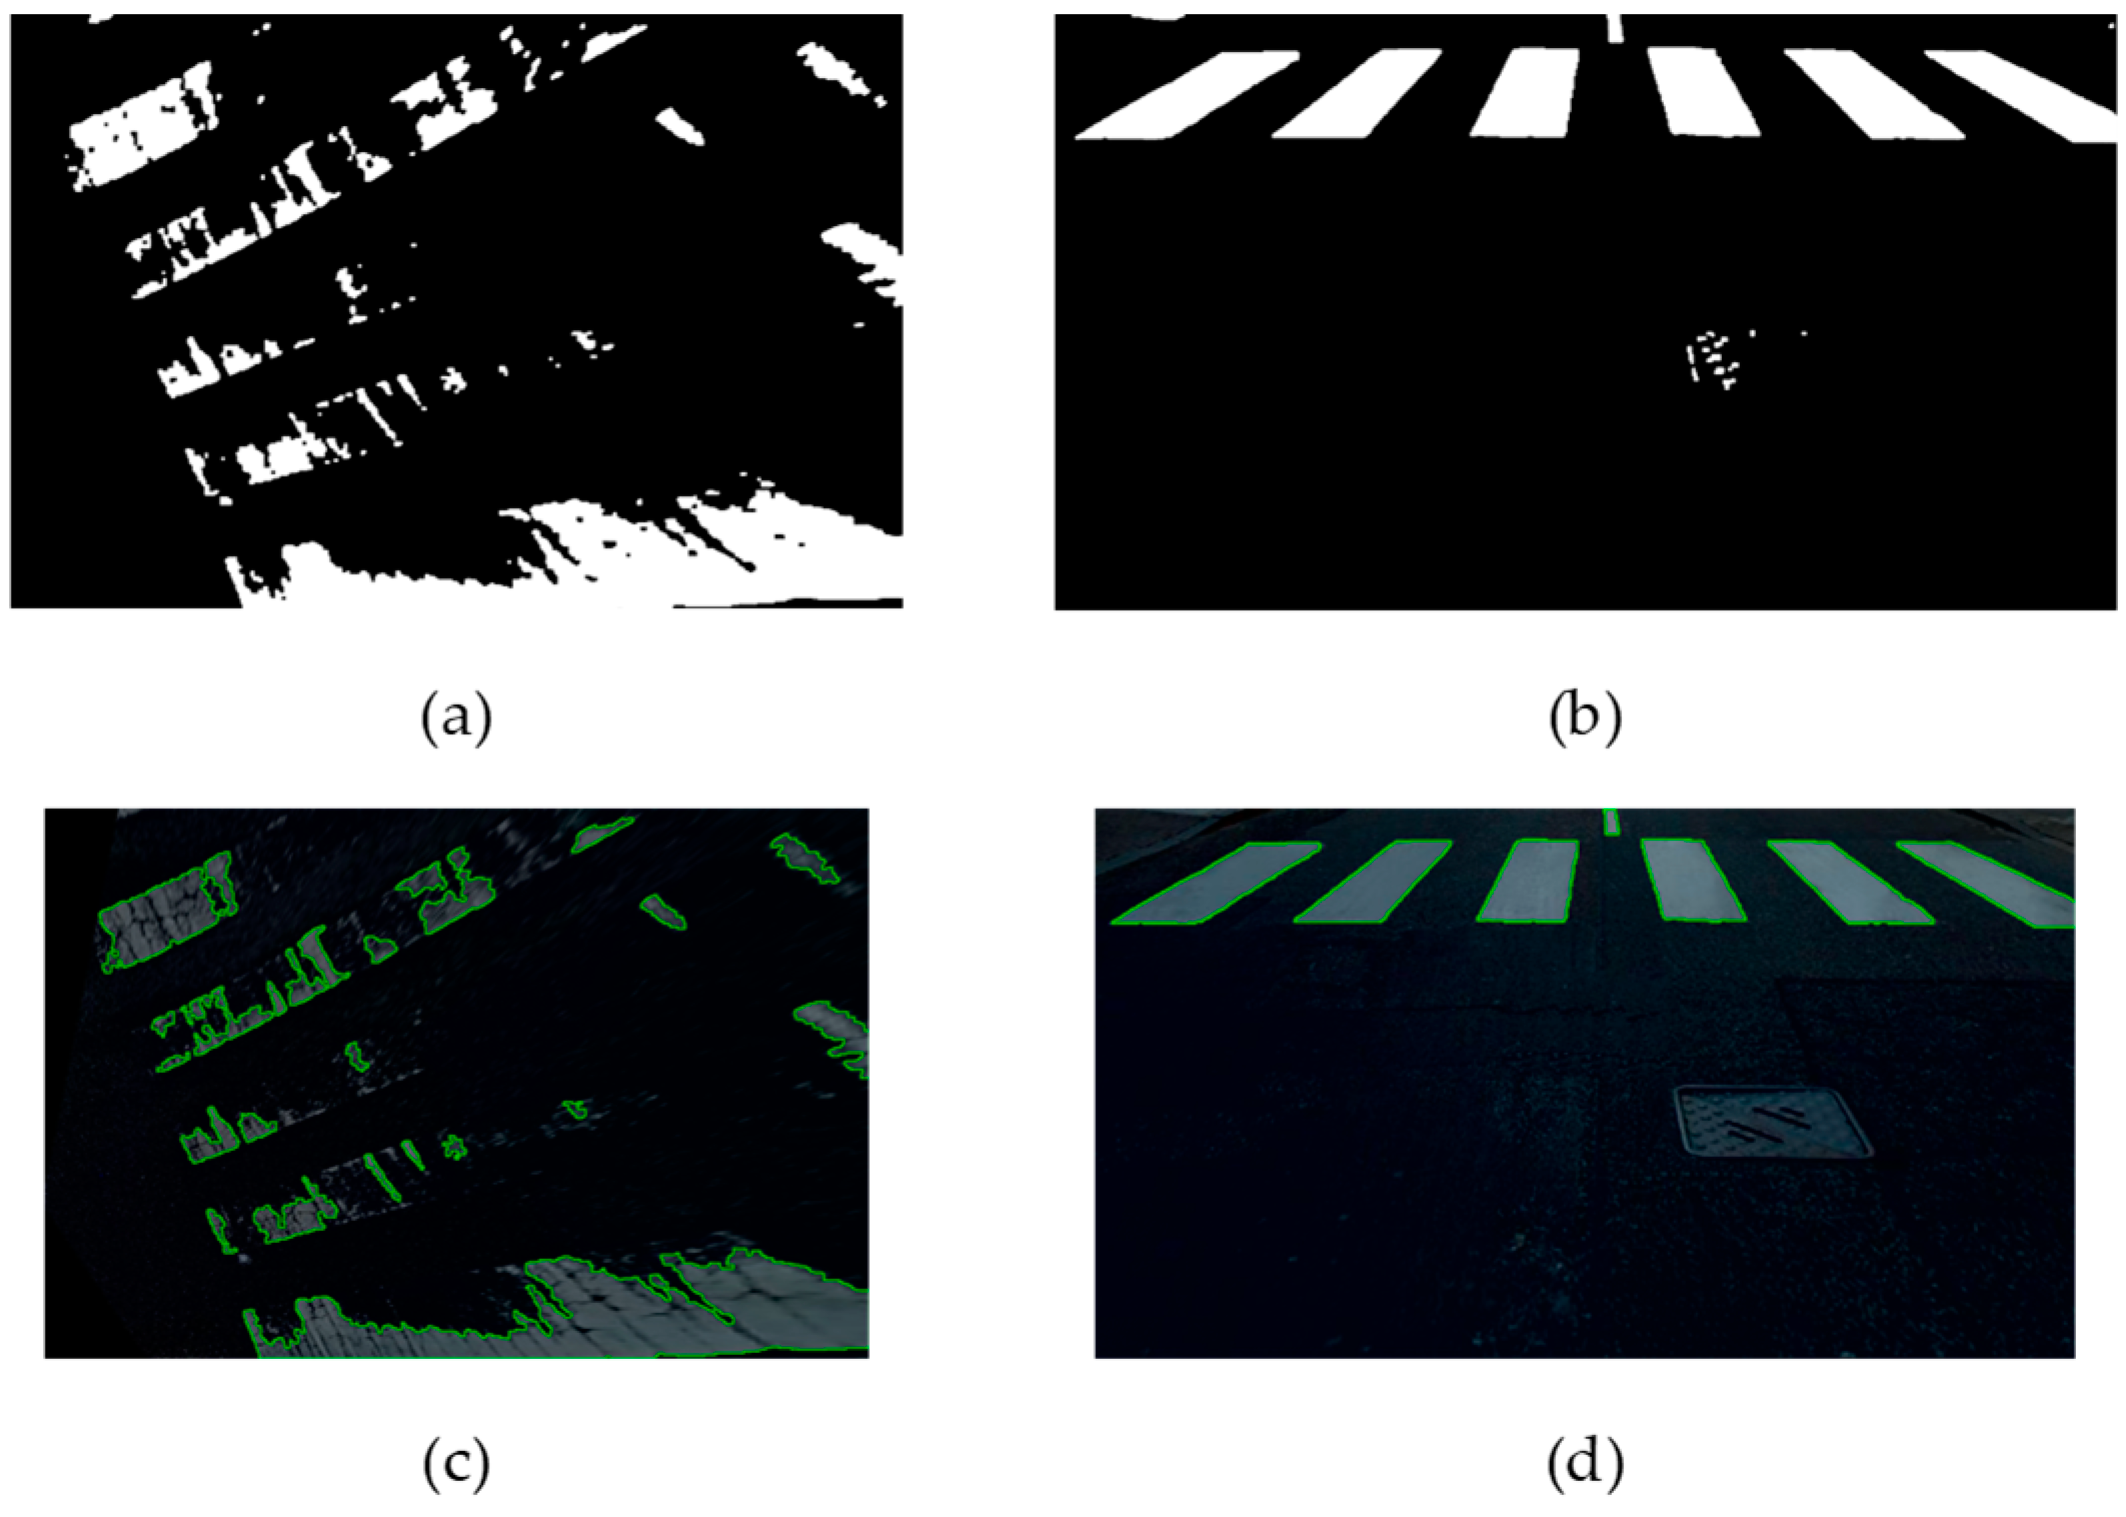
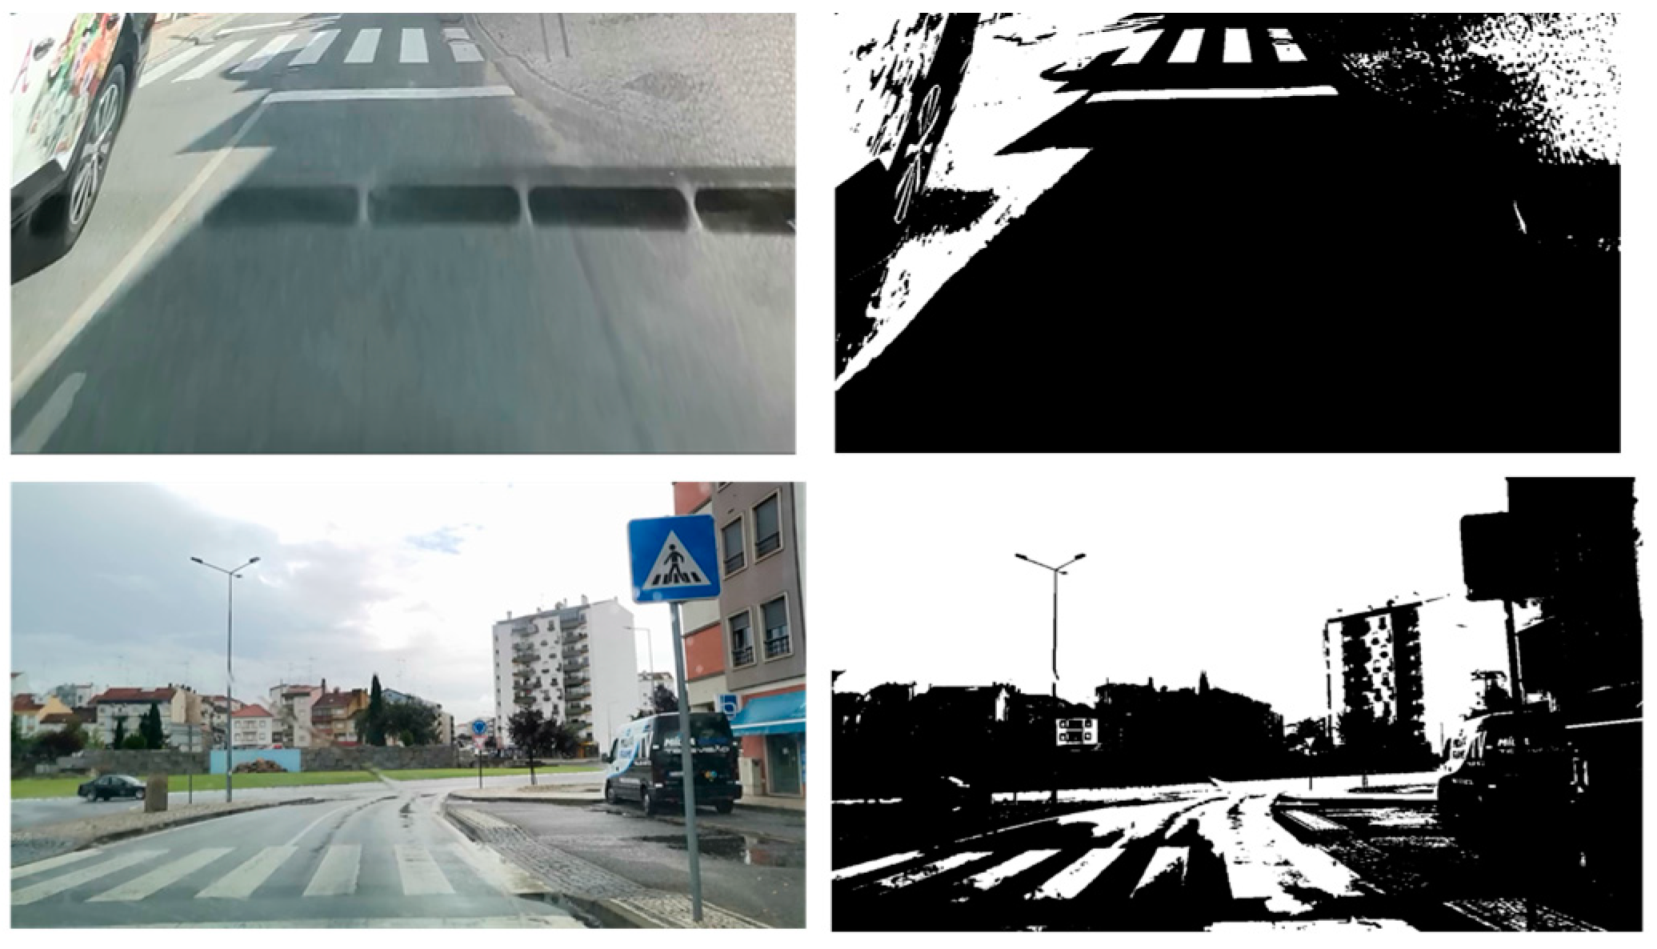
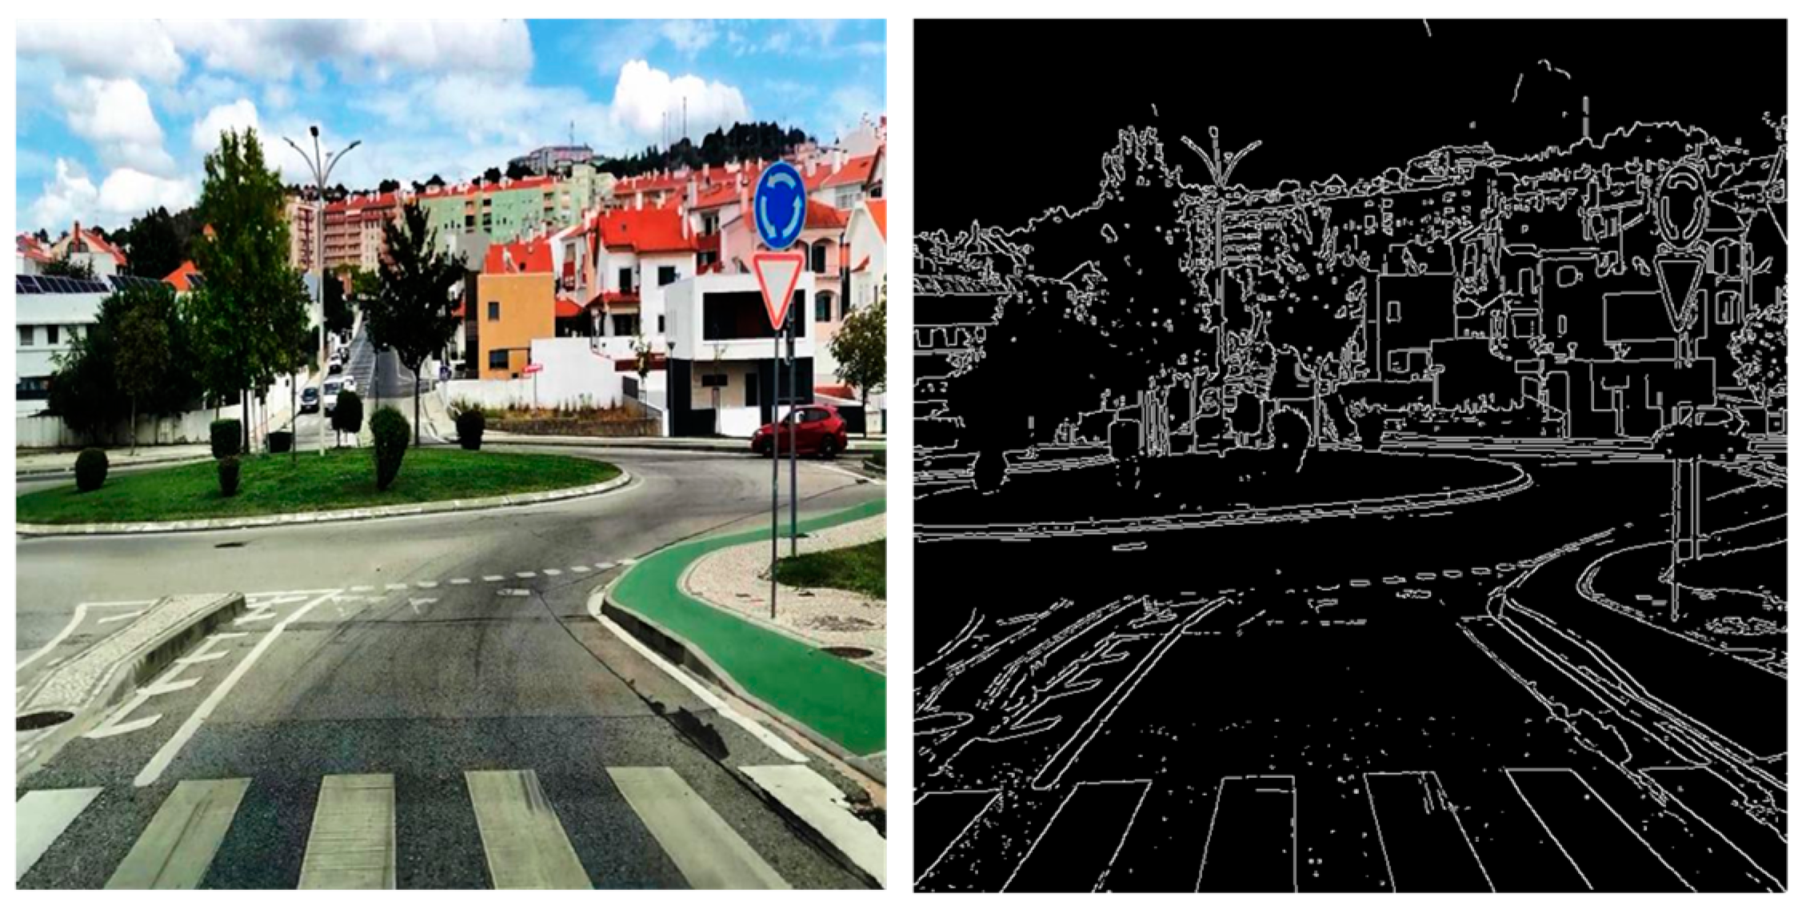
2.2. Image Processing
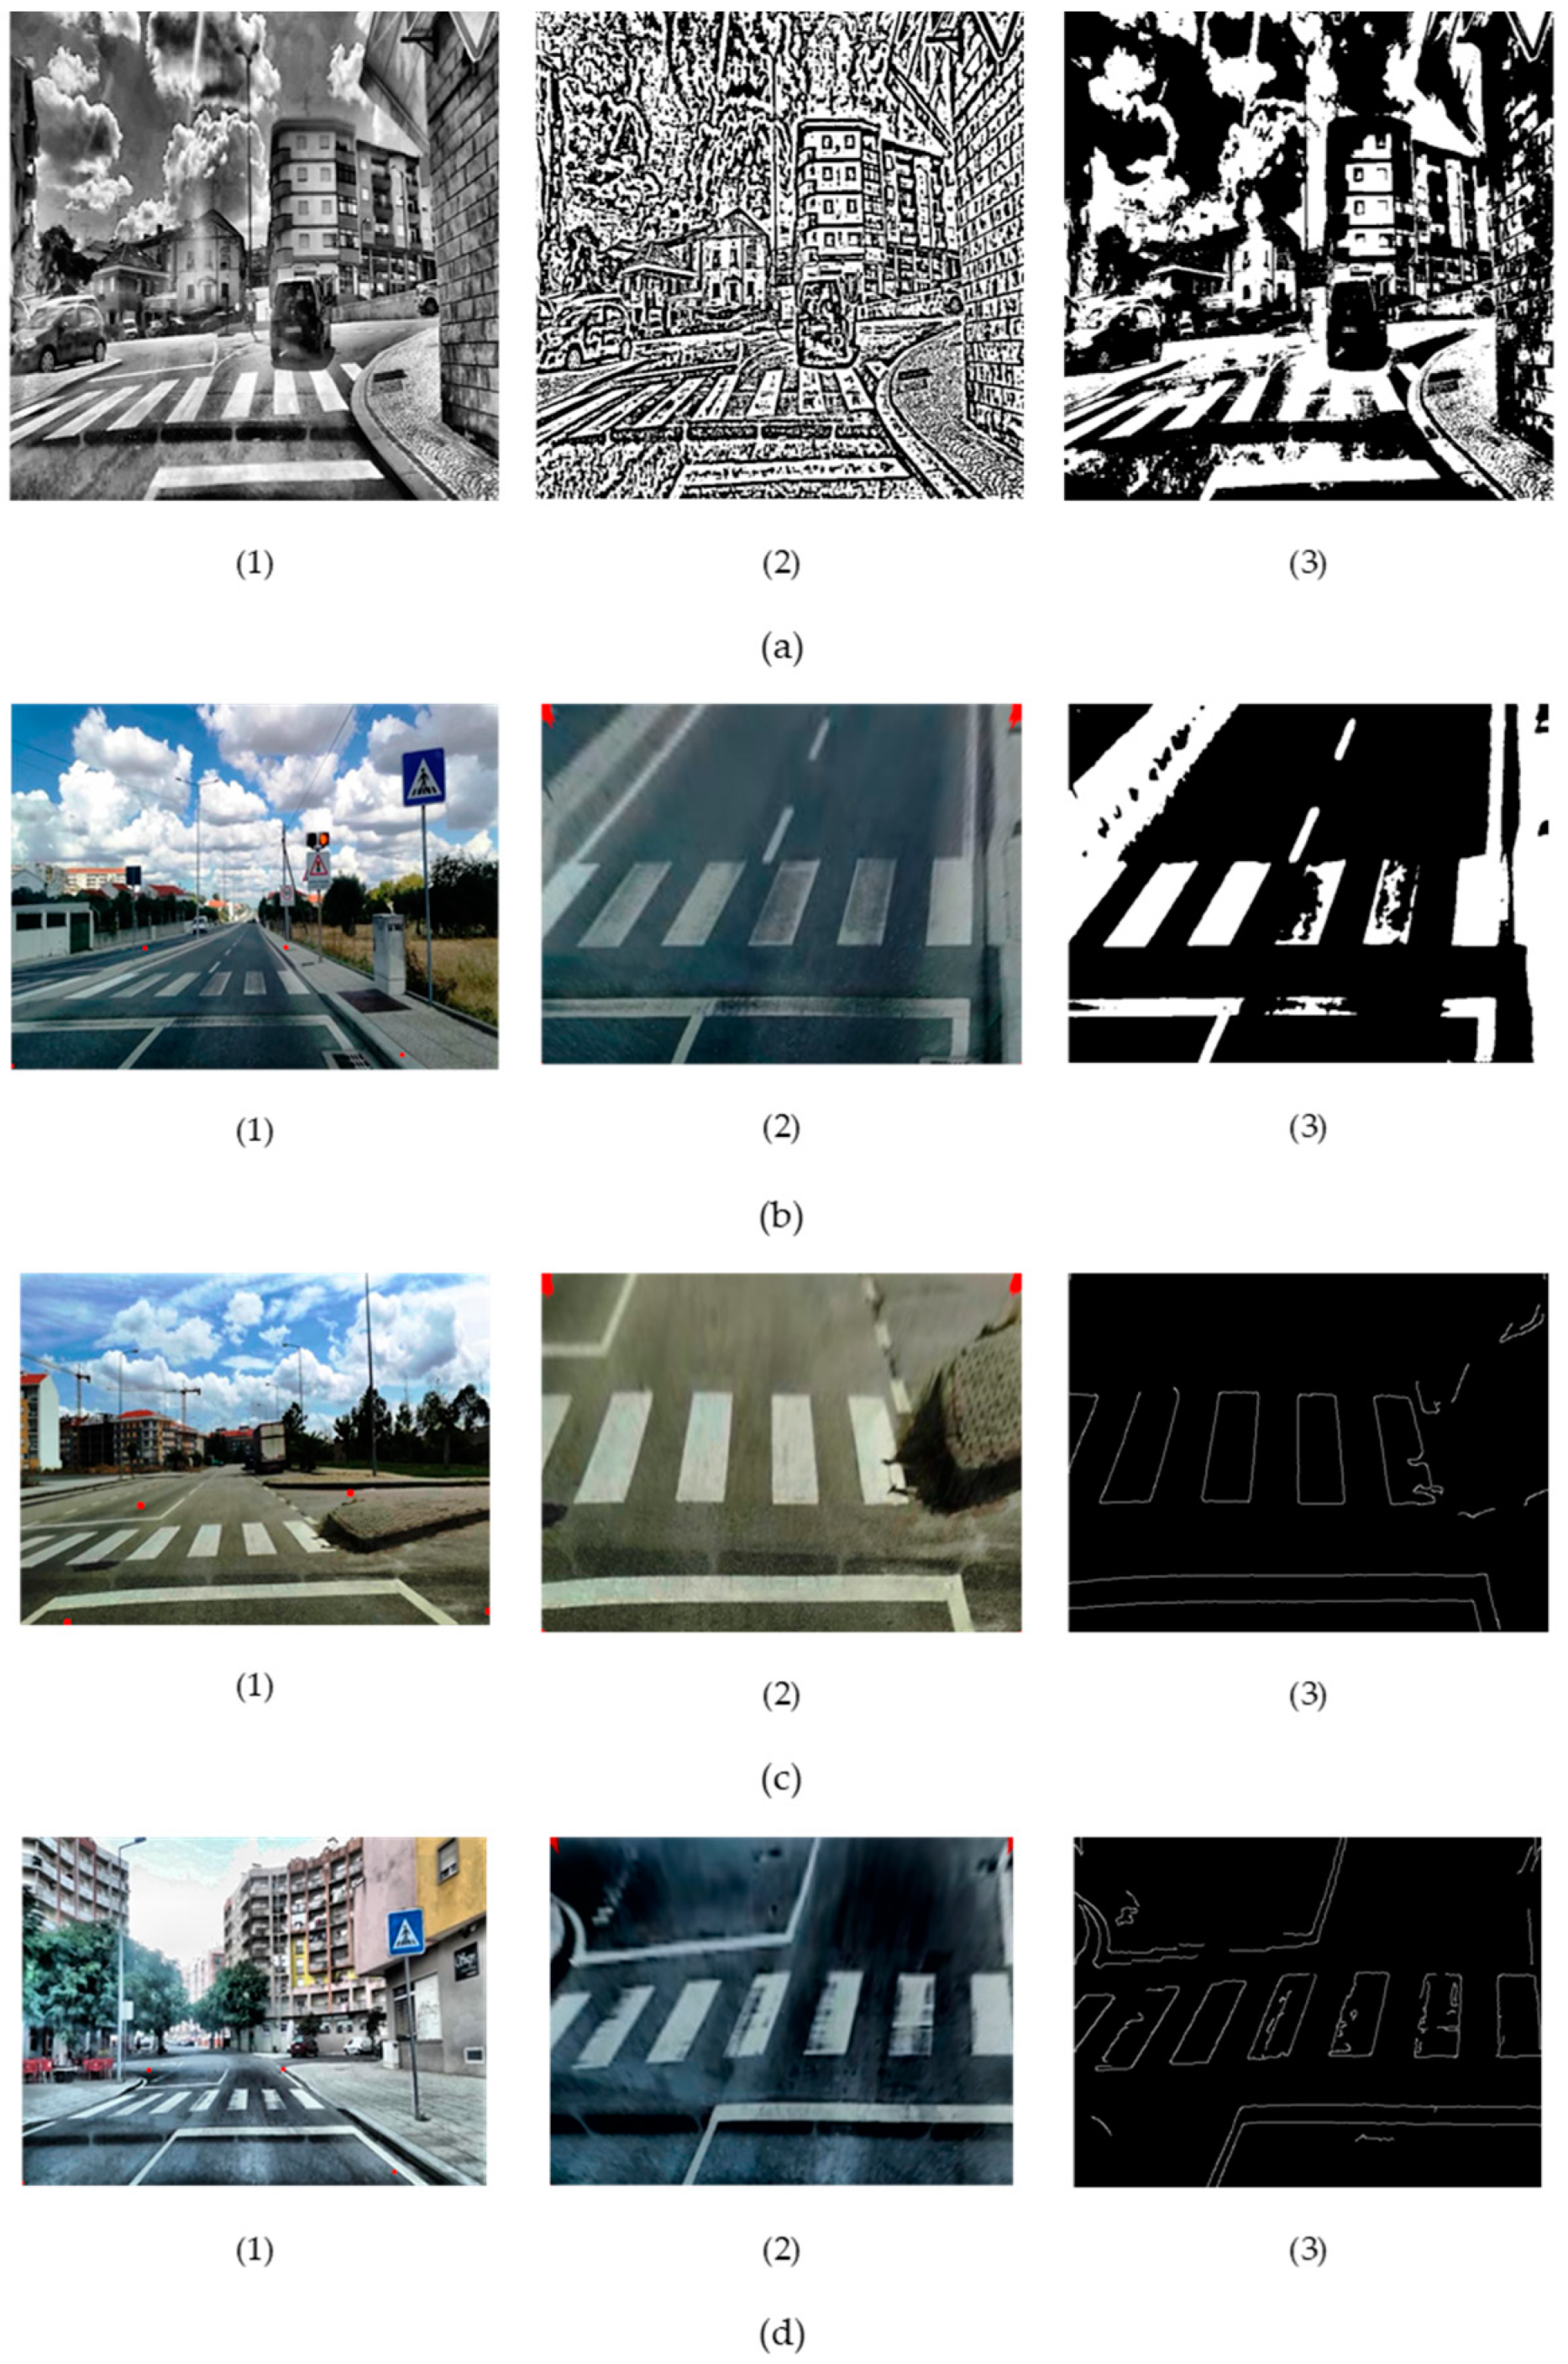
- If the intensity of a pixel, represented by Ii,j, is lower than a fixed threshold value, T, then that pixel will be replaced with the color black.
- Otherwise, it will be replaced with the color white.
2.3. Architectures for Classification
3. Related Work
4. Performance Evaluation
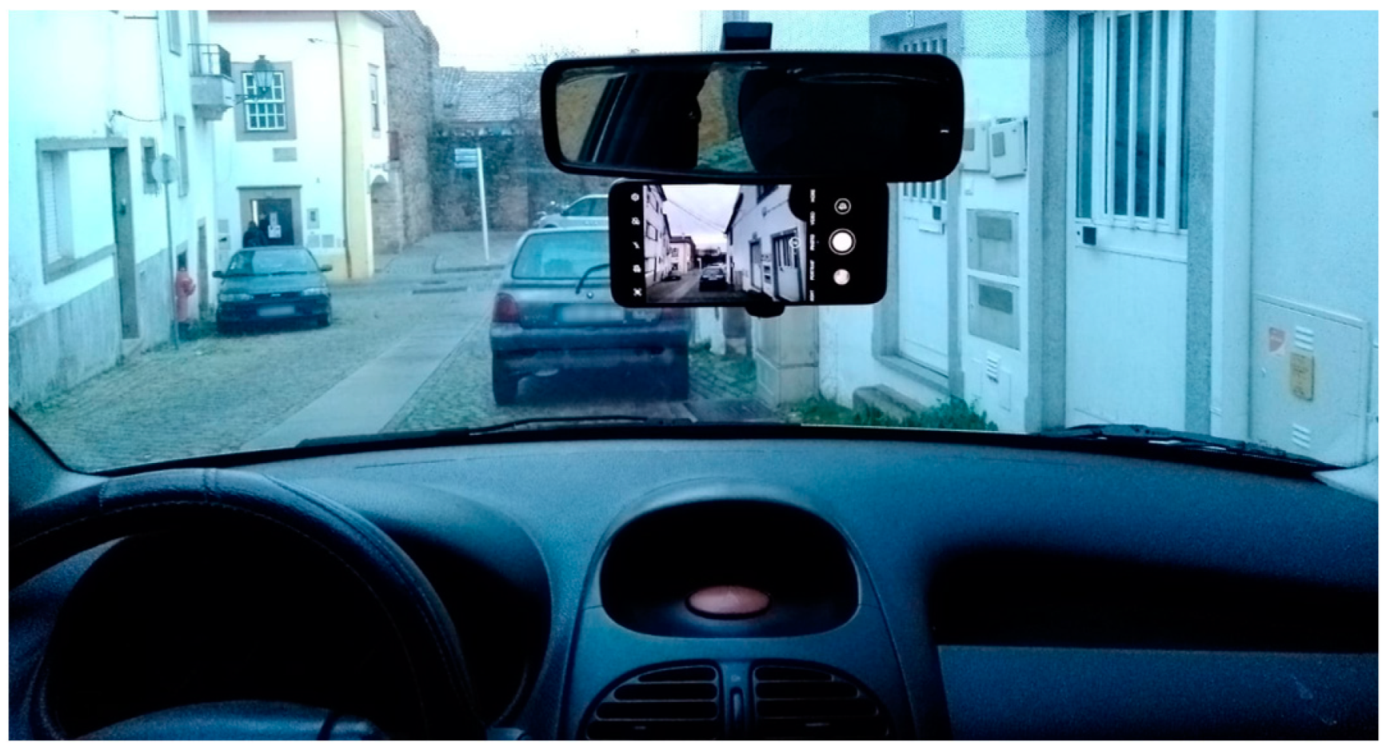
4.1. Description of the Dataset
4.2. Image Processing
4.3. Convolutional Neural Network Models
4.3.1. Benchmark Scenario
4.3.2. Performance Metrics
4.3.3. Results and Discussion
5. Discussion
6. Conclusions
Author Contributions
Funding
Institutional Review Board Statement
Informed Consent Statement
Data Availability Statement
Conflicts of Interest
References
- Seco, Á.; Macedo, J.; Costa, A. Manual de Planeamento das Acessibilidades e da Gestão Viária; CCDRN: Coimbra, Portugal, 2008. [Google Scholar]
- Segurança Rodoviária, A.N. Relatório Anual 2020; ARSPE: Barcarena, Brazil, 2020. [Google Scholar]
- Patella, S.M.; Sportiello, S.; Carrese, S.; Bella, F.; Asdrubali, F. The Effect of a LED Lighting Crosswalk on Pedestrian Safety: Some Experimental Results. Safety 2020, 6, 20. [Google Scholar] [CrossRef]
- Yin, C.; Xiong, Z.; Chen, H.; Wang, J.; Cooper, D.; David, B. A Literature Survey on Smart Cities. Sci. China Inf. Sci. 2015, 58, 100102. [Google Scholar] [CrossRef]
- Conservação|Infraestruturas de Portugal. Available online: https://www.infraestruturasdeportugal.pt/pt-pt/conservacao (accessed on 4 September 2023).
- What Is Computer Vision?|IBM. Available online: https://www.ibm.com/topics/computer-vision (accessed on 8 December 2023).
- What Is Deep Learning?-Deep Learning Explained–AWS. Available online: https://aws.amazon.com/what-is/deep-learning/ (accessed on 12 January 2024).
- Top 5 Applications of Convolution Neural Network. Available online: https://indiaai.gov.in/article/top-5-applications-of-convolution-neural-network (accessed on 21 December 2023).
- Mayank Mishra Convolutional Neural Networks, Explained. Available online: https://towardsdatascience.com/convolutional-neural-networks-explained-9cc5188c4939 (accessed on 20 December 2023).
- MK Gurucharan Basic CNN Architecture: Explaining 5 Layers of Convolutional Neural Network. Available online: https://www.upgrad.com/blog/basic-cnn-architecture/ (accessed on 20 December 2023).
- Wang, J.; Turko, R.; Shaikh, O.; Park, H.; Das, N.; Hohman, F.; Kahng, M.; Chau, P. CNN Explainer. Available online: https://poloclub.github.io/cnn-explainer/#article-relu (accessed on 21 December 2023).
- Lohia, A.; Dhananjay Kadam, K.; Raghvendra Joshi, R.; Bongale, A.M.; Dhananjay, K.; Raghvendra, R. Bibliometric Analysis of One-Stage and Two-Stage Object Detection. Libr. Philos. Pract. 2021, 4910, 34. [Google Scholar]
- Redmon, J.; Divvala, S.; Girshick, R.; Farhadi, A. You Only Look Once: Unified, Real-Time Object Detection. In Proceedings of the IEEE Computer Society Conference on Computer Vision and Pattern Recognition, Las Vegas, NV, USA, 27–30 June 2016; pp. 779–788. [Google Scholar]
- Cortes, C.; Research, G.; York, N.; Mohri, M.; Rostamizadeh, A. L2 Regularization for Learning Kernels. arXiv 2009, arXiv:1205.2653. [Google Scholar]
- Liu, W.; Anguelov, D.; Erhan, D.; Szegedy, C.; Reed, S.; Fu, C.-Y.; Berg, A.C. SSD: Single Shot MultiBox Detector. In Lecture Notes in Computer Science (Including Subseries Lecture Notes in Artificial Intelligence and Lecture Notes in Bioinformatics); Springer: Berlin/Heidelberg, Germany, 2016; Volume 9905, pp. 21–37. [Google Scholar]
- Girshick, R. Fast R-CNN. In Proceedings of the 2015 IEEE International Conference on Computer Vision (ICCV), Santiago, Chile, 7–13 December 2015; pp. 1440–1448. [Google Scholar]
- Simonyan, K.; Zisserman, A. Very Deep Convolutional Networks for Large-Scale Image Recognition. arXiv 2014, arXiv:1409.1556. [Google Scholar]
- He, K.; Zhang, X.; Ren, S.; Sun, J. Deep Residual Learning for Image Recognition. In Proceedings of the 2016 IEEE Conference on Computer Vision and Pattern Recognition (CVPR), Las Vegas, NV, USA, 27–30 June 2016; pp. 770–778. [Google Scholar]
- Howard, A.G.; Zhu, M.; Chen, B.; Kalenichenko, D.; Wang, W.; Weyand, T.; Andreetto, M.; Adam, H. MobileNets: Efficient Convolutional Neural Networks for Mobile Vision Applications. arXiv 2017, arXiv:1704.04861. [Google Scholar]
- Tan, M.; Le, Q.V. EfficientNet: Rethinking Model Scaling for Convolutional Neural Networks. In Proceedings of the 36th International Conference on Machine Learning, Long Beach, CA, USA, 9–15 June 2019; pp. 10691–10700. [Google Scholar]
- Carranza-García, M.; Torres-Mateo, J.; Lara-Benítez, P.; García-Gutiérrez, J. On the Performance of One-Stage and Two-Stage Object Detectors in Autonomous Vehicles Using Camera Data. Remote Sens. 2020, 13, 89. [Google Scholar] [CrossRef]
- Zhao, Z.-Q.; Zheng, P.; Xu, S.-T.; Wu, X. Object Detection with Deep Learning: A Review. IEEE Trans. Neural Netw. Learn. Syst. 2019, 30, 3212–3232. [Google Scholar] [CrossRef] [PubMed]
- Carrio, A.; Sampedro, C.; Rodriguez-Ramos, A.; Campoy, P. A Review of Deep Learning Methods and Applications for Unmanned Aerial Vehicles. J. Sens. 2017, 2017, 3296874. [Google Scholar] [CrossRef]
- He, K.; Gkioxari, G.; Dollar, P.; Girshick, R. Mask R-CNN. IEEE Trans. Pattern Anal. Mach. Intell. 2020, 42, 386–397. [Google Scholar] [CrossRef]
- Ren, S.; He, K.; Girshick, R.; Sun, J. Faster R-CNN: Towards Real-Time Object Detection with Region Proposal Networks. IEEE Trans. Pattern Anal. Mach. Intell. 2017, 39, 1137–1149. [Google Scholar] [CrossRef]
- Computer Vision: Instance Segmentation with Mask R-CNN|by Renu Khandelwal|Towards Data Science. Available online: https://towardsdatascience.com/computer-vision-instance-segmentation-with-mask-r-cnn-7983502fcad1 (accessed on 3 January 2024).
- HOG (Histogram of Oriented Gradients): An Overview|by Mrinal Tyagi|Towards Data Science. Available online: https://towardsdatascience.com/hog-histogram-of-oriented-gradients-67ecd887675f (accessed on 5 September 2023).
- Alhindi, T.J.; Kalra, S.; Ng, K.H.; Afrin, A.; Tizhoosh, H.R. Comparing LBP, HOG and Deep Features for Classification of Histopathology Images. In Proceedings of the 2018 International Joint Conference on Neural Networks (IJCNN), Rio de Janeiro, Brazil, 8–13 July 2018; pp. 1–7. [Google Scholar]
- Nemutlu, D. HOG Feature Descriptor with Python and OpenCV. Available online: https://github.com/dahinemutlu/hog-feature-descriptor (accessed on 6 September 2023).
- Nemutlu, D. HOG Feature Descriptor. Available online: https://medium.com/@dnemutlu/hog-feature-descriptor-263313c3b40d (accessed on 6 September 2023).
- Dalal, N.; Triggs, B. Histograms of Oriented Gradients for Human Detection. In Proceedings of the 2005 IEEE Computer Society Conference on Computer Vision and Pattern Recognition (CVPR’05), San Diego, CA, USA, 20–25 June 2005; Volume 1, pp. 886–893. [Google Scholar]
- Kaspers, A. Blob Detection; Image Sciences Institute: Utrecht, The Netherlands, 2011. [Google Scholar]
- OpenCV-Open Computer Vision Library. Available online: https://opencv.org/ (accessed on 7 November 2023).
- Mammeri, A.; Boukerche, A.; Tang, Z. A Real-Time Lane Marking Localization, Tracking and Communication System. Comput. Commun. 2016, 73, 132–143. [Google Scholar] [CrossRef]
- Jia, W.; Zhang, H.; He, X. Region-Based License Plate Detection. J. Netw. Comput. Appl. 2007, 30, 1324–1333. [Google Scholar] [CrossRef]
- Venkatesh, M.; Vijayakumar, P. A Simple Bird’s Eye View Transformation Technique. Int. J. Sci. Eng. Res. 2012, 3, 5. [Google Scholar]
- Jayasinghe, O.; Hemachandra, S.; Anhettigama, D.; Kariyawasam, S.; Rodrigo, R.; Jayasekara, P. CeyMo: See More on Roads—A Novel Benchmark Dataset for Road Marking Detection. In Proceedings of the IEEE/CVF Winter Conference on Applications of Computer Vision, Waikoloa, HI, USA, 3–8 January 2022. [Google Scholar]
- Muthalagu, R.; Bolimera, A.; Kalaichelvi, V. Lane Detection Technique Based on Perspective Transformation and Histogram Analysis for Self-Driving Cars. Comput. Electr. Eng. 2020, 85, 106653. [Google Scholar] [CrossRef]
- Toth, T.; Bauer, D.; Sukosd, F.; Horvath, P. Fisheye Transformation Enhances Deep-Learning-Based Single-Cell Phenotyping by Including Cellular Microenvironment. Cell Rep. Methods 2022, 2, 100339. [Google Scholar] [CrossRef] [PubMed]
- Canny, J. A Computational Approach to Edge Detection. IEEE Trans. Pattern Anal. Mach. Intell. 1986, 6, 679–698. [Google Scholar] [CrossRef]
- Jose, A.; Deepa Merlin Dixon, K.; Joseph, N.; George, E.S.; Anjitha, V. Performance Study of Edge Detection Operators. In Proceedings of the 2014 International Conference on Embedded Systems (ICES), Coimbatore, India, 11 July 2014; pp. 7–11. [Google Scholar]
- Cortes, C.; Vapnik, V. Support-Vector Networks. Mach. Learn. 1995, 20, 273–297. [Google Scholar] [CrossRef]
- Support Vector Machine—Introduction to Machine Learning Algorithms|by Rohith Gandhi|Towards Data Science. Available online: https://towardsdatascience.com/support-vector-machine-introduction-to-machine-learning-algorithms-934a444fca47 (accessed on 10 November 2023).
- Sandler, M.; Howard, A.; Zhu, M.; Zhmoginov, A.; Chen, L.-C. MobileNetV2: Inverted Residuals and Linear Bottlenecks. In Proceedings of the 2018 IEEE/CVF Conference on Computer Vision and Pattern Recognition, Salt Lake City, UT, USA, 1 June 2018; pp. 4510–4520. [Google Scholar]
- Chollet, F. Xception: Deep Learning with Depthwise Separable Convolutions. In Proceedings of the 2017 IEEE Conference on Computer Vision and Pattern Recognition (CVPR), Honolulu, HI, USA, 1 July 2017; pp. 1800–1807. [Google Scholar]
- Zebin, T.; Scully, P.J.; Peek, N.; Casson, A.J.; Ozanyan, K.B. Design and Implementation of a Convolutional Neural Network on an Edge Computing Smartphone for Human Activity Recognition. IEEE Access 2019, 7, 133509–133520. [Google Scholar] [CrossRef]
- Zhang, Z.-D.; Tan, M.-L.; Lan, Z.-C.; Liu, H.-C.; Pei, L.; Yu, W.-X. CDNet: A Real-Time and Robust Crosswalk Detection Network on Jetson Nano Based on YOLOv5. Neural. Comput. Appl. 2022, 34, 10719–10730. [Google Scholar] [CrossRef]
- Hu, J.; Shen, L.; Albanie, S.; Sun, G.; Wu, E. Squeeze-and-Excitation Networks. IEEE Trans. Pattern Anal. Mach. Intell. 2020, 42, 2011–2023. [Google Scholar] [CrossRef] [PubMed]
- Lee, S.; Kim, J.; Yoon, J.S.; Shin, S.; Bailo, O.; Kim, N.; Lee, T.-H.; Hong, H.S.; Han, S.-H.; Kweon, I.S. VPGNet: Vanishing Point Guided Network for Lane and Road Marking Detection and Recognition. In Proceedings of the 2017 IEEE International Conference on Computer Vision (ICCV), 22 October 2017; pp. 1965–1973. [Google Scholar]
- Kawano, M.; Mikami, K.; Yokoyama, S.; Yonezawa, T.; Nakazawa, J. Road Marking Blur Detection with Drive Recorder. In Proceedings of the 2017 IEEE International Conference on Big Data (Big Data), Boston, MA, USA, 11–14 December 2017; pp. 4092–4097. [Google Scholar]
- Malbog, M.A. MASK R-CNN for Pedestrian Crosswalk Detection and Instance Segmentation. In Proceedings of the 2019 IEEE 6th International Conference on Engineering Technologies and Applied Sciences (ICETAS), Kuala Lumpur, Malaysia, 20–21 December 2019; pp. 1–5. [Google Scholar]
- Kawasaki, T.; Iwamoto, T.; Matsumoto, M.; Yonezawa, T.; Nakazawa, J.; Takashio, K.; Tokuda, H. A Method for Detecting Damage of Traffic Marks by Half Celestial Camera Attached to Cars. In Proceedings of the 12th EAI International Conference on Mobile and Ubiquitous Systems: Computing, Networking and Services, Coimbra, Portugal, 22–24 July 2015. [Google Scholar]
- Chen, C.; Chandra, S.; Han, Y.; Seo, H. Deep Learning-Based Thermal Image Analysis for Pavement Defect Detection and Classification Considering Complex Pavement Conditions. Remote Sens. 2021, 14, 106. [Google Scholar] [CrossRef]
- Fang, N.; Zhang, Z.; Xia, B.; Yao, Z. Polite Zebra Crossing Driver Reminding System Design. In Proceedings of the 2021 International Conference on Bioinformatics and Intelligent Computing, Harbin, China, 22–24 January 2021; ACM: New York, NY, USA; pp. 390–394. [Google Scholar]
- Greenhalgh, J.; Mirmehdi, M. Detection and Recognition of Painted Road Surface Markings. In Proceedings of the International Conference on Pattern Recognition Applications and Methods, Lisbon, Portugal, 10–12 January; 2015; Volume 1, pp. 130–138. [Google Scholar]
- Kaya, Ö.; Çodur, M.Y.; Mustafaraj, E. Automatic Detection of Pedestrian Crosswalk with Faster R-CNN and YOLOv7. Buildings 2023, 13, 1070. [Google Scholar] [CrossRef]
- Zhong, J.; Feng, W.; Lei, Q.; Le, S.; Wei, X.; Wang, Y.; Wang, W. Improved U-Net for Zebra-Crossing Image Segmentation. In Proceedings of the 2020 IEEE 6th International Conference on Computer and Communications (ICCC), Chengdu, China, 11–14 December 2020; pp. 388–393. [Google Scholar]
- Meem, M.I.; Dhar, P.K.; Khaliluzzaman, M.; Shimamura, T. Zebra-Crossing Detection and Recognition Based on Flood Fill Operation and Uniform Local Binary Pattern. In Proceedings of the 2019 International Conference on Electrical, Computer and Communication Engineering (ECCE), Cox’sBazar, Bangladesh, 7–9 February 2019; pp. 1–6. [Google Scholar]
- GitHub-AlexeyAB/Darknet: YOLOv4/Scaled-YOLOv4/YOLO-Neural Networks for Object Detection (Windows and Linux Version of Darknet). Available online: https://github.com/AlexeyAB/darknet (accessed on 23 October 2023).
- Models/Research/Object_detection/G3doc/Tf2_detection_zoo.Md at Master Tensorflow/Models GitHub. Available online: https://github.com/tensorflow/models/blob/master/research/object_detection/g3doc/tf2_detection_zoo.md (accessed on 29 December 2023).
- Roboflow: Give Your Software the Power to See Objects in Images and Video. Available online: https://roboflow.com/ (accessed on 5 October 2023).
- Crosswalks Dataset > Overview. Available online: https://universe.roboflow.com/projeto-5fy5m/crosswalks-zbjgg (accessed on 5 December 2023).
- Google Colab. Available online: https://colab.google/ (accessed on 6 November 2023).
- Kaggle: Your Machine Learning and Data Science Community. Available online: https://www.kaggle.com/ (accessed on 6 November 2023).
- Ying, X. An Overview of Overfitting and Its Solutions. J. Phys. Conf. Ser. 2019, 1168, 022022. [Google Scholar] [CrossRef]
- Pothuganti, S. Review on Over-Fitting and under-Fitting Problems in Machine Learning and Solutions International Journal of Advanced Research in Electrical, Electronics and Instrumentation Engineering Review on over-Fitting and under-Fitting Problems in Machine Learning and Solutions. Artic. Int. J. Adv. Res. Electr. Electron. Instrum. Eng. 2018, 7, 3692–3695. [Google Scholar]
- COCO-Common Objects in Context. Available online: https://cocodataset.org/#home (accessed on 12 January 2024).
- TensorFlow. Available online: https://www.tensorflow.org/ (accessed on 12 January 2024).
- Zhuang, F.; Qi, Z.; Duan, K.; Xi, D.; Zhu, Y.; Zhu, H.; Xiong, H.; He, Q. A Comprehensive Survey on Transfer Learning. Proc. IEEE 2019, 109, 43–76. [Google Scholar] [CrossRef]


| References | Year of Publication | Dataset | Purpose of Study | Methodology | Results |
|---|---|---|---|---|---|
| [37] | 2022 | Dataset created by authors | To help make up for the lack of public datasets related to road markings. | SSD MobileNetV1, SSD InceptionV2, Mask-RCNN-InceptionV2, and Mask-RCNN-ResNet50 | The ResNet 50 version performed better in scenarios with rain, shadows, and nearby obstacles. The Inception-v2 excelled in nighttime environments. |
| [38] | 2020 | N/A | Propose an algorithm for identifying road markings using only histogram analysis and perspective transformation techniques. | Perspective transformation, Threshold. | The results indicate that the curved markings approach outperformed the minimalist approach. Conversely, the second approach demonstrated greater resilience and was less vulnerable to adverse conditions. |
| [47] | 2022 | CDNet dataset, created by authors | Detect pedestrian crossings in real time and optimizing algorithms for devices with limited resources. | YOLOv5 with NST, ROI, SVM, and FOG algorithms. | YOLOv5 achieved an F1 score of 94.83% in complex scenarios. In less complex scenarios, 98% was achieved. |
| [49] | 2017 | Dataset created by authors | Propose a multi-task network to detect carriageways and road markings in adverse weather conditions. | VPGNet for road mark detection and MSER, FAST, and HOG to extract features and SVM to produce labels. | VPGNet has proved to be robust in different weather conditions, in real time. |
| [50] | 2017 | Dataset created by authors | Create a solution to identify road markings using the YOLO and VGG-16 algorithms. | VGG-16 as a way of extracting characteristics and using YOLO to identify brands. | It showed an average precision of 22.4% for pedestrian crossings. |
| [51] | 2019 | Dataset created by authors | Detect pedestrian crossings using Instance Segmentation algorithms. | Mask R-CNN using ResNet-101 for the network backbone. | Mask R-CNN with ResNet-101 as the backbone, recorded an mAP of 97%. |
| [52] | 2015 | Dataset created by authors | Use of an image recognition algorithm to identify possible damage to road markings. | Image processing techniques. | Measure Outline Percentage showed a precision of 76.6%, Measure Detect Percentage achieved 51.8%. Using an appropriate threshold value for various atmospheric scenarios is a problem. |
| [53] | 2022 | Dataset created by authors | Propose a pavement damage detection model based on the fusion of RGB thermal images, using EfficientNet as a backbone. | EfficientNet B4 and EfficientNet B5 | Using image fusion to detect damage to road markings can achieve an accuracy of 98.34%. When using the augmented dataset, the detection model appears to be more stable, achieving 98.35% accuracy, 98.34% recovery, and 98.34% F1 score. |
| [54] | 2021 | N/A | Propose an algorithm capable of identifying pedestrian crossings using image processing techniques. | ROI, Hough Transform line, Canny Edge, and Inverse perspective Mapping. | There were 96% of pedestrian crossings identified in 51 test images, all of which were in good lighting conditions. |
| [55] | 2015 | N/A | Create a solution to identify road markings and recognize text on them, using image processing techniques. | MSER, SVM, HOG, inverse perspective mapping, and optical character recognition. | An F score of about 85% was obtained for text and 91% for symbols. |
| [56] | 2023 | Dataset created by authors | Create a solution to identify pedestrian crossings using the YOLO and Fast R-CNN models. | Faster R-CNN (R101-FPN and X101-FPN) and YOLOv7. | YOLOv7 obtained an accuracy of 98.6%, and Faster R-CNN obtained an accuracy of 98.29%. |
| [57] | 2020 | Dataset created by authors | Using an image segmentation model to identify pedestrian crossings. | U-Net together with ResNet-34. | The U-Net model showed an accuracy of 94.6%. The use of ResNet-34 improved the training of the U-Net model, which could prevent the model from degrading over training time. |
| [58] | 2019 | N/A | Propose an algorithm capable of identifying pedestrian crossings using image processing techniques. | Hough Transform line, Canny Edge, adaptive histogram equalization, SVM, and Flood Fill. | In different atmospheric conditions, the accuracy was 97.95%, while in different lighting conditions the accuracy was 98.17%. |
| Date of Capture | Surface Conditions | Time of Capture | Number of Images |
|---|---|---|---|
| 8 September 2023 | Dry | Morning | 151 |
| 9 September 2023 | Wet | Morning | 137 |
| 12 September 2023 | Dry | Afternoon | 156 |
| 2 October 2023 | Dry | End of the day | 143 |
| 3 October 2023 | Dry | Morning | 55 |
| Total: 642 |
| Techniques | Version A | Version B |
|---|---|---|
| Resize 1 | 616 × 616 | 608 × 608 |
| Auto-Adjust Contrast 1 | Histogram Equalization | Adaptive Equalization |
| Flip (Horizontal) 2 | Used | Used |
| Grayscale 2 | Applied to 25% of images | Applied to 25% of images |
| Noise 2 | Up to 1% of pixels | Not used |
| Brightness 3 | Not used | Between −10% and +10% |
| Exposure 3 | Not used | Between −10% and +10% |
| Class | Train | Validation | Test | Total |
|---|---|---|---|---|
| Passadeira * | 1190 1 | 259 1 | 55 1 | 1504 1 |
| 1250 2 | 279 2 | 20 2 | 1549 2 |
| Model | Input Size | Batch_Size | mAP (%) | Epochs |
|---|---|---|---|---|
| YOLOv4-tiny | 608 × 608 | 32 | 77.3 | 51 |
| SSD-MobileNet-V2 | 320 × 320 | 16 | 31.24 | 640 |
| SSD-EfficientDet-D0 | 512 × 512 | 4 | 26.36 | 640 |
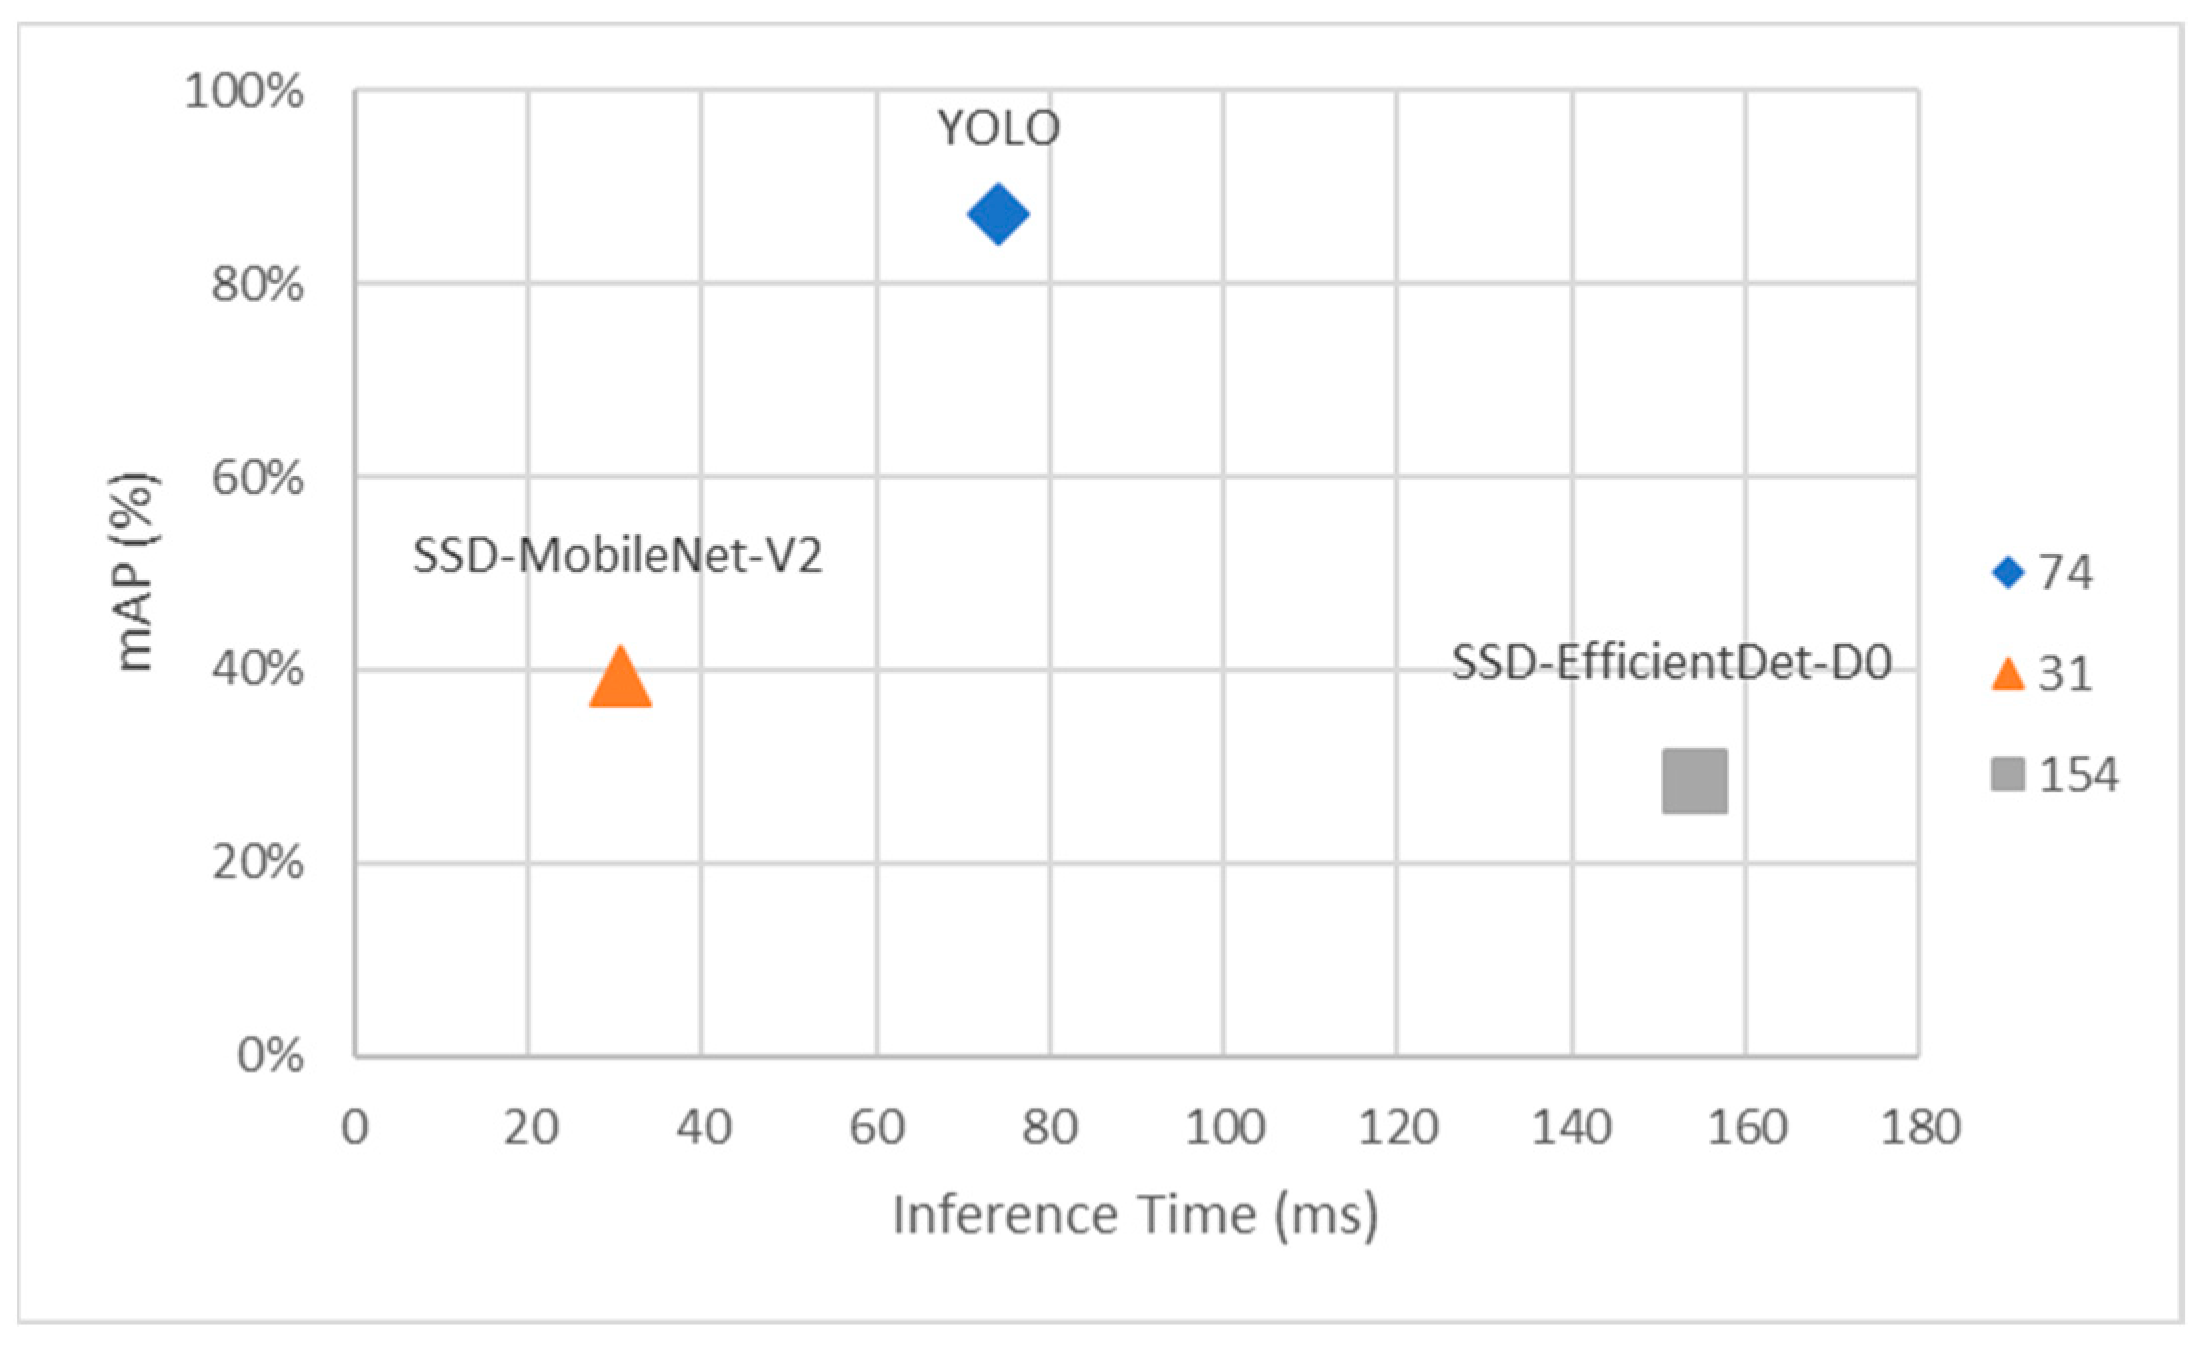
| Model | Input Size | Batch_Size | mAP (%) | Epochs |
|---|---|---|---|---|
| YOLOv4-tiny | 608 × 608 | 32 | 87 | 153 |
| SSD-MobileNet-V2 | 320 × 320 | 16 | 39.29 | 1024 |
| SSD-EfficientDet-D0 | 512 × 512 | 4 | 28.35 | 736 |
Disclaimer/Publisher’s Note: The statements, opinions and data contained in all publications are solely those of the individual author(s) and contributor(s) and not of MDPI and/or the editor(s). MDPI and/or the editor(s) disclaim responsibility for any injury to people or property resulting from any ideas, methods, instructions or products referred to in the content. |
© 2024 by the authors. Licensee MDPI, Basel, Switzerland. This article is an open access article distributed under the terms and conditions of the Creative Commons Attribution (CC BY) license (https://creativecommons.org/licenses/by/4.0/).
Share and Cite
Rosa, G.J.M.; Afonso, J.M.S.; Gaspar, P.D.; Soares, V.N.G.J.; Caldeira, J.M.L.P. Detecting Wear and Tear in Pedestrian Crossings Using Computer Vision Techniques: Approaches, Challenges, and Opportunities. Information 2024, 15, 169. https://doi.org/10.3390/info15030169
Rosa GJM, Afonso JMS, Gaspar PD, Soares VNGJ, Caldeira JMLP. Detecting Wear and Tear in Pedestrian Crossings Using Computer Vision Techniques: Approaches, Challenges, and Opportunities. Information. 2024; 15(3):169. https://doi.org/10.3390/info15030169
Chicago/Turabian StyleRosa, Gonçalo J. M., João M. S. Afonso, Pedro D. Gaspar, Vasco N. G. J. Soares, and João M. L. P. Caldeira. 2024. "Detecting Wear and Tear in Pedestrian Crossings Using Computer Vision Techniques: Approaches, Challenges, and Opportunities" Information 15, no. 3: 169. https://doi.org/10.3390/info15030169