

Learning Circuits and Coding with Arduino Board in Higher Education Using Tangible and Graphical User Interfaces


1
Department of Information and Electronic Engineering, International Hellenic University (IHU), 57400 Thessaloniki, Greece
2
School of Philosophy and Education, Department of Education, Aristotle University of Thessaloniki (AUTH), 54124 Thessaloniki, Greece
*
Author to whom correspondence should be addressed.
Information 2024, 15(5), 245; https://doi.org/10.3390/info15050245
Submission received: 17 March 2024
/
Revised: 20 April 2024
/
Accepted: 21 April 2024
/
Published: 24 April 2024
(This article belongs to the Special Issue Human–Computer Interaction in Smart Cities)
Abstract
:The integration of the Arduino board into educational settings has penetrated across various educational levels. The teaching of this subject can be accomplished by (a) using real components in breadboards, (b) prefabricated modular boards that snap together, and (c) utilizing computer simulations. Yet, it is unknown which interface offers a more effective learning experience. Therefore, this experimental study aims to compare the effectiveness of these interfaces in a series of three laboratory exercises involving 110 university students, who were divided into three groups: (a) the first group used a tangible user interface, implementing circuits on breadboards, (b) the second group also used a tangible interface but with modular boards, and (c) the third group used a graphical user interface to simulate circuits using Tinkercad. For each laboratory exercise, students completed both pretests and posttests. Also, they provided feedback through five Likert-type attitude questions regarding their experiences. In terms of data analysis, t-tests, ANOVA, and ANCOVA, along with bootstrapping, and principal component analysis were employed. The results suggest that among the participants, those who used a graphical user interface stated that their understanding of the interconnection of components in microcontroller circuits was enhanced, while students with previous experience in microcontroller labs found the circuit creation process easier than students without experience.
1. Introduction
Science teaching and learning are linked to implementing laboratory exercises [1,2]. Laboratories provide a safe, controlled learning environment in which students are encouraged to conduct experiments, witnessing firsthand the practical application of theoretical concepts [3,4]. Studies show that this learning process through labs can have a positive impact on the student’s academic performance, providing a deeper understanding of the studied subject [5,6]. The implementation of exercises in laboratory settings can be divided into two categories: students can experiment using either real components and modular boards with a tangible user interface (TUI) or computer simulations with a graphical user interface (GUI) [7]. According to [8], “TUIs may be considered as physical objects whose manipulation may trigger various digital effects, providing ways for innovative play and learning”. Specifically, in microcontroller circuits, pressing a button, changing the value, or adjusting the position of a real component can directly influence the digital output. Hence, throughout this article, the term TUI is adopted when real components in breadboards or modular boards are used to create a circuit.
Regarding a real laboratory, the equipment is tangible including measuring instruments and complex devices. Furthermore, engagement with the physical world may have a beneficial impact on students, as it stimulates multiple senses, appears to increase children’s performance, and may positively influence users’ attitudes [9,10]. However, long-term operation can be expensive due to frequent component damage and failures [11,12,13]. Additionally, in certain cases, students may find it hard to perceive some aspects of the experiment, such as the interaction of sub-atomic particles, with their senses [14,15].
Related to virtual laboratories, the students require access to a device, such as a computer, to run a virtual simulation of the experiment they wish to conduct [16,17]. Within the digital environment, they can perform measurements while benefiting from a richer and more detailed visual representation of the phenomenon under study [18,19,20]. Moreover, virtual laboratories are considered safer and more cost-effective since experiments can be modified and repeated countless times without risking damaging physical components [21,22]. Yet, it is important to note that simulations sometimes involve conventions and simplifications, which may result in outcomes that could overlook certain aspects of reality.
In the field of microcontroller electronic circuits, Arduino development boards [23] have found widespread use in educational settings across various academic levels, from primary school to university [24,25,26]. These boards can be programmed easily, while the extensive Arduino community provides a wealth of online resources and suggestions for implementing circuits, catering to beginners and those working on more advanced projects [27,28,29]. In addition, Arduino shields have become widely popular—these are modular boards that can be mounted on top of the Arduino, providing pre-built circuits for a wide range of applications. Examples include motor shields, prototype shields, Ethernet shields, GSM shields, Wi-Fi shields, and LCD shields [30].
Moreover, studies have demonstrated the potential benefits of using Arduino in the educational process. For example, Tselegkaridis and Sapounidis [31] claim that modular boards may enhance code learning for Arduino. Based on them, there is a positive correlation between perceived usability and students’ performance. However, it remains uncertain which interface supports students more effectively in achieving a higher performance, and what kind of attitudes students hold toward the different interfaces. Therefore, this paper presents an empirical study involving 110 university students exploring their performance and attitude toward microcontroller circuits using different interfaces. In addition, this paper assesses whether students’ prior experience with microcontroller circuits on Arduino boards might influence their performance and attitude. Consequently, this article deepens our understanding of the impact of interfaces in this field by comparing the performance and opinions of three groups of students: (a) those who used breadboards, (b) those who used modular boards, and (c) those who used simulations.
1.1. Arduino in Education
Teaching science can have a positive impact on students, particularly when conducted within the framework of inquiry-based learning, ensuring active participation rather than passive observation [32,33,34]. The utilization of Arduino in this context has become increasingly prevalent in recent times. Moreover, the teaching of Arduino circuits can be divided into three parts: (a) microcontroller—students need to learn about the functions of the microcontroller itself, including, for example, special function registers, (b) coding—they should write code that the microcontroller will execute, and (c) circuit—they should gain an understanding of how the code affects the circuit and how various peripherals are connected to the microcontroller.
Educators and researchers use Arduino boards as an educational and prototyping tool, integrating them into diverse research fields [35,36,37]. For example, Papadimitropoulos et al. [38] conducted chemistry experiments for middle school students, incorporating Arduino as a pH-meter. In the field of educational robotics, Arduino has been used as a “central processing unit” [39]. Also, in the field of electronic circuits, Ntourou et al. conducted a study [40], involving 33 fifth-grade primary school students, and found that the use of Arduino for teaching circuits did not significantly affect motivation but did influence computational thinking. Similarly, Fidai et al. [41] conducted a meta-analysis focused on K-12 students, examining the development of computational thinking through Arduino applications. The results of this study demonstrated that students who engaged in engineering activities using Arduino and Scratch might enhance their problem-solving skills and computational understanding. In addition, according to García-Tudela and Marín-Marín [42], researchers in primary education mostly focus on developing students’ programming skills rather than improving electronic circuits learning.
Furthermore, Kırıkkaya and Başaran [43] investigated the attitudes toward technology of 50 university students and found that using Arduino can have a positive impact on them. However, a similar investigation conducted by Hadiati et al. [44] with 77 university students showed that the use of Arduino did not positively affect attitudes toward technology. Hence, it is important to continue the inquiry into students’ attitudes toward the utilization of Arduino to deepen our understanding and draw more concrete conclusions.
1.2. Prior Comparison in Electronic Circuits
In this paragraph, we examine studies that have assessed user interfaces in the context of learning electronic circuits.
Kapici et al. [45] compared graphical and hands-on experiments in a middle school involving 116 students. The study lasted four hours per week for four weeks. According to the findings, there were no statistically significant differences in the students’ performance in the two experimental groups (GUI, TUI). In addition, Kapici et al. [46] compared TUI and GUI in a middle school with the participation of 143 students, and the intervention lasted four hours per week for four weeks. The results revealed that students who utilized a combination of TUI and GUI outperformed those who used only GUI. Additionally, the two interfaces demonstrated a similar effect on skills development. Moreover, Manunure et al. [47] compared real components and GUI in a middle school involving 49 participants. The study lasted 90 min per week for three weeks. The findings indicated that the combination of TUI and GUI contributed to students’ better performance compared to the use of TUI alone.
Kollöffel and de Jong’s [48] research took place in a secondary vocational engineering school, with the participation of 43 students, comparing hands-on and graphical experiments, and lasted 45 min per week for nine weeks. The results showed that students using GUI outperformed students using TUI. Also, Finkelstein et al. conducted a study [49] at a university with 231 participants. The study lasted one semester, and the results revealed that students who utilized GUI achieved a higher performance than those who used real components. Moreover, Zacharia’s [50] study was conducted at a university, involving 90 students, and lasted one semester. The students were divided into two groups: one using TUI and the other utilizing a combination of TUI and GUI. The findings revealed that the group employing both interfaces achieved higher performance scores than the group using only TUI.
Zacharia and de Jong’s [51] study was conducted at a university, involving 194 students, and the study lasted 90 min per week for 15 weeks. The findings indicated that when implementing simple circuits, TUI and GUI had an equal influence on students’ performance. However, in the case of more complex circuits, students using GUI outperformed those using real components. Moreover, Başer and Durmus’s [52] study was conducted at a university, involving 80 participants. The study lasted four hours per week for three weeks. The results indicated that both interfaces, TUI and GUI, had a comparable effect on the students. Also, Amida et al. conducted a study [53] for one semester investigating 14 university students’ performance. The findings indicated that both interfaces, TUI and GUI, had a similar impact on the students.
In conclusion, the existing literature primarily focuses on electronic circuits using basic components like resistors and examines Kirchhoff’s rules. Also, there is a considerable shortage of studies that compare user interfaces in the context of learning circuits, particularly with Arduino boards, and some aspects of the educational process are often limitedly examined. For instance, the influence of students’ prior knowledge on their performance is rarely considered, and the potential effects of students’ positive or negative perceptions of the educational process remain quite unexplored.
1.3. Research Questions
According to the above, it has not yet been established which interface offers a more effective learning experience. Additionally, it can be assumed that the most effective interventions in the field of electronic circuits are observed among higher education students [5]. Hence, this paper aims to investigate microcontroller circuits teaching with an Arduino board among 110 university students, comparing interfaces. Furthermore, this study investigates the students’ performance in three distinct sub-domains: (a) microcontroller, (b) coding, and (c) circuits. To meet the above goals, we addressed the following research questions (RQs):
- RQ1. Does students’ performance vary based on the user interface?
- RQ2. Does prior attendance at a microcontroller lab affect students’ performance?
- RQ3. Do students’ attitudes differ based on the interface they use or their prior experience in a microcontroller lab?
2. Materials and Methods
2.1. Participants and Procedure
This study involved 110 engineering students (94 male, 16 female) enrolled in the “Organization and Architecture of Computer Systems” course at the Department of Information and Electronic Engineering, International Hellenic University (IHU), Sindos campus, Thessaloniki. The average age was 22.06 years old (Std. Deviation = 3.803). Related to the participants, 50 had prior experience in a microcontroller lab, while 60 were first-time participants. Moreover, the study lasted two semesters. All the participants were informed about the objective of the study, and they were assured that their personal information would be kept confidential. Additionally, the study and its methods had been approved by the research and ethics committee of IHU.
To address the research questions, we decided to split the sample into three groups, based on how the students performed the exercises:
- TUIbr group (36 students)—implemented circuits using breadboards.
- TUIboard group (38 students)—implemented circuits using modular boards.
- GUI group (36 students)—implemented circuits using Tinkercad.
No mixed groups/interfaces were established, as the main aim of the intervention was to explore the influence and efficacy of each interface on the learning process.
For the TUIboard group, we designed custom modular boards in the form of Arduino shields, incorporating fundamental components such as LEDs, RGB LEDs, push buttons, LCD 2x16, and dip switches. Figure 1 shows the PCB layouts for the two modular boards, and how they were mounted on an Arduino Uno. To accompany the circuit diagrams, students received a summary table that mapped Arduino pins to their corresponding components.
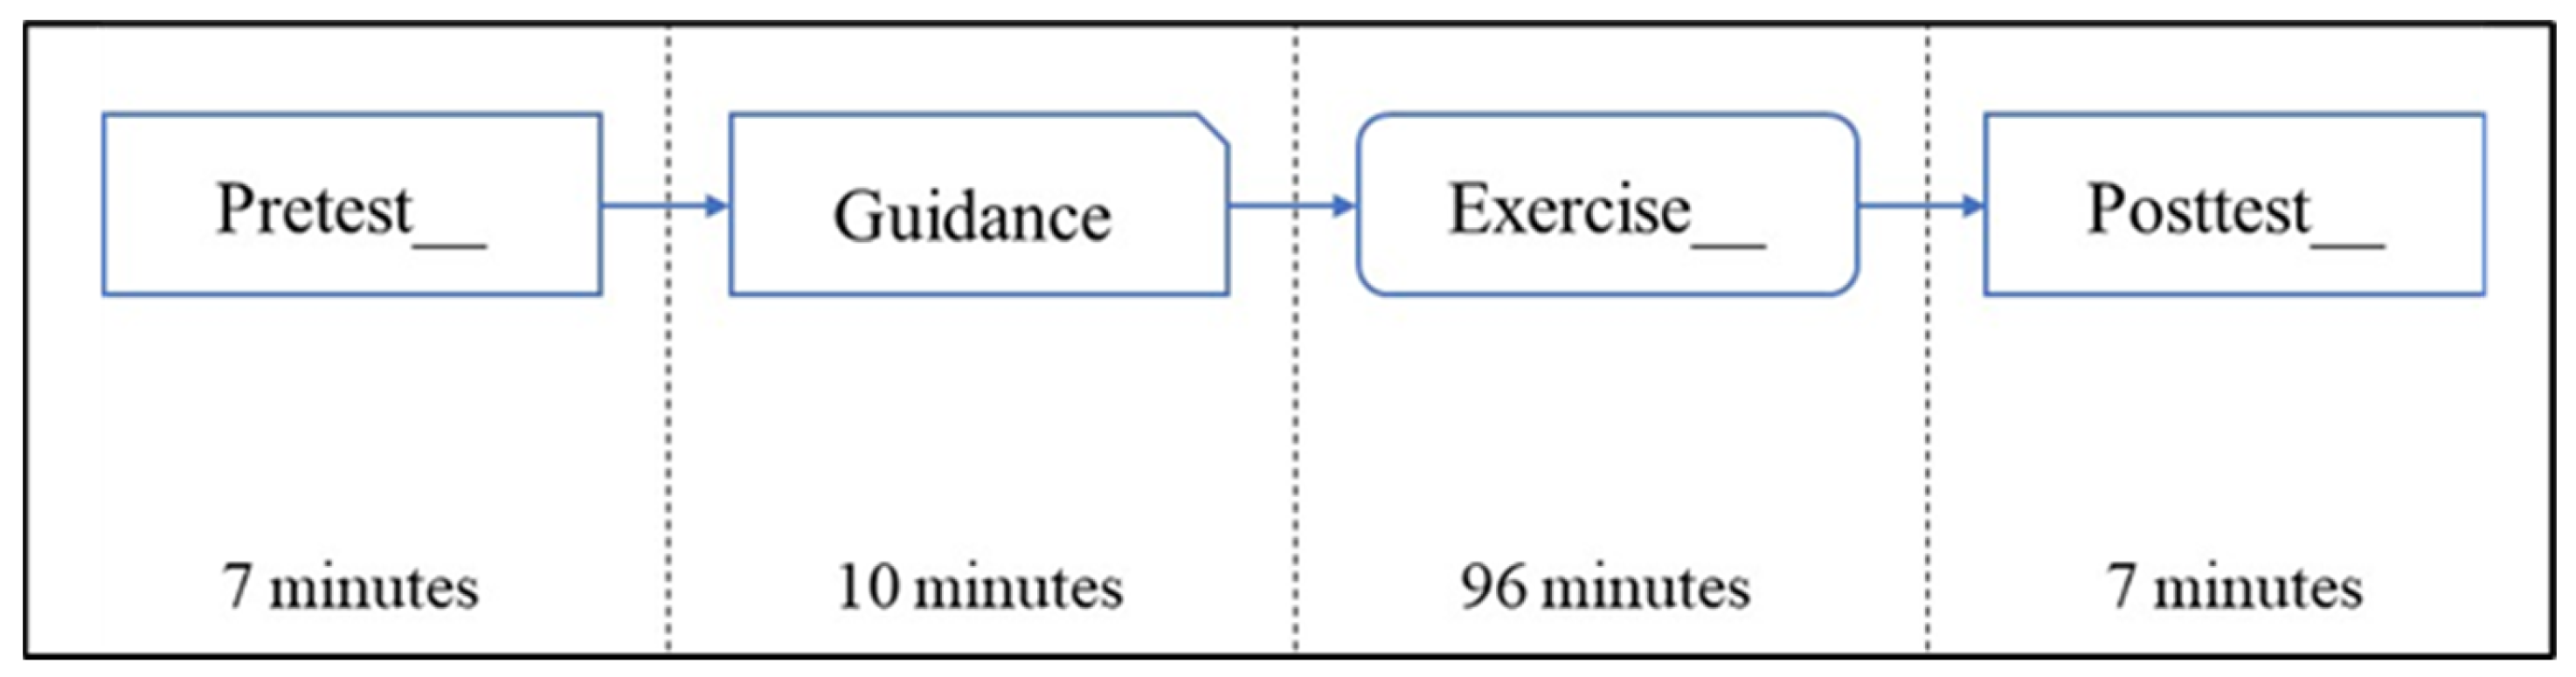
In detail, this study involved students participating in three exercises, designed for beginners, each one lasting two hours and conducted once a week. Exercises followed a pretest and posttest design. Before commencing the activities, students received a ten-minute guidance, as shown in Figure 2.
Throughout the exercises, students worked individually to complete the activities. The three exercises in detail were as follows:
- Exercise 1—pins as outputs. The purpose of this exercise was to use the Arduino UNO to control LED, buzzer, and RGB LED.
- Exercise 2—digital pins. The purpose of this exercise was to use the Arduino UNO to read digital input signals from switches and buttons, and as a response to activate and deactivate (RGB) LEDs.
- Exercise 3—analog pins and serial communication. The purpose of this exercise was to use the Arduino UNO to read analog input signals from a potentiometer and establish bidirectional communication with the serial port.
Figure 3 illustrates some of the activities during which students built circuits and programmed the Arduino. To succeed in these activities, the participant had to correctly align the circuit connections with the corresponding pins defined in the code. Any mismatch resulted in malfunctions during the activities. These circuits involved the following: (a) controlling a buzzer and LED through output pins, (b) reading input states from two switches to manipulate an RGB LED, and (c) managing an analog signal by converting it to digital, sending it via serial communication, and controlling the output pin states. In other words, high performance in the activities presupposed students’ writing suitable code and programing the Arduino. This required knowledge of how and where to connect components like LEDs to activate them using specific commands. By engaging in these activities, students gained practical experience in basic circuit design and better understood the essential link between components and their corresponding coding control.
After completing all the exercises, the students provided feedback on their overall experience during the intervention responding to attitude questions.
2.2. Instruments
To conduct the study, we utilized the activities and tests that were originally developed as part of the European Union’s Erasmus+ project “Engine” (accessible at https://study.engined.eu/ accessed on 10 March 2022—Course: Embedded System—Grant Number: 2020-1-PL01-KA226-HE-095653).
The tests, specially adapted to assess beginners’ knowledge, were in true/false format. Each question was awarded 1 point for a correct answer and 0 for an incorrect one. In detail, the pretest and posttest were identical and consisted of 21 questions, assessing 3 distinct knowledge sub-domains, each comprising 7 questions. The sub-domains of the knowledge questionnaire were as follows:
- Microcontrollers—these questions focused on topics related to I/O, and microcontroller functions, such as the use of special function registers.
- Coding—questions in this sub-domain centered on microcontroller programming instructions, assessing syntax and logic errors for a text-based language (Wiring).
- Circuits—these questions focused on the operation of microcontroller circuits, looking at connectivity issues such as connecting LEDs, dip switches, and potentiometers.
The students provided feedback responding to five attitude questions (Qs):
- Q1. The process of creating an electronic circuit was easy.
- Q2. I am satisfied with the time it took me to complete the activities.
- Q3. The activities motivated me to seek additional information about microcontrollers.
- Q4. The activities enhanced my understanding of interconnecting components in microcontroller circuits.
- Q5. The activities improved my knowledge of microcontroller programming.
2.3. Data Analysis
A principal component analysis (PCA) was used for data validation of knowledge questionnaires [56,57,58,59]. Also, Cronbach’s alpha was computed to assess the reliability of all questionnaires (knowledge, attitude). This is a measure of internal consistency and indicates how closely related the items in a questionnaire are to each other [60].
Additionally, paired/independent-samples t-tests, ANOVA, and ANCOVA tests with bootstrapping were conducted for data analysis using IBM SPSS Statistics 26. To enhance the statistical analysis, bootstrapping methods were employed, involving the estimation of 95% confidence intervals (CIs) based on 1000 samples. Bootstrapping assumes no specific underlying distribution of the data and treats non-normally distributed data as if they were normal. It achieves this by drawing random subsamples from the original data samples [61,62,63].
3. Results
3.1. Reliability
The reliability of the microcontroller sub-domain test was assessed and found to be acceptable, with a Cronbach’s alpha of 0.663 and inter-item correlations of 0.393. In addition, the reliability of the coding sub-domain test was assessed and found to be acceptable, with a Cronbach’s alpha of 0.65 and inter-item correlations of 0.385. Also, the reliability of the circuits sub-domain test was assessed and found to be acceptable, with a Cronbach’s alpha of 0.784 and inter-item correlations of 0.55. These alpha values are considered acceptable given the small number of items (less than 10) [64].
To assess performance differences between pretests and posttests, paired-sample t-tests based on 1000 bootstrap samples were employed. Table 1 shows that, in all cases, there was a statistically significant difference in students’ performance between the posttests and the pretests.
3.2. Principal Component Analysis
A principal component analysis with varimax (orthogonal) rotation was conducted on the 12 items: Posttest1, Posttest2, and Posttest3 with the sub-domain’s posttest for each exercise (microcontroller, coding, and circuits). The Kaiser–Meyer–Olkin measure did not confirm the sampling adequacy for the analysis, KMO = 0.147. However, Bartlett’s test of sphericity [χ2 (78) = 2035.937, p = 0.000] showed that correlations between the items were sufficiently substantial for PCA.
An analysis was carried out to derive three components from the data. These components, when considered together, accounted for 61.44% of the variance. Table 2 shows the factor loadings after rotation. The items that cluster on the same components suggest that Component 1 represents the third exercise, Component 2 the second exercise, and Component 3 the first exercise.
The reliability of Component 1 was assessed and found to be acceptable, with a Cronbach’s alpha of 0.770. In addition, the reliability of Component 2 was assessed and found to be acceptable, with a Cronbach’s alpha of 0.784. Also, the reliability of Component 3 was assessed and found to be acceptable, with a Cronbach’s alpha of 0.784.
3.3. Students’ Performance Based on Interface
Table 3 shows the pretest and posttest results for the three exercises, per group (TUIbr, TUIboard, GUI).
In each exercise, an ANOVA test with bootstrap was used to compare the results from the pretests to determine if the three groups (TUIbr, TUIboard, GUI) are equivalent, as shown in Table 4. The results indicate no statistically significant differences in the pretest scores among the three experimental groups, suggesting their equivalence before the intervention.
In each exercise, an ANCOVA test was used to compare the results from the posttests, with the respective pretests taken as a covariate, as shown in Table 5.
The results indicate no statistically significant differences in the posttest scores among the three experimental groups, suggesting their equivalence after the intervention.
3.4. Students’ Performance Based on Prior Experience
To address RQ2, we divided the students into two groups: those with prior experience in the microcontroller lab and those without such experience. In each exercise, an independent-sample t-test was used to compare the results from the pretests and to determine if the two groups were equivalent, as shown in Table 6.
The results indicate statistically significant differences in the pretest scores among the two groups, for pretest 1 (total) and the microcontroller sub-domain in the first exercise.
In each exercise, an ANCOVA test was used to compare the results from the posttests, with the respective pretests taken as a covariate, as shown in Table 7.
The results indicate no statistically significant differences in the posttest scores among the two groups, suggesting that experienced and non-experienced students achieved a similar performance after the intervention.
3.5. Students’ Attitude
Table 8 shows the results of the five Likert-type attitude questions. To assess the attitude of the groups toward different interfaces, ANOVA tests (with bootstrap) were used to compare the results and to determine if the three groups (TUIbr, TUIboard, GUI) are equivalent, as shown in Table 9.
The results indicate statistically significant differences in Q1 and Q4. In detail, students who utilized modular boards found them harder to use in the circuit creation process. Conversely, students who used GUI thought that the activities enhanced their understanding of the interconnection of components in microcontroller circuits, as shown in Figure 4.
To assess the attitude of groups with different prior experiences, independent-sample t-tests (with bootstrap) were used to compare the results and to determine if the two groups are equivalent, as shown in Table 10. The results indicate differences in Q1 and Q2. In detail, students without prior experience found the circuit creation process harder. On the other hand, students with prior microcontroller lab experience were more satisfied with the time it took them to complete the exercises, than the ones without microcontroller lab experience.
4. Discussion
According to the existing literature, there are a limited number of articles that investigate students’ performance using real components in breadboards, prefabricated modular boards, and computer simulations in learning microcontroller electronic circuits. This article, therefore, focuses on university students, aiming to compare the performance of groups utilizing different user interfaces for learning microcontroller, coding, and circuits with Arduino, in a series of three exercises.
The main purpose of the exercises was to facilitate the implementation of circuits, connecting components with the Arduino using three different methods: (a) breadboard, (b) modular board, and (c) Tinkercad. Additionally, students were tasked with programming the Arduino to ensure the proper operation of the circuits in each activity. The exercises encompassed a variety of tasks, including the following: (a) configuring outputs and connecting with RGB LED, LED, and buzzer, (b) handling inputs and connecting with dip switches and push buttons, and (c) converting analog signals to digital and connecting analog voltage via a potentiometer to the Arduino. Students improved their understanding of the fundamental connection between components and their respective programming control through active participation in these activities, gaining practical experience in basic circuit design in the process. Therefore, our approach went beyond the study of the basic principles of digital circuits to include analog electronic circuits, providing students with a broader understanding of the Arduino’s capabilities. Additionally, we gathered participants’ feedback on their learning experiences during the intervention, to provide further insights into the field. Furthermore, we examined students’ performance and attitudes, considering whether they had previous experience in a microcontroller lab. Initially, the intervention can be considered successful, as the statistical analysis revealed significant differences in student performance between the pretests and posttests. Similarly, statistically significant differences were also detected in the pretest–posttest results across the sub-domains: microcontroller, coding, and circuit.
Moreover, the PCA results, despite explaining approximately 60% of the variance, offer valuable insights into the underlying structure of our data and provide evidence supporting the validity of our experimental design. Notably, Table 2 illustrates that the three exercises formed distinct factors. Future research could explore alternative dimensionality reduction techniques or incorporate supplementary data to further elucidate these underlying factors and enhance our understanding of microcontroller education.
In order to explore sufficiently whether students’ performance varies based on the user interface (RQ1), we divided the students into three groups. Given the widespread use of Arduino shields, we decided to introduce another group alongside the breadboard users, with TUI. This additional group used modular boards for their experiments, as shown in Figure 1. According to the results of the statistical analyses, it can be concluded that the three groups did not show significant differences in their performance. In other words, no matter whether students utilized TUIs or GUI, they achieved comparable scores. This finding aligns with the results of previous studies [45,51,52,53]. Nevertheless, studies [48,49] demonstrate that students using GUI achieved better results compared to those using TUI. Conversely, studies [46,47,50] revealed that a combination of TUI and GUI contributed to students’ higher performance. However, these studies focused on simple electronic circuits, not microcontroller circuits.
According to previous attendance at a microcontroller lab (RQ2), one might assume that prior knowledge and experience with microcontroller circuits could benefit students. Indeed, in the pretest of the first exercise, students with prior experience achieved statistically significantly higher scores than those without prior experience, specifically in the microcontroller sub-domain. Yet, while considering the posttests of these two groups, no statistically significant difference was observed. Thus, prior knowledge provided an initial advantage, but after completing the first exercise, both groups of students achieved similar scores. Consequently, this intervention can be considered a success, since at the end of the exercises, all students had reached the same level of knowledge.
To investigate the students’ attitudes (RQ3), a Likert-type questionnaire consisting of five questions was administered to them. The statistical analysis revealed that among the groups that used different interfaces, students who utilized GUI expressed the strongest belief that their understanding of the interconnection of components in microcontroller circuits was enhanced. This might appear paradoxical since this group did not utilize physical components. However, through the Tinkercad, they were able to swiftly and conveniently experiment with circuit connections. As a result, the students using GUI became more confident, although they did not achieve a better knowledge score. Conversely, students who worked with our modular shield found the circuit connection process harder. This could be attributed to the fact that simply ”snapping” one board onto another may have deprived them of the opportunity to experiment with connections, thus limiting their confidence in this specific domain, that is, the approach of implementing circuits through a graphical environment was not found to be inferior to using real components. Nevertheless, ongoing research in this field is imperative in order to draw stronger conclusions.
In terms of the groups with and without previous experience, the statistical analysis indicated that students with prior experience were more satisfied with the time required to complete the circuits. This outcome aligns with our expectations, so although prior experience did not provide students with a knowledge advantage at the end, it enhanced their confidence by familiarizing them with the learning content. Furthermore, students encountering microcontroller circuits for the first time found the circuit creation process harder. Thus, in the field of teaching electronic circuits, before designing the exercises, the time required should be considered.
Our findings suggest that by using real components on a breadboard, or modular boards, or simulations, they can all achieve a comparable student performance in terms of understanding microcontrollers and developing coding skills. However, for scenarios where the primary focus is on circuit learning, modular boards may not be the most suitable choice. In such cases, using a Tinkercad simulation environment can be more effective as it reinforces students’ comprehension and engagement with interfacing individual electronic components. Finally, as future work, it would be interesting to investigate the transfer of knowledge from a Tinkercad simulation environment to a physical environment by studying how effectively students’ engagement and time to complete the task differ between the two settings.
5. Conclusions
This article explores teaching circuits with Arduino using TUI and GUI through a series of three exercises for 110 students. In this study, two TUI groups were formed as follows: one utilizing a breadboard and the other employing an Arduino modular board designed for this study. The research design was validated through principal component analysis. The results of the intervention indicated that none of the three groups exhibited statistically significant differences in posttest performance, thus establishing their equivalence after completing the exercises. Additionally, the division of students into two groups based on their prior experience with microcontroller circuits revealed that although statistically significant differences were initially observed in the pretest of the first exercise, no such difference remained at the end of the exercises, rendering the two groups’ performance equivalent. Furthermore, based on the students’ feedback, the group that used GUI believed that their understanding of connecting components in microcontroller circuits had been improved. Conversely, students who used the modular board and those without prior microcontroller lab experience found circuit connections more difficult. Looking ahead, future research in this field should continue to investigate and compare TUI and GUI interfaces, possibly by including groups of students working with mixed interfaces.
6. Limitations
The present study focuses on university students, which may pose limitations regarding the effect of interfaces on Arduino learning related to individuals at other educational levels or professionals. Additionally, the sample size might not have been large enough to detect significant changes in performance among the three different groups. Finally, long-term studies involving interviews could potentially provide further insight into this field.
Author Contributions
S.T., T.S. and D.P. contributed to the design and implementation of the research, to the analysis of the results, and the writing of the manuscript. All authors have read and agreed to the published version of the manuscript.
Funding
This research received no external funding.
Institutional Review Board Statement
All subjects gave their informed consent for inclusion before they participated in the study. The study was conducted in accordance with the Declaration of Helsinki, and the protocol was approved by the Ethics Committee of the International Hellenic University (number 05/05.05.2022).
Informed Consent Statement
Informed consent was obtained from all subjects involved in the study.
Data Availability Statement
The data presented in this study are available upon request from the corresponding author.
Conflicts of Interest
The authors declare no conflicts of interest.
References
- Cui, Y.; Lai, Z.; Li, Z.; Su, J. Design and Implementation of Electronic Circuit Virtual Laboratory Based on Virtual Reality Technology. J. Comput. Methods Sci. Eng. 2021, 21, 1125–1144. [Google Scholar] [CrossRef]
- Keleş, D.; Bulgurcu, A.; Feyzioǧlu Demir, E.; Şemin, I.M. The Effect of Virtual Laboratory Simulations on Medical Laboratory Techniques Students’ Knowledge and Vocational Laboratory Education. Turk. J. Biochem. 2022, 47, 529–537. [Google Scholar] [CrossRef]
- Ali, N.; Ullah, S.; Khan, D. Interactive Laboratories for Science Education: A Subjective Study and Systematic Literature Review. Multimodal Technol. Interact. 2022, 6, 85. [Google Scholar] [CrossRef]
- Haw, L.H.; Sharif, S.B.; Han, C.G.K. Predictors of Student Engagement in Science Learning: The Role of Science Laboratory Learning Environment and Science Learning Motivation. Asia Pac. J. Educ. Educ. 2022, 37, 225–245. [Google Scholar] [CrossRef]
- Tselegkaridis, S.; Sapounidis, T.; Stamovlasis, D. Teaching Electric Circuits Using Tangible and Graphical User Interfaces: A Meta-Analysis. Educ. Inf. Technol. 2023, 1–25. [Google Scholar] [CrossRef]
- Bretz, S.L. Evidence for the Importance of Laboratory Courses. J. Chem. Educ. 2019, 96, 193–195. [Google Scholar] [CrossRef]
- Sapounidis, T.; Tselegkaridis, S.; Stamovlasis, D. Educational Robotics and STEM in Primary Education: A Review and a Meta-Analysis. J. Res. Technol. Educ. 2023, 1–15. [Google Scholar] [CrossRef]
- Sapounidis, T.; Stamelos, I.; Demetriadis, S. Tangible User Interfaces for Programming and Education: A New Field for Innovation and Entrepreneurship. In Advances in Digital Education and Lifelong Learning; Emerald Group Publishing Ltd.: Bingley, UK, 2016; Volume 2, pp. 271–295. [Google Scholar]
- Sapounidis, T.; Demetriadis, S.; Stamelos, I. Evaluating Children Performance with Graphical and Tangible Robot Programming Tools. Pers. Ubiquitous Comput. 2015, 19, 225–237. [Google Scholar] [CrossRef]
- Akçayir, M.; Akçayir, G.; Pektaş, M.; Ocak, A. Augmented Reality in Science Laboratories: The Effects of Augmented Reality on University Students’ Laboratory Skills and Attitudes toward Science Laboratories. Comput. Hum. Behav. 2016, 57, 334–342. [Google Scholar] [CrossRef]
- Altmeyer, K.; Kapp, S.; Thees, M.; Malone, S.; Kuhn, J.; Brünken, R. The Use of Augmented Reality to Foster Conceptual Knowledge Acquisition in STEM Laboratory Courses—Theoretical Background and Empirical Results. Br. J. Educ. Technol. 2020, 51, 611–628. [Google Scholar] [CrossRef]
- Wörner, S.; Kuhn, J.; Scheiter, K. The Best of Two Worlds: A Systematic Review on Combining Real and Virtual Experiments in Science Education. Rev. Educ. Res. 2022, 92, 911–952. [Google Scholar] [CrossRef]
- Taramopoulos, A.; Psillos, D.; Hatzikraniotis, E. Teaching Electric Circuits by Guided Inquiry in Virtual and Real Laboratory Environments. In Research on e-Learning and ICT in Education; Springer: New York, NY, USA, 2012; ISBN 9781461410836. [Google Scholar]
- Evangelou, F.; Kotsis, K. Real vs. Virtual Physics Experiments: Comparison of Learning Outcomes among Fifth Grade Primary School Students. A Case on the Concept of Frictional Force. Int. J. Sci. Educ. 2019, 41, 330–348. [Google Scholar] [CrossRef]
- Olympiou, G.; Zacharia, Z.C. Examining Students’ Actions while Experimenting with a Blended Combination of Physical Manipulatives and Virtual Manipulatives in Physics. In Research on e-Learning and ICT in Education; Springer: Cham, Switzerland, 2018; pp. 257–278. ISBN 9783319950594. [Google Scholar]
- Puntambekar, S.; Gnesdilow, D.; Dornfeld Tissenbaum, C.; Narayanan, N.H.; Rebello, N.S. Supporting Middle School Students’ Science Talk: A Comparison of Physical and Virtual Labs. J. Res. Sci. Teach. 2021, 58, 392–419. [Google Scholar] [CrossRef]
- Manyilizu, M.C. Effectiveness of Virtual Laboratory vs. Paper-Based Experiences to the Hands-on Chemistry Practical in Tanzanian Secondary Schools. Educ. Inf. Technol. 2023, 28, 4831–4848. [Google Scholar] [CrossRef]
- Villena-Taranilla, R.; Tirado-Olivares, S.; Cózar-Gutiérrez, R.; González-Calero, J.A. Effects of Virtual Reality on Learning Outcomes in K-6 Education: A Meta-Analysis. Educ. Res. Rev. 2022, 35, 100434. [Google Scholar] [CrossRef]
- Potkonjak, V.; Gardner, M.; Callaghan, V.; Mattila, P.; Guetl, C.; Petrović, V.M.; Jovanović, K. Virtual Laboratories for Education in Science, Technology, and Engineering: A Review. Comput. Educ. 2016, 95, 309–327. [Google Scholar] [CrossRef]
- Chernikova, O.; Heitzmann, N.; Stadler, M.; Holzberger, D.; Seidel, T.; Fischer, F. Simulation-Based Learning in Higher Education: A Meta-Analysis. Rev. Educ. Res. 2020, 90, 499–541. [Google Scholar] [CrossRef]
- Tselegkaridis, S.; Sapounidis, T. Simulators in Educational Robotics: A Review. Educ. Sci. 2021, 11, 11. [Google Scholar] [CrossRef]
- Reeves, S.M.; Crippen, K.J. Virtual Laboratories in Undergraduate Science and Engineering Courses: A Systematic Review, 2009–2019. J. Sci. Educ. Technol. 2021, 30, 16–30. [Google Scholar] [CrossRef]
- Pan, T.; Zhu, Y. Getting Started with Arduino. In Designing Embedded Systems with Arduino; Springer: Singapore, 2018. [Google Scholar]
- El-Abd, M. A Review of Embedded Systems Education in the Arduino Age: Lessons Learned and Future Directions. Int. J. Eng. Pedagog. 2017, 7, 79–93. [Google Scholar] [CrossRef]
- Arı, A.G.; Meço, G. A New Application in Biology Education: Development and Implementation of Arduino-Supported Stem Activities. Biol. 2021, 10, 506. [Google Scholar] [CrossRef] [PubMed]
- Lee, E. A Meta-Analysis of the Effects of Arduino-Based Education in Korean Primary and Secondary Schools in Engineering Education. Eur. J. Educ. Res. 2020, 9, 1503–1512. [Google Scholar] [CrossRef]
- Kumar, E.S. Arduino Working Principle and It’s Use in Education. Int. J. Res. Appl. Sci. Eng. Technol. 2022, 10, 2314–2319. [Google Scholar] [CrossRef]
- Padmanabhan, M. Test Case Generation for Arduino Programming Instructions Using Functional Block Diagrams. Trends Sci. 2022, 19, 3472. [Google Scholar] [CrossRef]
- Johnson, D.M.; Pate, M.; Estepp, C.M.; Wardlow, G. Using Self-Efficacy Theory to Design Arduino Instruction for Novices: A Replication Study. J. Res. Tech. Careers 2023, 7, 68–84. [Google Scholar] [CrossRef]
- Nayyar, A.; Puri, V. A Review of Arduino Board’s, Lilypad’s & Arduino Shields. In Proceedings of the 3rd International Conference on Computing for Sustainable Global Development, INDIACom 2016, New Delhi, India, 16–18 March 2016. [Google Scholar]
- Tselegkaridis, S.; Sapounidis, T. Exploring Students’ Hands-On Performance, Attitudes, and Usability with Arduino Modular Boards. Information 2024, 15, 88. [Google Scholar] [CrossRef]
- Aidoo, B.; Anthony-Krueger, C.; Gyampoh, A.O.; Tsyawo, J.; Quansah, F. A Mixed-Method Approach to Investigate the Effect of Flipped Inquiry-Based Learning on Chemistry Students Learning. Eur. J. Sci. Math. Educ. 2022, 10, 507–518. [Google Scholar] [CrossRef]
- Öztürk, B.; Kaya, M.; Demir, M. Does Inquiry-Based Learning Model Improve Learning Outcomes? A Second-Order Meta-Analysis. J. Pedagog. Res. 2022, 6, 201–216. [Google Scholar] [CrossRef]
- Rapti, S.; Sapounidis, T.; Tselegkaridis, S. Enriching a Traditional Learning Activity in Preschool through Augmented Reality: Children’s and Teachers’ Views. Information 2023, 14, 530. [Google Scholar] [CrossRef]
- El Hadi, M.; El Moussaouy, A.; Ouariach, A.; Essaadaoui, R.; Hachmi, A.; Laabidi, K.; Magrez, H.; Meziani, Y.M. Real Time Free Fall Investigation for Educational Purposes Using Arduino Uno Board. Phys. Educ. 2020, 55, 055027. [Google Scholar] [CrossRef]
- Coban, A.; Coban, N. Using Arduino in Physics Experiments: Determining the Speed of Sound in Air. Phys. Educ. 2020, 55, 043005. [Google Scholar] [CrossRef]
- McLean, K.M.; Pasulka, A.L.; Bockmon, E.E. A Low-Cost, Accessible, and High-Performing Arduino-Based Seawater PH Control System for Biological Applications. HardwareX 2021, 10, e00247. [Google Scholar] [CrossRef] [PubMed]
- Papadimitropoulos, N.; Dalacosta, K.; Pavlatou, E.A. Teaching Chemistry with Arduino Experiments in a Mixed Virtual-Physical Learning Environment. J. Sci. Educ. Technol. 2021, 30, 550–566. [Google Scholar] [CrossRef] [PubMed]
- Chang, C.C.; Chen, Y. Using Mastery Learning Theory to Develop Task-Centered Hands-on STEM Learning of Arduino-Based Educational Robotics: Psychomotor Performance and Perception by a Convergent Parallel Mixed Method. Interact. Learn. Environ. 2022, 30, 1677–1692. [Google Scholar] [CrossRef]
- Ntourou, V.; Kalogiannakis, M.; Psycharis, S. A Study of the Impact of Arduino and Visual Programming In Self-Efficacy, Motivation, Computational Thinking and 5th Grade Students’ Perceptions on Electricity. Eurasia J. Math. Sci. Technol. Educ. 2021, 17, em1960. [Google Scholar] [CrossRef] [PubMed]
- Fidai, A.; Capraro, M.M.; Capraro, R.M. “Scratch”-Ing Computational Thinking with Arduino: A Meta-Analysis. Think. Ski. Creat. 2020, 38, 100726. [Google Scholar] [CrossRef]
- García-Tudela, P.A.; Marín-Marín, J.A. Use of Arduino in Primary Education: A Systematic Review. Educ Sci 2023, 13, 134. [Google Scholar] [CrossRef]
- Kırıkkaya, E.B.; Başaran, B. Investigation of the Effect of the Integration of Arduino to Electrical Experiments on Students’ Attitudes towards Technology and ICT by the Mixed Method. Eur. J. Educ. Res. 2019, 8, 31–48. [Google Scholar] [CrossRef]
- Hadiati, S.; Kuswanto, H.; Rosana, D.; Pramuda, A. The Effect of Laboratory Work Style and Reasoning with Arduino to Improve Scientific Attitude. Int. J. Instr. 2019, 12, 321–336. [Google Scholar] [CrossRef]
- Kapici, H.O.; Akcay, H.; Cakir, H. Investigating the Effects of Different Levels of Guidance in Inquiry-Based Hands-on and Virtual Science Laboratories. Int. J. Sci. Educ. 2022, 44, 324–345. [Google Scholar] [CrossRef]
- Kapici, H.O.; Akcay, H.; de Jong, T. Using Hands-On and Virtual Laboratories Alone or Together―Which Works Better for Acquiring Knowledge and Skills? J. Sci. Educ. Technol. 2019, 28, 231–250. [Google Scholar] [CrossRef]
- Manunure, K.; Delserieys, A.; Castéra, J. The Effects of Combining Simulations and Laboratory Experiments on Zimbabwean Students’ Conceptual Understanding of Electric Circuits. Res. Sci. Technol. Educ. 2020, 38, 289–307. [Google Scholar] [CrossRef]
- Kollöffel, B.; de Jong, T.A.J.M. Conceptual Understanding of Electrical Circuits in Secondary Vocational Engineering Education: Combining Traditional Instruction with Inquiry Learning in a Virtual Lab. J. Eng. Educ. 2013, 102, 375–393. [Google Scholar] [CrossRef]
- Finkelstein, N.D.; Adams, W.K.; Keller, C.J.; Kohl, P.B.; Perkins, K.K.; Podolefsky, N.S.; Reid, S.; Lemaster, R. When Learning about the Real World Is Better Done Virtually: A Study of Substituting Computer Simulations for Laboratory Equipment. Phys. Rev. Spec. Top. Phys. Educ. Res. 2005, 1, 010103. [Google Scholar] [CrossRef]
- Zacharia, Z. Comparing and Combining Real and Virtual Experimentation: An Effort to Enhance Students’ Conceptual Understanding of Electric Circuits. J. Comput. Assist. Learn. 2007, 23, 120–132. [Google Scholar] [CrossRef]
- Zacharia, Z.; de Jong, T. The Effects on Students’ Conceptual Understanding of Electric Circuits of Introducing Virtual Manipulatives Within a Physical Manipulatives-Oriented Curriculum. Cogn. Instr. 2014, 32, 101–158. [Google Scholar] [CrossRef]
- Başer, M.; Durmus, S. The Effectiveness of Computer Supported Versus Real Laboratory Inquiry Learning Environments on the Understanding of Direct. Eurasia J. Math. Sci. Technol. Educ. 2010, 6, 47–61. [Google Scholar] [CrossRef] [PubMed]
- Amida, A.; Chang, I.; Yearwood, D. Designing a Practical Lab-Based Assessment: A Case Study. J. Eng. Des. Technol. 2020, 18, 567–581. [Google Scholar] [CrossRef]
- Taherdoost, H. What Is the Best Response Scale for Survey and Questionnaire Design; Review of Different Lengths of Rating Scale/Attitude Scale/Likert Scale. Int. J. Acad. Res. Manag. 2019, 8, 1–10. [Google Scholar]
- Sullivan, G.M.; Artino, A.R. Analyzing and Interpreting Data From Likert-Type Scales. J. Grad. Med. Educ. 2013, 5, 541–542. [Google Scholar] [CrossRef]
- Schreiber, J.B. Issues and Recommendations for Exploratory Factor Analysis and Principal Component Analysis. Res. Soc. Adm. Pharm. 2021, 17, 1004–1011. [Google Scholar] [CrossRef]
- Anuar, N.; Muhammad, A.M.; Awang, Z. Development and Validation of Critical Reading Intention Scale (CRIS) for University Students Using Exploratory and Confirmatory Factor Analysis. Asian J. Univ. Educ. 2023, 19, 39–52. [Google Scholar] [CrossRef]
- Field, A. Discovering Statistics Using SPSS, 3rd ed.; SAGE Publications: London, UK, 2005; Volume 2. [Google Scholar]
- Pursan, G.; Adeliyi, T.T.; Joseph, S. Information Technology Technical Support Success Factors in Higher Education: Principal Component Analysis. Int. J. Adv. Comput. Sci. Appl. 2023, 14, 270–282. [Google Scholar] [CrossRef]
- Tavakol, M.; Dennick, R. Making Sense of Cronbach’s Alpha. Int. J. Med. Educ. 2011, 2, 53–55. [Google Scholar] [CrossRef] [PubMed]
- Efron, B.; Tibshirani, R. Improvements on Cross-Validation: The 632+ Bootstrap Method. J. Am. Stat. Assoc. 1997, 92, 548–560. [Google Scholar] [CrossRef]
- Parlangeli, O.; Marchigiani, E.; Bagnara, S. Multimedia Systems in Distance Education: Effects of Usability on Learning. Interact. Comput. 1999, 12, 37–49. [Google Scholar] [CrossRef]
- Cheung, S.F.; Pesigan, I.J.A.; Vong, W.N. DIY Bootstrapping: Getting the Nonparametric Bootstrap Confidence Interval in SPSS for Any Statistics or Function of Statistics (When This Bootstrapping Is Appropriate). Behav. Res. Methods 2023, 55, 474–490. [Google Scholar] [CrossRef]
- Pallant, J. SPSS Survival Manual: A Step by Step Guide to Data Analysis Using IBM SPSS; Open University Press: Berkshire, UK, 2020. [Google Scholar]
Figure 1.
Modular boards for Arduino Uno.

Figure 2.
Intervention procedure.

Figure 3.
Exercise circuits.

Figure 4.
Students’ opinions varied by interfaces.


Table 1.
Paired-sample t-tests based on 1000 bootstrap samples for pretest–posttest.
| Exercise | (Sub) Domain | Mean | Std. Deviation | t | Degree of Freedom (df) | Sig. (2-Tailed) |
|---|---|---|---|---|---|---|
| 1 | Total | −3.375 | 2.622 | −11.794 | 109 | 0.001 |
| Microcontroller | −2.766 | 3.399 | −7.458 | 109 | 0.001 | |
| Coding | −4.503 | 3.158 | −13.089 | 109 | 0.001 | |
| Circuit | −3.046 | 3.047 | −9.162 | 109 | 0.001 | |
| 2 | Total | −2.821 | 2.322 | −11.132 | 109 | 0.001 |
| Microcontroller | −2.881 | 2.922 | −9.035 | 109 | 0.001 | |
| Coding | −3.134 | 3.085 | −9.311 | 109 | 0.001 | |
| Circuit | −2.382 | 2.741 | −7.967 | 109 | 0.001 | |
| 3 | Total | −4.156 | 2.366 | −16.100 | 109 | 0.001 |
| Microcontroller | −4.615 | 2.806 | −15.071 | 109 | 0.001 | |
| Coding | −4.132 | 3.087 | −12.265 | 109 | 0.001 | |
| Circuit | −3.742 | 2.885 | −11.889 | 109 | 0.001 |
Table 2.
Summary of exploratory factor analysis results (N = 110).
| Item | Rotated Factor Loadings | |||
|---|---|---|---|---|
| 1 | 2 | 3 | ||
| Exercise 3 | Posttest3 | 0.873 | 0.370 | 0.164 |
| Posttest3Microcontroller | 0.701 | 0.218 | −0.019 | |
| Posttest3Coding | 0.646 | 0.082 | 0.198 | |
| Posttest3Circuit | 0.586 | 0.450 | 0.128 | |
| Exercise 2 | Posttest2 | 0.205 | 0.920 | 0.291 |
| Posttest2Microcontroller | 0.116 | 0.744 | 0.099 | |
| Posttest2Coding | 0.358 | 0.639 | 0.059 | |
| Posttest2Circuit | 0.014 | 0.599 | 0.407 | |
| Exercise 1 | Posttest1 | 0.346 | 0.224 | 0.895 |
| Posttest1Circuit | −0.031 | 0.235 | 0.785 | |
| Posttest1Microcontroller | 0.546 | 0.166 | 0.590 | |
| Posttest1Coding | 0.180 | 0.078 | 0.563 | |
| Eigenvalues | 5.312 | 1.424 | 1.252 | |
| % of variance | 40.864 | 10.951 | 9.629 | |
| Cronbach’s α | 0.770 | 0.784 | 0.784 | |
Table 3.
Pretests–posttest results for interfaces.
| Group | Test | (Sub) Domain | Exercise 1 | Exercise 2 | Exercise 3 | |||
|---|---|---|---|---|---|---|---|---|
| Mean | Std. Deviation | Mean | Std. Deviation | Mean | Std. Deviation | |||
| TUIbr | Pretest | Total | 4.941 | 2.702 | 5.804 | 2.715 | 2.725 | 2.164 |
| Microcontroller | 4.862 | 3.473 | 6.276 | 3.222 | 2.631 | 2.394 | ||
| Coding | 4.408 | 3.119 | 5.532 | 3.557 | 2.619 | 2.562 | ||
| Circuit | 4.869 | 2.949 | 5.544 | 3.200 | 2.924 | 2.816 | ||
| Posttest | Total | 7.947 | 1.407 | 8.226 | 1.079 | 6.936 | 1.553 | |
| Microcontroller | 7.198 | 2.688 | 8.338 | 1.347 | 7.096 | 1.455 | ||
| Coding | 8.862 | 1.362 | 8.337 | 1.882 | 6.966 | 1.809 | ||
| Circuit | 7.726 | 1.752 | 8.004 | 1.746 | 6.922 | 1.961 | ||
| TUIboard | Pretest | Total | 3.942 | 2.384 | 5.230 | 2.381 | 2.806 | 2.270 |
| Microcontroller | 4.178 | 2.770 | 5.476 | 2.734 | 2.670 | 2.782 | ||
| Coding | 3.537 | 2.736 | 5.368 | 2.867 | 2.738 | 2.763 | ||
| Circuit | 4.110 | 2.940 | 4.845 | 3.125 | 3.007 | 2.459 | ||
| Posttest | Total | 7.899 | 1.446 | 7.853 | 1.400 | 6.767 | 1.291 | |
| Microcontroller | 7.672 | 2.029 | 8.304 | 1.514 | 7.300 | 1.619 | ||
| Coding | 8.422 | 1.587 | 8.832 | 1.834 | 6.799 | 1.767 | ||
| Circuit | 7.607 | 2.156 | 7.027 | 2.185 | 6.204 | 2.334 | ||
| GUI | Pretest | Total | 5.271 | 2.442 | 4.621 | 2.763 | 2.744 | 2.418 |
| Microcontroller | 5.862 | 2.853 | 4.484 | 3.296 | 2.450 | 2.714 | ||
| Coding | 4.636 | 2.556 | 4.345 | 3.177 | 2.853 | 2.597 | ||
| Circuit | 5.314 | 2.760 | 5.103 | 2.732 | 2.792 | 2.697 | ||
| Posttest | Total | 8.033 | 1.102 | 8.276 | 1.305 | 7.189 | 0.890 | |
| Microcontroller | 7.825 | 1.780 | 8.434 | 1.744 | 7.220 | 1.716 | ||
| Coding | 8.506 | 1.720 | 8.368 | 1.881 | 6.860 | 1.735 | ||
| Circuit | 7.770 | 1.395 | 7.758 | 1.658 | 7.221 | 1.307 | ||
Table 4.
ANOVA test for pretest based on 1000 bootstrap samples.
| Exercise | Pretest | df | Mean Square | F | Sig. |
|---|---|---|---|---|---|
| 1 | Total | 2 | 14.937 | 2.475 | 0.090 |
| Microcontroller | 2 | 19.763 | 2.238 | 0.113 | |
| Coding | 2 | 11.115 | 1.430 | 0.245 | |
| Circuit | 2 | 11.890 | 1.451 | 0.240 | |
| 2 | Total | 2 | 6.138 | 0.939 | 0.395 |
| Microcontroller | 2 | 11.993 | 1.262 | 0.288 | |
| Coding | 2 | 12.659 | 1.300 | 0.278 | |
| Circuit | 2 | 1.645 | 0.177 | 0.838 | |
| 3 | Total | 2 | 0.376 | 0.074 | 0.929 |
| Microcontroller | 2 | 0.291 | 0.042 | 0.959 | |
| Coding | 2 | 0.674 | 0.097 | 0.907 | |
| Circuit | 2 | 0.579 | 0.085 | 0.918 |
Table 5.
ANCOVA tests for posttests based on 1000 bootstrap samples.
| Exercise | Posttest | df | Mean Square | F | Sig. |
|---|---|---|---|---|---|
| 1 | Total | 2 | 0.005 | 0.003 | 0.997 |
| Microcontroller | 2 | 2.078 | 0.452 | 0.638 | |
| Coding | 2 | 1.587 | 0.644 | 0.528 | |
| Circuit | 2 | 0.173 | 0.056 | 0.946 | |
| 2 | Total | 2 | 0.186 | 0.112 | 0.894 |
| Microcontroller | 2 | 0.394 | 0.177 | 0.838 | |
| Coding | 2 | 0.589 | 0.135 | 0.873 | |
| Circuit | 2 | 3.405 | 0.975 | 0.381 | |
| 3 | Total | 2 | 0.729 | 0.418 | 0.660 |
| Microcontroller | 2 | 0.692 | 0.275 | 0.760 | |
| Coding | 2 | 0.605 | 0.179 | 0.836 | |
| Circuit | 2 | 5.231 | 1.384 | 0.255 |
Table 6.
Independent-sample t-tests for pretest and prior experience based on 1000 bootstrap samples.
Table 6.
Independent-sample t-tests for pretest and prior experience based on 1000 bootstrap samples.
| Exercise | Pretest (Sub) Domain | Mean | Std. Error Difference | t | df | Sig. (2-Tailed) |
|---|---|---|---|---|---|---|
| 1 | Total | −1.624 | 0.513 | −3.160 | 108 | 0.002 |
| Microcontroller | −2.243 | 0.608 | −3.688 | 108 | 0.000 | |
| Coding | −1.117 | 0.597 | −1.871 | 108 | 0.065 | |
| Circuit | −1.058 | 0.615 | −1.721 | 108 | 0.089 | |
| 2 | Total | −0.918 | 0.546 | −1.680 | 108 | 0.097 |
| Microcontroller | −0.705 | 0.667 | −1.056 | 108 | 0.294 | |
| Coding | −1.218 | 0.667 | −1.824 | 108 | 0.072 | |
| Circuit | −0.831 | 0.649 | −1.279 | 108 | 0.204 | |
| 3 | Total | −0.177 | 0.485 | −0.366 | 108 | 0.715 |
| Microcontroller | −0.157 | 0.565 | −0.279 | 108 | 0.781 | |
| Coding | −0.395 | 0.564 | −0.700 | 108 | 0.486 | |
| Circuit | 0.095 | 0.560 | 0.171 | 108 | 0.864 |
Table 7.
ANCOVA tests for posttests and prior experience based on 1000 bootstrap samples.
| Exercise | Posttest | df | Mean Square | F | Sig. |
|---|---|---|---|---|---|
| 1 | Total | 1 | 0.006 | 0.003 | 0.954 |
| Microcontroller | 1 | 10.424 | 2.325 | 0.131 | |
| Coding | 1 | 4.767 | 1.968 | 0.164 | |
| Circuit | 1 | 0.123 | 0.040 | 0.842 | |
| 2 | Total | 1 | 0.013 | 0.008 | 0.929 |
| Microcontroller | 1 | 2.424 | 1.106 | 0.295 | |
| Coding | 1 | 0.260 | 0.060 | 0.807 | |
| Circuit | 1 | 0.348 | 0.099 | 0.754 | |
| 3 | Total | 1 | 2.554 | 1.488 | 0.225 |
| Microcontroller | 1 | 0.315 | 0.126 | 0.723 | |
| Coding | 1 | 7.322 | 2.281 | 0.107 | |
| Circuit | 1 | 0.286 | 0.075 | 0.785 |
Table 8.
Students’ opinion statistics.
| Question | Mean | Std. Deviation | Skewness | Kurtosis | ||
|---|---|---|---|---|---|---|
| Statistic | Std. Error | Statistic | Std. Error | |||
| Q1 | 5.14 | 1.123 | −0.452 | 0.240 | 1.105 | 0.476 |
| Q2 | 5.44 | 1.252 | −0.755 | 0.240 | 0.046 | 0.476 |
| Q3 | 4.76 | 1.477 | −0.490 | 0.240 | −0.039 | 0.476 |
| Q4 | 5.56 | 1.236 | −1.317 | 0.240 | 2.696 | 0.476 |
| Q5 | 5.44 | 1.228 | −0.955 | 0.240 | 1.430 | 0.476 |
Table 9.
ANOVA test for students’ opinion.
| Question | df | Mean Square | F | Sig. |
|---|---|---|---|---|
| Q1 | 2 | 5.600 | 4.778 | 0.010 |
| Q2 | 2 | 2.124 | 1.364 | 0.260 |
| Q3 | 2 | 0.085 | 0.038 | 0.963 |
| Q4 | 2 | 4.653 | 3.177 | 0.046 |
| Q5 | 2 | 4.025 | 2.763 | 0.068 |
Table 10.
Independent-sample t-tests based on 1000 bootstrap samples for students’ attitudes and prior experience.
Table 10.
Independent-sample t-tests based on 1000 bootstrap samples for students’ attitudes and prior experience.
| (Sub) Domain | Mean | Std. Error Difference | t | df | Sig. (2-Tailed) |
|---|---|---|---|---|---|
| Q1 | −0.624 | 0.217 | −2.880 | 109 | 0.005 |
| Q2 | −0.477 | 0.247 | −1.946 | 109 | 0.052 |
| Q3 | 0.242 | 0.296 | 0.819 | 109 | 0.415 |
| Q4 | 0.078 | 0.248 | 0.315 | 109 | 0.753 |
| Q5 | 0.161 | 0.246 | 0.655 | 109 | 0.514 |
Disclaimer/Publisher’s Note: The statements, opinions and data contained in all publications are solely those of the individual author(s) and contributor(s) and not of MDPI and/or the editor(s). MDPI and/or the editor(s) disclaim responsibility for any injury to people or property resulting from any ideas, methods, instructions or products referred to in the content. |
© 2024 by the authors. Licensee MDPI, Basel, Switzerland. This article is an open access article distributed under the terms and conditions of the Creative Commons Attribution (CC BY) license (https://creativecommons.org/licenses/by/4.0/).
Share and Cite
MDPI and ACS Style
Tselegkaridis, S.; Sapounidis, T.; Papakostas, D. Learning Circuits and Coding with Arduino Board in Higher Education Using Tangible and Graphical User Interfaces. Information 2024, 15, 245. https://doi.org/10.3390/info15050245
AMA Style
Tselegkaridis S, Sapounidis T, Papakostas D. Learning Circuits and Coding with Arduino Board in Higher Education Using Tangible and Graphical User Interfaces. Information. 2024; 15(5):245. https://doi.org/10.3390/info15050245
Chicago/Turabian StyleTselegkaridis, Sokratis, Theodosios Sapounidis, and Dimitrios Papakostas. 2024. "Learning Circuits and Coding with Arduino Board in Higher Education Using Tangible and Graphical User Interfaces" Information 15, no. 5: 245. https://doi.org/10.3390/info15050245
Note that from the first issue of 2016, this journal uses article numbers instead of page numbers. See further details here.