Article

Smart Homes and Sensors for Surveillance and Preventive Education at Home: Example of Obesity

by
Jacques Demongeot
1,*,
Adrien Elena
1,
Mariem Jelassi
1,2,
Slimane Ben Miled
3,
Narjès Bellamine Ben Saoud
2 and
Carla Taramasco
4
1
Laboratoire AGIM, Faculty of Medicine, University J. Fourier Grenoble, Domaine de la Merci, La Tronche 38700, France
2
Laboratoire RIADI, Ecole Nationale des Sciences de l’Informatique, Université de la Manouba, 2010 Manouba, Tunisia
3
Equipe de Biostatistiques, Institut Pasteur, 13 Place Pasteur, Tunis 1002, Tunisia
4
Escuela de Ingeniería Civil en Informática, Universidad de Valparaíso, General Cruz 222, Valparaíso, Chile
*
Author to whom correspondence should be addressed.
Information 2016, 7(3), 50; https://doi.org/10.3390/info7030050
Submission received: 26 February 2016 / Revised: 30 June 2016 / Accepted: 29 July 2016 / Published: 8 August 2016
(This article belongs to the Special Issue Smart Home)

Abstract

:
(1) Background: The aim of this paper is to show that e-health tools like smart homes allow the personalization of the surveillance and preventive education of chronic patients, such as obese persons, in order to maintain a comfortable and preventive lifestyle at home. (2) Technologies and methods: Several types of sensors allow coaching the patient at home, e.g., the sensors recording the activity and monitoring the physiology of the person. All of this information serves to personalize serious games dedicated to preventive education, for example in nutrition and vision. (3) Results: We built a system of personalized preventive education at home based on serious games, derived from the feedback information they provide through a monitoring system. Therefore, it is possible to define (after clustering and personalized calibration) from the at home surveillance of chronic patients different comfort zones where their behavior can be estimated as normal or abnormal and, then, to adapt both alarm levels for surveillance and education programs for prevention, the chosen example of application being obesity.

1. Introduction

E-health is concerned with the surveillance and education of chronic patients at home, using New Information and Communication Technologies (ICT) in a smart environment. The data recorded are intended to define a quantitative framework, whose significant deviations from normal mean behavior identify the entry in a chronic pathology (e.g., metabolic, such as obesity and its main complication, type II diabetes, or degenerative, such as Alzheimer’s disease) or the occurrence of an acute episode (like a fall), requiring more and more home interventions due to the population ageing [1,2]. The interest in such a surveillance and education system is two-fold: enabling the longest possible home stay for an effective life in a familiar living environment and avoiding a specialized institution (aftercare, retirement or nursing homes, hospitals, etc.), giving an argument to return home if the specialized institution has not detected any abnormal deviation. In Section 2, we give some examples of sensors detecting risk factors in the case of obesity, and we give a systematic review about the obesity determinants.
In Section 3, we present examples of virtual generic environments developed for surveillance and preventive education at home. In Section 4, we discuss the problem of sensor fusion and the interest to combine surveillance and preventive education.

2. Technologies and Methods

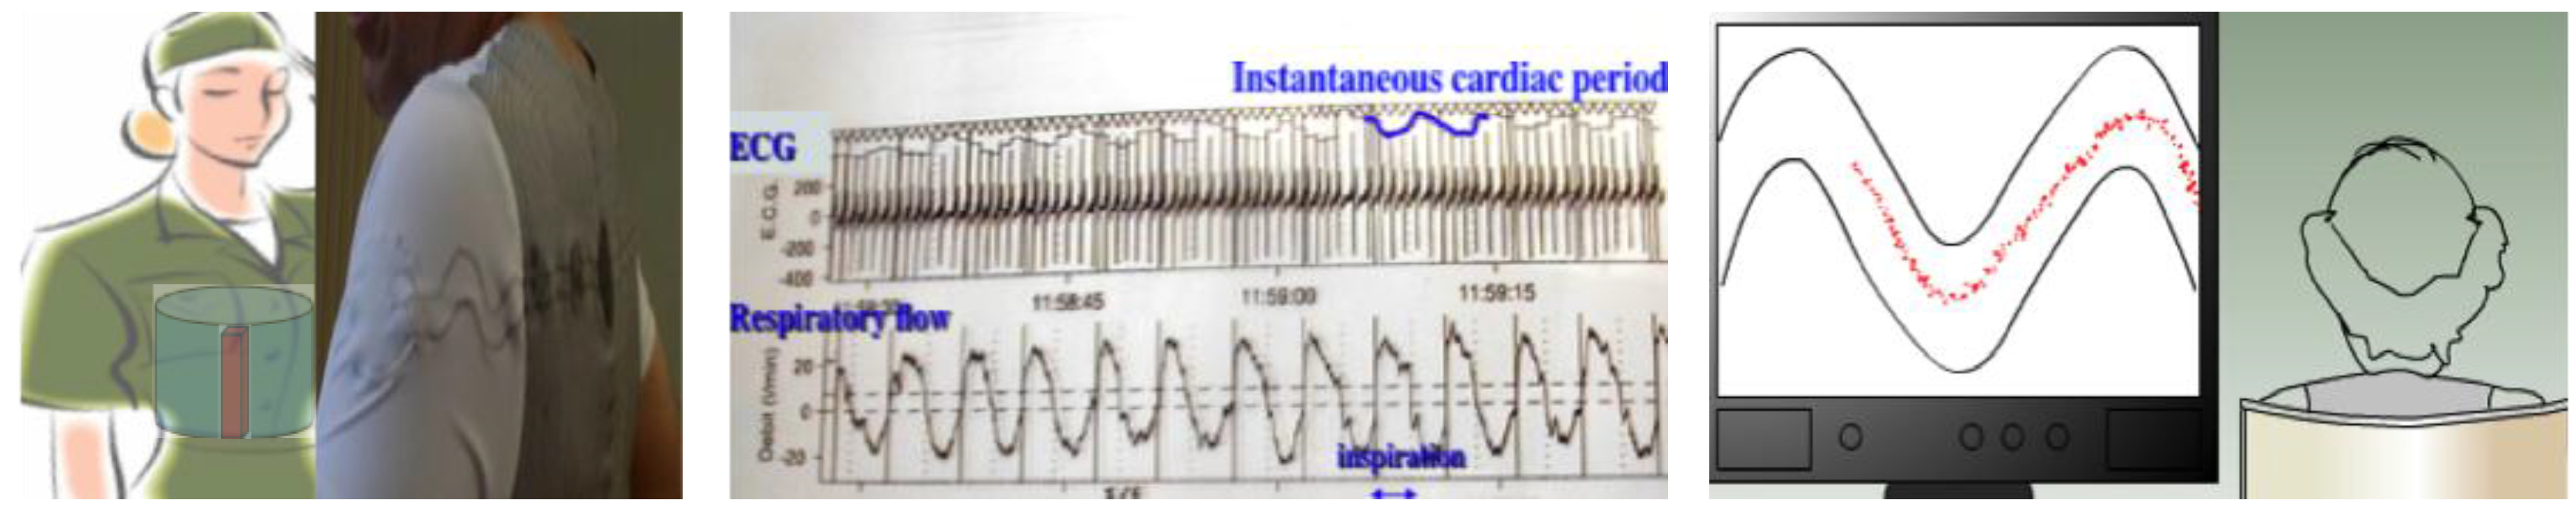
2.1. Physiological Sensors

Physiological sensors are recording the signals generated by the organs belonging to the systems responsible for controlling the vital functions of the human body and its homeostasis, like the cardiac, respiratory, metabolic and excretion systems. The cardio-respiratory sensors for example can be integrated in smart clothes, like the Visuresp® shirt by the company RBI, allowing the recording of the respiratory system from the impedance variation of a solenoid integrated in the shirt tissue (Figure 1, left) carrying also sensors measuring the cardiac rhythm like an ECG Holter, and the skin hydration, such as the Dermodiag® by L’Oréal. The textile used in the shirt can be pressure sensitive, like that developed by the company Texisense and used to record the breathing rate, with a sternal bridge causing a shear type of constraint (Figure 1, left). As well, from the fourth Fourier harmonics of the breathing rate, we can record a heart signal of sufficient quality for controlling the presence or absence of the respiratory sinus arrhythmia, i.e., an acceleration of heart beats during inspiration and a deceleration during expiration (Figure 1, middle), disappearing partly in obesity and early in neurodegenerative diseases and in vascular dementia at the end of the evolution of type II diabetes (which concerns about one third of the obese population).

2.2. Physical Sensors

Physical sensors record the position and movements of the person and his or her caregiver, capturing information from the variations of external physical fields recorded at home, which change with the person’s daily activities. The main fields recorded are thermal and gravitational (e.g., through endo-sensors, like thermal and pressure sensors incorporated in clothes or located under shoes), as well as optical, electro-magnetic and acoustic fields (through exo-sensors, such as microphones or ultrasonic devices). We provide in Figure 2 a few examples of these sensors in various physical fields.

2.3. Sensor Integration

Alarms generated by a surveillance system at home do not come from the diagnosis of a disease as it would come from a medical expert system with a code related to the International Classification of Diseases (ICD) of the World Health Organization (WHO), but rather indicate a functional deficit, as scored in the International Classification of Functioning, Disability and Health (ICF) by WHO, which provides a standard for the description of information about the functioning and disability of a person through observables related to: (i) his or her organic functions and anatomical structures; and (ii) activities at home or during his or her social life.
ICF contains multiple hierarchical classes, which themselves consist of categories. Each category is coded qualitatively in order to describe the sensory, motor and cognitive state of a person at home, with his or her activity limitations and environmental barriers. By combining the fusion of data provided by physiological and physical sensors with the ICF classification (Figure 3), it is possible to trigger alarms corresponding to the entrance in a critical class requiring an intervention (immediate or scheduled) from caregivers. For example, by combining information given by pressure sensors under bottles and glasses, with water use at the tap and water excretion in toilets, we calculate the hydric balance needed by the surveillance of obesity and its complications, type II diabetes and the related nephropathy.

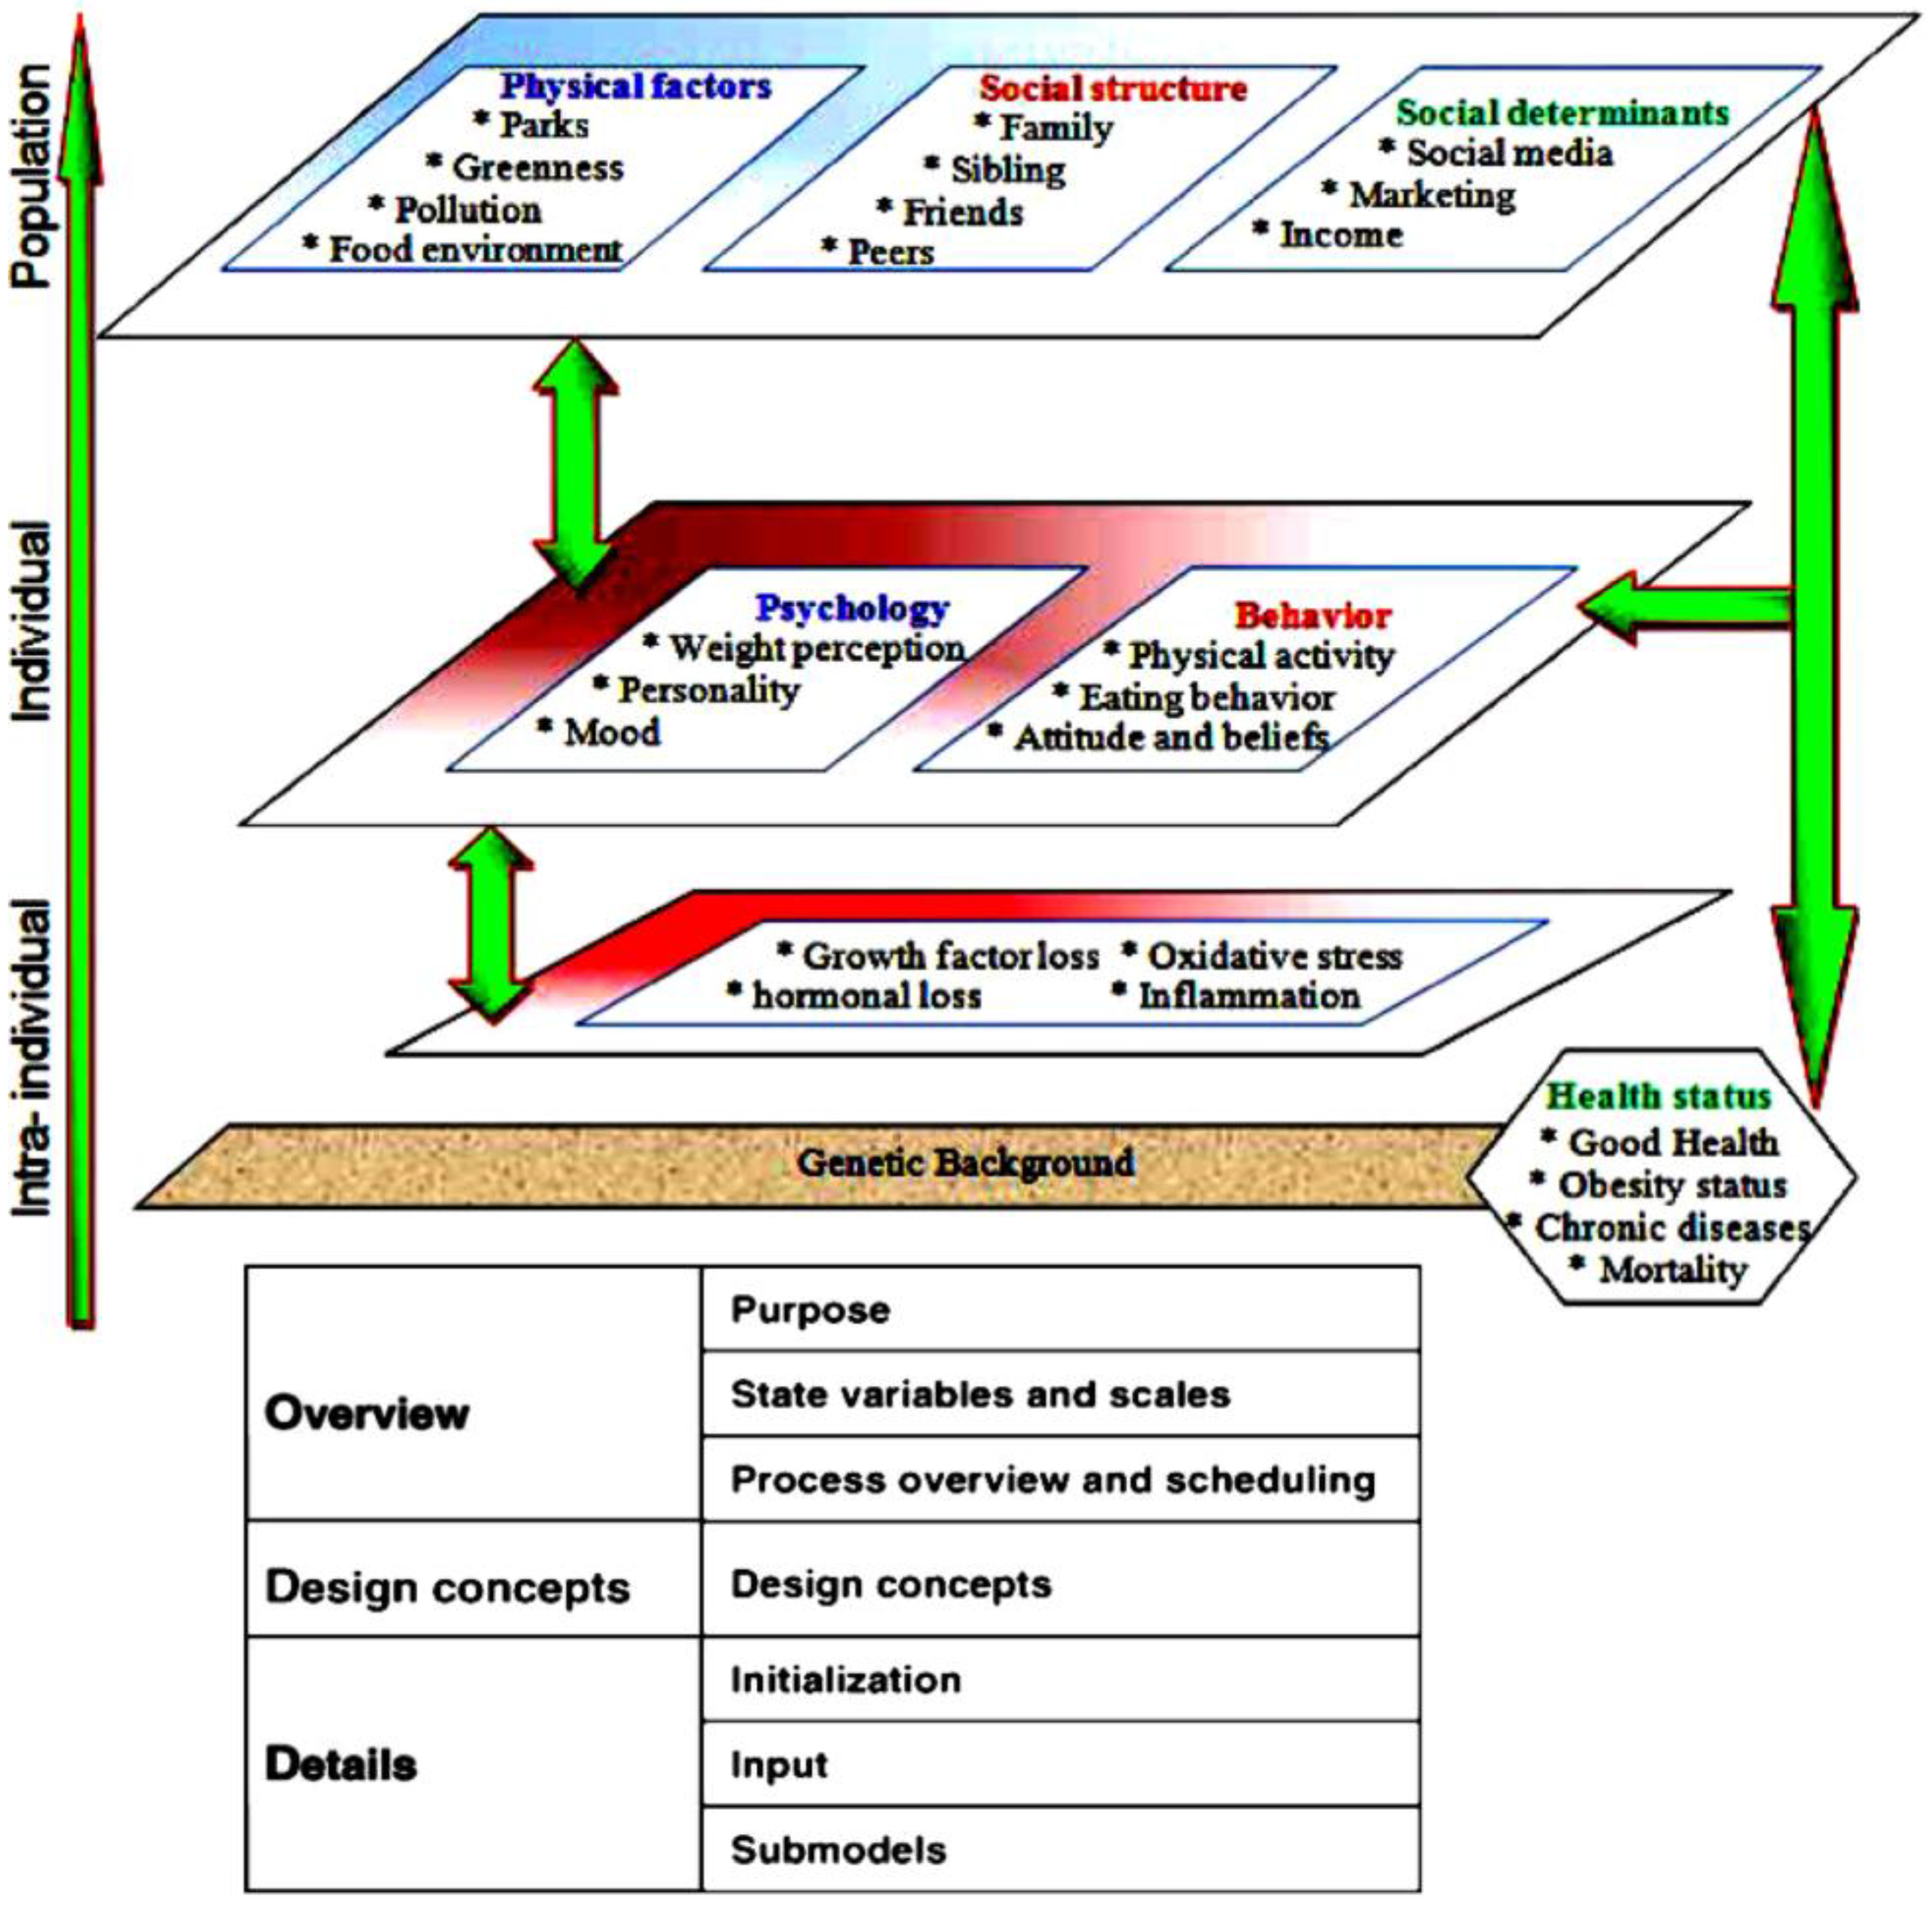
2.4. Obesity Determinants

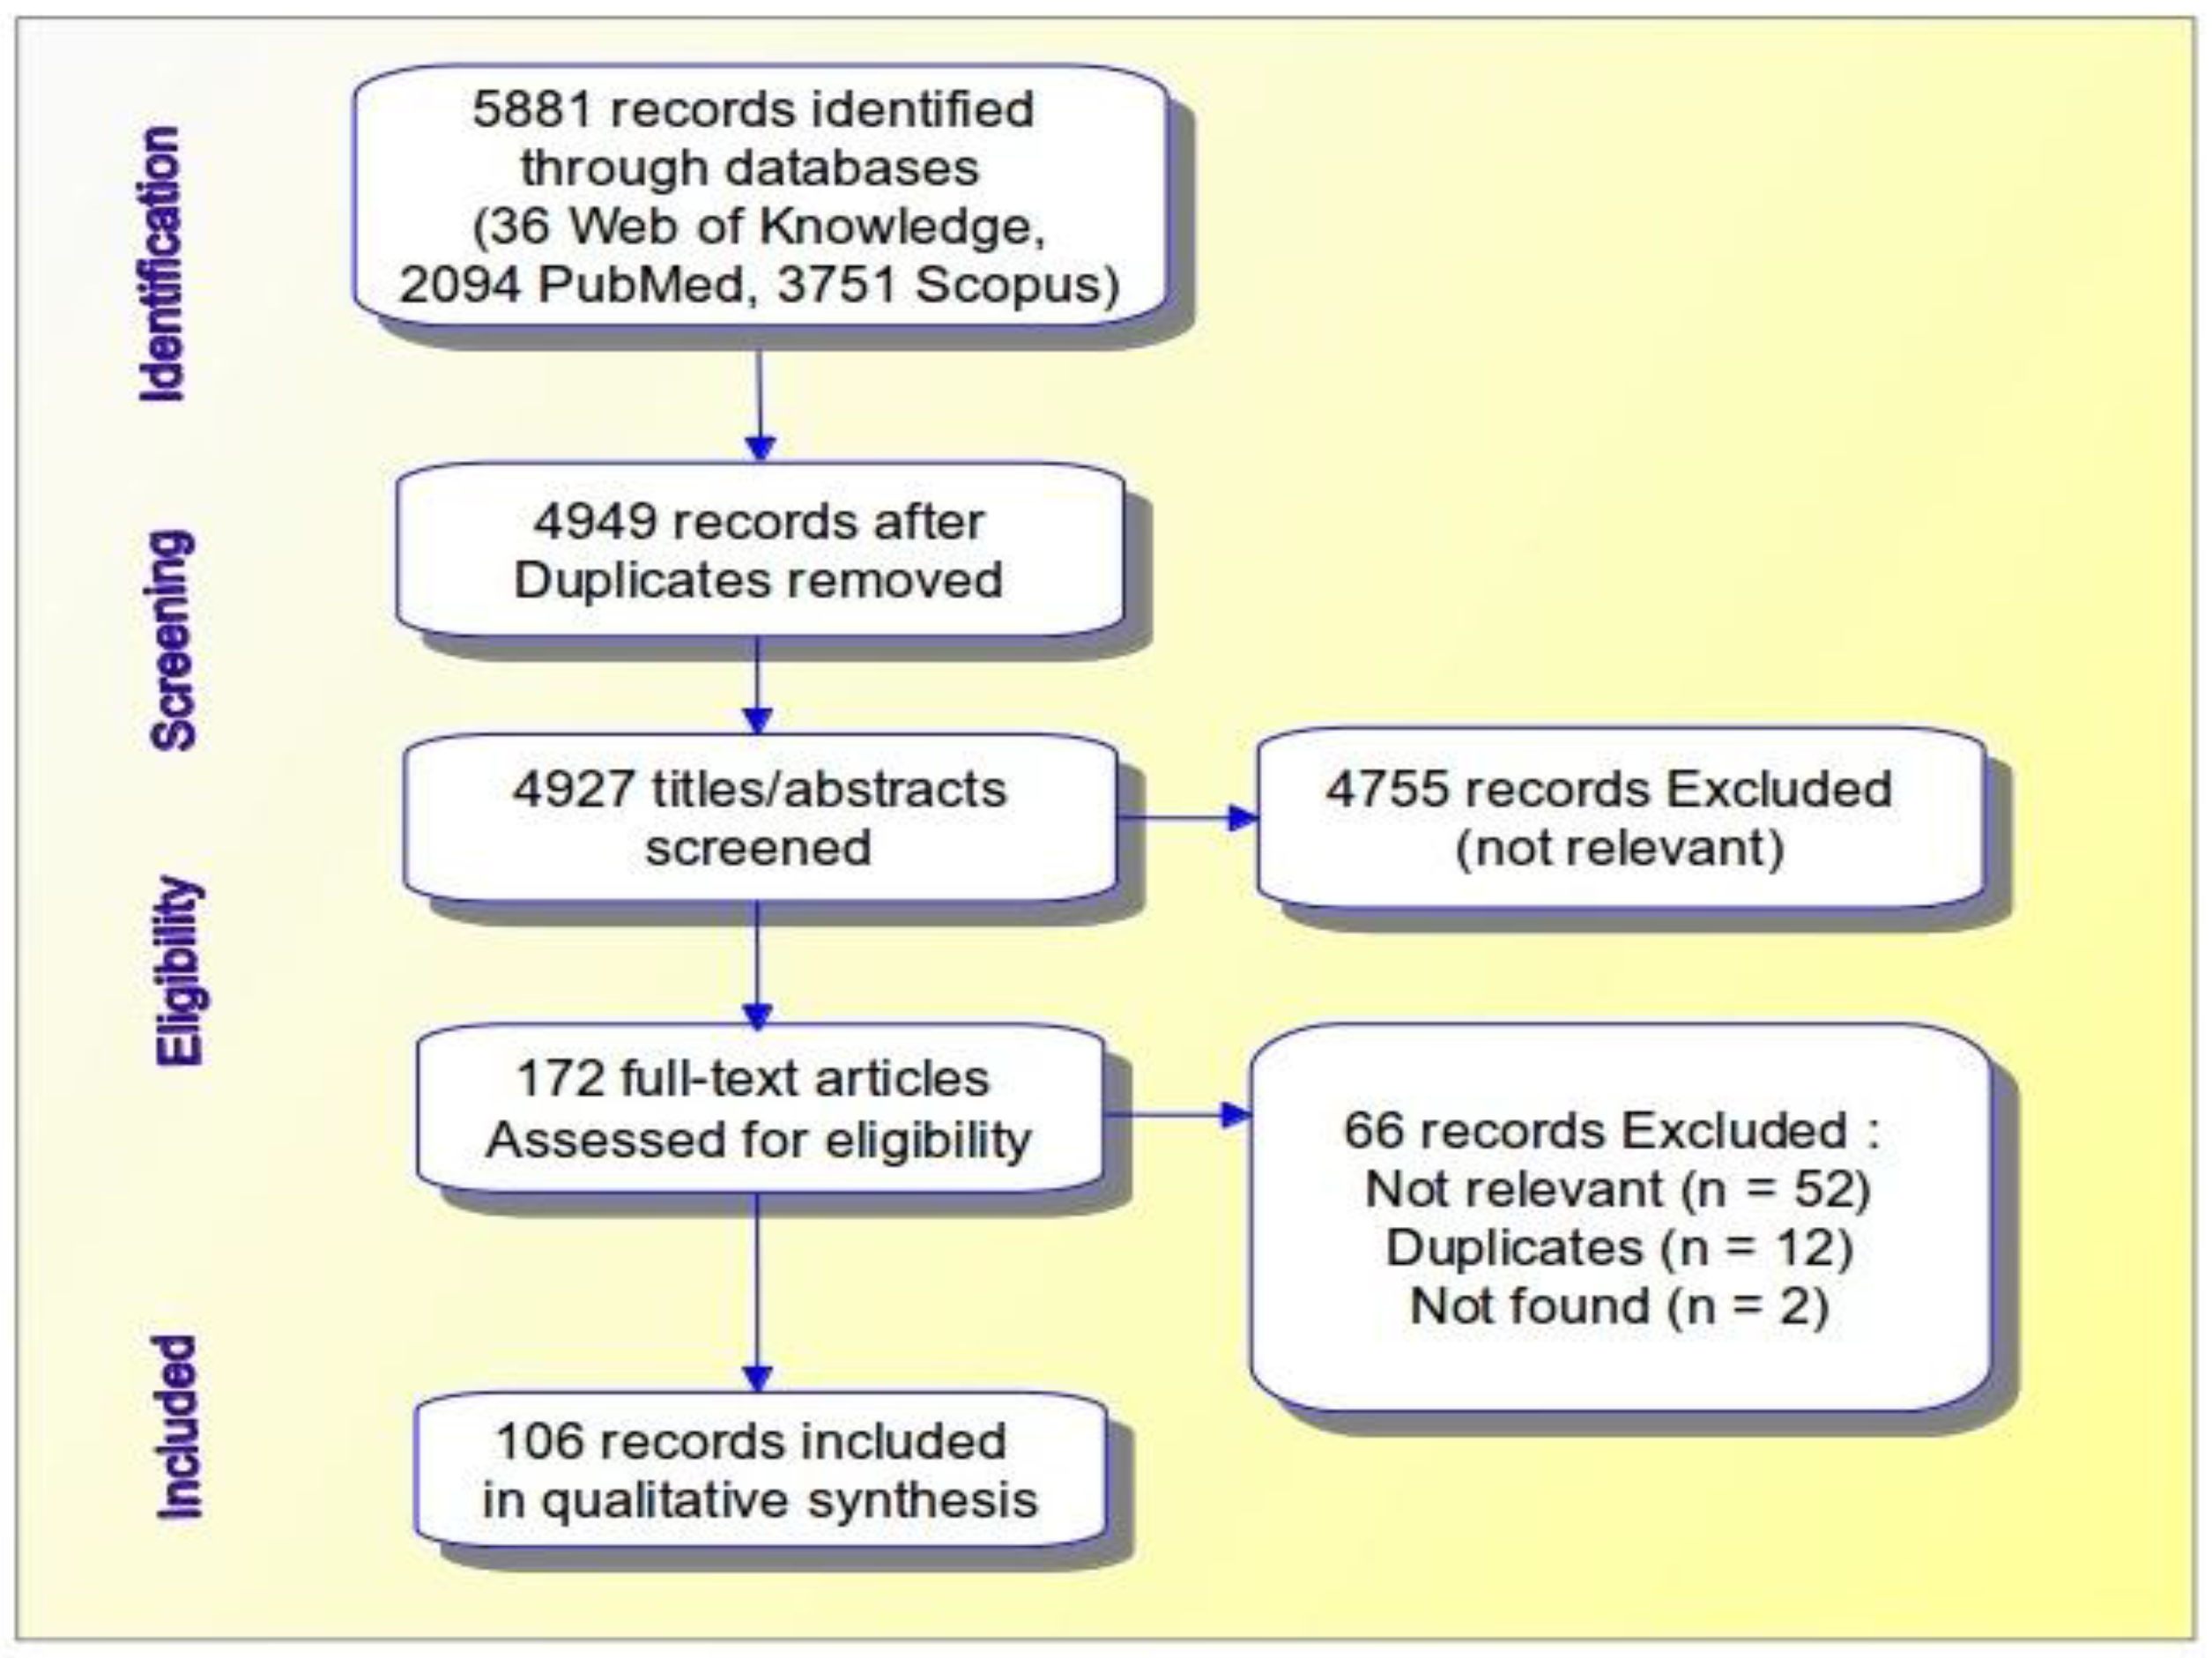
2.4.1. A Systematic Review

The Body Mass Index (BMI) is usually used to characterize being overweight and obesity in adults. It is defined as the ratio between the weight of a person in kilograms by the square of his or her height in meters. Following the definition by the World Health Organization (WHO), one person is qualified as overweight when his or her BMI is greater than or equal to 25, and obese if his or her BMI is greater than or equal to 30. Within the class obesity, there are three subclasses: moderate (BMI less than 40), severe (BMI between 40 and 50) and morbid (with a BMI greater than 50). The state of obesity has multiple chronic comorbidities, such as hypertension, coronary disease, stroke, type II diabetes, dyslipidemia, lung disease including sleep apnea, osteoarthritis, gout and certain cancers [3]. In 2007–2008, more than a third of the adults in the U.S. were obese [4]. The prevalence of severe clinical obesity has increased more rapidly among adults in the United States than the prevalence of moderate obesity [5]. WHO has declared obesity as a “social and environmental illness” and a global epidemic, namely a pandemic [6]. As this global epidemic has quickly increased in the recent decades, more of a genetic component is necessary to explain its spread. Some studies have indeed demonstrated that social, behavioral and economic factors were involved in obesity [7,8,9,10], and now, this pathology is considered as a social disease, which is to be studied from a socio-epidemiological perspective, a branch of epidemiology known for its insistence on explicitly investigating the social determinants of population distributions observed in the health domain, in wellness, as well as in pathology, rather than considering these factors as a mere systematic background to biomedical phenomena [11]. Unfortunately, there are only a few research works on the determinants of obesity based on systematic reviews, such as the Monasta [12] or Sobal studies [13], and even they consider only specific aspects of the factors of obesity, such as the socioeconomic status [14] and some environmental factors [15] or obesity determinants at some stage of life, such as early life and preschool [16].
We have explored in the present study the various articles on obesity using a systematic approach called PRISMA (Preferred Reporting Items for Systematic Reviews and Meta-analyzes), regardless of any restriction on certain key characteristics, and we have classified the resulting factors of obesity following their level, populational, individual and intra-individual. This type of systematic review corresponds to “a review that was prepared using a systematic approach to minimize bias and random errors” [17]. It is different from the traditional review because of its transparency and reproducibility in the research of the concerned pertinent literature [18]. We established a PRISMA statement [19], which is a minimum set of evidence-based elements (more precisely a checklist with 27 items) for reporting in the systematic review meta-analyses, identifying and highlighting obesity factors following various criteria:
(1) Eligibility: In order to identify all of the factors of obesity in the context of social epidemiology, we chosen the following selection criterion, that is a target population made of human individuals of different age groups (children, adolescents and adults) to study the entire population. Since we wanted to observe the phenomenon of obesity at individual and population levels, we have selected the following variables: health status (normal, overweight or obese), own weight perception, psychology and behavior (personality, mood, eating habits, physical activity, etc.) and the characteristics of the concerned social network with its inter-individual interactions. The variables involved in the obesity spread coming from the environment were physical and social structures, as well as environmental determinants. No restriction has been applied to the year or the status of the source of the selected articles (journal, proceedings, book, etc.).
(2) Selection of the sources of information: An electronic search was performed using the classical databases, ISI Web of Knowledge®, Scopus® and PubMed. We used for example the following expression with AND and OR operators for demonstrating the role of the social interactions on the spread of the disease: (peer effects AND social networks AND obesity AND BMI) OR (large social network AND sexual network AND BMI) OR weight (obesity epidemic AND social contagion) OR (complex systems AND obesity epidemic modeling AND policy) OR (systems AND system dynamics AND network analysis AND agent-based modeling AND health) OR (social networks AND obesity epidemic AND collective behavior) OR (obesity AND BMI AND social networks AND public health). This search sentence has been chosen to identify obesity factors both at the individual and populational levels. At the individual level, the crucial question was: at what point is a person at risk of becoming obese? At the population level, we tried to understand: how were the effects of peer influence on the spread of obesity and which tool from system science could help to explain the collective behavior of the obesity spread? We refined the search strategy in Scopus, restricting the language to English, and the topic area to medicine, health, social sciences, engineering, computer science and mathematics. We have selected titles and abstracts for their eligibility. Many retained documents do not correspond to the target of the request. Therefore, we have eventually selected also mathematical models, statistical studies and simulation approaches on obesity involving dynamical systems, network analysis or agent-based modeling.
(3) Data collection and items choice: we have extracted the data and items from the articles selected on the basis of the above eligibility criteria. Then, we have studied each of them, in order to identify the main variables involved in the obesity spread, by using the ODD protocol: Overview, Design concepts and Details (Figure 4, bottom). Therefore, we have classified these selected variables at three levels, i.e.: (1) populational; (2) individual; and (3) intra-individual (Figure 4, top). The ODD protocol has been published in 2006: it standardizes the description of the retained models, such as individual-based models (IBM) or agent-based (ABM) models [21], in order to render more understandable and complete these specific approaches, making them easier to duplicate. We have also generalized the use of the ODD protocol for the populational models to emphasize the environmental determinants that contribute to obesity and are present at the populational, individual and intra-individual levels (Figure 4, top).
The selected articles come from different continents: America (43), Europe (26), Australia (11) and Asia (6). Some papers are pure reviews or in silico simulations. This distribution gives an idea about the perception of obesity based on the geographic location and on the social awareness in the spread of this epidemic. The diagram in Figure 4 (top) classes the factors of obesity into three categories [20]: the first describes environmental determinants, including social and physical factors; the second includes psychological and behavioral factors; and the third consists of biological factors [22], notably the genetic background of the concerned individual [23,24,25,26,27]. A summary diagram (Figure 5) is carried out on the basis of [20] to illustrate the successive stages of the extraction of 106 studies selecting many factors on three important levels, namely: (i) environmental; (ii) psychological and behavioral; and (iii) biological.
Among all of the tools from systems science used in public health, the network-based models are well suited to account for the collective behavior in the spread of obesity. Indeed, the significant increase of obesity disease in the world cannot be explained only by individual characteristics, metabolic and/or genetic. Thus, the environment is considered in numerous studies. Some of them are focused on the physical environment, such as physical activity [28] and food [9]. Others have studied the nature and degree of influence on the individual eating habits of environmental factors, such as the existence of greenness areas [29,30] and pollution [31]. In addition, a person lives in a social community. In [21], the model proposed takes into account the social structure of income distribution and gender equality. In [9], the social structure corresponds to the social network of an individual and to his or her social environments as regards the home environment, as well as the family and peer network, which is made up of relatives, friends, siblings, etc. Many articles have reported the existence of a relationship between the state of obesity of an individual and his or her social network [32,33], depending on the nature of the relation and on the age of the individuals concerned. During the childhood of an individual, the eating habits [34] and physical activity [35] of his or her family have more influence than during his or her adolescence and adult stage. Several researchers studied the influence of friends and peers on the body mass index of an individual by using systems science tools that have been proposed to determine the impact of the collective behavior of the social network in the spread of obesity [36,37,38,39,40,41]. Some of these tools are based on the system dynamics approach [42,43], which is pertinent to study the transmission of obesity at the population level, while others use network analysis [33,44], as well as agent-based modeling [45] for investigating at the individual level.
In the wide range of simulation approaches mimicking the transmission of obesity, the authors of [46] suggested that the social network analysis is probably the best-known methodological approach to study obesity transmission, because it provides an illustrative example of broadly applicable considerations in the interpretation of the simulated results (Figure 6). The obesity epidemic comes from a system containing diverse sets of stakeholders at different levels of scale, with different motivations and priorities, which constitutes an actual difficult problem of modeling [43,47]. Therefore, we used the systematic review protocol to explore all of the involved factors. However, an important aspect, the behavioral law of an ethnic group, has not been mentioned in the literature. This behavioral law is made of two important elements: (1) leadership; and (2) malleability. Indeed, from the group level to the individual one, the malleability is dominant, because a person can be influenced by the general tendency of the group. On the other hand, from the individual level to the group one, it is the leadership that guides the individual motion, if there is a leader who manages the group. Furthermore, an individual may be a leader in a group, but a follower in another one. For example, in the case of obesity, if we consider a teenager, he can be a follower at home because he eats what his or her mother is cooking, may be a leader in his or her friend network and even a person who is a group leader during a certain period of time and that becomes later a follower. This variability across time and between individuals constitutes a perspective to explore in the future. To conclude, the state of obesity corresponds to a very complex social syndrome, probably with many still unknown determinants.

2.4.2. Environmental Factors

The environment consists of the set of various factors (chemical, physical and biological) acting on an individual organism or an ecological community and eventually influencing its form and ensuring its survival. Another definition of the environment is the set of all social and cultural conditions influencing the lifestyle of an individual or a community. From these definitions, we tried to select articles referring to the relationship between the environment and obesity. The environment of an individual or a community plays a major role in his or her eating habits. Some articles focus on the underlying environmental mechanisms causing the increasing prevalence of overweight and obesity: they are called obesogenic factors [45]. In a population, each individual lives with a given lifestyle, interacts with others and has his or her own opinion and position. At the population level, the individual's environment is represented by physical factors, such as the food, greenness areas, etc., and by social factors, such as the social network, social status, etc. According to [11], the environmental factors can be dispatched into physical and social micro- and macro-environmental determinants. In their modelling approach, Rizzuto and Fratiglioni have considered that the environment is the whole set of physical, social, as well as structural (cultural, psychological and biological) determinants [20]. In [39], obesity is described as due to these environmental determinants rather than a contagion effect, and in [47], Christensen found also that obesity is due to the environmental factors, as proposed in [48], whose initial results have been supported by the authors of [38] with some additional statistical studies.

2.4.3. Physical Factors

Physical factors are represented in [20] by purely physical factors (such as soil, water supply, climate, etc.) and elements of the surroundings, e.g., parks, physical activity facilities, restaurants, fast foods, food stores, etc., that influence the development and maintenance of the individual organisms or social communities. Rizzuto and Fratiglioni proposed in [20] more physical factors, the outdoor pollution and the indoor micro-environment, while in [9], the authors studied the environmental influence on food choice considering physical settings related to child care, school, workplace, food stores, restaurants and fast foods. Following these definitions, several physical factors were extracted from the literature related to obesity. In [49], it is shown that air pollution from traffic is positively correlated with BMI growth in children aged 5–11 years. The characteristics of the neighborhood are involved in several research projects. It has been shown that the food environment (as the access to food stores, restaurants, fast foods, etc.), as well as the physical activity environment influences the weight status of the individuals [41,50,51,52,53]. Other research works have focused on the characteristics of parks and greenness areas and their association with obesity. In [53], the authors showed that the increase in the number of parks tends to reduce obesity, and the cleanliness of parks is negatively correlated with obesity. In [29], it is shown that a high level of the neighborhood greenness areas is correlated with a lower risk of obesity in adults. In [8], physical environmental determinants are considered, as the type of street where the individual lives, if there are sidewalks and if there exists an easy or poor spatial access to four or more recreational facilities (sport and leisure centers, golf courses, gyms, swimming pools, tennis courts, public green open spaces, beaches or river foreshores, etc.). Besides these determinants, they also considered two measures of perception about the location of roads with walking and/or biking paths within walking distance or at a 5-min drive from the residence and about the existence of shops within walking distance. They concluded that being overweight is correlated with life on a road or street without sidewalks or with a sidewalk on only one side and with no perception of a way to walk. They also concluded that obesity is correlated with poor access to sidewalks and to four or more recreational facilities, with no perception of shops existing within walking distance.

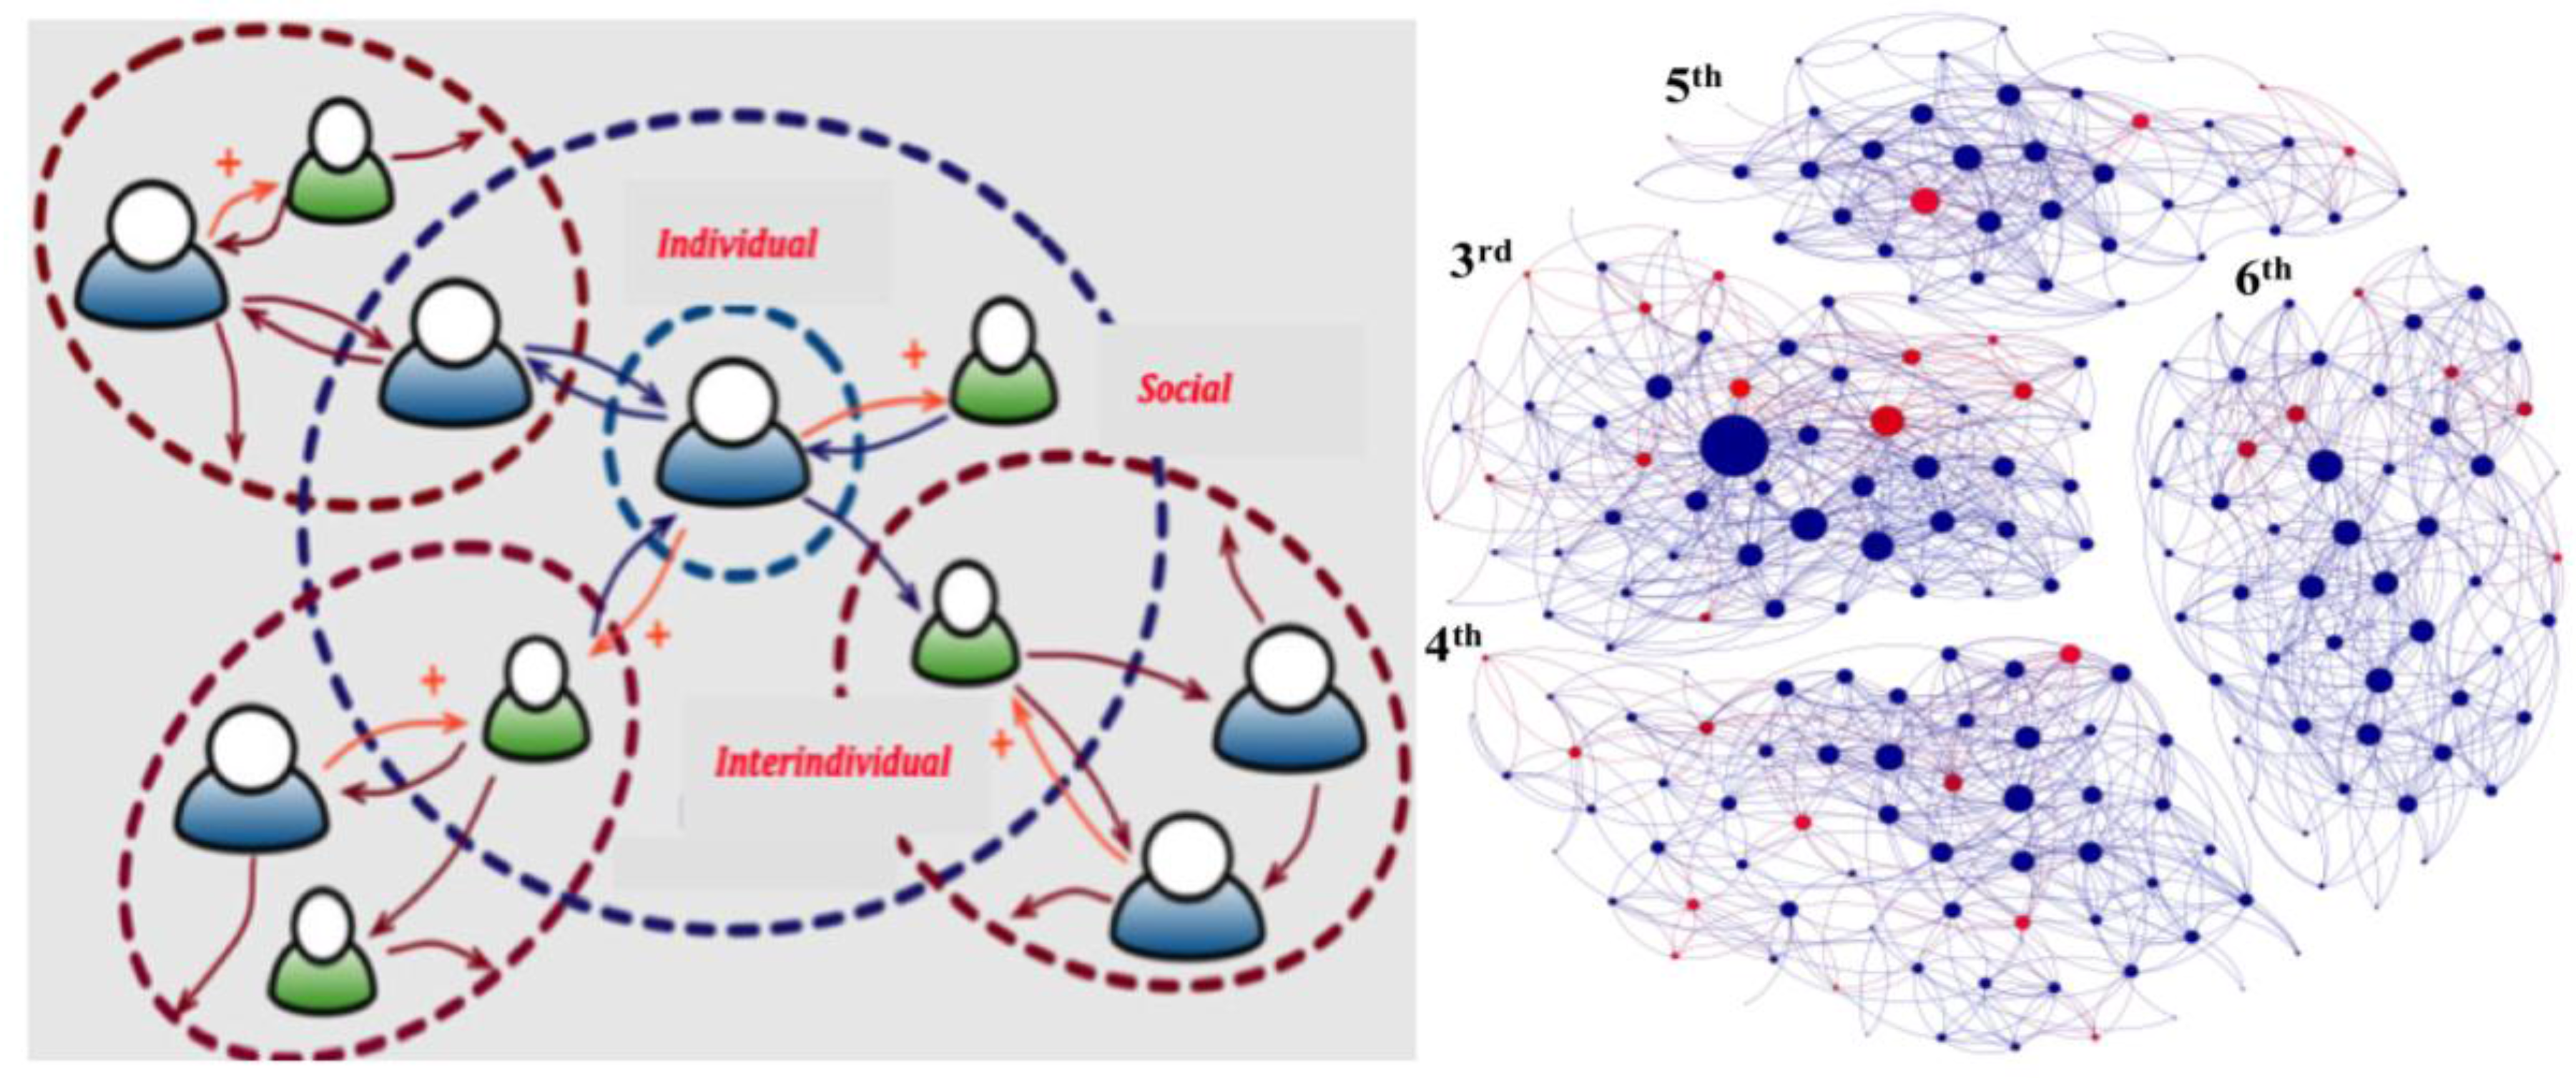
2.4.4. Social Factors

People living in a society can be considered as a system organized in a specific ensemble of relationships and interactions forming a social structure. In [20], this social structure is characterized by the distribution of income and gender. In [11], the social environment is defined as the family and the social network of friends and peers. In this review, the social structure corresponds to the social network of an individual. The nodes (or actors) of this network are family members, friends, siblings and peers. Numerous studies have shown a relationship between the individual’s obesity status and his or her social network [7,33,38]. This association depends on the nature of the relationship and on the age of the individual. When he is a child, an individual is greatly influenced by the familial eating habits [4,36,54,55,56] and physical activity behaviors [30]. In [57], the authors describe the parents' education as one of the main determinants of obesity. They have shown statistically from a representative national cohort of pupils aged 11–15 years that those with two parents having a low education level were more likely to be obese than those who have at least one parent with the highest education level. Other research works have focused on the siblings and their influence on individual BMI; some have studied the weight perception by siblings and its impact on the weight of the individual [7]; and others have looked after the sibling condition if they shared or not the same household [58]. They all agree that there is a positive correlation between the BMI of siblings and the BMI of the individual. Otherwise, some authors focused on the influence of peers and friends on the BMI of an individual. These studies mainly involve children and adolescents [34,59] and are not able to show a correlation between the body weight of friends and the body weight of an individual [60,61]. In [62], the authors have tried to understand the similarities of weights among the friends of an adolescent in order to determine if it is due to a phenomenon of contagion as proposed in [7] or to a selection based on the friendship, called homophily in [63]. They conclude that the similarity of weights in a network of friends is caused by a friendship selection. This result coincides with that presented in [20] using a social network analysis. Other studies, e.g., those found in [38,43,64], have shown that children had food attitudes and behaviors similar to those of their friends and peers, which reinforces the hypothesis of contagion. This result coincides with that presented in [20] using a social network analysis. The authors of [5] and [40] supported also the hypothesis of the existence of a social contagion, as well as the authors of [42], who show in their review that peers and friends play an important role in the physical activity level of the adolescents.
In the totality of these studies, numerous tools coming from system science were used in order to determine the impact of collective behaviors in the spread of obesity [9,65,66]. Some of them are based on system dynamics [28,67,68] and intend to explain the transmission of obesity at the population level, while investigating at the individual one, others are using techniques of network analysis [5,53,69] or agent-based models [54,66]. In this wide range of theoretical approaches for modelling and simulating the transmission of obesity, the authors in [9] suggest that the analysis of social networks is the best systemic method for studying obesity spread. In this review, the social determinants are defined as exogenous forces coming from society, such as marketing and social media, or elements defining the individual lifestyle, such as income. These determinants belong to the so-called “macro-environment” in [70], whose authors held that it involves income and socio-economic status, marketing of food, agricultural and food policy, as well as cultural norms and values. In [42], the authors studied the determinants of obesity in relation to the socio-economic status of middle-aged Swedish women, and they found that a low socio-economic status was an important factor involved in the increase of being overweight and obesity. In [71], family and social environment with high and middle-low income levels have been studied, and the authors found that there are much more fathers who are obese in middle-low income municipalities than in high income ones. However, no correlation between the income level and the BMI of the mother has been found. The authors also reported that children in middle-low income areas are spending more time in sedentary activities and participate less in physical activity than children in higher income areas. This study combines both social factors and the social structure of an individual in the research of obesogenic determinants. Another important source of social factors is related to the marketing, e.g., in the marketing of food products, some research focused on packaging design leading to overeating [17] and have shown that the design of the packaging can bias the perception by the people of the quantity inside and, therefore, causes an increase of their preference for supersized packages and portions that appear smaller than they are. As the marketing is involved in the spread of obesity, it can also be used for its prevention policy. Indeed, some community-based marketing campaigns have been launched in order to encourage the low-income groups to participate in sports and to push them to practice through recruitment and retention in physical activity programs [22]. All of the studies showed that an efficient social marketing campaign, sufficiently funded, is able to improve the recruitment into some exercise sessions and to maintain a reasonable level of attendance and implication.

2.4.5. Psychological and Behavioral Factors

At the individual level, psychological and behavioral determinants are the result of the interactions between an individual and his or her social environment. According to the model given in [72], these determinants can be divided into factors of personality, lifestyle factors and into attitudes and beliefs. They discovered that many dietary and lifestyle determinants, such as food, energy intake, nutrients, physical activity, smoking, alcohol consumption, behavioral factors, such as stress and sleep, as well as cultural factors, are essential in the etiology of both social communicable and non-communicable diseases. In the case of obesity, many research works have focused on the psychological and behavioral determinants. Behavioral factors identified in this study are related to the lifestyle whose various definitions have been provided. In [73], it is suggested that behavioral lifestyle determinants, including diet and physical activity, are the main sources of obesity. In their model, they proposed a qualitative assessment of lifestyle using an index of sedentary lifestyle, comprising three levels: low, medium and high. This index is calculated from the confidence given to responses to certain questions chosen to evaluate the inactivity. In [51], the authors studied the lifestyle determinants, such as smoking and eating habits, familial obesity mimicking, sport practice, leisure time, level of physical activity and motor fitness. In their statistical analysis, the authors concluded that the impact of familial lifestyle factors on an individual obese state is significantly important. In [74], the authors consider the lifestyle characteristics represented by the number of hours watching television on weekdays and weekends, the number of hours playing video games a day, the composition of the breakfast before school, the consumption of soft drinks, the frequency of times playing outside and practicing club and non-club sports. They have found a correlation between all of these lifestyle factors and an individual being overweight. A similar conclusion is given in [40], where the authors found that lifestyle determinants can be identified as hours per week spent watching TV, physical activity, recreation and access to a motor vehicle. They deduced that access to a motor vehicle is always negatively associated with obesity, that watching TV every day (3 h or more) and considering oneself as less active than others are associated with both overweight and obesity and that physical activity during leisure time is not associated with being overweight or obesity. In [35], the authors have included in their lifestyle model some determinants, such as sleep, eating, exercise, alcohol consumption and smoking. They found that the absence of a hobby or of a respected fixed schedule for lunch, the presence of smoking and colleagues’ smoking, as well as candy consumption, all of these lifestyle factors are associated with an increased BMI in men. Less sleep duration, breakfast and lunchtime variability and frequent soft drink consumption were associated with a higher BMI in women.
All of the definitions of lifestyle above are similar, some of them being more quantitative and others more qualitative than the others. Some researchers examined eating habits in order to explain obesity [41,75,76]. They have highlighted the relationships between environmental determinants and eating behavior. In [77], it is shown that students would change their unhealthy eating habits for healthy ones, because of social and environmental positive influences. The authors also found that students with similar eating patterns tend to form separate clusters. In [47], it is deduced that personal behavioral factors may alter the influence of the obesogenic food environment in low-income women. The authors of [29] have found that neighborhood park areas, as well as close grocery stores may have different influences on the physical activity during leisure time (LTPA) and, hence, on being overweight/obesity in men and in women. They suggested that a higher density of fast foods (respectively park areas) in the neighborhood was correlated with an increased likelihood of overweight/obesity (respectively LTPA). In [56], the authors observed a strong association between individuals and their peers’ health behavior (exercise practice, feeding habits) in young adults. Although they could not show an actual causality, they concluded that the health behavior of one’s peers influences the development of a similar behavior in a young individual.
The psychological factors identified in the literature are mood welfare [63], self-assessment [78,79], anxiety [80], stress [81], self-esteem [82], impulsivity [45,27,83] and self-perception of body weight [10,25,35,41,63,82,84,85,86,87,88,89,90]. In [27], the authors conclude that personality traits are associated with weight gain, and weight gain can also be associated with a change in personality. They observed that a significant weight gain was associated with an increase of impulsivity and deliberation. The work in [45] also supports this conclusion: studying children with and without loss of control (LOC) on diet, they found that children with LOC were significantly more impulsive than children without LOC.
In other articles, it was reported that obesity is associated with depression, anxiety and with the feeling of a low well-being in women, but not in men [80]. In [88], the authors have shown relationships between stress, low self-esteem, avoidant coping and depressive mood, and they observed that a low self-esteem with avoidant coping was related to a poor diet behavior. In [63], a multiethnic sample of young adolescents aged 11–15 years has been studied, with the conclusion that self-esteem was not associated with BMI in girls. On the contrary, self-esteem was significantly lower in obese men than in normal weight ones, while in [78,79], the authors concluded that the association of an improvement of mood factors and self-evaluation with an improvement of weight was supported in obese women. The work in [83] studied the effect of childhood socio-economic status on the BMI in adult men and women. The authors have found that an early social disadvantage may influence adult weight status more strongly in women due to gender differences in the timing and nature of the socialization of their weight management and that personality enhances or detracts from risks incurred during childhood or adulthood due to socio-economic status.
Weight perception is another important psychological factor studied in the literature of obesity. In [86], it is shown that an accurate weight perception in overweight people was associated with an increased frequency of disordered eating habits. In [89], the authors have found that the highest levels of perceived weight were obtained in individuals who are underweight and that older men and younger women classified themselves properly, as well as men without children and also women with children. A cohort of married Indian women has been studied in [84], and a contradiction has been shown between the self-perceived body weight by women and their actual weight. A quarter of women who were overweight and 10% of obese women perceived themselves as having a normal weight. In [7], it was shown that women often overestimate their weight, while men frequently underestimate their own. Moreover, even in childhood (6–12 years), girls are more likely to see themselves as too fat and report trying to lose weight than boys [90]. Another main determinant is the psychological beliefs of individuals and the societal influence on them. Some research has even shown that the social structure of an individual can affect his or her perception of his or her own weight. Women are more frequently overestimating (respectively underestimating) their weight if their sisters did the same, but more rarely if their brothers overestimate (respectively underestimate) their own weight [7]. In [23], the perception and beliefs about body size, weight and weight loss have been studied in Afro-American obese women. The authors have found that these women believe people are more attractive and healthy at larger sizes. All of these observations show that the individual cannot be considered independent of his or her environment, particularly in the case of social diseases, such as obesity.

2.4.6. Biological Factors

The authors suggest in [91] that obesity can accelerate the normal ageing process and in [92], this hypothesis is also supported. The papers [93,94] describe the biological effects of obesity particularly on neurodegeneration, growth factor decrease, hormone loss, oxidative stress and obesity-induced inflammation [95]. In addition, obesity has a direct influence on ageing, which affects the occurrence of neurodegenerative diseases, for example through the anti-Warburg effect [96,97,98].
In this paper, we call “normal” an individual with a normal weight, but susceptible to enter the dynamics of overweight/obesity without major obesogenic factors belonging to one of the five categories described above: environmental, physical, social, psychological and behavioral and biological. We will use the expression “at risk” for people with at least one major predisposing obesity determinant, e.g., the presence of being overweight.

2.5. Actimetry for Chronic Patients at Home

Numerous ageing societies, like the French, support R&D projects devoted to smart homes [99,100,101,102] and assistive technologies [103], using experimental platforms like living labs as support for conducting experiments that normally take place in a healthcare facility. This offers numerous advantages, such as the ability to pre-validate experimental prototypes before their use in the real world. In the case of the absence of infrastructure, computer simulations involving multiple variables in the healthcare area [104,105,106,107,108,109,110,111,112,113,114,115,116] play a key role. They can simulate different activity trends based on heterogeneous parameters (e.g., age, education, seasons, etc.) [111], by replacing specific components or whole smart systems with new designs, hence avoiding tedious lab experiments or expensive real-world deployments [112,113,114]. They can also be used for testing uncommon scenarios of everyday life, by managing sensor distributions and assessing new algorithms in areas of activity recognition [115,116,117,118,119]. Sensors used at home belong to several types of classic sensors, like:
-
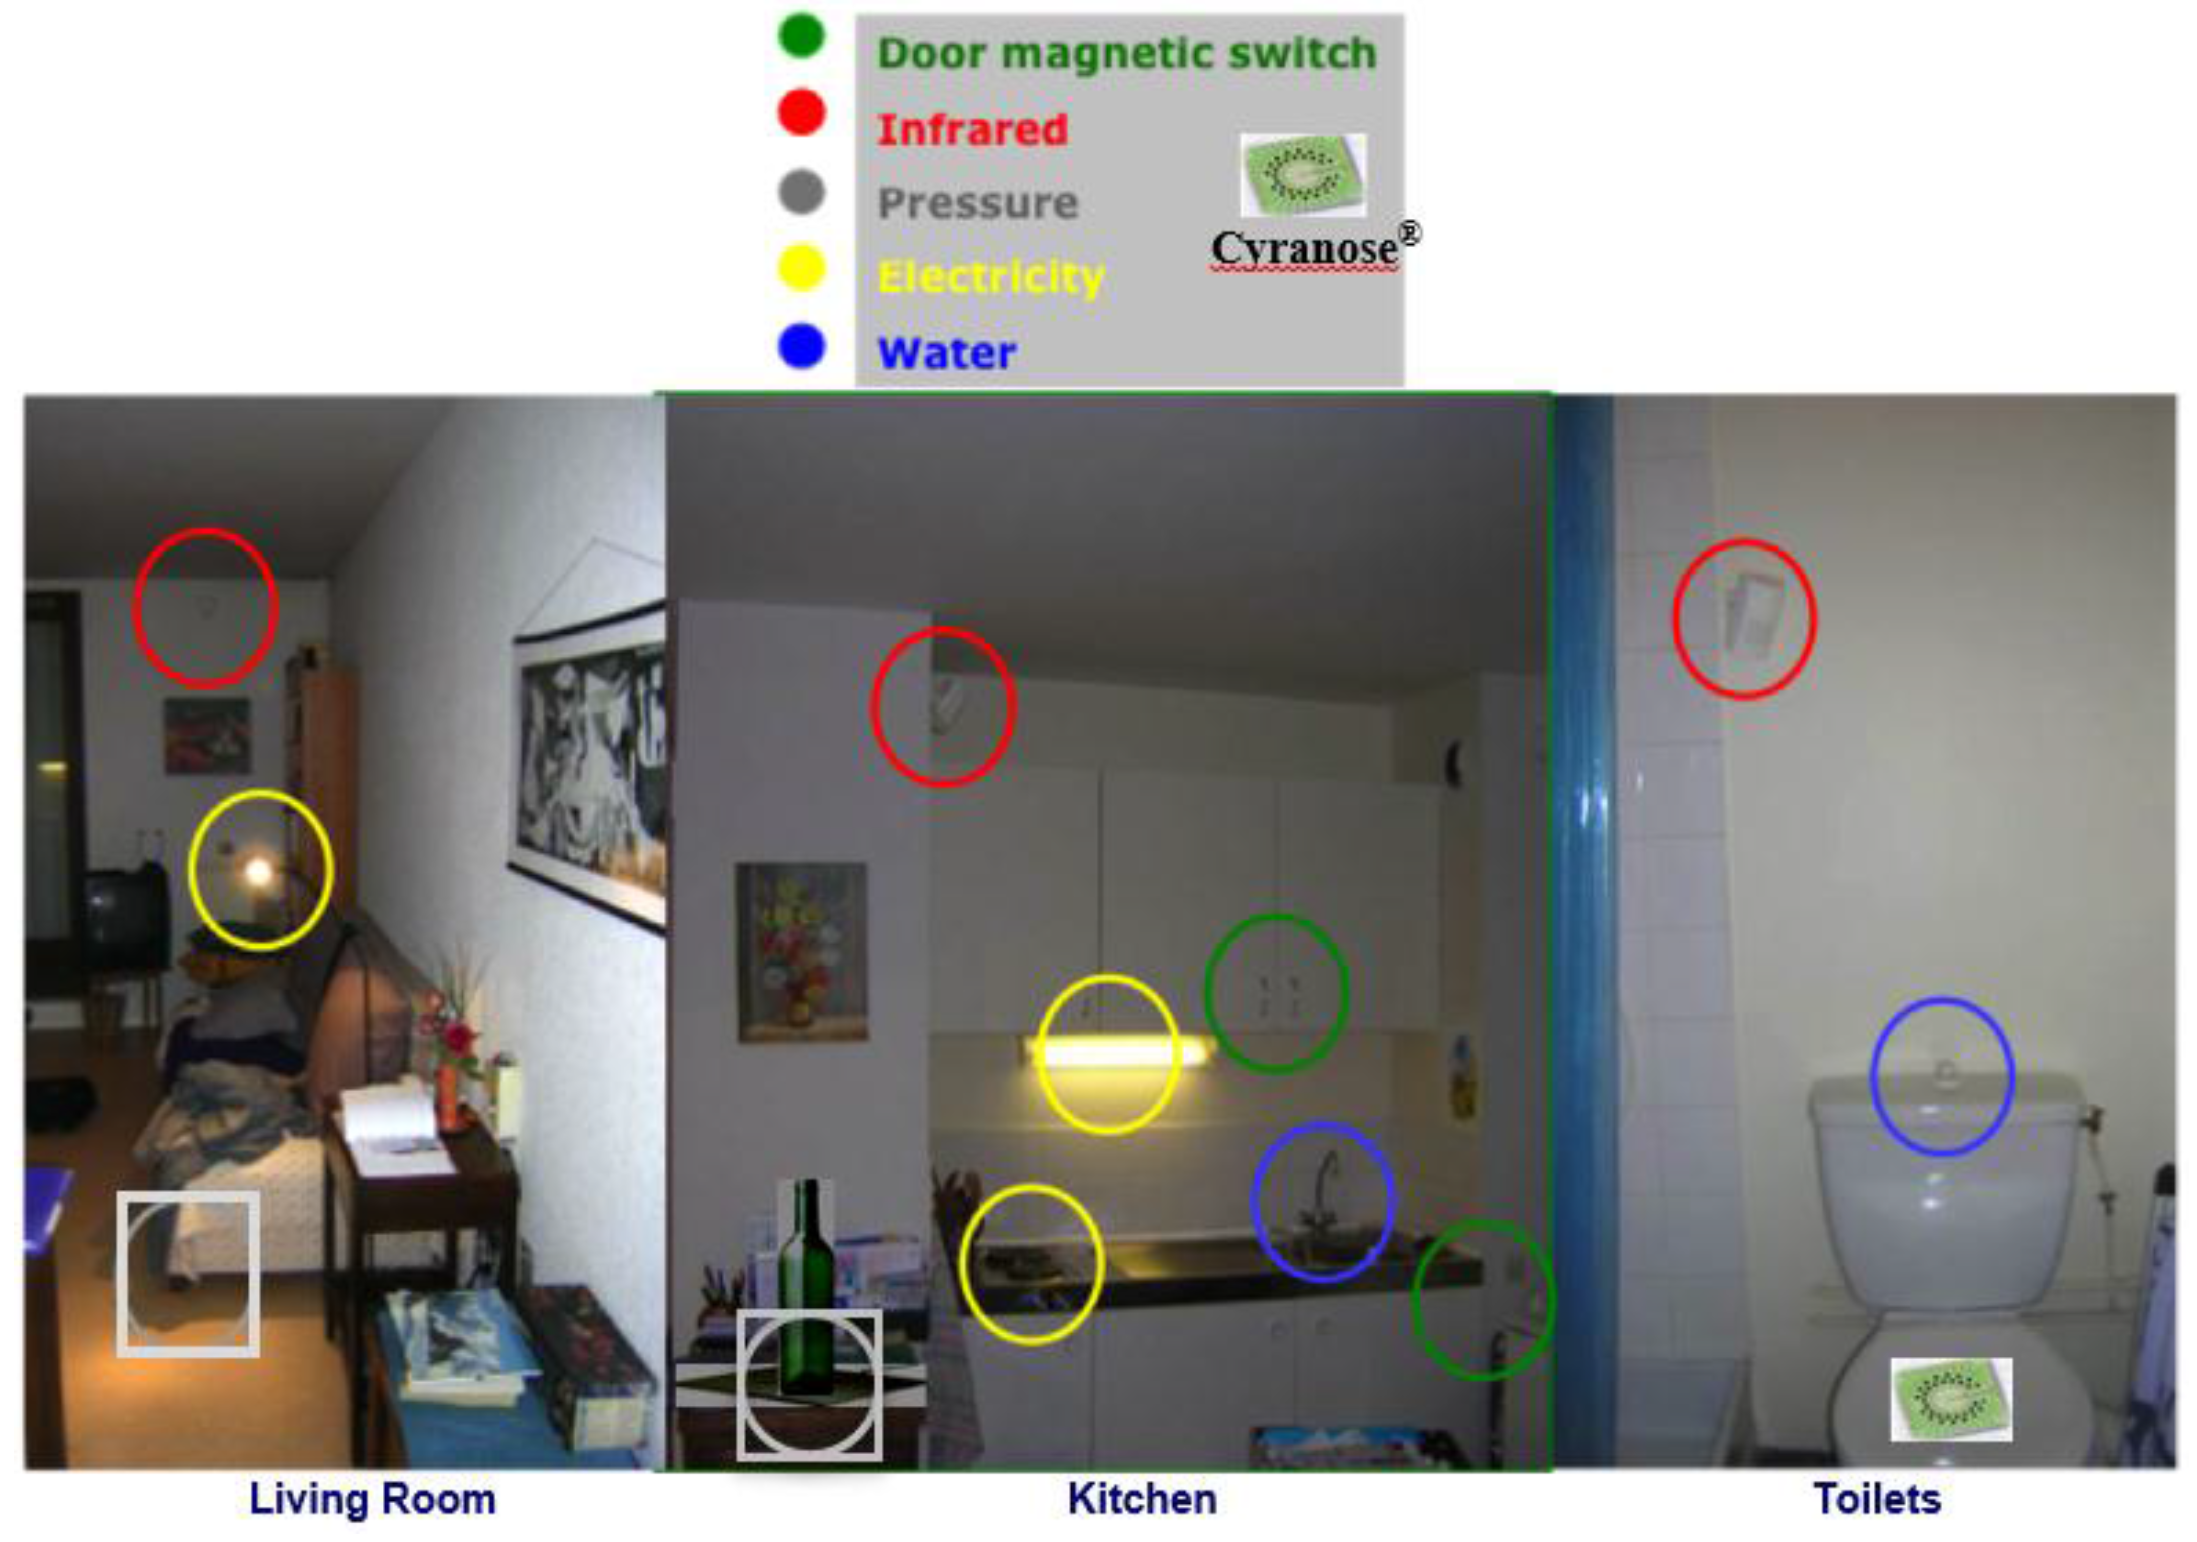
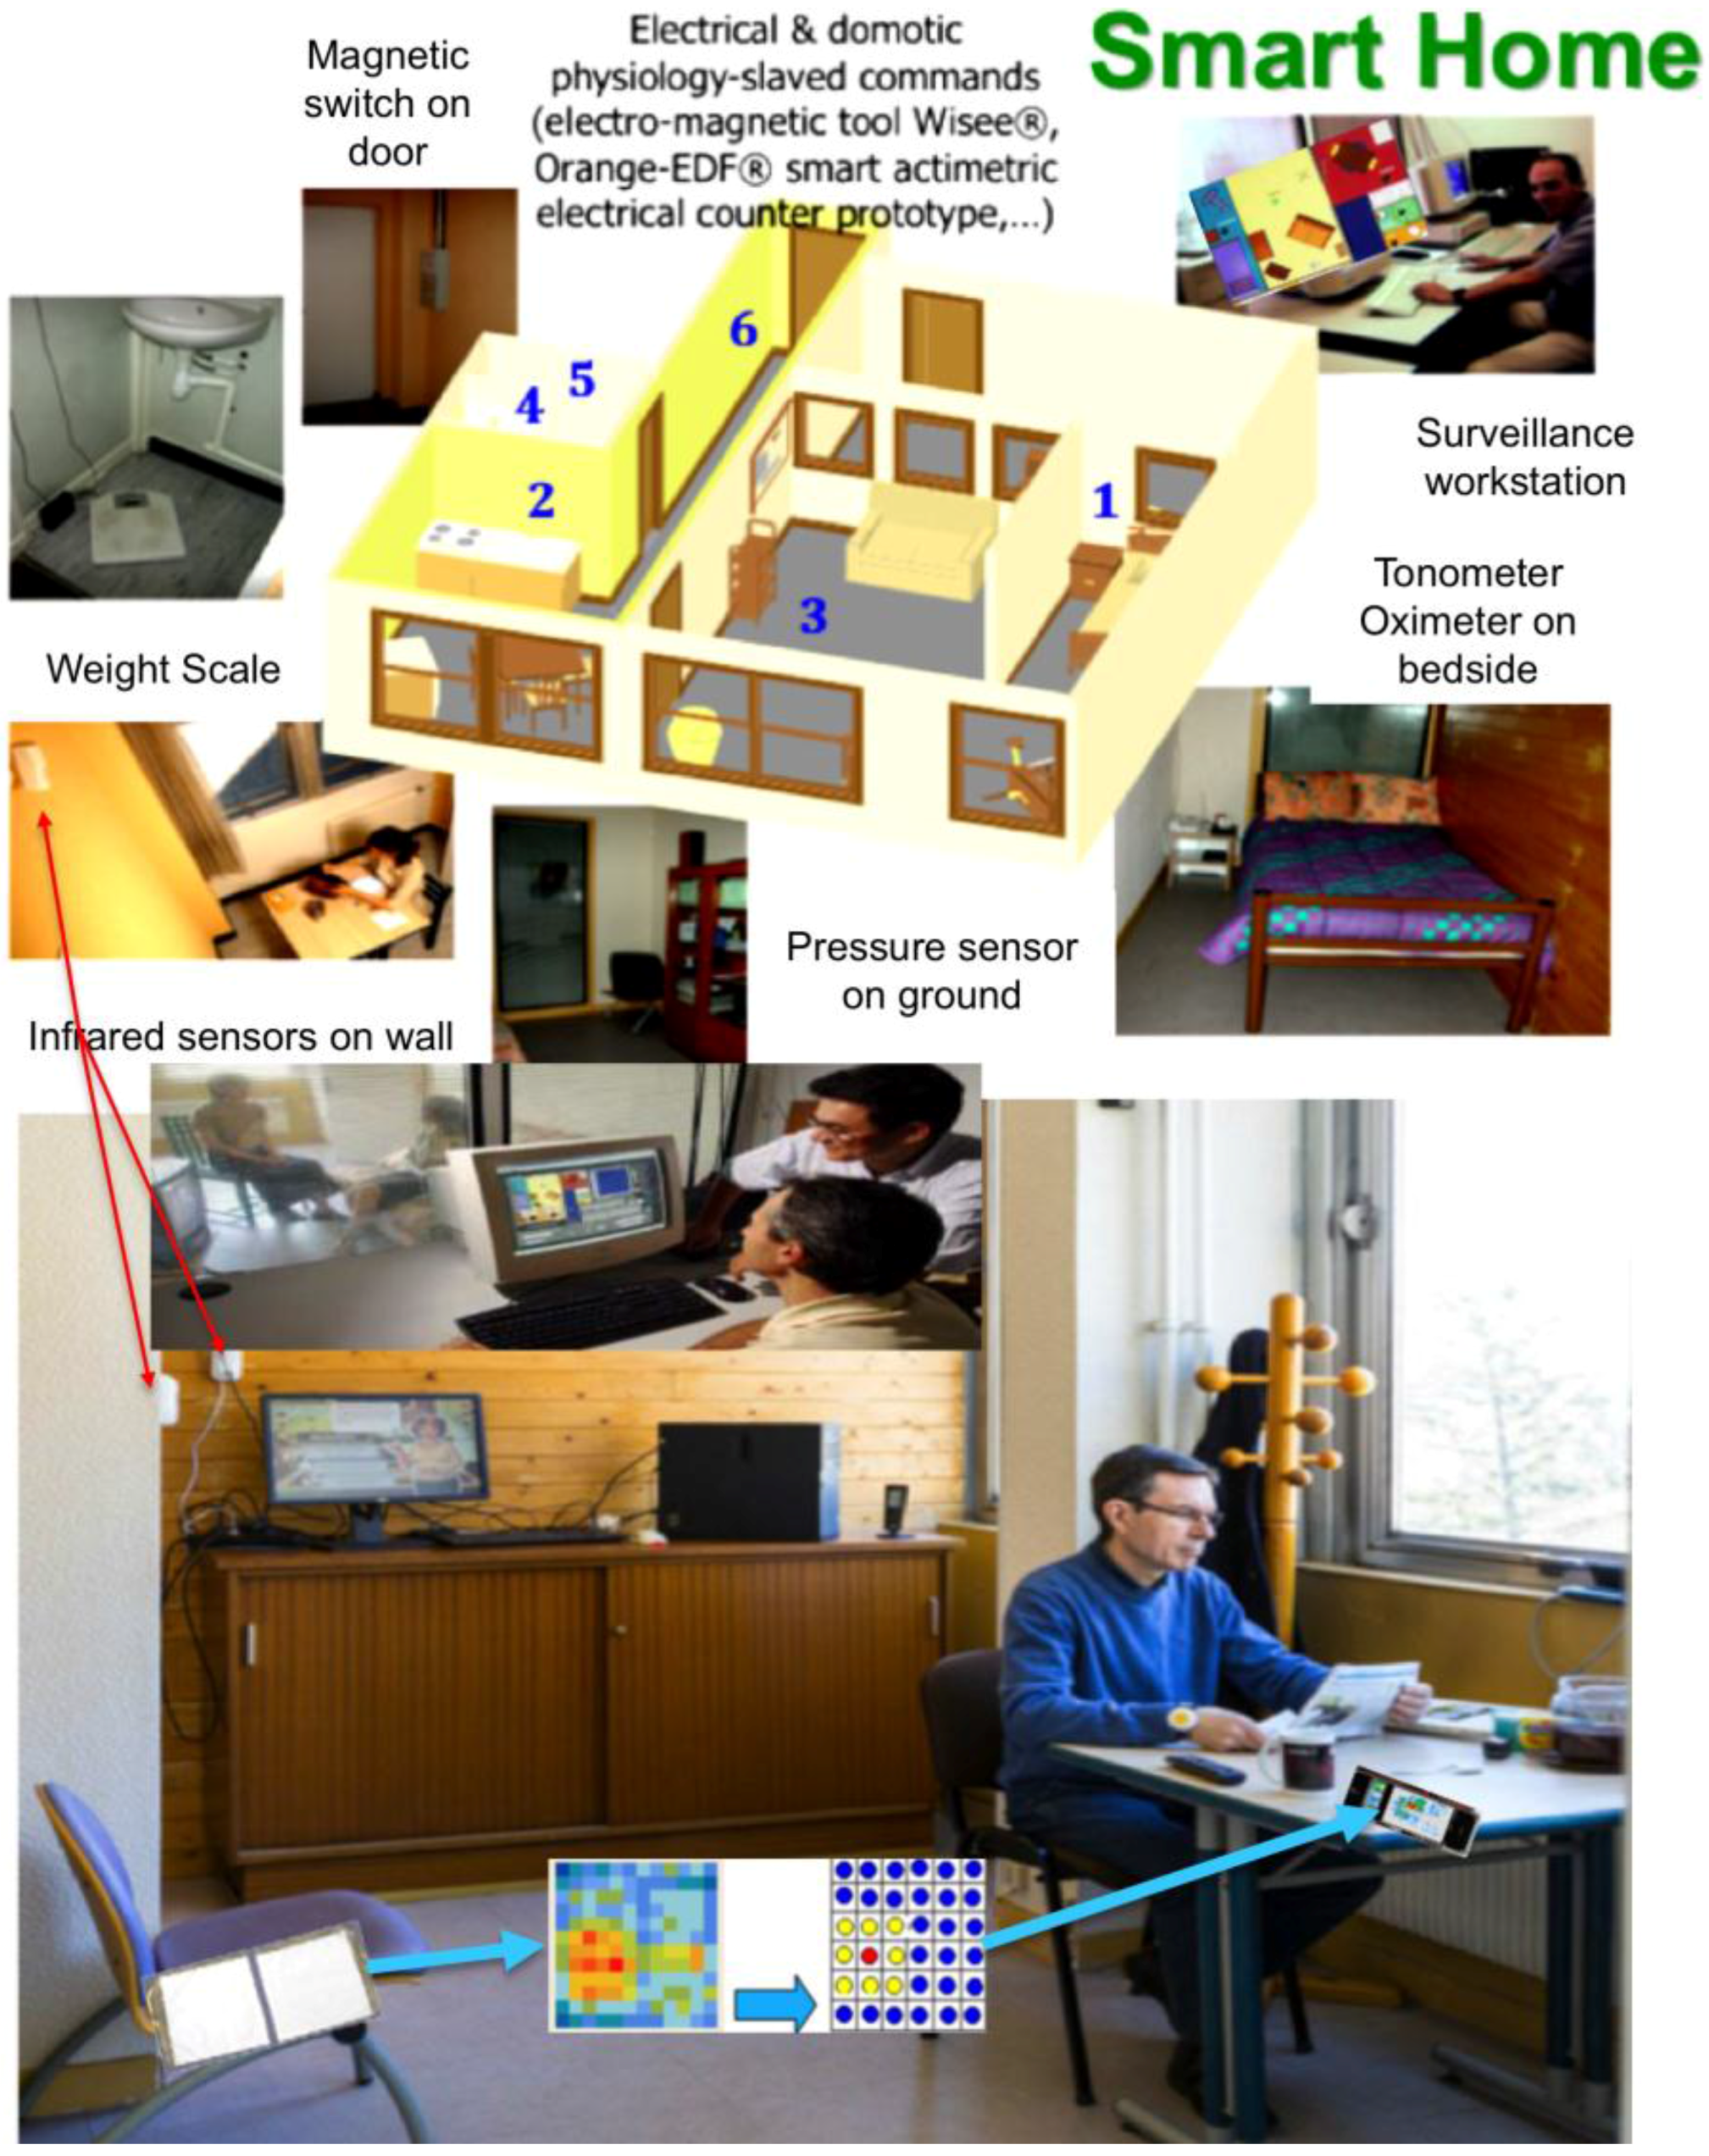
Magnetic sensors detecting closed and open doors
-
Infrared sensors detecting movement
-
Sensors recording electric power and water consumption
-
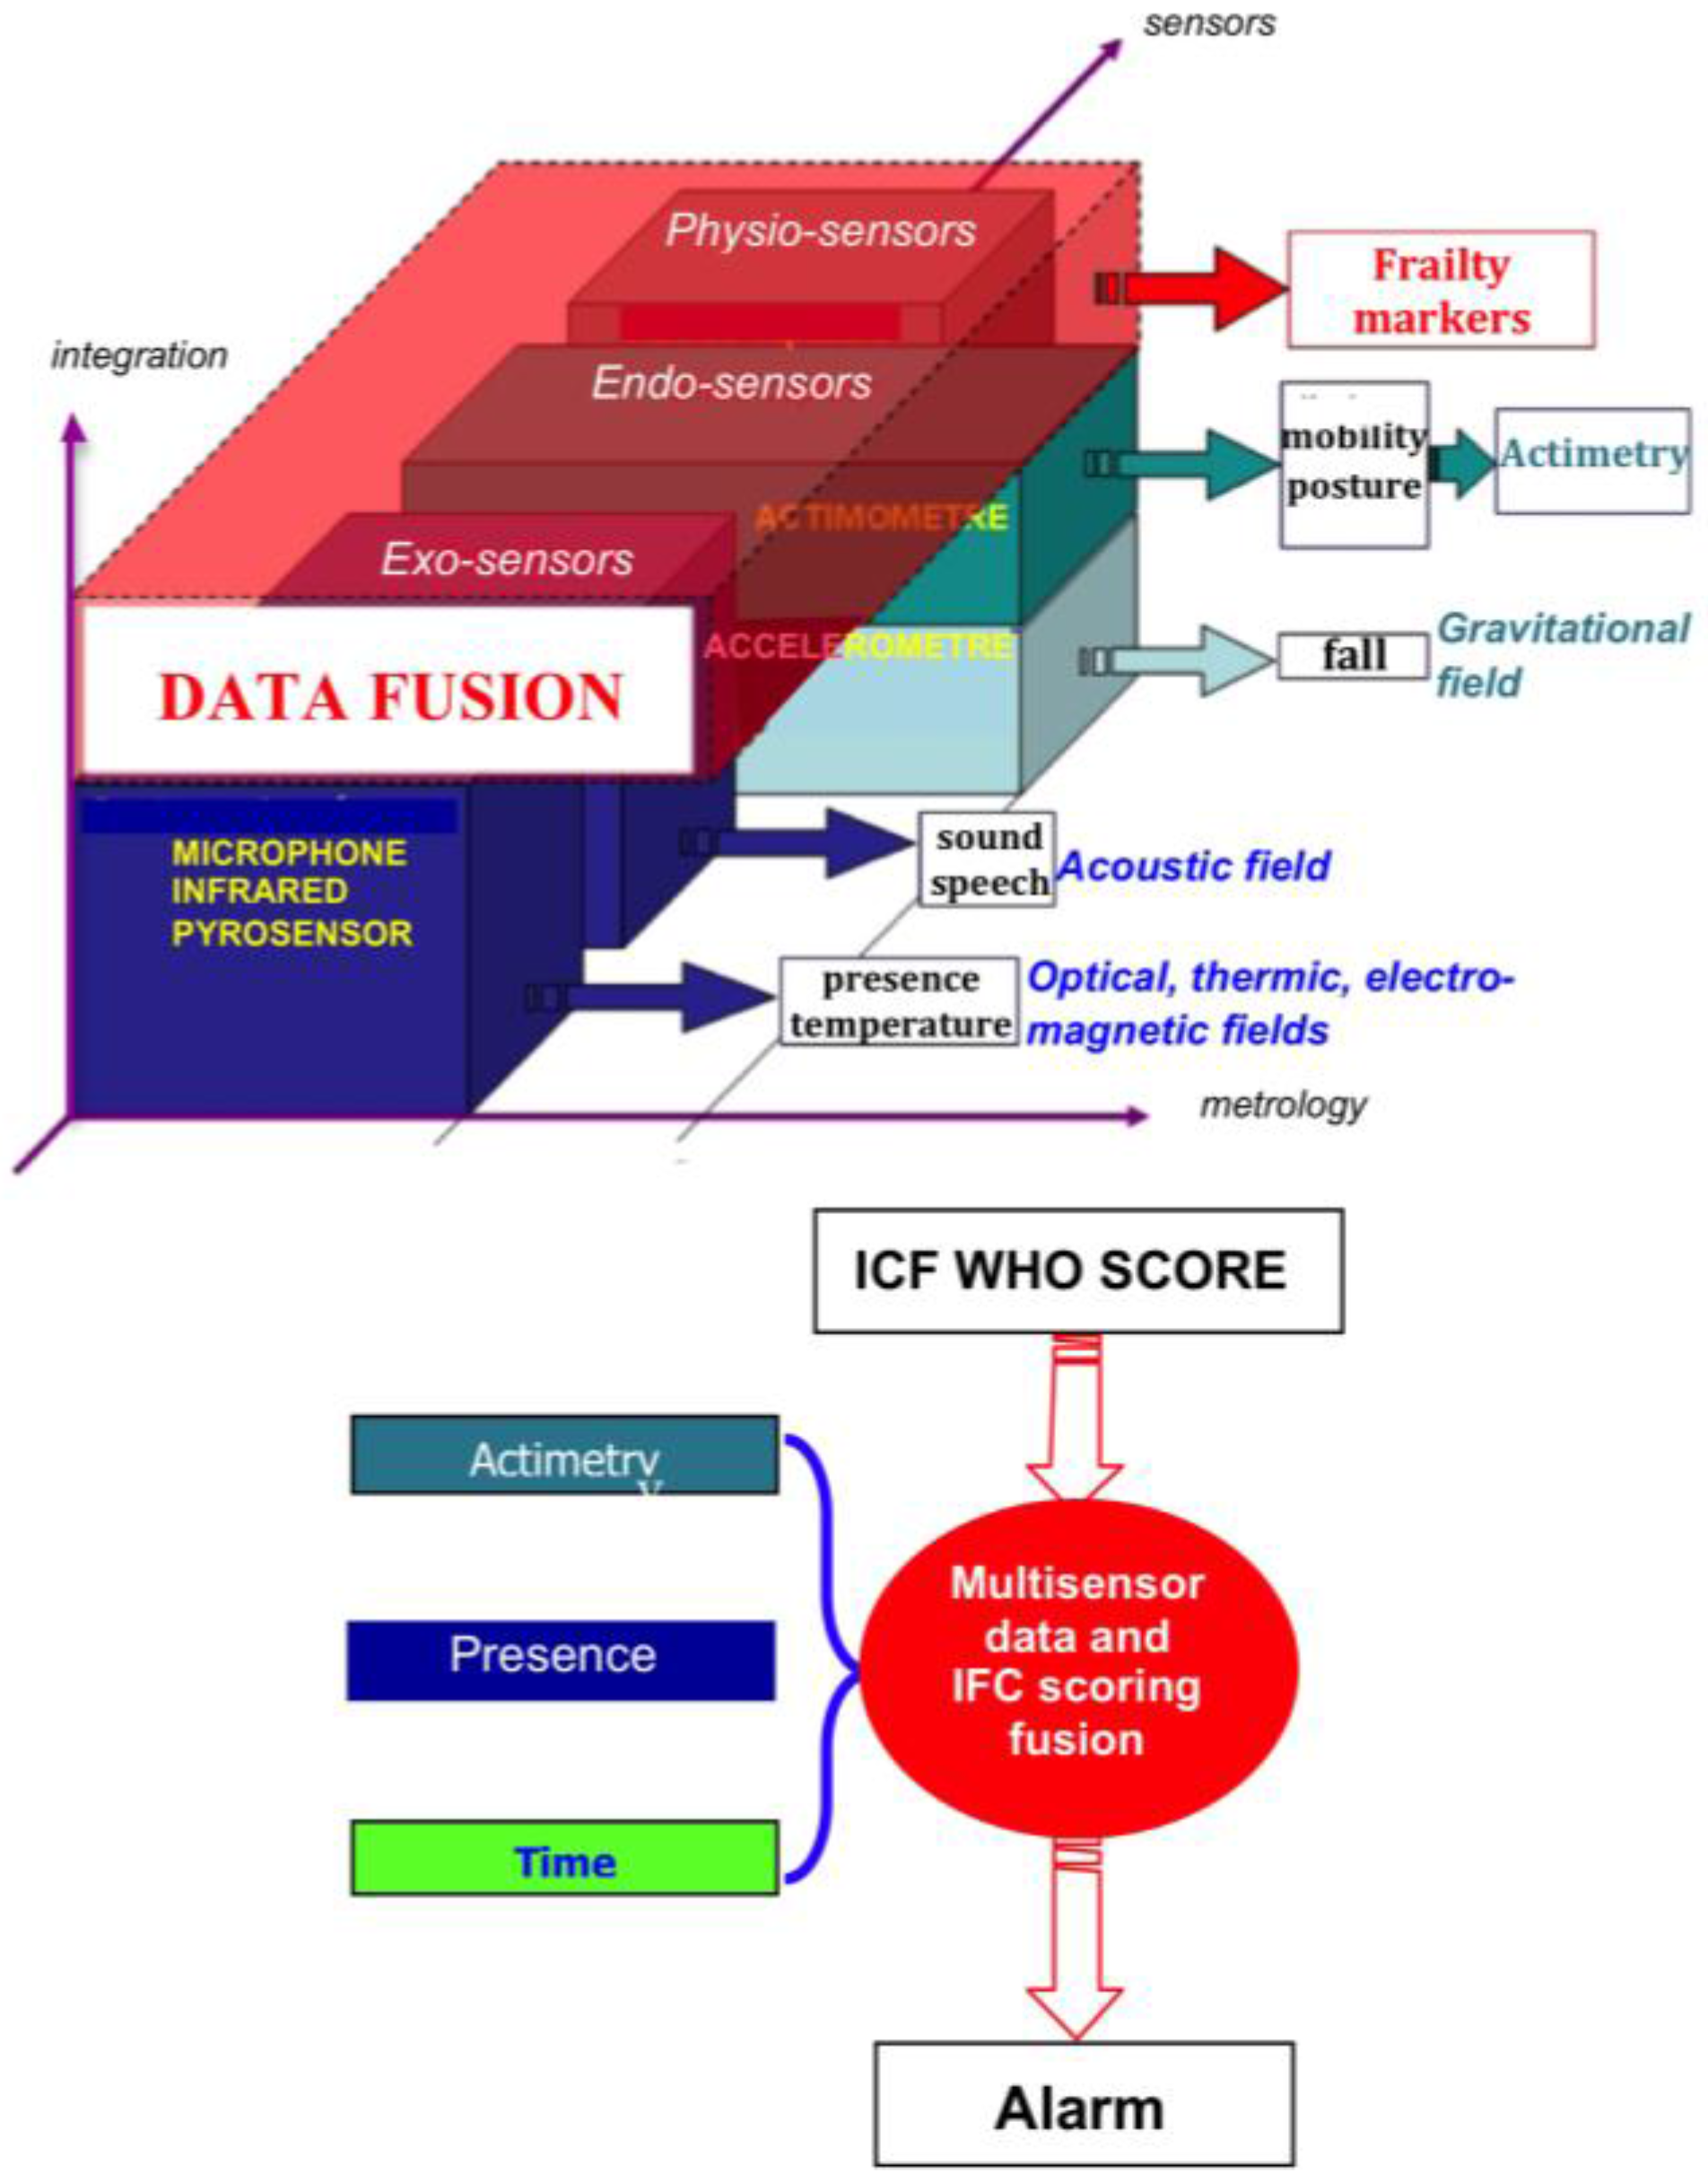
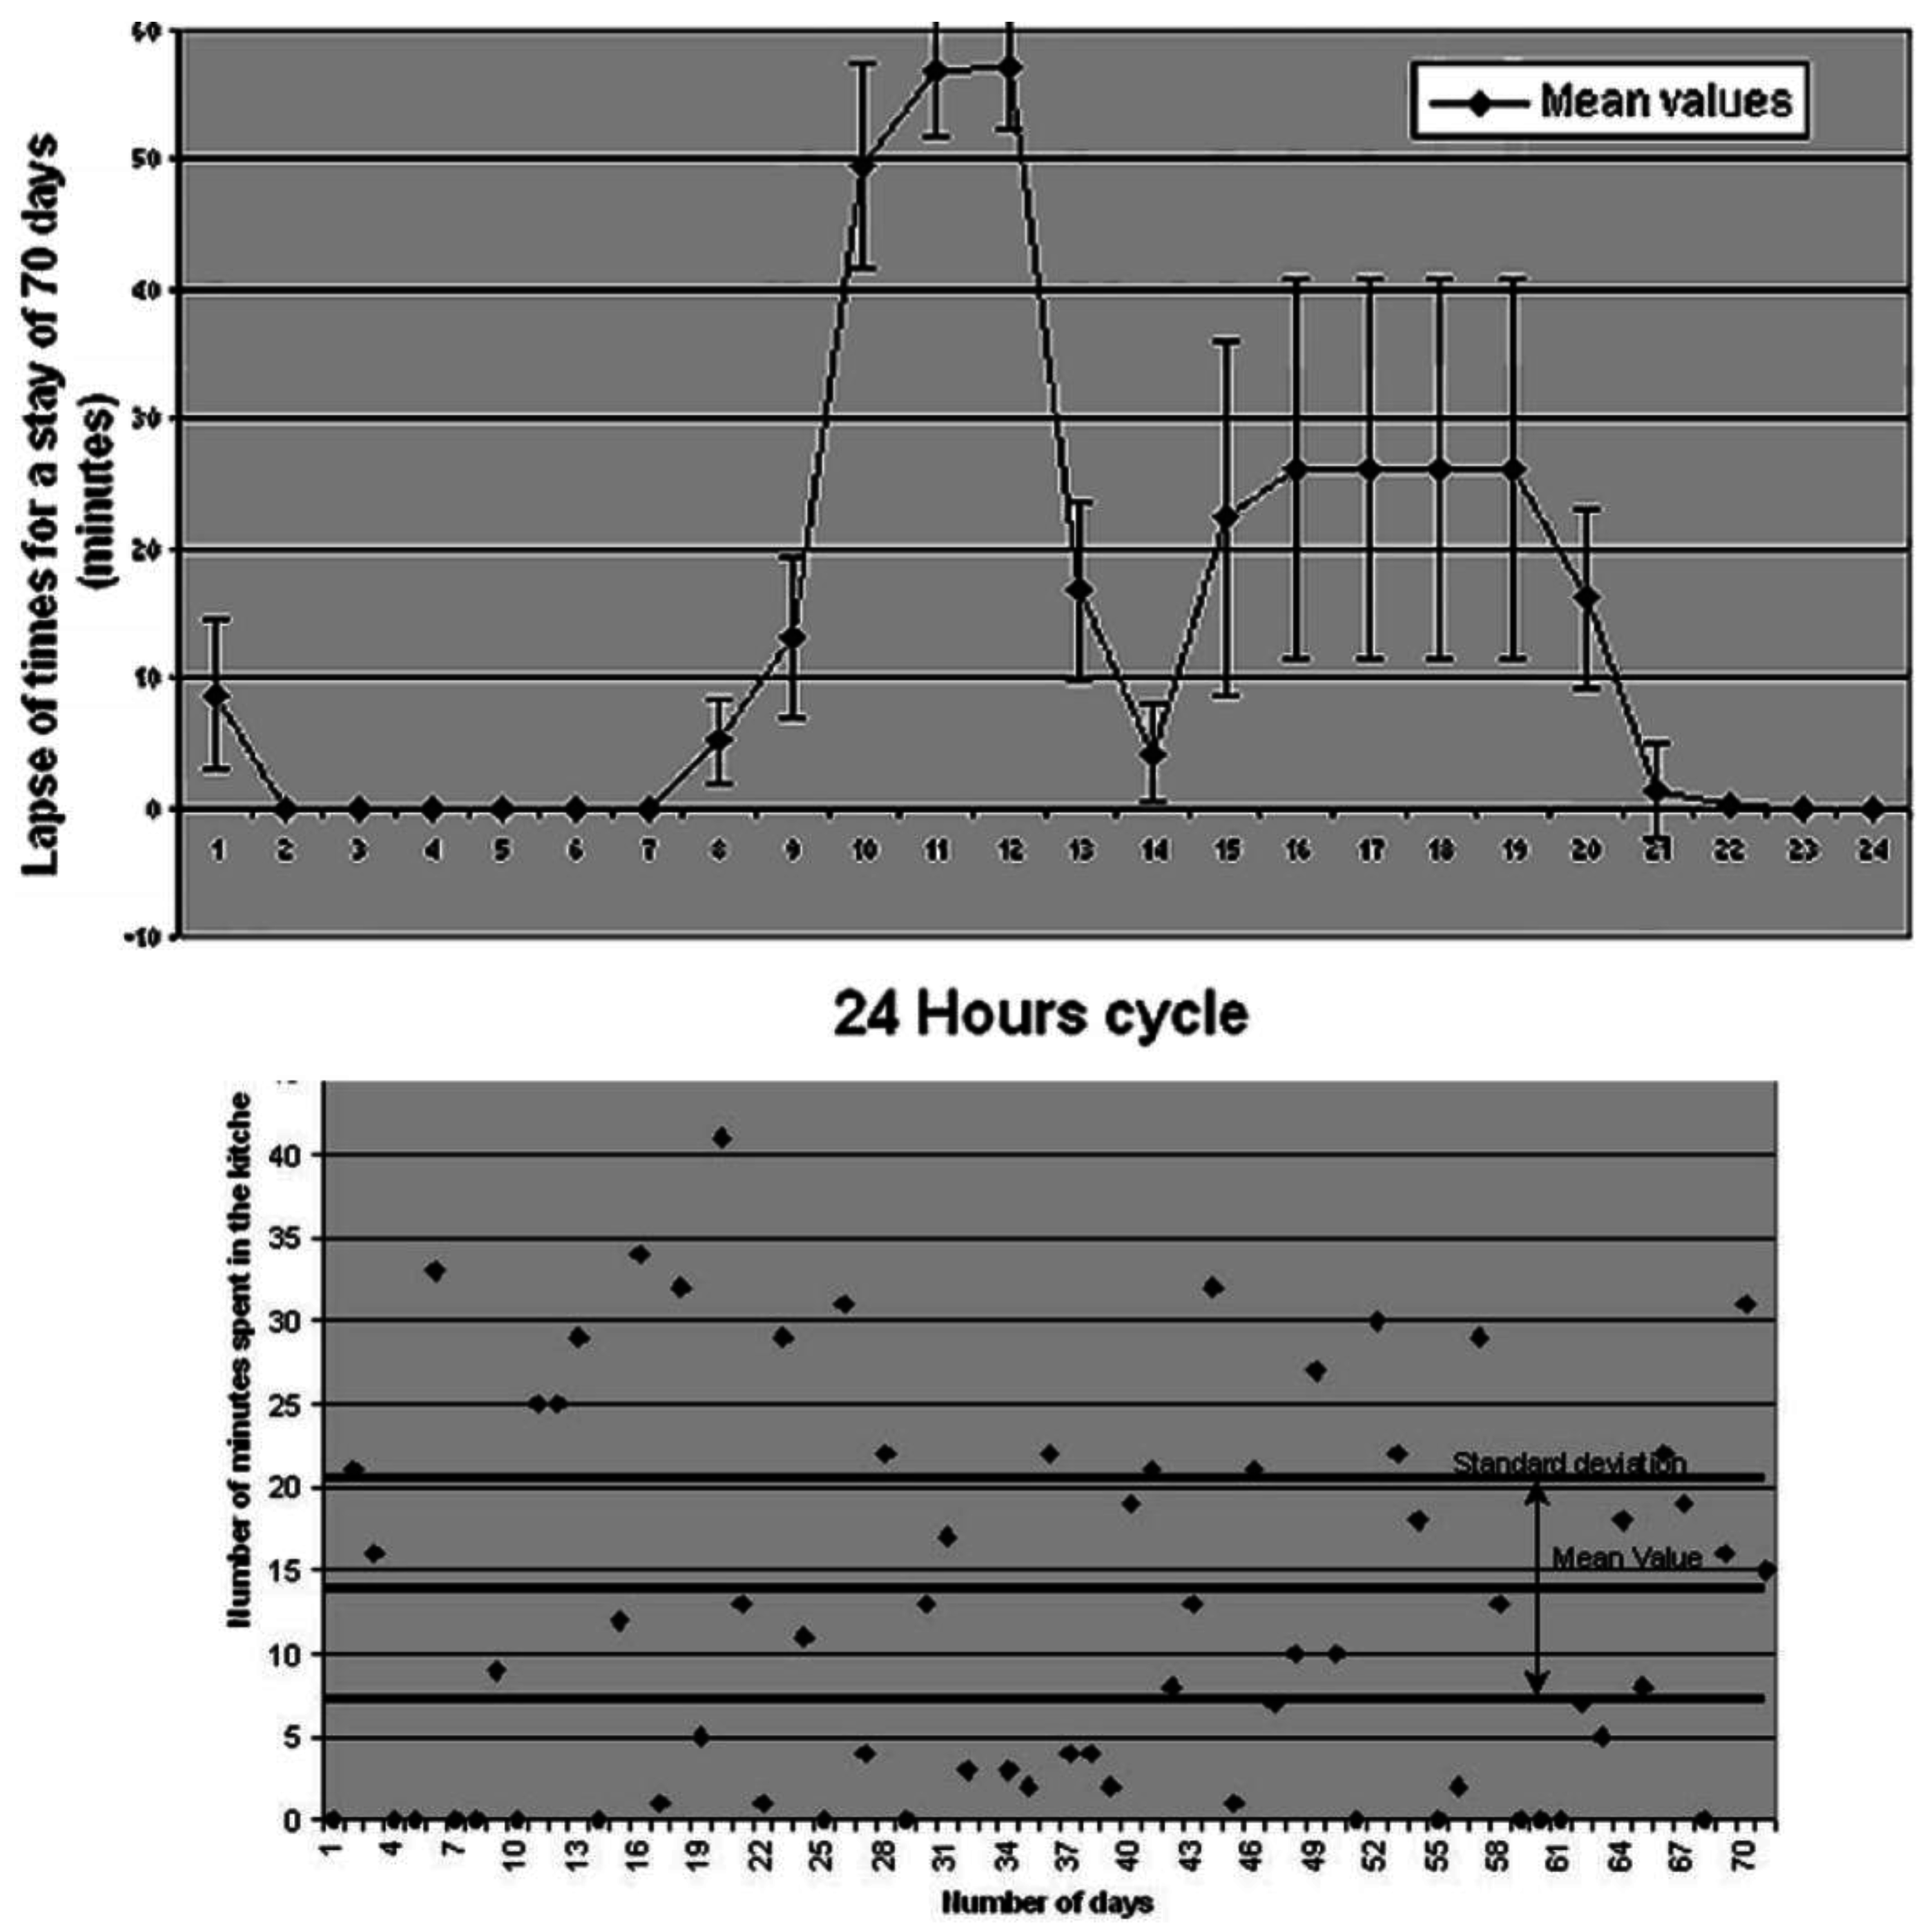
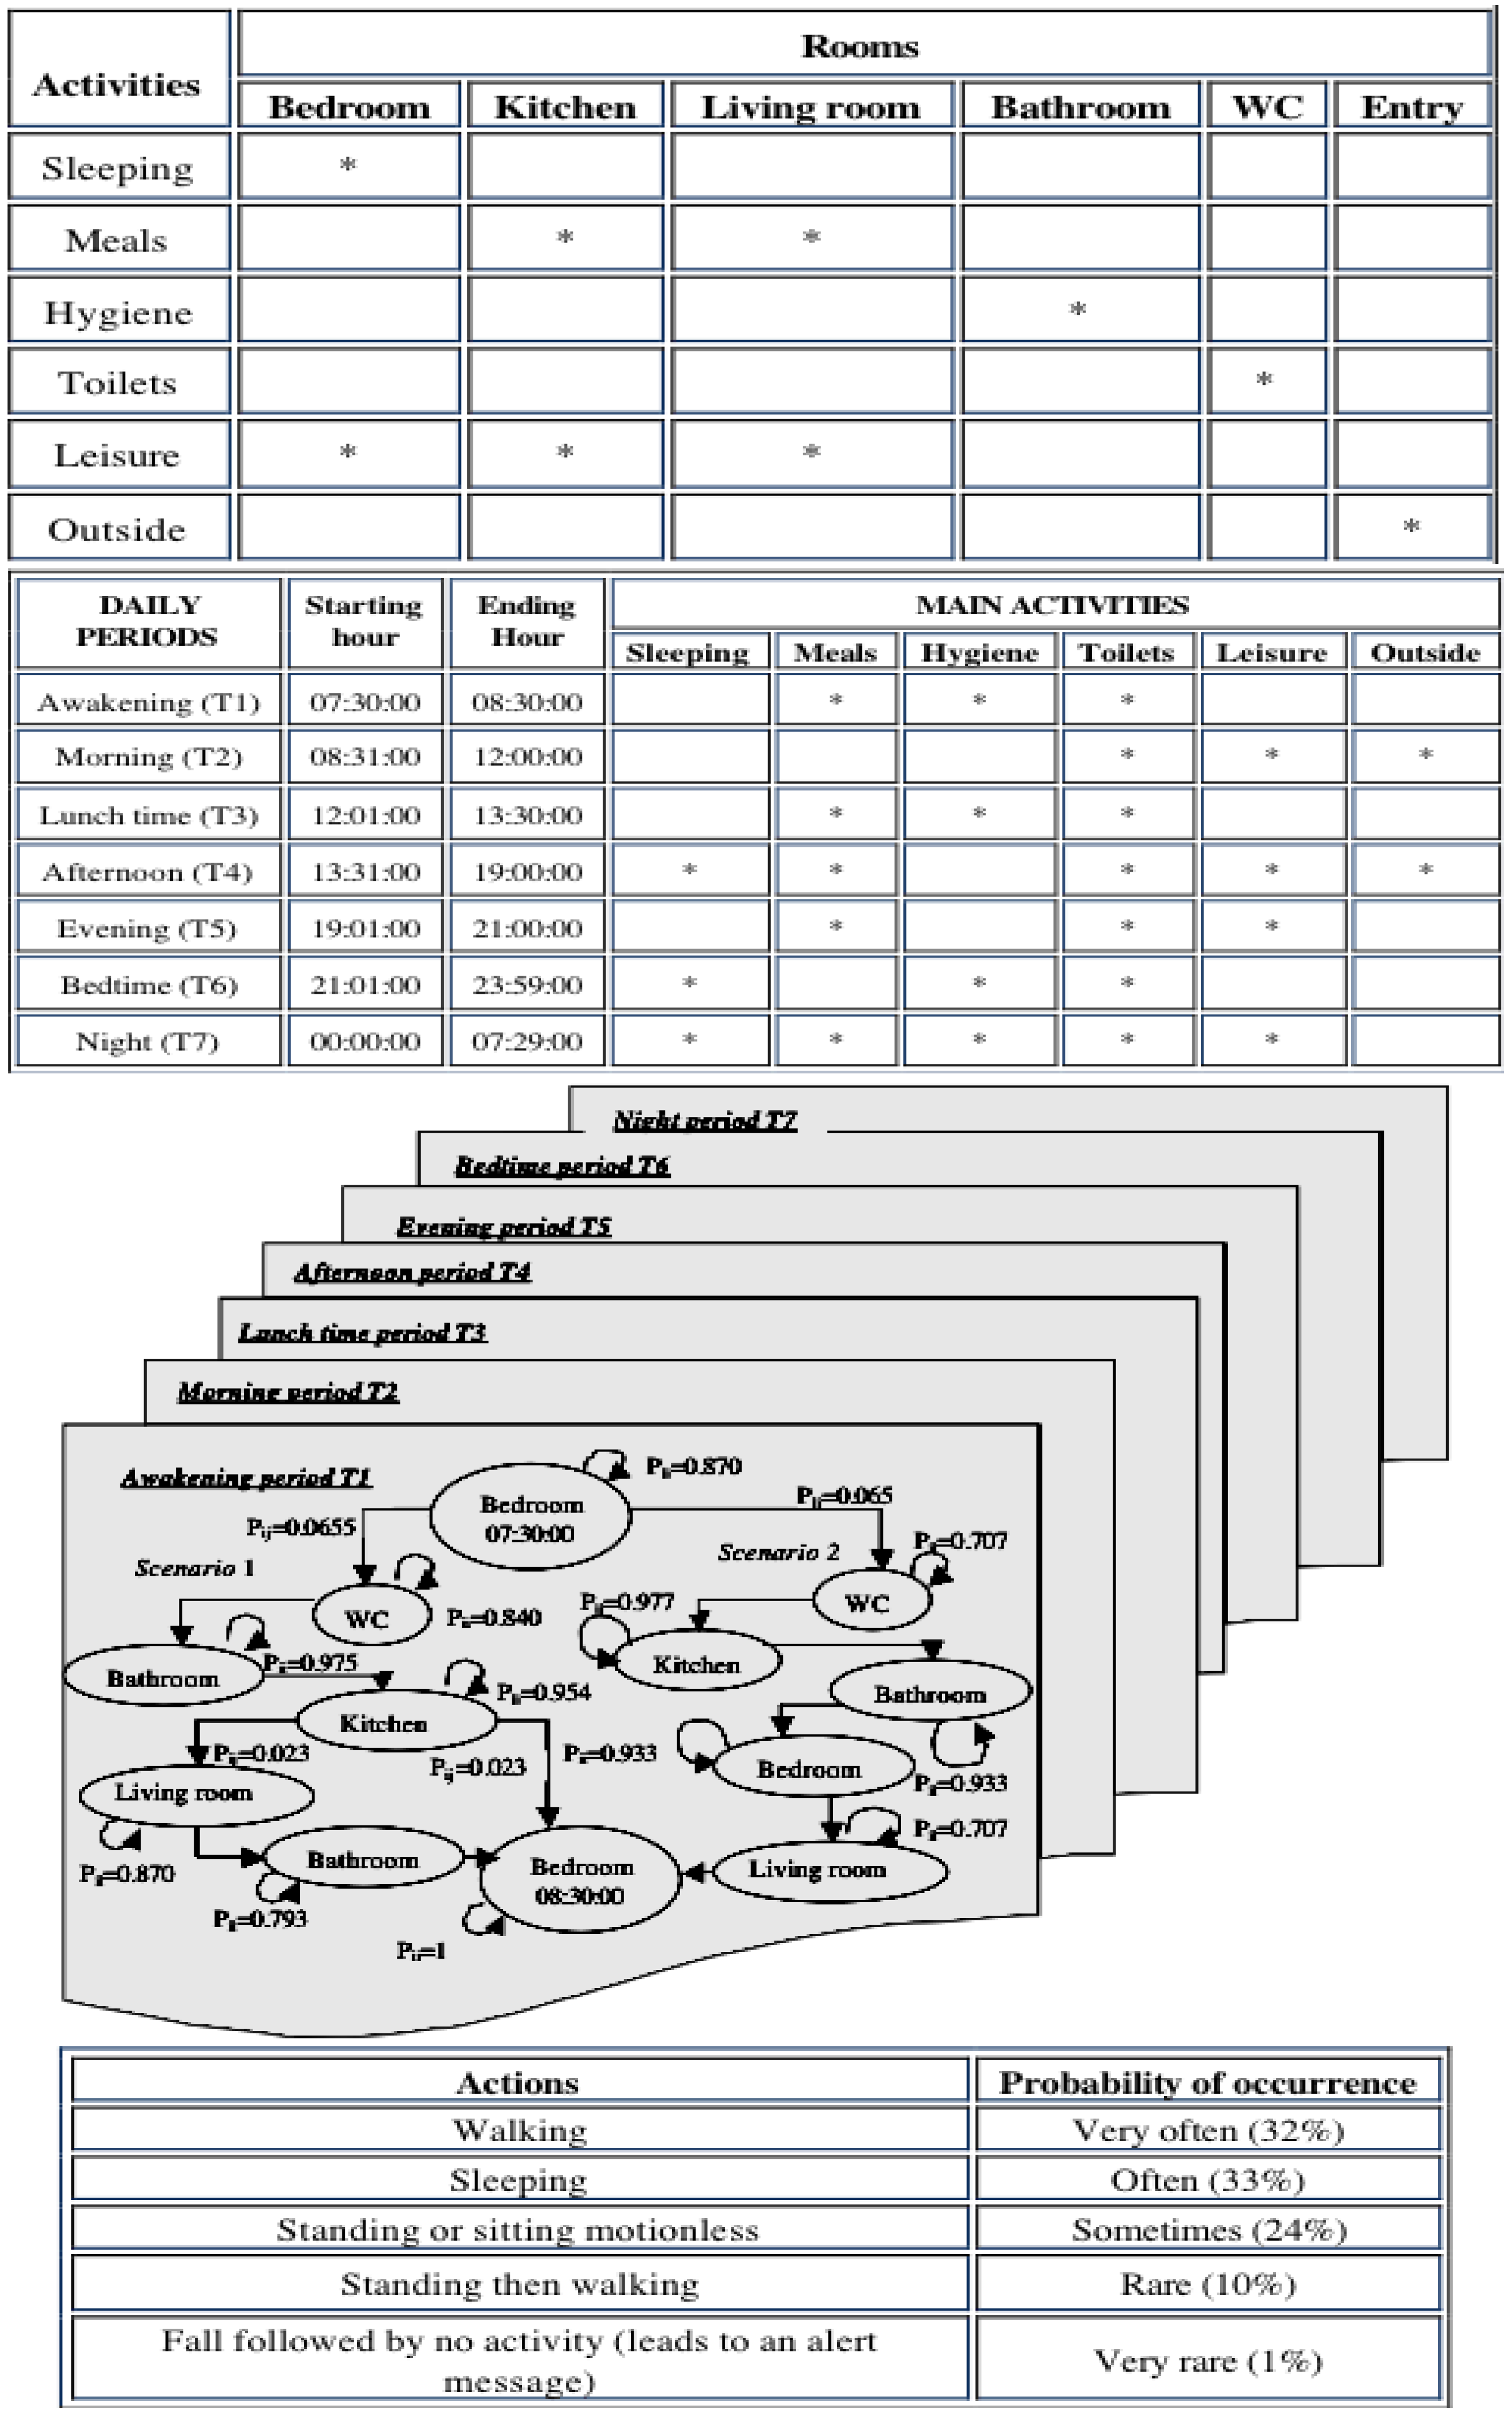
Other dedicated sensors regarding pyro-sensing (thermal change of order of 1 °C captured by a thermocouple within a detection zone of few meters), sound-capture (microphones recording pathological and abnormal sounds and silence at home) and odor sensing (with an electronic nose, such as Cyranose®, a device sensitive to urea levels in toilets). For type II diabetics, sensors allow one to follow two kinds of complications: (i) diabetic nephropathy, which can be evaluated by considering hydric balance estimated from the water amount drawn at the tap and recorded by dedicated water sensors or from a bottle or a water dispenser, where differential pressure is recorded below the bottles or glasses, as well as before and after intake, and from skin water exchanges calculated from body and room thermo-hydration-sensors and from the volume excreted in toilets (recorded by urea sensors and level sensors in the bowl); and (ii) diabetic foot estimated by the speed and ease with which the patient moves from one room (or task in same room) to another and the way this motion is progressively reduced. Pressure sensors [120] on the ground and infrared sensors on walls allow the calculation of actigrams (Figure 7).

3. Results

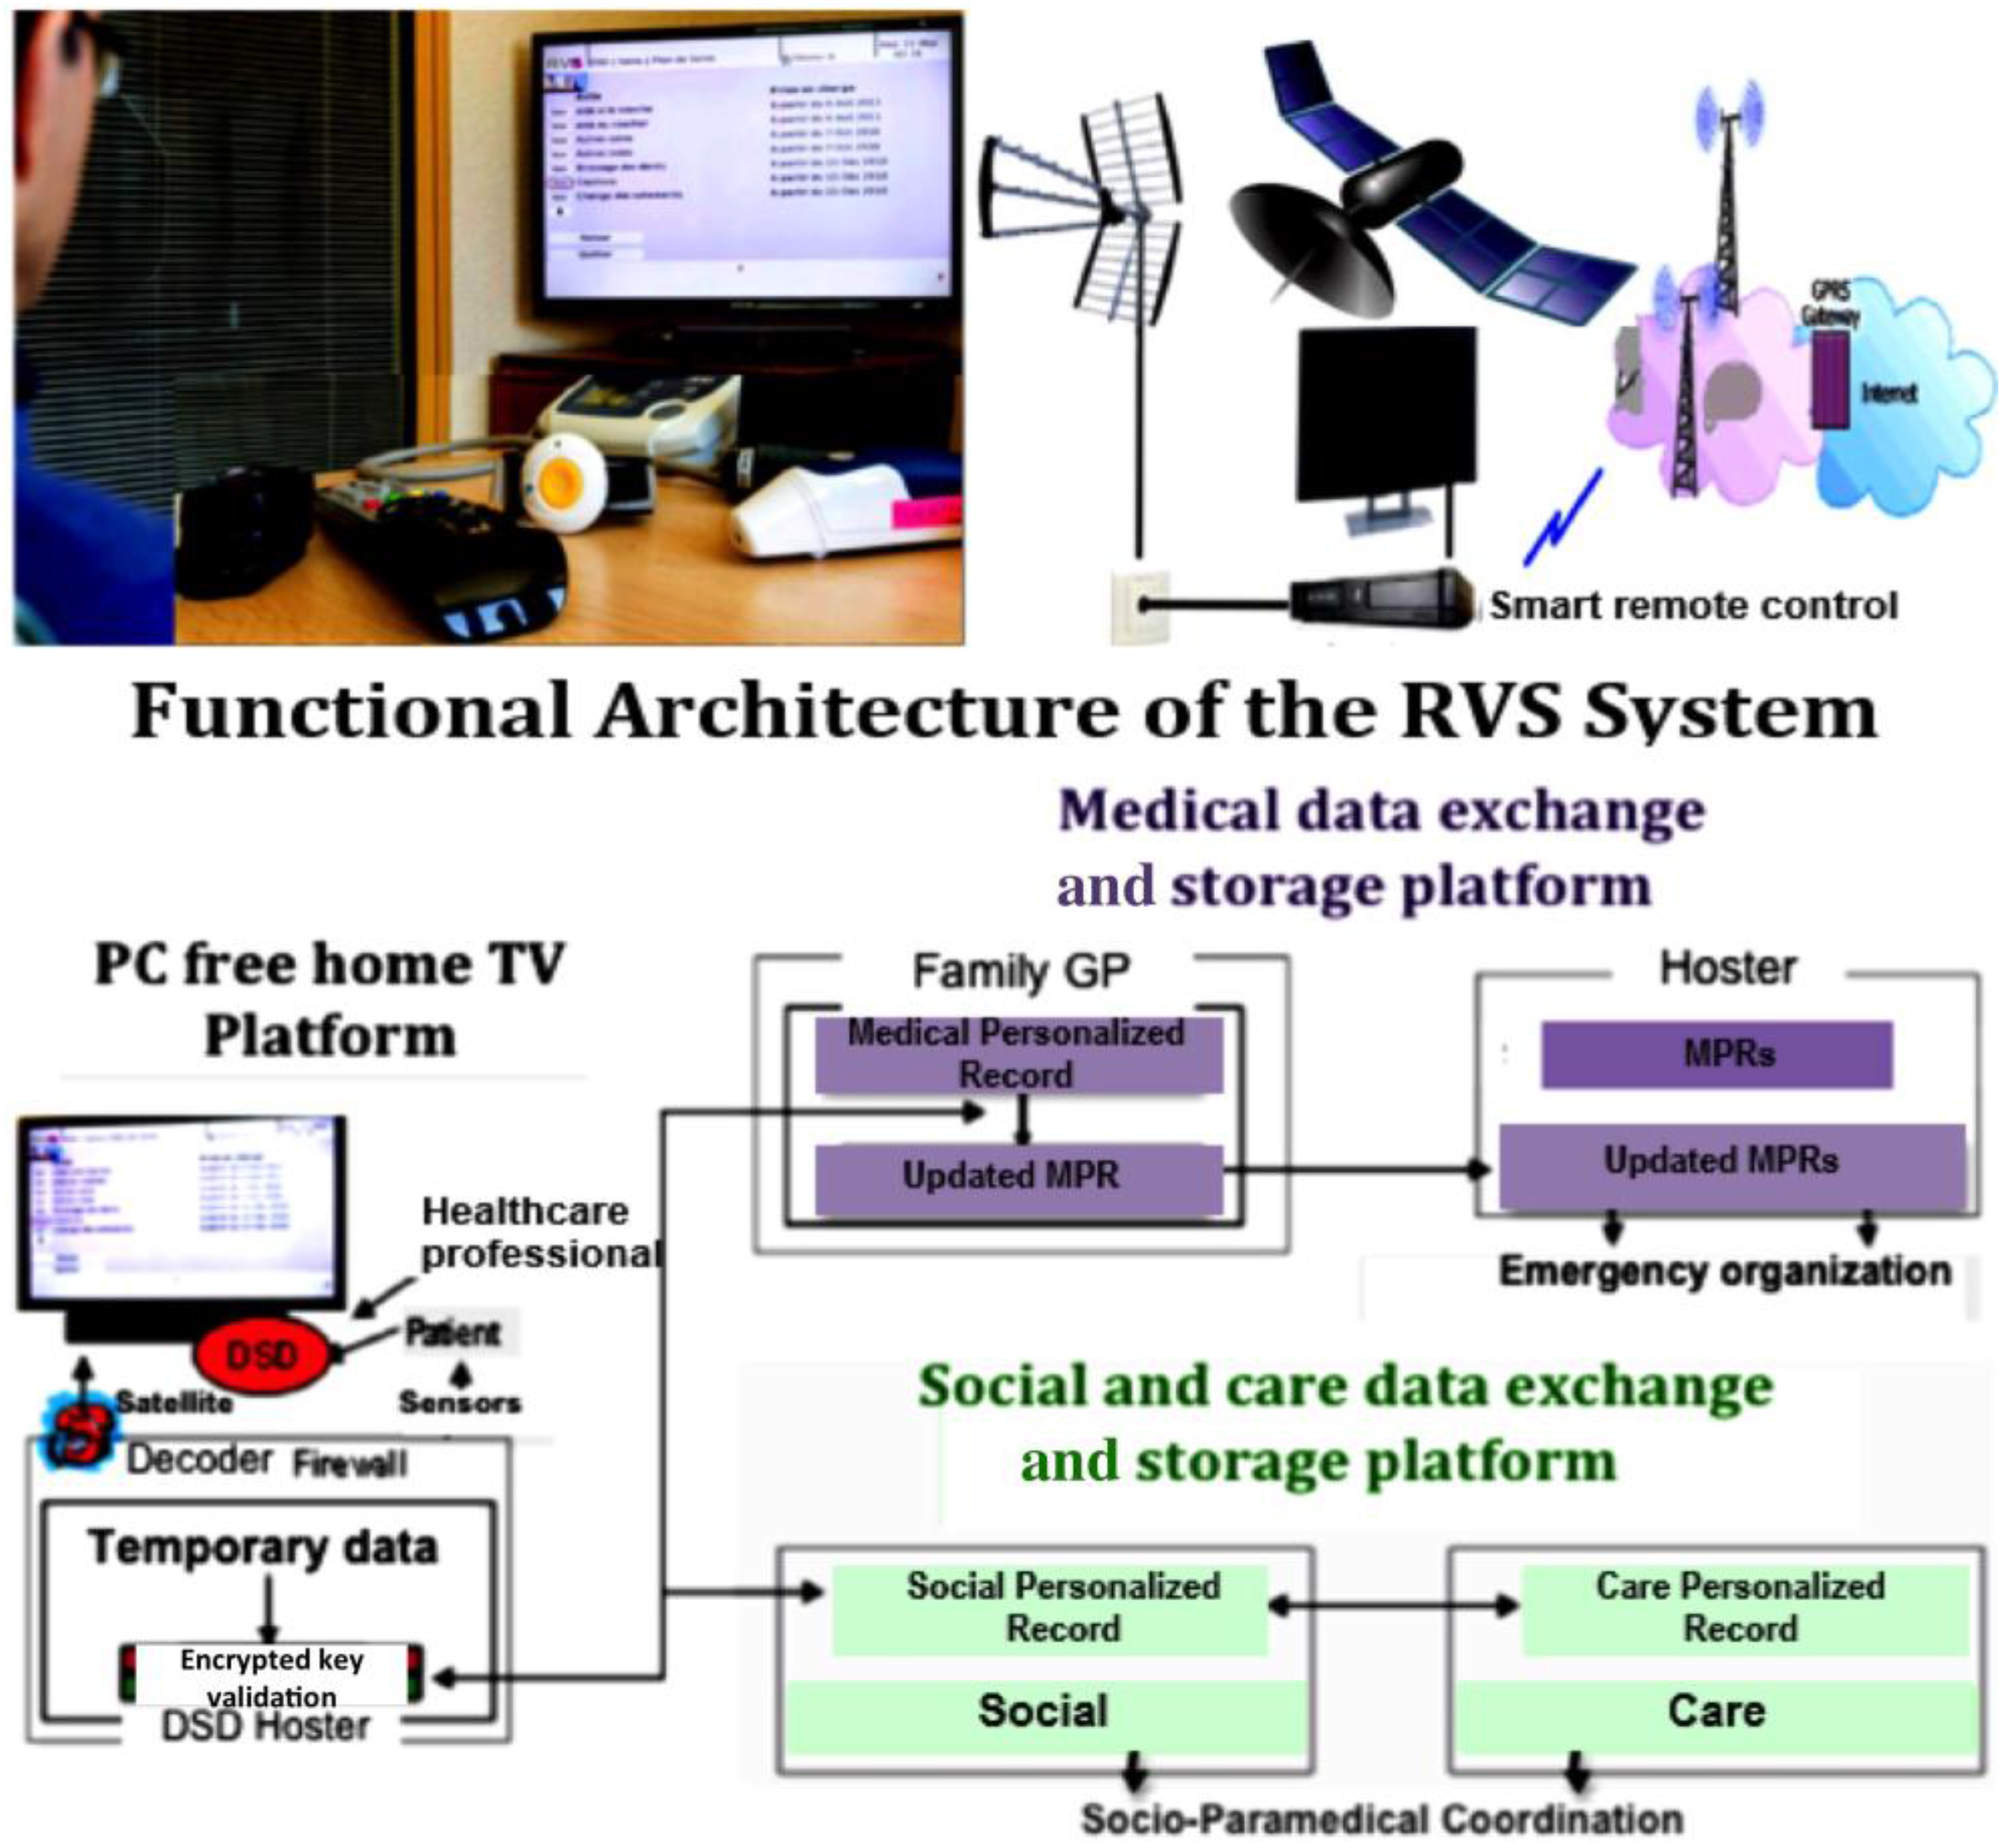
3.1. Medico-Social Information Processing for the Surveillance of Obese Elderly People in the Rural Vercors Mountains (RVS Experience)

Driving conditions can be hard during winter for the people of Vercors Mountains in the surroundings of Grenoble. The “Réseau Vercors Santé” project (RVS®) [121] aims to help the elderly to stay at home by maintaining their connection with social and medical care services (Figure 8). A TV screen that is present in most homes can be the right tool to maintain this social link. A TV-box decoder is used as the interface between home and care services data (Figure 9). Therefore, for the elder, the human decoder interface is a Remote Control with a Smart Keyboard (RCSK). Different kinds of functionalities are available on this TV/RCSK system:
  • Contact book: contacts are sorted in two lists, personal and professional,
  • Mailbox: this allows communicating with healthcare professionals of the RVS network by reading and writing some simple and pre-filled messages,
  • Medical diary: professionals fill this in,
  • Metrology: the patient or caregiver enters measurements, like pulse, blood pressure, glycemia, weight, etc.
On the remote side, professionals can be connected to RVS by a secured web site to complete patient records. Professionals from different areas can be connected with different access permissions depending on their profession. The RVS project began in June 2010: 44 homes have been outfitted with the RVS system, and 132 healthcare professionals including social professionals (80), paramedics (44) and GP’s (8) have been trained to use the system. The RVS project was completed in July 2013. The experience proved that a user-friendly system (PC free) for recording and displaying medico-social data at home was viable and regularly used by both 72% of connected end-users (dependent patients at home), but by only 55% of the local socio-medical professionals (GP’s, paramedics, social workers, etc.). The next step would be a large-scale generalization of this experience, particularly in senior residences, where a trans-generational facility could be added. Indeed, it has been proven through experiences at the Griffin House in London [122] and in CROUS in Lyons (Centre Régional des Œuvres Universitaires et Scolaires in charge of housing and catering French students) [123] that the mutual benefit of the cohabitation of people of different generations was very positive, the older generation providing its experience and reassurance to the younger generation, which, for example, can interpret the sub-clinic symptoms delivered by an elderly person, showing the start of a metabolic disorder, e.g., due to a complication of his or her obesity.

3.2. Preventive and Therapeutic Education of the Obese Patient

The relative failure of the RVS project (only half of the socio-medics are involved in the generalization phase) and the success of the intergenerational projects pushed us to invest in the personalized VPTE (Virtual Preventive and Therapeutic Education) in order to perform the challenge empowerment/engagement/involvement of the participants in a new e-health project, the French project VHP® (VisioHome Presence Inter@active) [124], launched in 2013 for the preventive and therapeutic coaching of the diabetic patient at home. VHP aims to improve diabetic patient care minimizing daily life disruption, whether in nursing residences or at home and thus assuring quality of life and delaying the evolution of the disease in anticipation of complications, such as diabetic retinitis, nephropathy and foot pressure ulcers. The project VHP is supported by the French Ministry of Research in the “Investments for the Future” framework and carried out by a group of companies with Spie Communications, Comearth, Enoving, Inovelan and an R&D group led by the CNRS (Centre National de la Recherche Scientifique). The service provided by the VHP platform addresses each category of type II diabetes and is designed to meet medical and pedagogical requirements: coaching services on diet, hygiene, adapted physical activity and disease awareness, recording at home metabolic and actometric data and using wireless remote communication devices customized for diabetes (balance, glucometer, sphygmomanometer, infrared sensors, magnetic contact switches for doors, etc.), restitution of information for healthcare participants (patient, family helpers, caregivers, doctors, coaches, paramedics, etc.) and aid for therapy adherence, compliance and observance.

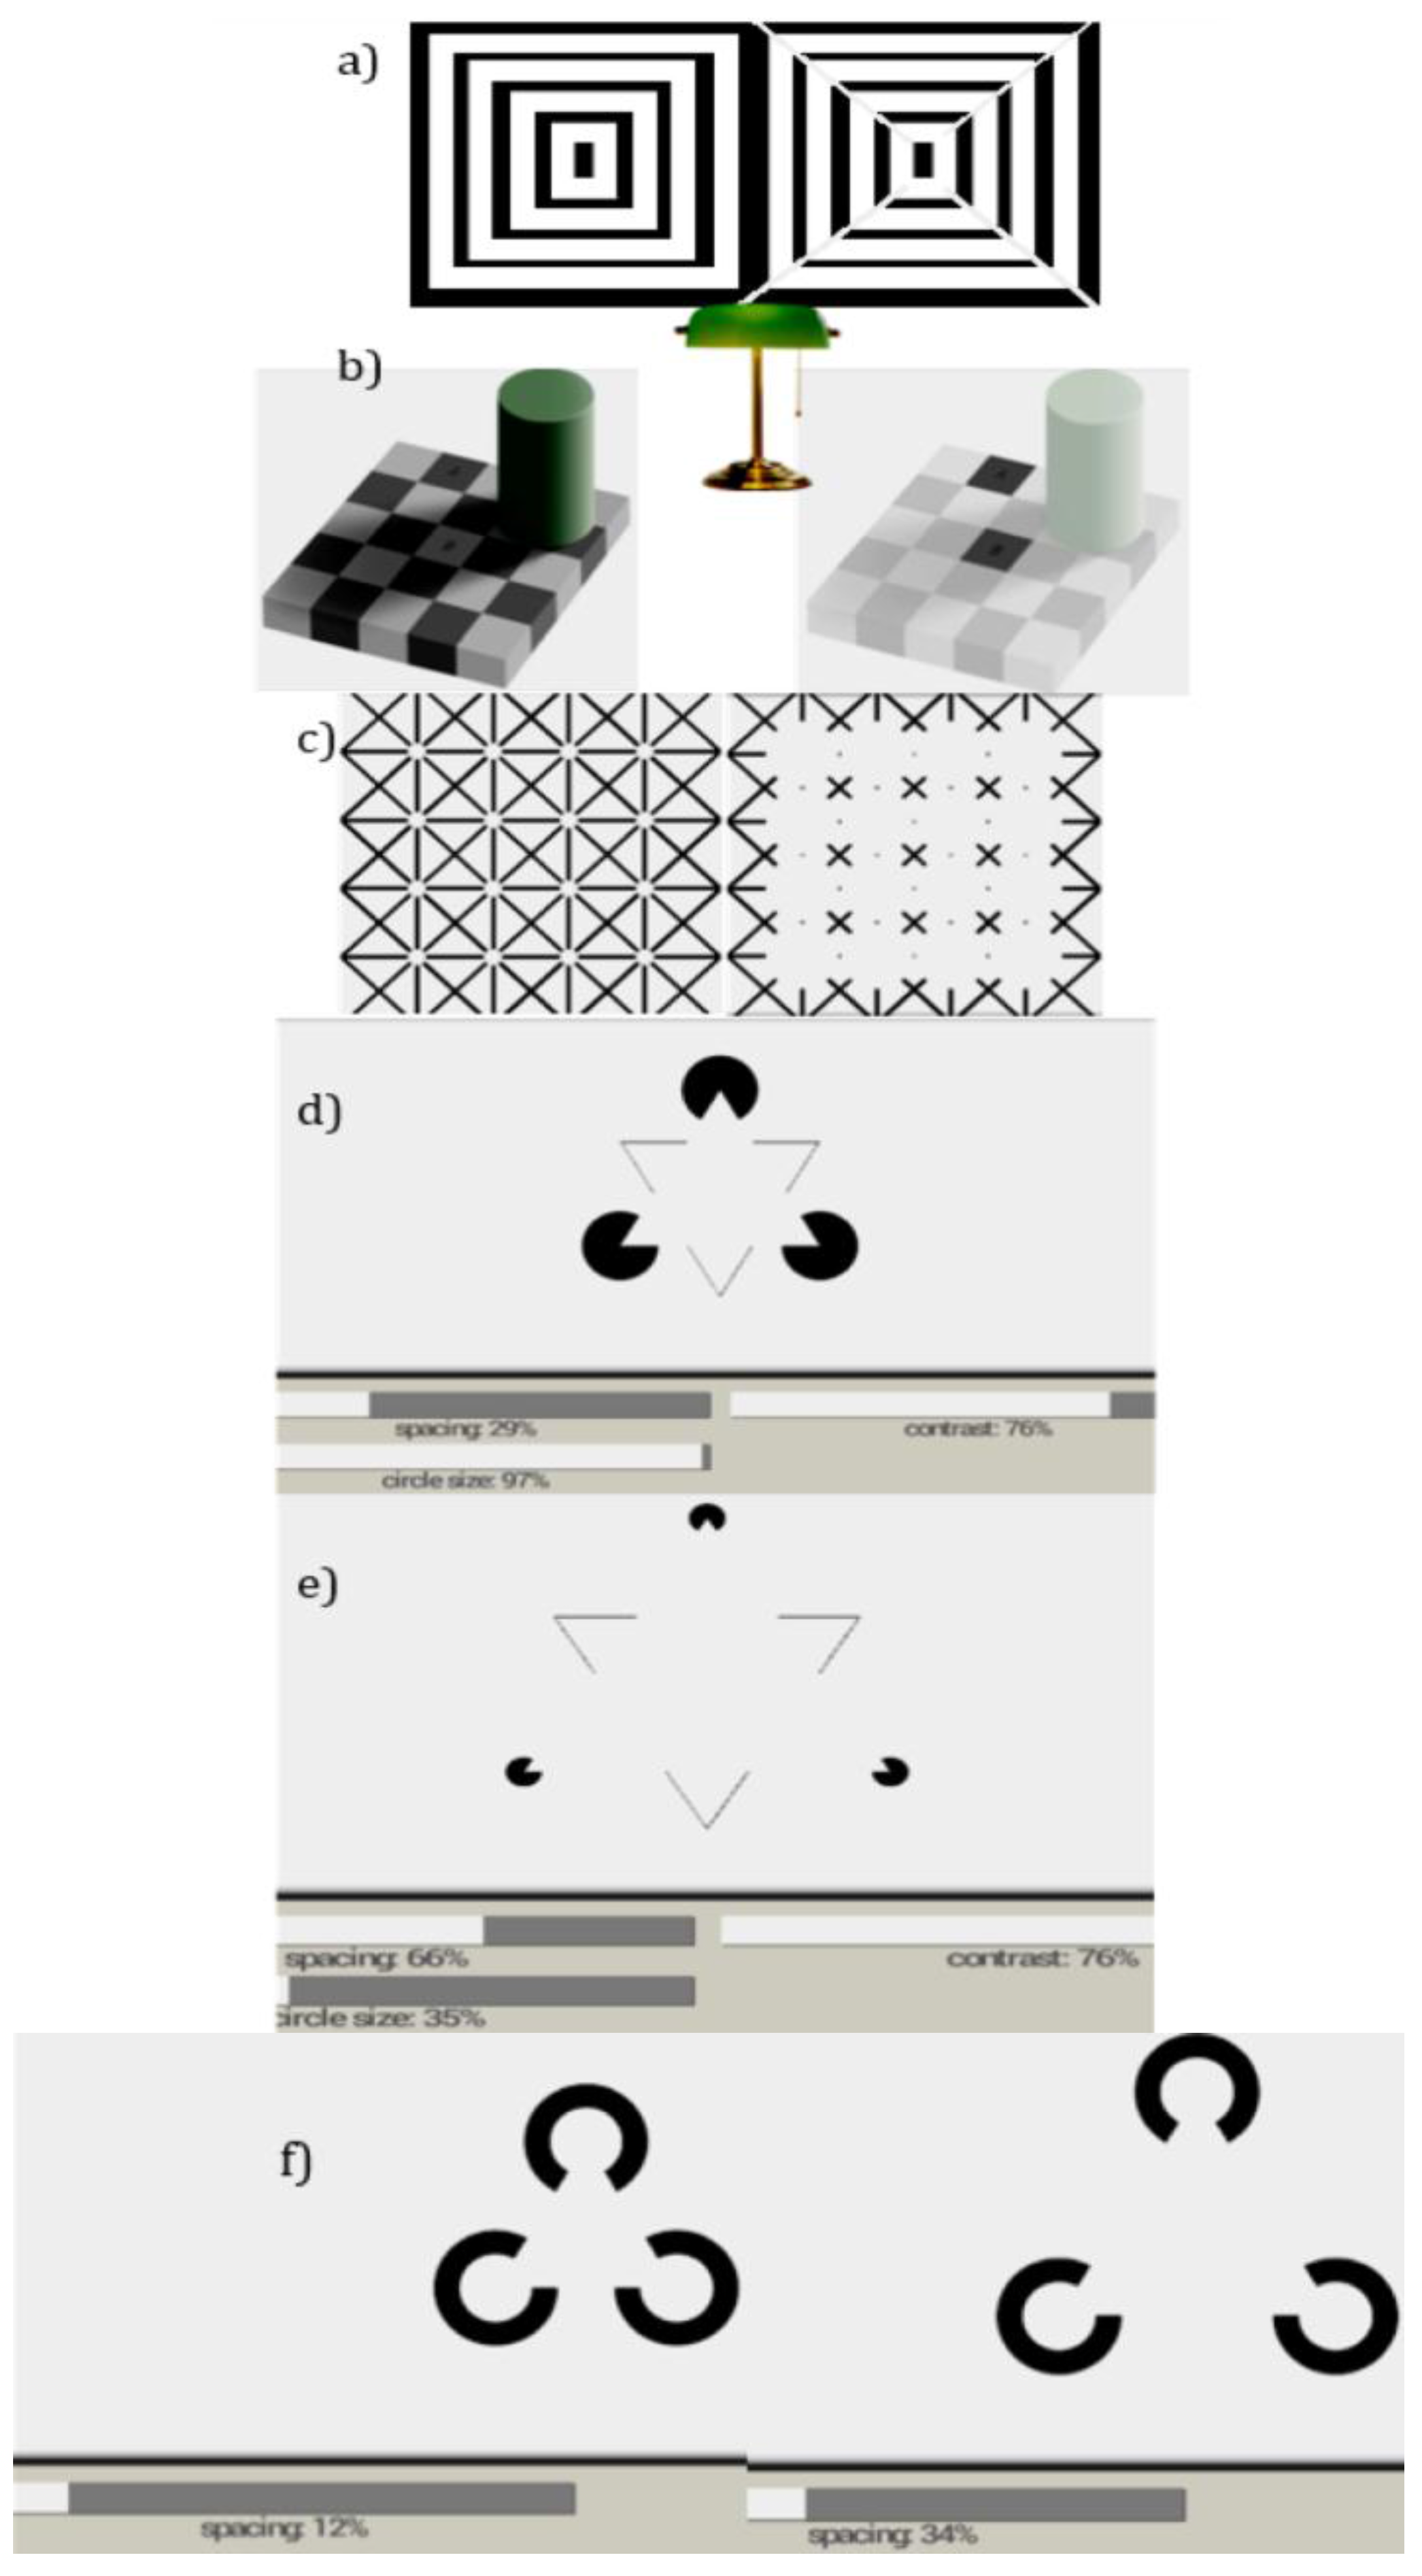
3.3. Example of Vision and Diabetic Retinitis

The perception of illusions like the Kanizsa pyramids, triangles or circles is provoked by the local organization of inhibition and activation between retinal cells, which disappears in diabetic retinitis. In Figure 10, top left, tangential vision gives the illusion of a pyramid coming toward the observer, and on the contrary, Figure 10, top right, shows that the pyramid seems to escape the observer. The illusion is due to the artifactual prolongation of the square extremities as white (respectively black) lines in a black (respectively white) dominated neighborhood. The illusions are easy to simulate by computer, and the threshold value of critical variables at which they are perceived serves as a criterion for alerting the patient years before the apparition of acuity problems, then for testing the effectiveness of the therapy (Figure 10, bottom).

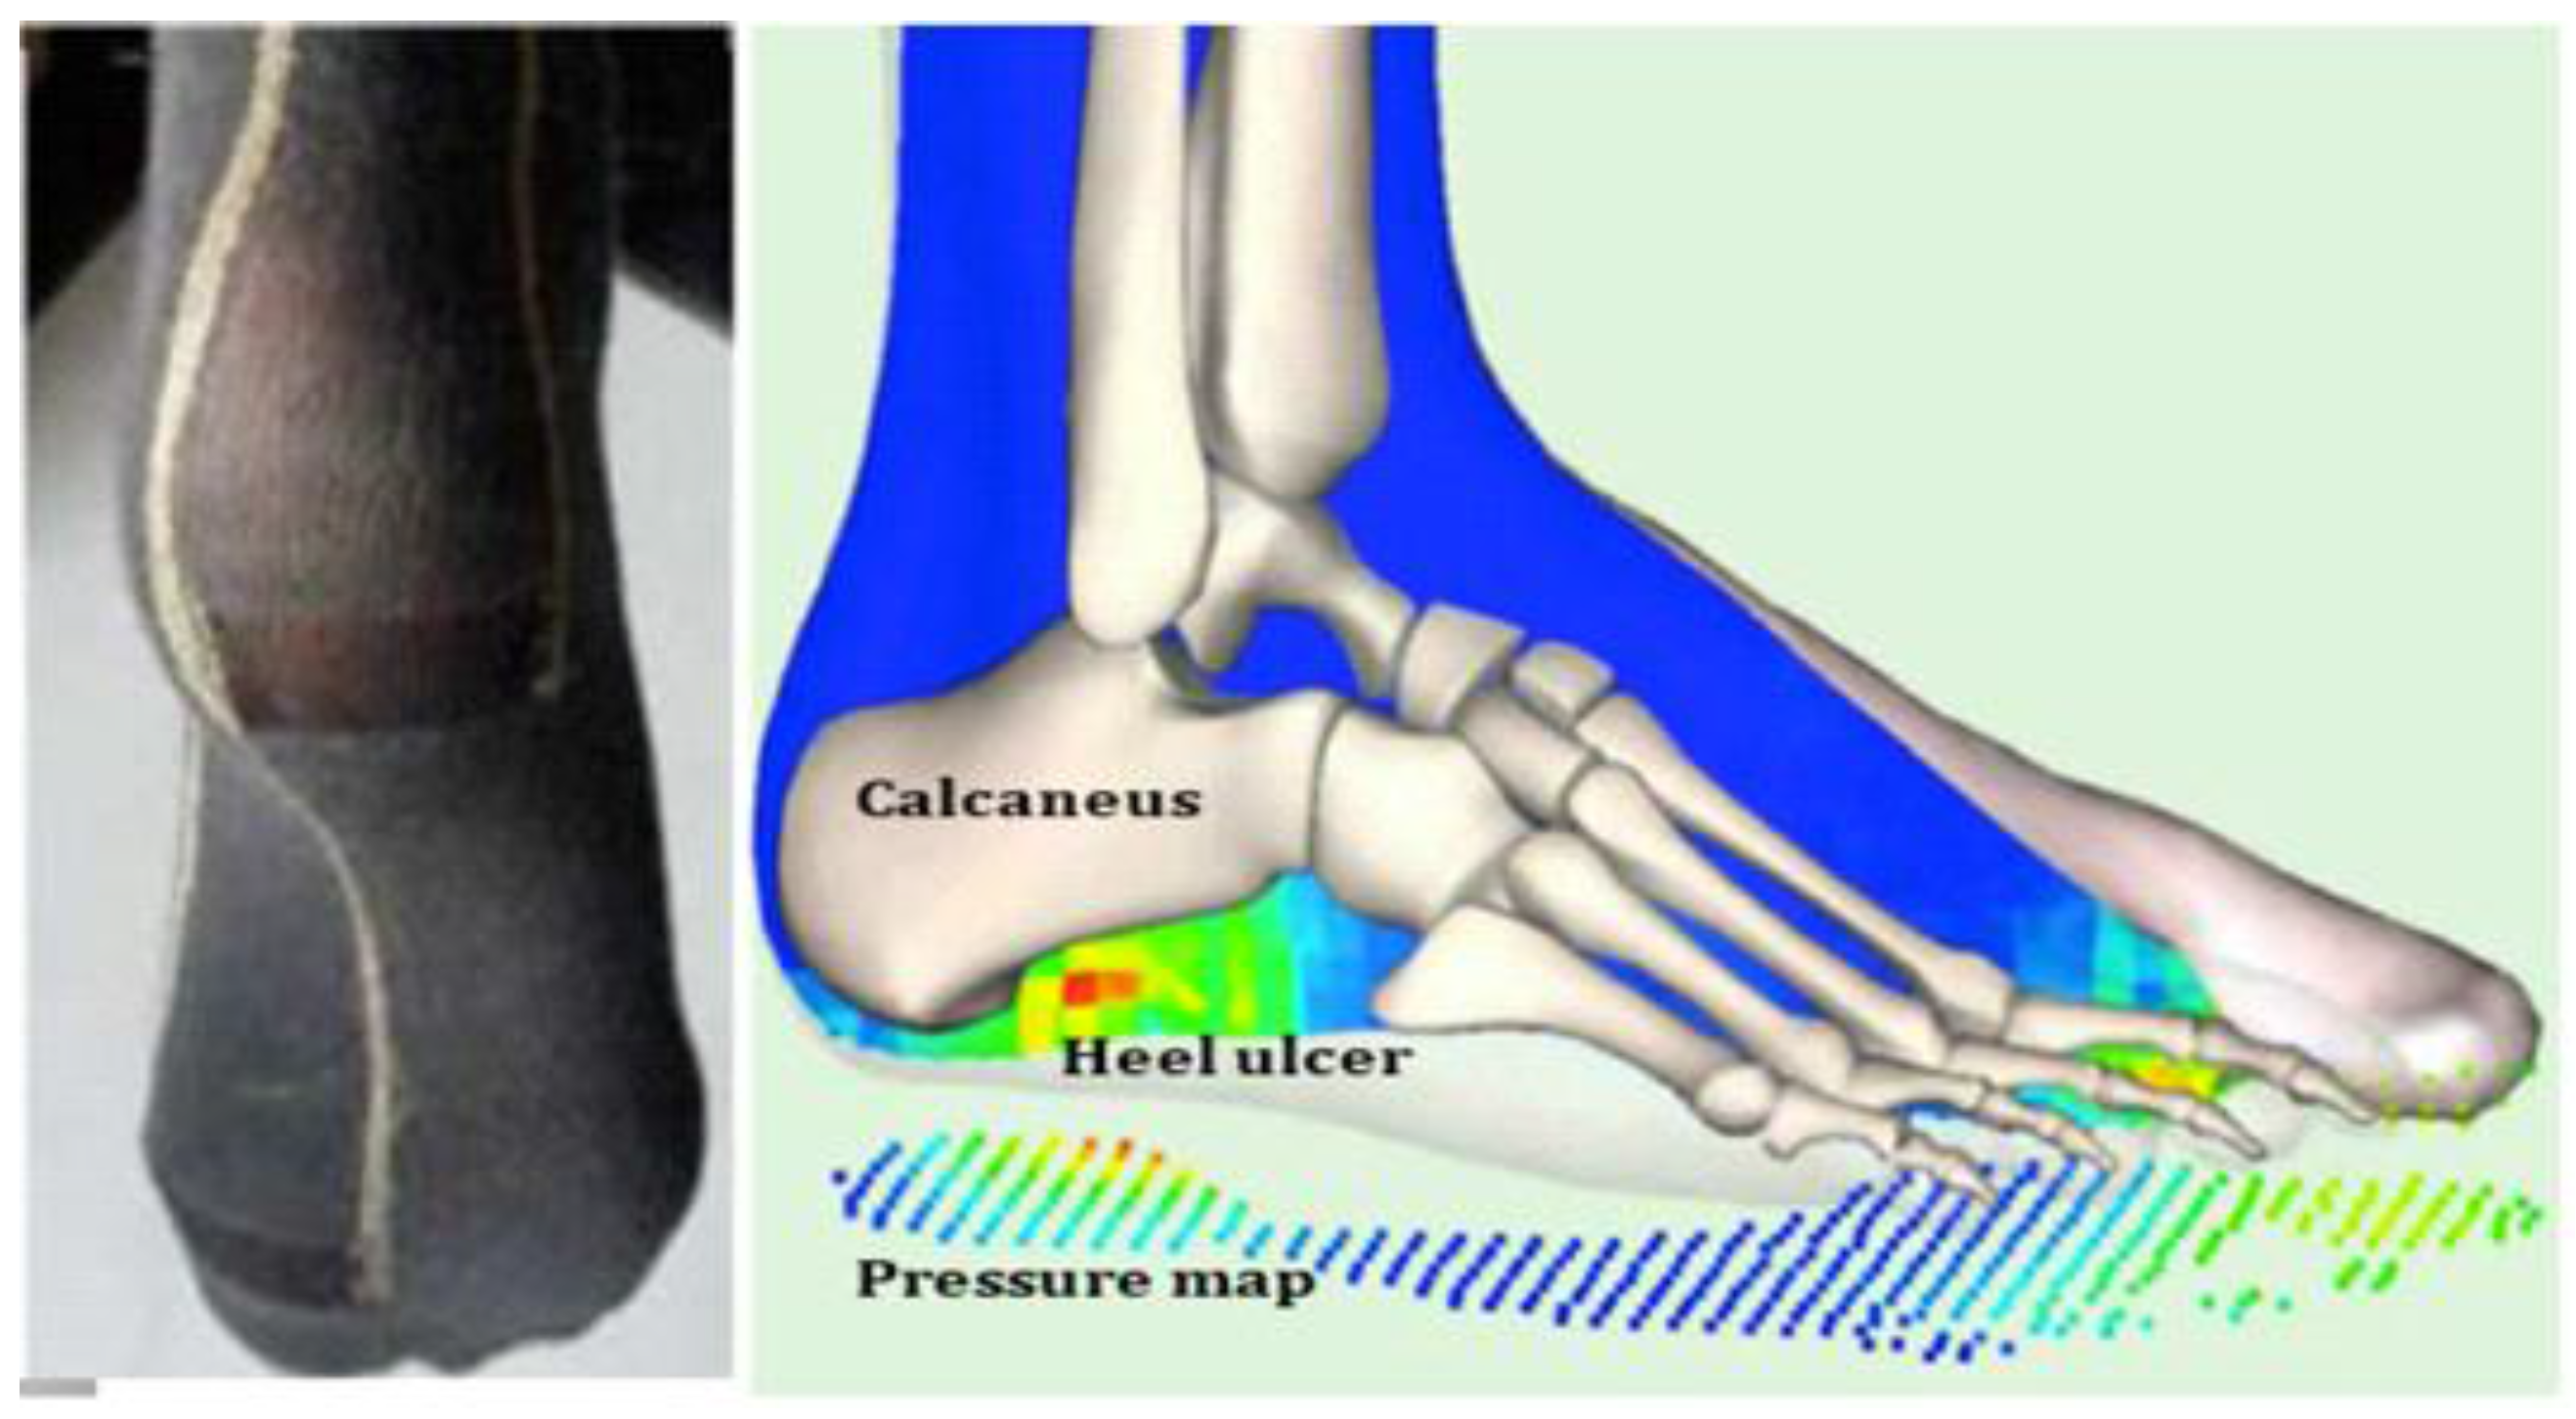
3.4. Example of Locomotion and Diabetic Foot

The feedback information of the serious game devoted to locomotion is provided by a smart sock made of a textile from Texisense that is sensitive to pressure on the foot and able to record pathologic analgesic postures on the sole of the foot as a result of attempting to avoid walking on diabetic foot sores. The patient is asked to walk and run wearing the smart socks and the successive positions on the sole are recorded (Figure 11). An extension of the game will compare improper positions of the foot with the bone defects coming from a pathologic trabecular reconstruction due to bad foot pressures on the ground, thanks to U.S. or X-ray 3D osteo-densitometry of the foot bones, like the calcaneus.

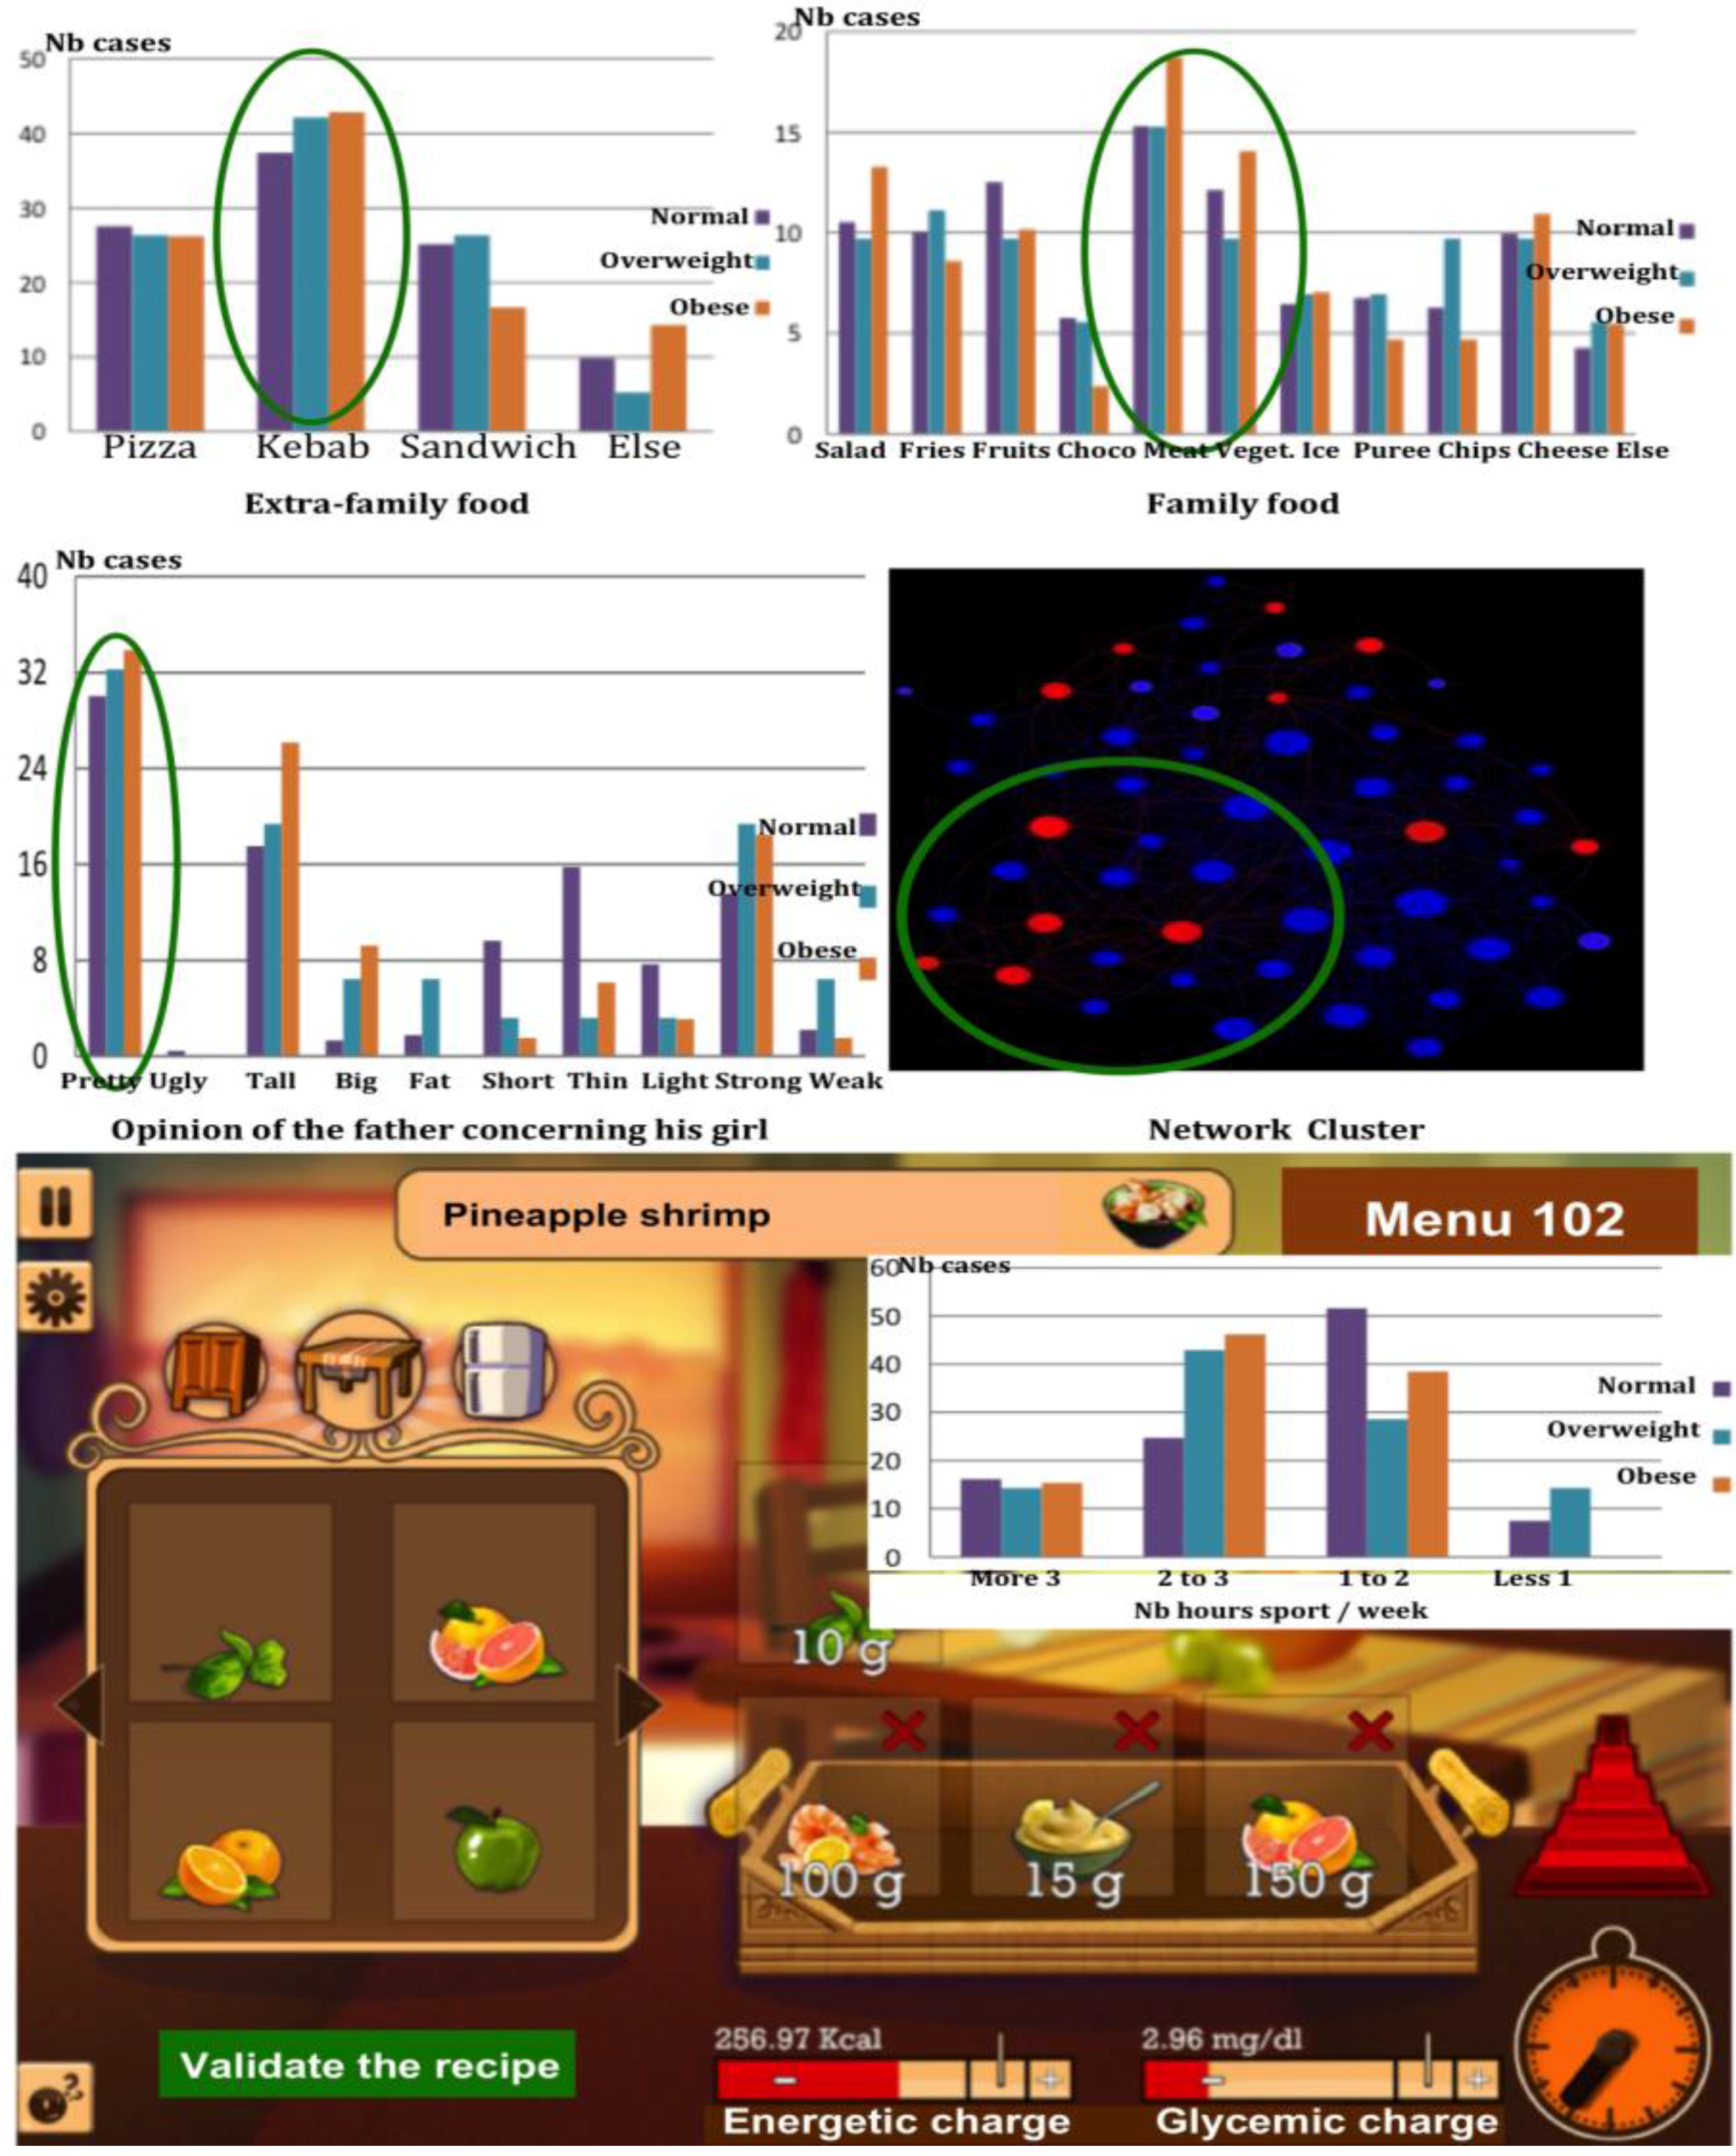
3.5. Example of Nutrition and Diabetic Disequilibrium

The risk of poor nutritional diets, high in carbohydrates, during the early phases of type II diabetes, will increase the imbalance of insulin control and cause a pre-prandial pre-coma, due to poor use of glycogen. It is therefore appropriate to advise the use of carbohydrates, avoid snacking and excessive loads of fast sugars. A healthy diet, balancing carbohydrate intake for energy balance according to a given physical activity should be recommended. The player has several menus available, which they themselves create entirely at their convenience, but during the game, the coach points out the inappropriate food choices they have made and advises other more suitable behaviors according to a nutrition plan adapted to their diabetic condition (Figure 12). Progressive exercise and the opportunity to build a series of tailored menus depending on sedentary conditions or physical activities motivate the patient and allow him or her to avoid hypo- or hyper-glycemia accidents.

4. Discussion

4.1. Use of a Priori Information about Nutrition, Physical Activity and Social Individual Habits

The knowledge of the lifestyle in the social environment of a type II diabetic serves to refine the sequence of menus offered. If the activity is out of the routine registered by actometric sensors at home, the patient can report it in advance; otherwise, it will be in a corrective manner taken into account in the following menus. The most important customized data in the lifestyle are the food preferences at home and abroad, sports activities, the opinion from the relatives about the normal or obese status of the person followed at home and his or her place in the friendly network surrounding him or her (Figure 12).

4.2. Interest of the Actimetry Coupled to Preventive Education

The list of activities, the mean and standard deviation of their duration and their probability to occur allow calculating both the glycemic and the energetic charges needed for performing the related actions correctly. Either the person indicates the amount of hydrocarbon and glucose needed (if he or she knows it) at the beginning of the nutritional diet serious game or this amount comes from his or her normal activity profile and possibly from the information recorded by specific activity sensors [125,126,127,128,129,130,131,132] (like those in the smart home mentioned above) or from sport “gadgets”. Among them, we can mention sensors from the following fields: (i) the photonic field, with video or infrared cameras [125]; (ii) the acoustic field, with microphones [126]; (iii) the ultrasonic field, with radar [127,128]; (iv) the electro-magnetic field, with the WiSee® sensor [129,130]; (v) the thermal field, with thermocouples and pyrometers [131]; (vi) the gravitational field, with pressure sensors [132]; and (vii) the energetic and nutritional field [133,134,135]. For this purpose, we employed the observations of an individual during an adequate lapse of time (e.g., 10 weeks, as in Figure 13). It is indeed possible to extract a typical activity profile from the clustering done on a great number of weeks and observed persons. If all of the daily activities have been identified, it is possible to create personalized scenarios conforming to the most probable succession of activities of an individual (Figure 13).

4.3. Toward the Fusion of Multimodal Information

The fusion of information coming from all of the sources of sensing at home can be made using scoring techniques among uncorrelated and non-redundant sensors [136,137]. We will provide two examples of such fusions for solving complex alarms. The first example concerns the early detection of thermal discomfort (on the premise of the worst case, a malignant hyperthermia), which can be made by capturing numerous data on both the temperature and resistivity of the skin and the humidity and intensity of the ambient air flow. The establishment of an acquisition and processing network of such thermal and hydration sensors [138,139] allows an early prevention of abnormal heat-regulation caused for example by a sudden summer heat wave. The acceptability of the sensors is improved by using smart jackets and bracelets to capture the surface temperature of the chest, wrist and ankle and placing sensors in the patients’ own clothing and accessories (broadly defined). The thermal sensors, like those of a pyrometer network (e.g., made from thermocouples [140]) can also be fixed on home walls to collect the body temperature of a person in bed or on a chair in the monitored room.
The second example is related to the principle of monitoring a pressure pad like the anti-decubitus actimetric mattress [125]. In collaboration with the company Texisense, a prototype was developed [141,142], improving an original device [143], which allows the measurement in real time of the pressures applied on the buttocks of a wheel chair-bound dependent patient or on furniture in the home on which the patient is sitting or lying (Figure 14); it is composed of two right and left cushions, each containing 6 × 12 pressure sensors with an area of about 1 cm2 each. The distribution of the sensors on the pad or mattress is non-linear, to allow better resolution on the shoulder, pelvis and foot areas, where the risk of bedsores is higher. A semiconductor powder distributed in a polymer shell powers these sensors. This powder has elastic properties and acts according to the principle of percolation: when its volume changes in response to a pressing force its conductivity increases and the variation of current passing through the powder is thus a function of the pressure. Each sensor is connected to an electronic system, which allows the measurement of its electrical potential coded on four bits (corresponding to 16 levels of pressure). This information about sitting and lying locations is completed by registering the number of exits and entrances in the room containing the furniture during a given lapse of time, e.g., allowing an additional diagnosis for the detection of certain chronic diseases, such as anuria, pollakiuria (urinary frequency) or nocturia.
Eventually, the fusion algorithm can be extended to other physiological parameters, such as weight or blood pressure, but with an observation window whose precise duration has to be adjusted to be significant. For instance, a drop of 10% in body weight, detected over a three-month period, could be the main signal of an early cancer diagnosis. An important problem to address in the future is the systematic fusion of information coming from all sensors participating in the different diagnoses (in the ICD coding) or functional deficits (in the ICF scale) in a person at risk, for triggering an integrated alert procedure. This fusion could be done through a score (coming for instance from a principal or independent component analysis), which is a scalar variable triggering the alert, or through a multidimensional vector that has to remain within a certain value domain, e.g., between some threshold values. In this last case, the passages of the boundaries of a “confident” domain have to be detected, and “viability” methods could be used [142,144].
The system has not yet been generalized to real-world conditions because it is still in a technologic prototype stage. However, we use a simulator that enables us to replicate the evolution of a person at home. It is composed of a group of scenarios pre-defined from real cases (Figure 13). This simulator proved that the application is an operational tool. Nevertheless, the correlation between the information produced by the system and clinical reality still has to be performed.

5. Perspectives and Conclusions

The perspectives of the work outlined in this article consider two complementary aspects of the actimetric supervision of a patient at home [145,146,147]:
(1) The ability to noninvasively record different physiological parameters that, in the future, should allow automatic documenting after suitable filtering (as the data volume is very large) of the personalization of the medical record of a patient, whose prototype has just been elaborated in France after about 10 years without much progress, which would greatly facilitate its updating, so as to enhance its suitability and allow a more efficient long-term monitoring at home in the case of chronic diseases. The chronology of the personalized record must facilitate the detection of phase shifts in nychthemeral rhythms and the pathologic perseveration in the actions of daily life often observed in neurodegenerative diseases.
(2) The ability to further customize preventive and therapeutic education, for instance, by didactically visualizing the weight curve and metabolic evolution showing changes in blood glucose level in a type II diabetic patient, or to choose appropriate activities for the rehabilitation of a diabetic foot with ulcer complications, or eventually to assist the patient with dietary advices by showing his or her water balance (especially in case of renal complications) from the assessment made by water pressure and chemical sensors (Figure 2). After clustering and personalized calibration, different so-called “comfort” zones are defined and “viable” behaviors (Figure 1) are proposed, e.g., corresponding to a physiologic respiratory and cardiac rhythm. The “viable” tubes are calculated after clustering collective real data by using a combination of statistical and dynamical systems techniques [142,144], providing scenarios of daily activity (Figure 13), which can be considered as “normal”. These scenarios allow the personalization of the alimentation necessary to fulfill the energetic and glycemic charges needed by this activity (Figure 12). The unpredictable divergences with respect to these scenarios are taken into account by our application for analyzing the circadian rhythm in real time and localizing it in “normal” or “abnormal” zones, susceptible to be further interpreted by a physician, a paramedic or a family helper (zones of fatigue, agitation, stress, etc.). When a new patient is taken into account by the system of surveillance at home or in an institution (e.g., dedicated to elderly people), a new learning and calibrating phase is required because of each patient’s individual behavior and activity. The application will be programmed to trigger possible alerts after an hour of monitoring. This reasonable delay is therefore necessary to study the actual behavior of a person before entering into an alert phase.
To conclude, the system proposed in the present paper allows the surveillance of the patient’s behavior in real time and offers personalized advice through serious games devoted to his or her preventive education and/or therapeutic rehabilitation and, then, can increase the empowerment and engagement of the patient himself or herself, as well as those of his or her family helpers and professional caregivers.

Acknowledgments

This work has been supported by the French Project “Investissements d’Avenir” VHP®, with Spie Communications® as the project leader.

Author Contributions

Jacques Demongeot, Adrien Elena and Carla Taramasco conceived of and designed the systems of recording at home and the serious games. Mariem Jelassi, Slimane BenMiled and Narjès Bellamine Ben Saoud analyzed and selected the observables and the corresponding data.

Conflicts of Interest

The authors declare no conflict of interest.

References

  1. Knickman, J.R.; Snell, E.K. The 2030 Problem: Caring for Aging Baby Boomers. Health Serv. Res. 2002, 37, 849–884. [Google Scholar] [CrossRef] [PubMed]
  2. Department of Economical and Social Affairs Report. World Population Ageing 2009; United Nations Publ.: New York, NY, USA, 2010. [Google Scholar]
  3. Dimitrova, R.; Petkova, V.; Dimitrov, M.; Madzharov, V.; Nikolova, I.; Petkova, E.; Andreevska, K.; Grekova, D.; Gueurguiev, S. Obesity relationship with vascular dysfunction. Adv. Obes. Weight Manag. Control 2014, 1, 1–6. [Google Scholar]
  4. Ogden, C.L. Obesity and Socioeconomic Status in Adults. United States, 2005–2008; Centers for Disease Control and Prevention: Atlanta, GA, USA, 2010. [Google Scholar]
  5. Suder, A. Body fatness and its social and lifestyle determinants in young working males from Cracow, Poland. J. Biosoc. Sci. 2009, 41, 139–154. [Google Scholar] [CrossRef] [PubMed]
  6. World Health Organization. Obesity: Preventing and Managing the Global Epidemic; Reports 894; World Health Organization: Geneva, Switzerland, 2000. [Google Scholar]
  7. Christakis, N.A.; Fowler, J.H. The spread of obesity in a large social network over 32 years. New Engl. J. Med. 2007, 357, 370–379. [Google Scholar] [CrossRef] [PubMed]
  8. Giles-Corti, B.; Macintyre, S.; Clarkson, J.P.; Pikora, T.; Donovan, R.J. Environmental and lifestyle factors associated with overweight and obesity in Perth, Australia. Am. J. Health Promot. 2003, 18, 93–102. [Google Scholar] [CrossRef] [PubMed]
  9. Larson, N.; Story, M. A review of environmental influences on food choices. Ann. Behav. Med. 2009, 38, 56–73. [Google Scholar] [CrossRef] [PubMed]
  10. Sutin, A.R.; Costa, P.T.; Chan, W.; Milaneschi, Y.; Eaton, W.W.; Zonderman, A.B.; Ferrucci, L.; Terracciano, A. I know not to, but I can’t help it weight gain and changes in impulsivity-related personality traits. Psychol. Sci. 2013, 24, 1323–1328. [Google Scholar] [CrossRef] [PubMed]
  11. Krieger, N. A glossary for social epidemiology. J. Epidemiol. Community Health 2001, 55, 693–700. [Google Scholar] [CrossRef] [PubMed]
  12. Monasta, L.; Batty, G.; Cattaneo, A.; Lutje, V.; Ronfani, L.; Van Lenthe, F.; Brug, J. Early-life determinants of overweight and obesity: A review of systematic reviews. Obes. Rev. 2010, 11, 695–708. [Google Scholar] [CrossRef] [PubMed]
  13. Sobal, J.; Stunkard, A.J. Socioeconomic status and obesity: A review of the literature. Psychol. Bull. 1989, 105, 260. [Google Scholar] [CrossRef] [PubMed]
  14. Monteiro, C.A.; Moura, E.C.; Conde, W.L.; Popkin, B.M. Socioeconomic status and obesity in adult populations of developing countries: A review. Bull. World Health Organ. 2004, 82, 940–946. [Google Scholar] [PubMed]
  15. Van Der Horst, K.; Oenema, A.; Ferreira, I.; Wendel-Vos, W.; Giskes, K.; van Lenthe, K.F.; Brug, J. A systematic review of environmental correlates of obesity-related dietary behaviors in youth. Health Educ. Res. 2007, 22, 203–226. [Google Scholar] [CrossRef] [PubMed]
  16. Campbell, K.; Crawford, D. Family food environments as determinants of preschool-aged childrens eating behaviours: implications for obesity prevention policy. Austr. J. Nutr. Diet. 2001, 58, 19–25. [Google Scholar]
  17. Chalmers, I.; Altman, D.G.; Gotzsche, P.C. Systematic Reviews; BMJ Publishing Group: London, UK, 1995. [Google Scholar]
  18. Needleman, I.; Moles, D.R.; Worthington, H. Evidence-based periodontology, systematic reviews and research quality. Periodontology 2005, 37, 12–28. [Google Scholar] [CrossRef] [PubMed]
  19. Moher, D.; Liberati, A.; Tetzlaff, J.; Altman, D.G. Preferred reporting items for systematic reviews and meta-analyses: The prisma statement. Ann. Intern. Med. 2009, 151, 264–269. [Google Scholar] [CrossRef] [PubMed]
  20. Rizzuto, D.; Fratiglioni, L. Lifestyle factors related to mortality and survival: A mini-review. Gerontology 2014, 60, 327–335. [Google Scholar] [CrossRef] [PubMed]
  21. Grimm, V.; Berger, U.; De Angelis, D.L.; Polhill, J.G.; Giske, J.; Railsback, S.F. The odd protocol: A review and first update. Ecol. Model. 2010, 221, 2760–2768. [Google Scholar] [CrossRef]
  22. Tzanetakou, I.P.; Katsilambros, N.L.; Benetos, A.; Mikhailidis, D.P.; Perrea, D.N. Is obesity linked to aging? Adipose tissue and the role of telomeres. Ageing Res. Rev. 2012, 11, 220–229. [Google Scholar] [CrossRef] [PubMed]
  23. Befort, C.A.; Thomas, J.L.; Daley, C.M.; Rhode, P.C.; Ahluwalia, J.S. Perceptions and beliefs about body size, weight, and weight loss among obese African American women: A qualitative inquiry. Health Educ. Behav. 2008, 35, 410–426. [Google Scholar] [CrossRef] [PubMed]
  24. Hartmann, A.S.; Czaja, J.; Rief, W.; Hilbert, A. Personality and psychopathology in children with and without loss of control over eating. Compr. Psychiatry 2010, 51, 572–578. [Google Scholar] [CrossRef] [PubMed]
  25. Haworth, C.; Plomin, R.; Carnell, S.; Wardle, J. Childhood obesity: Genetic and environmental overlap with normal-range BMI. Obesity 2008, 16, 1585–1590. [Google Scholar] [CrossRef] [PubMed]
  26. Sanderson, S.; Diefenbach, M.; Streicher, S.; Jabs, E.; Smirnoff, M.; Horowitz, C.; Zinberg, R.; Clesca, C.; Richardson, L. Genetic and lifestyle causal beliefs about obesity and associated diseases among ethnically diverse patients: A structured interview study. Public Health Genom. 2012, 16, 83–93. [Google Scholar] [CrossRef] [PubMed]
  27. Silventoinen, K.; Sarlio-Lähteenkorva, S.; Koskenvuo, M.; Lahelma, E.; Kaprio, J. Effect of environmental and genetic factors on education-associated disparities in weight and weight gain: A study of Finnish adult twins. Am. J. Clin. Nutr. 2004, 80, 815–822. [Google Scholar] [PubMed]
  28. Gesell, S.B.; Tesdahl, E.; Ruchman, E. The distribution of physical activity in an after-school friendship network. Pediatrics 2012, 129, 1064–1071. [Google Scholar] [CrossRef] [PubMed]
  29. Pereira, G.; Christian, H.; Foster, S.; Boruff, B.J.; Bull, F.; Knuiman, M.; Giles-Corti, B. The association between neighbourhood greenness and weight status: an observational study in Perth Western Australia. Environ. Health 2013, 12, 49. [Google Scholar] [CrossRef] [PubMed]
  30. Stark, J.H.; Neckerman, K.; Lovasi, G.S.; Quinn, J.; Weiss, C.C.; Bader, M.D.; Konty, K.; Harris, T.G.; Rundle, A. The impact of neighbourhood park access and quality on body mass index among adults in New York City. Preventive Medicine 2014, 64, 63–68. [Google Scholar] [CrossRef] [PubMed]
  31. Jerrett, M.; McConnell, R.; Wolch, J.; Chang, R.; Lam, C.; Dunton, G.; Gilliland, F.; Lurmann, F.; Islam, T.; Berhane, K. Traffic-related air pollution and obesity formation in children: a longitudinal, multilevel analysis. Environ. Health 2014, 13, 49. [Google Scholar] [CrossRef] [PubMed]
  32. Fletcher, A.; Bonell, C.; Sorhaindo, A. You are what your friends eat: systematic review of social network analyses of young people’s eating behaviours and bodyweight. J. Epidemiology and Community Health 2011, 65, 548–555. [Google Scholar] [CrossRef] [PubMed]
  33. Schaefer, D.R.; Simpkins, S.D. Using social network analysis to clarify the role of obesity in selection of adolescent friends. American Journal of Public Health 2014, 104, 1223–1229. [Google Scholar] [CrossRef] [PubMed]
  34. Renna, F.; Grafova, I.B.; Thakur, N. The effect of friends on adolescent body weight. Econ. & Human Biology 2008, 6, 377–387. [Google Scholar]
  35. Houldcroft, L.; Haycraft, E.; Farrow, C. Peer and friend influences on children’s eating. Social Development 2014, 23, 19–40. [Google Scholar] [CrossRef]
  36. Burke, V.; Beilin, L.; Dunbar, D. Family lifestyle and parental body mass index as predictors of body mass index in Australian children: A longitudinal study. Int. J. Obesity Rel. Metab. Disord. 2001, 25, 147–157. [Google Scholar] [CrossRef] [PubMed]
  37. Timperio, A.; Salmon, J.; Ball, K.; Baur, L.A.; Telford, A.; Jackson, M.; Salmon, L.; Crawford, D. Family physical activity and sedentary environments and weight change in children. Int. J. Pediatric. Obesity 2008, 3, 160–167. [Google Scholar] [CrossRef] [PubMed]
  38. Fitzgerald, A.; Fitzgerald, N.; Aherne, C. Do peers matter? a review of peer and/or friends’ influence on physical activity among American adolescents. Journal of Adolescence 2012, 35, 941–958. [Google Scholar] [PubMed]
  39. Cohen-Cole, E.; Fletcher, M. Is obesity contagious? Social networks vs. environmental factors in the obesity epidemic. Journal of Health Economics 2008, 27, 1382–1387. [Google Scholar] [CrossRef] [PubMed]
  40. Fowler, J.H.; Christakis, N.A. Estimating peer effects on health in social networks: a response to Cohen-Cole and Fletcher; and trogdon, nonnemaker, and pais. Journal of Health Economics 2008, 27, 1400–1405. [Google Scholar] [CrossRef] [PubMed]
  41. Bisset, S.; Gauvin, L.; Potvin, L.; Paradis, G. Association of body mass index and dietary restraint with changes in eating behaviour throughout late childhood and early adolescence: a 5-year study. Public Health Nutrition 2007, 10, 780–789. [Google Scholar] [CrossRef] [PubMed]
  42. Ejima, K.; Aihara, K.; Nishiura, H. Modeling the obesity epidemic: social contagion and its implications for control. Theor. Biol. Med. Model. 2013, 10, 17. [Google Scholar] [CrossRef] [PubMed]
  43. Evangelista, A.M.; Ortiz, A.R.; Rios-Soto, K.; Urdapilleta, A. USA the fast food nation: Obesity as an epidemic; Los Alamos National Laboratory: Los Alamos, 2004.
  44. Demongeot, J.; Hansen, O.; Hessami, H.; Jannot, A.S.; Mintsa, J.; Rachdi, M.; Taramasco, C. Random modelling of contagious diseases. Acta Biotheor. 2013, 61, 141–172. [Google Scholar] [CrossRef] [PubMed]
  45. Hammond, R.A.; Epstein, J.M. Exploring Price-Independent Mechanisms in the Obesity Epidemic. 2007. [Google Scholar] [CrossRef]
  46. Luke, D.A.; Stamatakis, K.A. Systems science methods in public health: dynamics, networks, and agents. Annual Review of Public Health 2012, 33, 357. [Google Scholar] [CrossRef] [PubMed]
  47. Christensen, V.T. My sibling, my weight. How gender, sibling gender, sibling weight and sibling weight level perception influence weight perception accuracy. Nutr. Diabetes 2014, 4, e103. [Google Scholar] [CrossRef] [PubMed]
  48. Chapman, B.P.; Fiscella, K.; Duberstein, P.; Coletta, M.; Kawachi, I. Can the influence of childhood socioeconomic status on men’s and women’s adult body mass be explained by adult socioeconomic status or personality? Findings from a national sample. Health Psychol. 2009, 28, 419–427. [Google Scholar] [CrossRef] [PubMed]
  49. Inoue, M.; Toyokawa, S.; Inoue, K.; Suyama, Y.; Miyano, Y.; Suzuki, T.; Miyoshi, Y.; Kobayashi, Y. Lifestyle, weight perception and change in body mass index of Japanese workers: My health up study. Public Health 2010, 124, 530–537. [Google Scholar] [CrossRef] [PubMed]
  50. Casey, A.A.; Elliott, M.; Glanz, K.; Haire-Joshu, D.; Lovegreen, S.L.; Saelens, B.E.; Sallis, J.F.; Brownson, R.C. Impact of the food environment and physical activity environment on behaviours and weight status in rural US communities. Prev. Med. 2008, 47, 600–604. [Google Scholar] [CrossRef] [PubMed]
  51. Seliske, L.; Pickett, W.; Rosu, A.; Janssen, I. The number and type of food retailers surrounding schools and their association with lunchtime eating behaviours in students. Int. J. Behav. Nutr. Phys. Act. 2013, 10, 1–9. [Google Scholar] [CrossRef] [PubMed]
  52. Xu, H.; Short, S.E.; Liu, T. Dynamic relations between fast-food restaurant and body weight status: A longitudinal and multilevel analysis of Chinese adults. J. Epidemiol. Community Health 2013, 67, 271–279. [Google Scholar] [CrossRef] [PubMed]
  53. Simon, G.E.; von Korff, M.; Saunders, K.; Miglioretti, D.L.; Crane, P.K.; van Belle, G.; Kessler, R.C. Association Between Obesity and Psychiatric Disorders in the US Adult Population. Arch. Gen. Psychiatry 2006, 63, 824–830. [Google Scholar] [CrossRef] [PubMed]
  54. Gregori, D.; Foltran, F.; Ghidina, M.; Zobec, F.; Berchialla, P. Familial environment in high-and middle-low-income municipalities: A survey in Italy to understand the distribution of potentially obesogenic factors. Public Health 2012, 126, 731–739. [Google Scholar] [CrossRef] [PubMed]
  55. Nagel, G.; Wabitsch, M.; Galm, C.; Berg, S.; Brandstetter, S.; Fritz, M.; Klenk, J.; Peter, R.; Prokopchuk, D.; Steiner, R.; Stroth, S.; Wartha, O.; Weiland, S.K.; Steinacker, J. Determinants of obesity in the Ulm research on metabolism, exercise and lifestyle in children (Urmel-Ice). Eur. J. Pediatr. 2009, 168, 1259–1267. [Google Scholar] [CrossRef] [PubMed]
  56. Po’e, E.K.; Heerman, W.J.; Mistry, R.S.; Barkin, S.L. Growing right onto wellness (growth): A family-centered, community-based obesity prevention randomized controlled trial for preschool child-parent pairs. Contemp. Clin. Trials 2013, 36, 436–449. [Google Scholar] [CrossRef] [PubMed]
  57. Stephens, S.K.; Cobiac, L.J.; Veerman, J.L. Improving diet and physical activity to reduce population prevalence of overweight and obesity: An overview of current evidence. Preventive Med. 2014, 62, 167–178. [Google Scholar] [CrossRef] [PubMed]
  58. Bourisly, A.K. An Obesity Agent Based Model: A New Decision Support System for the Obesity Epidemic. In AsiaSim’13, Proceedings of the 13th International Conference on Systems Simulation, Singapore, 6–8 November 2013; Communications in Computer and Information Science. Springer: Berlin, Germany, 2010; Volume 402, pp. 37–48. [Google Scholar]
  59. Poundstone, K.E.; Strathdee, S.A.; Celentano, D.D. The social epidemiology of human immunodeficiency virus/acquired immuno-deficiency syndrome. Epidemiol. Rev. 2004, 26, 22–35. [Google Scholar] [CrossRef] [PubMed]
  60. Awada, R.; Parimisetty, A.; d’Hellencourt, C.L. Influence of obesity on neurodegenerative diseases. In Neurodegenerative Diseases; Kishore, U., Ed.; InTech: Rijeka, Croatia, 2013; pp. 381–401. [Google Scholar]
  61. Crawford, D.; Cleland, V.; Timperio, A.; Salmon, J.; Andrianopoulos, N.; Roberts, R.; Giles-Corti, B.; Baur, L.; Ball, K. The longitudinal influence of home and neighborhood environments on children’s body mass index and physical activity over 5 years: The clan study. Int. J. Obesity 2010, 34, 1177–1187. [Google Scholar] [CrossRef] [PubMed]
  62. Dabbaghian, V.; Mago, V.K.; Wu, T.; Fritz, C.; Alimadad, A. Social interactions of eating behaviour among high school students: A cellular automata approach. BMC Med. Res. Methodol. 2012, 12, 155. [Google Scholar] [CrossRef] [PubMed]
  63. Taramasco, C. Impact de L’obésité Sur Les Structures Sociales et Impact des Structures Sociales Sur L’obésité? Facteurs Individuels et Environnementaux. Ph.D. Thesis, Ecole Polytechnique, Paris, France, 2011. [Google Scholar]
  64. Harris, D.E.; Bampton, M.; Aboueissa, A.M. Two methods that dene the scale of obesogenic environments: a case study of Lewiston-Auburn, Maine. J. Hunger Environ. Nutr. 2013, 8, 11–21. [Google Scholar] [CrossRef]
  65. Belsky, D.W.; Moffitt, T.E.; Sugden, K.; Williams, B.; Houts, R.; McCarthy, J.; Caspi, A. Development and evaluation of a genetic risk score for obesity. Biodemography Social Biol. 2013, 59, 85–100. [Google Scholar] [CrossRef] [PubMed]
  66. Boone-Heinonen, J.; Diez-Roux, A.V.; Goff, D.C.; Loria, C.M.; Kiefe, C.I.; Popkin, B.M.; Gordon-Larsen, P. The neighbourhood energy balance equation: Does neighbourhood food retail environment + physical activity environment = obesity? The CARDIA study. PLoS ONE 2013, 8, e85141. [Google Scholar]
  67. Dressler, H.; Smith, C. Health and eating behaviour differs between lean/normal and overweight/obese low-income women living in food-insecure environments. Health Promot. 2013, 27, 358–365. [Google Scholar] [CrossRef] [PubMed]
  68. Eichen, D.M.; Conner, B.T.; Daly, B.P.; Fauber, R.L. Weight perception, substance use, and disordered eating behaviors: Comparing normal weight and overweight high-school students. J. Youth Adolesc. 2012, 41, 1–13. [Google Scholar] [CrossRef] [PubMed]
  69. De La Haye, K.; Robins, G.; Mohr, P.; Wilson, C. Homophily and contagion as explanations for weight similarities among adolescent friends. J. Adolesc. Health 2011, 49, 421–427. [Google Scholar] [CrossRef] [PubMed]
  70. Jorm, A.F.; Korten, A.E.; Christensen, H.; Jacomb, P.A.; Rodgers, B.; Parslow, R.A. Association of obesity with anxiety, depression and emotional well-being: A community survey. Austr. N.Z. J. Public Health 2003, 27, 434–440. [Google Scholar] [CrossRef]
  71. Gracia-Marco, L.; Vicente-Rodriguez, G.; Borys, J.; Le Bodo, Y.; Pettigrew, S.; Moreno, L. Contribution of social marketing strategies to community-based obesity prevention programs in children. Int. J. Obes. 2010, 35, 472–479. [Google Scholar] [CrossRef] [PubMed]
  72. Powell-Wiley, T.M.; Ayers, C.R.; de Lemos, J.A.; Lakoski, G.; Vega, G.L.; Grundy, S.; Das, S.R.; Banks-Richard, K.; Albert, M.A. Relationship between perceptions about neighbor-hood environment and prevalent obesity: Data from the Dallas heart study. Obesity 2013, 21, 14–21. [Google Scholar] [CrossRef] [PubMed]
  73. Agrawal, P.; Gupta, K.; Mishra, V.; Agrawal, S. Effects of sedentary lifestyle and dietary habits on body mass index change among adult women in India: Findings from a follow-up study. Ecol. Food Nutr. 2013, 52, 387–406. [Google Scholar] [CrossRef] [PubMed]
  74. Martyn-Nemeth, P.; Penckofer, S.; Gulanick, M.; Velsor-Friedrich, B.; Bryant, F.B. The relationships among self-esteem, stress, coping, eating behavior, and depressive mood in adolescents. Res. Nurs. Health 2009, 32, 96–109. [Google Scholar] [CrossRef] [PubMed]
  75. In-iw, S.; Manaboriboon, B.; Chomchai, C. A comparison of body-image perception, health outlook and eating behavior in mildly obese versus moderately-to-severely obese adolescents. Med. J. Med. Assoc. Thail. 2010, 93, 429–435. [Google Scholar]
  76. Lenhart, C.M.; Daly, B.P.; Eichen, D.M. Is accuracy of weight perception associated with health risk behaviors in a diverse sample of obese adolescents? J. School Nurs. 2011, 27, 416–423. [Google Scholar] [CrossRef] [PubMed]
  77. Cunningham, S.A.; Vaquera, E.; Maturo, C.C.; Venkat Narayan, K. Is there evidence that friends influence body weight? A systematic review of empirical research. Social Sci. Med. 2012, 75, 1175–1183. [Google Scholar] [CrossRef] [PubMed]
  78. Annesi, J.J. Effects of improved self-appraisal and mood factors on weight loss in obese women initiating supported exercise. J. Complement. Integr. Med. 2011, 8, 11. [Google Scholar] [CrossRef] [PubMed]
  79. Annesi, J.J. Supported Exercise Improves Controlled Eating and Weight through Its Effects on Psychosocial Factors: Extending a Systematic Research Program Toward Treatment Development. Perm. J. 2012, 16, 7–18. [Google Scholar] [CrossRef] [PubMed]
  80. Hussain, S.S.; Bloom, S.R. The regulation of food intake by the gut-brain axis: Implications for obesity. Int. J. Obes. 2013, 37, 625–633. [Google Scholar] [CrossRef] [PubMed]
  81. Lazzeri, G.; Giacchi, M.V.; Spinelli, A.; Pammolli, A.; Dalmasso, P.; Nardone, P.; Lamberti, A.; Cavallo, F. Overweight among students aged 11–15 years and its relationship with breakfast, area of residence and parents’ education: Results from the Italian HBSC 2010 cross-sectional study. Nutr. J. 2014, 13, 69. [Google Scholar] [CrossRef] [PubMed]
  82. Brown, H.W.; Roberts, J. Exploring the factors contributing to sibling correlations in BMI: A study using the panel study of income dynamics. Obesity 2012, 20, 978–984. [Google Scholar] [CrossRef] [PubMed]
  83. Chandon, P. How package design and packaged-based marketing claims lead to overeating. Appl. Econ. Perspect. Policy 2013, 35, 7–31. [Google Scholar] [CrossRef]
  84. Agrawal, P.; Gupta, K.; Mishra, V.; Agrawal, S. A study on body-weight perception, future intention and weight-management behavior among normal-weight, overweight and obese women in India. Public Health Nutr. 2014, 17, 884–895. [Google Scholar] [CrossRef] [PubMed]
  85. Barclay, K.J.; Edling, C.; Rydgren, J. Peer clustering of exercise and eating behaviours among young adults in Sweden: A cross-sectional study of egocentric network data. BMC Public Health 2013, 13, 1–13. [Google Scholar] [CrossRef] [PubMed]
  86. Demongeot, J.; Taramasco, C. Evolution of social networks: The example of obesity. Biogerontology 2014, 15, 611–626. [Google Scholar] [CrossRef] [PubMed]
  87. King, K.M.; Puhl, R.M.; Luedicke, J.; Peterson, J.L. Eating behaviors, victimization, and desire for supportive intervention among adolescents in weight-loss camps. Eat. Behav. 2013, 14, 484–487. [Google Scholar] [CrossRef] [PubMed]
  88. Leroux, J.S.; Moore, S.; Richard, L.; Gauvin, L. Physical in-activity mediates the association between the perceived exercising behavior of social network members and obesity. PLoS ONE 2012, 7, e46558. [Google Scholar] [CrossRef] [PubMed]
  89. Provencher, V.; Pérusse, L.; Bouchard, L.; Drapeau, V.; Bouchard, C.; Rice, T.; Rao, D.; Tremblay, A.; Després, J.P.; Lemieux, S. Familial resemblance in eating behaviors in men and women from the Québec family study. Obes. Res. 2005, 13, 1624–1629. [Google Scholar] [CrossRef] [PubMed]
  90. Viner, R.; Haines, M.; Taylor, S.; Head, J.; Booy, R.; Stansfeld, S. Body mass, weight control behaviors, weight perception and emotional well being in a multiethnic sample of early adolescents. Int. J. Obes. 2006, 30, 1514–1521. [Google Scholar] [CrossRef] [PubMed]
  91. Sturm, R. Increases in morbid obesity in the USA: 2000–2005. Public Health 2007, 121, 492–496. [Google Scholar] [CrossRef] [PubMed]
  92. Atmaca, M.; Kuloglu, M.; Tezcan, E.; Ustundag, B. Serum leptin and cholesterol levels in schizophrenic patients with and without suicide attempts. Acta Psychiatr. Scand. 2003, 108, 208–214. [Google Scholar] [CrossRef] [PubMed]
  93. González-Parra, G.; Villanueva, R.J.; Arenas, A.J. An age structured model for obesity prevalence dynamics in populations. Revista. MVZ Córdoba 2010, 15, 2051–2059. [Google Scholar]
  94. González-Parra, G.; Arenas, A.J.; Santonia, F.J. Stochastic modeling with Monte Carlo of obesity population. J. Biol. Syst. 2010, 18, 93–108. [Google Scholar] [CrossRef]
  95. Prince, S.A.; Kristjansson, E.A.; Russell, K.; Billette, J.M.; Sawada, M.C.; Ali, A.; Tremblay, M.S.; Prud’homme, D. Relationships between neighborhoods, physical activity, and obesity: A multilevel analysis of a large Canadian city. Obesity 2012, 20, 2093–2100. [Google Scholar] [CrossRef] [PubMed]
  96. Demetrius, L.; Coy, J.; Tuszynski, J. Cancer proliferation and therapy: The Warburg effect and quantum metabolism. Theor. Biol. Med. Model. 2010, 7, 2. [Google Scholar] [CrossRef] [PubMed]
  97. Demetrius, L.; Tuszynski, J.A. Quantum metabolism explains the allometric scaling of metabolic rates. J. R. Soc. Interface 2010, 7, 507–514. [Google Scholar] [CrossRef] [PubMed]
  98. Demetrius, L.; Magistretti, P.J.; Pellerin, L. Alzheimer’s disease: The amyloid hypothesis and the Inverse Warburg effect. Front. Physiol. 2015, 5, 522. [Google Scholar] [CrossRef] [PubMed]
  99. Demongeot, J.; Hansen, O.; Hamie, A.; Hazgui, H.; Virone, G.; Vuillerme, N. Actimetry@home: Actimetric tele-surveillance and tailored to the signal data compression. Lect. Notes Comp. Sci. 2015, 8456, 59–70. [Google Scholar]
  100. Demongeot, J.; Elena, A.; Taramasco, C.; Vuillerme, N. Serious games and personalization of the therapeutic education. Lect. Notes Comp. Sci. 2015, 9102, 270–281. [Google Scholar]
  101. Demongeot, J.; Virone, G.; Duchêne, F.; Benchetrit, G.; Hervé, T.; Noury, N.; Rialle, V. Multi-sensors acquisition, data fusion, knowledge mining and triggering in health smart homes for elderly people. C. R. Biol. 2002, 325, 673–682. [Google Scholar] [CrossRef]
  102. Virone, G.; Noury, N.; Demongeot, J. A system for automatic measurement of circadian activity deviation in telemedicine. IEEE Trans. Biomed. Eng. 2002, 49, 1463–1469. [Google Scholar] [CrossRef] [PubMed]
  103. Abdulrazak, B.; Mokhtari, M.; Feki, M.A.; Ghorbel, M. Integration of home networking in a smart environment dedicated to people with disabilities. In Proceedings of the International Conference on Information and Communication Technologies: From Theory to Applications, Damascus, Syria, 19–23 April 2004; IEEE Press: Piscataway, NJ, USA, 2004; pp. 125–126. [Google Scholar]
  104. Benneyan, J.C. An introduction to using computer simulation in healthcare: Patient wait case study. J. Soc. Health Syst. 1997, 5, 1–15. [Google Scholar] [PubMed]
  105. Lowery, J.C. Introduction to simulation in healthcare. In Proceedings of the 28th Conference on Winter Simulation, WSC ’96, Coronado, CA, USA, 8–11 December 1996; pp. 78–84.
  106. O’Connor, C.M.; Smith, R.; Nott, M.T.; Lorang, C.; Matthews, R.M. Using video simulated presence to reduce resistance to care and increase participation of adults with dementia. Am. J. Alzeimer’s Dis. Other Dement. 2011, 26, 317–325. [Google Scholar] [CrossRef] [PubMed]
  107. Lowery, J.C.; Martin, J.B. Design and validation of a critical care simulation model. J. Soc. Health Syst. 1992, 3, 15–36. [Google Scholar] [PubMed]
  108. Gibson, B.; Weir, C. Development and preliminary evaluation of a simulation-based diabetes education module. AMIA Annu. Symp. Proc. 2010, 2010, 246–250. [Google Scholar] [PubMed]
  109. Berg, D.R.; Carlson, A.; Durfee, W.K.; Sweet, R.M.; Reihsen, T. Low-cost, take-home, beating heart simulator for health-care education. Stud. Health Technol. Inform. 2011, 163, 57–59. [Google Scholar] [PubMed]
  110. Wong, P.; Graves, M.J.; Lomas, D.J. Integrated physiological flow simulator and pulse sequence monitoring system for MRI. Med. Biol. Eng. Comput. 2008, 46, 399–406. [Google Scholar] [CrossRef] [PubMed]
  111. Mahmoud, S.M.; Akhlaghinia, M.J.; Lotfi, A.; Langensiepen, C. Trend Modelling of Elderly Lifestyle within an Occupancy Simulator. In Proceedings of the 2011 UkSim 13th International Conference on Computer Modelling and Simulation (UKSim), Cambridge, UK, 30 March–1 April 2011.
  112. Virone, G.; Lefebvre, B.; Noury, N.; Demongeot, J. Modeling and Computer Simulation of Physiological Rhythms and Behaviors at Home for Data Fusion Programs in a Telecare System. In Proceedings of the 5th International Workshop on Enterprise Networking and Computing in Healthcare Industry, Santa Monica, CA, USA, 6–7 June 2003.
  113. Nabih, K.; Gomaa, M.M.; Osman, H.S.; Aly, G.M. Modeling, Simulation, and Control of Smart Homes Using Petri Nets. Int. J. Smart Home 2011, 5, 1–14. [Google Scholar]
  114. Cardinaux, F.; Brownsell, S.; Hawley, M.S.; Bradley, D. A home daily activity simulation model for the evaluation of lifestyle monitoring systems. Comput. Biol. Med. 2013, 43, 1428–1436. [Google Scholar] [CrossRef] [PubMed]
  115. Lazovik, A.; Kaldeli, E.; Lazovik, E.; Aiello, M. Planning in a Smart Home: Visualization and Simulation. In Proceedings of the 19th International Conference on Automated Planning and Scheduling, Thessaloniki, Greece, 19–23 September 2009.
  116. Poland, M.P.; Nugent, C.D.; Wang, H.; Chen, L. Development of a smart home simulator for use as a heuristic tool for management of sensor distribution. Tech. Health Care 2009, 17, 171–182. [Google Scholar]
  117. Virone, G.; Istrate, D. Integration of an Environmental Sound Module to an Existing In-Home Activity Simulator. In Proceedings of the 29th Annual International conference of the IEEE EMBS, Lyon, France, 23–26 August 2007.
  118. Istrate, D.; Castelli, E. Information Extraction from Sound for Medical Telemonitoring. IEEE Trans. Inform. Technol. Biomed. 2006, 10, 264–274. [Google Scholar] [CrossRef]
  119. Virone, G.; Istrate, D.; Vacher, M.; Noury, N.; Sérignat, J.F.; Demongeot, J. First Steps in Data Fusion between a Multichannel Audio Acquisition and an Information System for Home Healthcare. In Proceedings of the 25th Annual International Conference of the IEEE Engineering in Medicine and Biology Society, Cancun, Mexico, 17–21 September 2003.
  120. Weight Sensors. Available online: www.techtry.co.jp/weight_en/#sts (accessed on 25 August 2015).
  121. Royans Vercors Santé. Available online: http://www.vercors.org/act-rvs.html (accessed on 25 August 2015).
  122. Griffin-trust. Available online: http://www.griffin-trust.com/Leaflet5.html (accessed on 14 February 2016).
  123. Crous-Lyon. Available online: http://www.crous-lyon.fr/html/IMG/pdf_Crous_Lyon2013_2014_web (accessed on 14 February 2016).
  124. VHP@interactive. Available online: http://www.grenoblecognition.fr/index.php/actualites2/9-communiques/168-vhp-interactive-inventer-le-futur-de-l-appartement-intelligent (accessed on 25 August 2015).
  125. Couturier, P.; Franco, A.; Piquart, J.F.; Mansotte, J.; Montani, C.; Suarez, C.; Mollier, A.; Gucher, C.; Frossard, M.; Nicolas, L.; et al. “Telegerontology”: From teleassistance to teleconsultation of elderly people. Mythe or reality. Rev. Gériatr. 1996, 21, 23–31. [Google Scholar]
  126. Istrate, D.; Binet, M.; Cheng, S. Real Time Sound Analysis for Medical Remote Monitoring. In Proceedings of the 30th Annual International Conference of the IEEE Engineering in Medicine and Biology Society, Vancouver, BC, Canada, 20–25 August 2008; pp. 4640–4643.
  127. Noury, N.; Virone, G.; Ye, J.; Rialle, V.; Demongeot, J. Nouvelles Directions en Habitats intelligents pour la santé. ITBM 2003, 24, 122–135. [Google Scholar] [CrossRef]
  128. Noury, N.; Fleury, A.; Nocua, R.; Poujaud, J.; Gehin, C.; Dittmar, A.; Delhomme, G.; Demongeot, J.; Mcadam, E. E-Health sensors. Biomedical sensors, algorithms and sensors networks. Recent Res. Dev. Appl. Phys. 2009, 30, 93–103. [Google Scholar]
  129. O’Connor, M.E.; Bentall, R.H.C.; Monahan, J.C. Emerging Electromagnetic Medicine; Springer: New York, NY, USA, 1990. [Google Scholar]
  130. Pu, Q.; Gupta, S.; Gollakota, S.; Patel, S. Whole-Home Gesture Recognition Using Wireless Signals. In Proceedings of the 19th Annual International Conference on Mobile Computing & Networking, Miami, FL, USA, 30 September–4 October 2013; pp. 27–38.
  131. Tamura, T.; Miyasako, S.; Fujimoto, T.; Togawa, T. Monitoring bed temperature in elderly in the home. In Proceedings of the 18th Annual International Conference of the IEEE Engineering in Medicine and Biology Society, Amsterdam, The Netherlands, 31 October–3 November 1996.
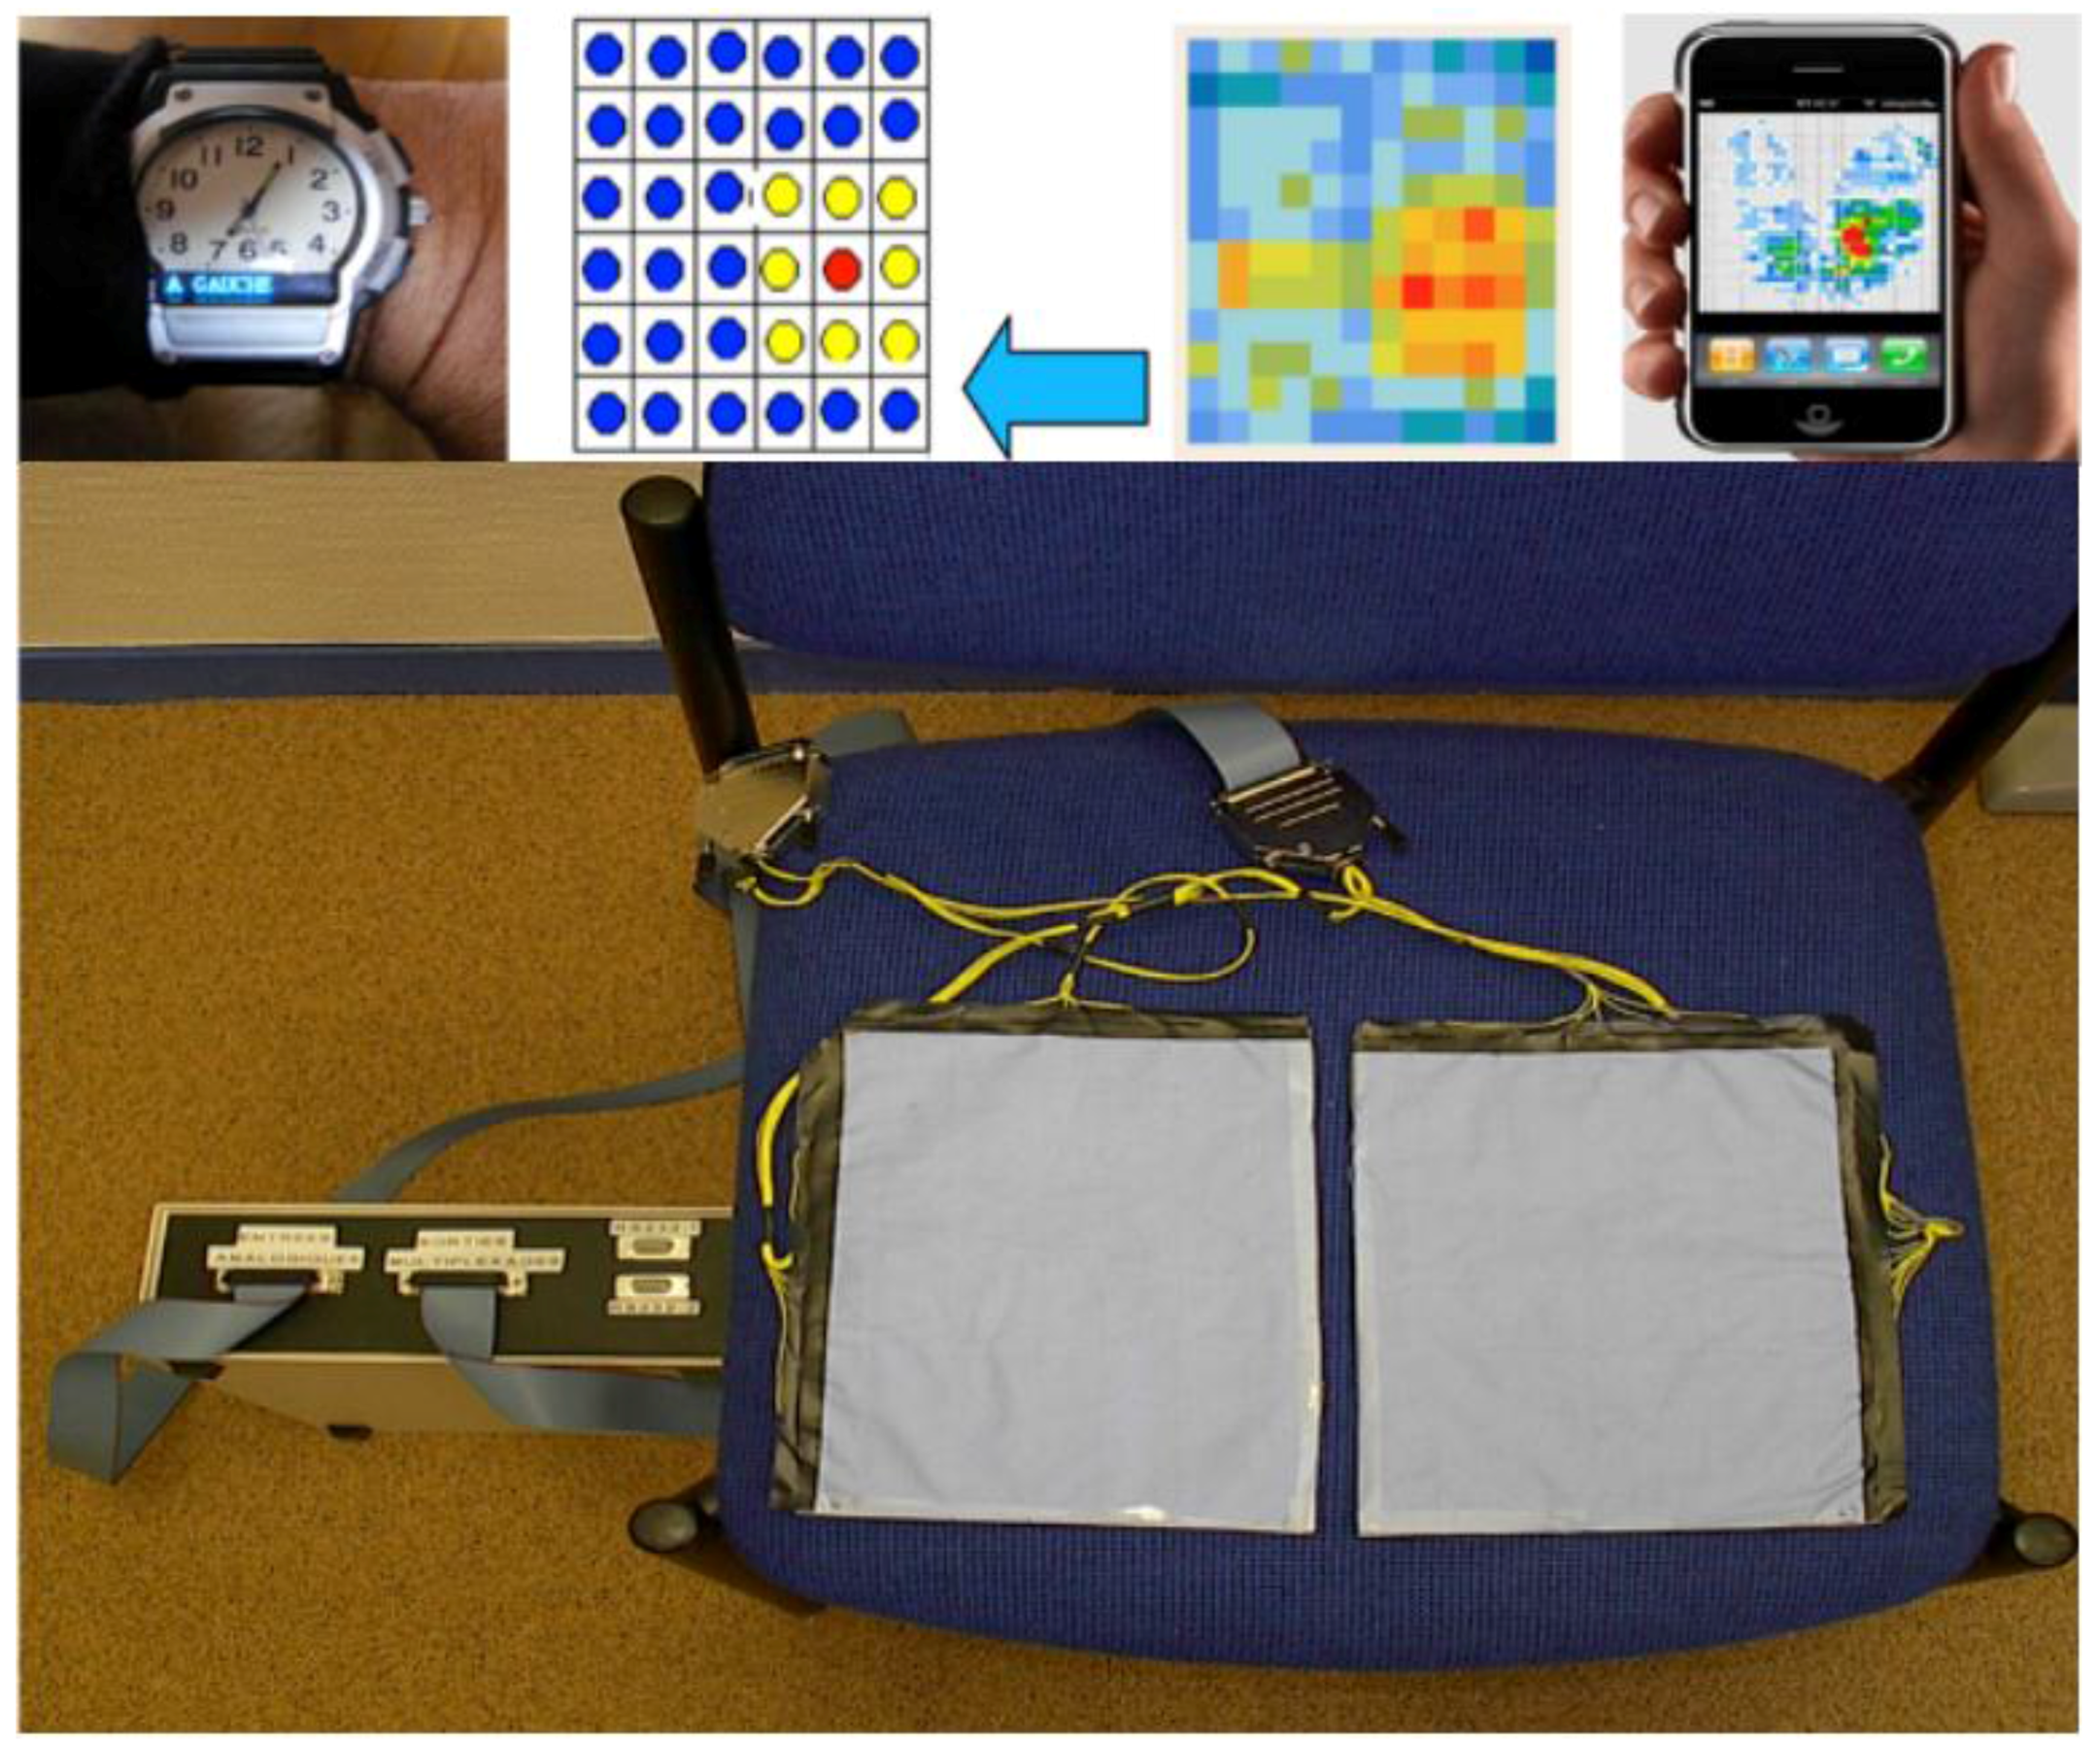
  132. Chenu, O.; Vuillerme, N.; Moreau-Gaudry, A.; Demongeot, J.; Payan, Y. A wireless lingual feedback device to reduce overpressures of the buttock in seated posture. PLoS ONE 2009, 4, e7550. [Google Scholar] [CrossRef] [PubMed]
  133. Gadgetmac. Available online: http://www.gadgetmac.com/reviews/misfit-shine-review.html (accessed on 14 February 2016).
  134. Best Fitness Gadgets. Available online: www.digitaltrends.com/mobile/best-fitness-trackers-devices-gadgets (accessed on 25 August 2015).
  135. Carbohydrate Counting, Glycemic Index, and Glycemic Load: Putting Them All Together. Available online: http://www.digitaltrends.com/mobile/best-fitness-trackers-devices-gadgets (accessed on 25 August 2015).
  136. Demongeot, J. Recent advances in e-health and perspectives. Stud. Inform. Universalis 2013, 11, 1–17. [Google Scholar]
  137. Hightower, J.; Borriello, G. Location Systems for Ubiquitous Computing. Computer 2001, 47, 57–66. [Google Scholar] [CrossRef]
  138. Axisa, F.; Dittmar, A.; Delhomme, G. Smart clothes for the monitoring in real time and conditions of physiological, emotional and sensorial reaction of human. In Proceedings of the 25th Annual International Conference of the IEEE Engineering in Medicine and Biology Society, Cancun, Mexico, 17–21 September 2003.
  139. Dittmar, A.; Axisa, F.; Delhomme, G.; Gehin, C. New concepts and technologies in home care and ambulatory monitoring. Stud. Health Technol. Inform. 2004, 108, 9–35. [Google Scholar] [PubMed]
  140. Alwan, M.; Dalal, S.; Kell, S.; Felder, R. Derivation of basic human gait characteristics from floor vibrations. In Proceedins of the Summer Bioengineering Conference 03, Key Biscayne, FL, USA, 25–29 June 2003; pp. 231–232.
  141. Vuillerme, N.; Chenu, O.; Pinsault, N.; Fleury, A.; Demongeot, J.; Payan, Y. A plantar-pressure based tongue-placed tactile biofeedback system for balance improvement. Comput. Methods Biomech. Biomed. Eng. 2007, 10, 63–64. [Google Scholar] [CrossRef]
  142. Demongeot, J.; Kulesa, P.; Murray, J.D. Compact set valued flows II: Applications in biological modelling. C.R. Acad. Sc. Série. IIb 1997, 324, 107–115. [Google Scholar] [CrossRef]
  143. Boccia, G.; Dardanello, D.; Rosso, V.; Pizzigalli, L.; Rainoldi, A. Application of sEMG in Aging: A Mini Review. Gerontology 2015, 61, 477–484. [Google Scholar] [CrossRef] [PubMed]
  144. Demongeot, J.; Waku, J. Application of interval iterations to the entrainment problem in respiratory physiology. Phil. Trans. R. Soc. A 2009, 367, 4717–4739. [Google Scholar] [CrossRef] [PubMed]
  145. Queyroy, A.; Couturier, P.; Paramelle, P.J.; Franco, A.; Buguet, A. Virtual thermography as an actimetric tool for bedridden patients. Trav. Sci. Serv. Santé Des. Armées 1996, 17, 255–256. [Google Scholar]
  146. Virone, G.; Vuillerme, N.; Mokhtari, M.; Demongeot, J. Persistent Behaviour in Healthcare Facilities: From actimetric telesurveillance to therapy education. Lect. Notes Comp. Sci. 2014, 8458, 297–311. [Google Scholar]
  147. Vazquez-Buenos Aires, J.; Payan, Y.; Demongeot, J. Electro-stimulation of the tongue as a passive surgical guiding system. In Proceedings of the 11th International Conference on Advanced Robotics, Coimbra, Portugal, 30 June–3 July 2003.
Figure 1. Left: thoracic smart textile devices; Middle: monitoring the integrity of the cardiopulmonary bulbar controller, showing the persistence of the respiratory sinus arrhythmia; Right: recording the cardio-respiratory system through the thoracic device Visuresp® and visualization of the actual rhythm (red) inside the “viable” tube (black) to be regarded for getting a physiologic respiration during rehabilitation.
Information 07 00050 g001
Figure 2. Sensors recording at home door opening (in green), pressure on the ground (white square) and under bottles and glasses (white square with circle inside), room activity with infrared sensors (in red), water (in blue) and electricity consumption (in yellow).
Information 07 00050 g002
Figure 3. Top: data fusion of physiological and physical exo- and endo-sensors detecting gravitational, acoustic, optical, thermal and electromagnetic fields. Bottom: profiling from multi-sensor data fusion and ICF scoring, in order to trigger an alarm in the case of a life-threatening risk.
Information 07 00050 g003
Figure 4. Top: a multi-level classification of obesity factors (adapted from [20]). Bottom: the Overview, Design concepts and Details (ODD) protocol (from [21]).
Information 07 00050 g004
Figure 5. Flow of information through the different phases of the review.
Information 07 00050 g005
Figure 6. Left: inter-individual relationships in a social context. Right: friendship networks in the 6th (12 y) to the 3rd (15 y) class of a French high school. Vertex size is proportional to the friends’ number: normal in blue, obese and overweight in red.
Information 07 00050 g006
Figure 7. Top: actigram showing the mean and standard deviation of the successive lapses of time spent in a room during a nychthemeron (24 successive hours), calculated after 3 weeks within a period of 70 days of observation. Bottom: number of minutes spent in each room in which the tasks corresponding to one action done during the nychthemeron are performed (the example given concerns the kitchen).
Information 07 00050 g007
Figure 8. Elderly person in a smart home. Top: location of different types of sensors (1 bedroom, 2 kitchen, 3 living room, 4 bathroom, 5 toilets, 6 entrance). Medium: control screen on which the caregiver or the family helper can watch the patient’s actogram (inter-room displacement chronogram). Bottom: location of infrared sensors on walls and pressure sensors on the ground. Blue thumbnail process: pressure sensors on a seat and restitution on a smart phone.
Information 07 00050 g008
Figure 9. Functional architecture of the Réseau Vercors Santé (RVS) system. Top left: RVS TV screen allowing data recording (using a dedicated smart remote control replacing the PC) and visualization. Top right: satellite communication system using a gateway decoder through a firewall. Bottom left: local temporary repository of personalized medico-social data in a Decoded Signal Data (DSD) Hoster. Bottom right: remote exchange and storage system of medical, social and paramedical data on a common secured host in charge of triggering simultaneously alarms to medical emergency organizations and to the socio-paramedical coordination.
Information 07 00050 g009
Figure 10. Serious game assessing the conservation of the perception of visual illusions in diabetic retinitis. (a) on the left, Kanizsa pyramid seems to come toward the observer and on the right, it seems to escape the observer; (b) exchequer illusion: the threshold value of the gray level of the umbra is chosen as that for which the observer perceives a gap between the gray levels of the squares A and B; (cf) Kanizsa illusions with different geometric objects (circles on (c)) and triangles on (d–f)), the threshold value of the distance between them being the vanishing of their perception.
Information 07 00050 g010
Figure 11. Left: smart sock by Texisense made of a sensitive textile giving pressure information during a real walk, following progress during the reeducation process. Right: combination of pressure information with an osteo-densitometry study showing the consequences of pathologic running on bone reconstruction.
Information 07 00050 g011
Figure 12. Sample screenshot of the diabetic nutrition game, showing how a menu is composed with a pineapple shrimp entree and the needs of the player in energetic and glycemic charges, in order to respect a predetermined daily activity and to take into account a priori information about his or her nutrition, sport and social individual habits.
Information 07 00050 g012
Figure 13. Top: activities in different rooms of the smart home and daily periods. Middle: scenarios of movements between successive different rooms. Bottom: probability of the occurrence of actions recorded through the number of minutes spent in each room in which the tasks corresponding to these actions are performed.
Information 07 00050 g013
Figure 14. Original device recording the pressure on the buttock (adapted from [143]). Top left: the signal on the watch indicates the left side, opposite to where the pressure is the greatest. Top center: discretization of the information of pressure. Top right: same information given on a smartphone. Bottom: pressure recorder cushion.
Information 07 00050 g014

