Edge Detection Method Based on General Type-2 Fuzzy Logic Applied to Color Images


Tijuana Institute of Technology, Tijuana 22379, Mexico
*
Author to whom correspondence should be addressed.
Information 2017, 8(3), 104; https://doi.org/10.3390/info8030104
Submission received: 1 July 2017
/
Revised: 22 August 2017
/
Accepted: 25 August 2017
/
Published: 28 August 2017
(This article belongs to the Special Issue Fuzzy Logic for Image Processing)
Abstract
:This paper presents a new general type-2 fuzzy logic method for edge detection applied to color format images. The proposed algorithm combines the methodology based on the image gradients and general type-2 fuzzy logic theory to provide a powerful edge detection method. General type-2 fuzzy inference systems are approximated using the α-planes approach. The edge detection method is tested on a database of color images with the idea of illustrating the advantage of applying the fuzzy edge detection approach on color images against grayscale format images, and also when the images are corrupted by noise. This paper compares the proposed method based on general type-2 fuzzy logic with other edge detection algorithms, such as ones based on type-1 and interval type-2 fuzzy systems. Simulation results show that edge detection based on a general type-2 fuzzy system outperforms the other methods because of its ability to handle the intrinsic uncertainty in this problem.
1. Introduction
Edge detection is a fundamental technique in many computer vision and image processing applications, such as pattern recognition, medical image processing, object recognition, and motion analysis. In the past few decades most research has concentrated on designing edge detector algorithms for grayscale images; however, color image processing applications have recently been receiving increasing attention because color images provide more information about the objects in a scene than grayscale images and this information can be used to improve the performance of image processing systems [1]. Edge detection in color images is computationally more complex than in grayscale images, but there are many advantages to using color images. For example, the increase in the amount of information can lead to more accurate object location and the possibility of processing images that are more complex [2].
Various edge detection techniques have been proposed over the years, but the common approach is to apply the first or second derivative. Based on this, the edge detection can be classified as gradient edge detectors (first derivative), Laplacian method (second derivative), or Gaussian edge detectors [3]. In the fuzzy system area, there are edge detection methods that have been developed for grayscale images [4,5,6,7,8]. In Gonzalez et al. [9], an improved method for processing edge detection based on general type-2 fuzzy sets (GT2 FSs) applied to grayscale images is proposed. According with the results presented in [9], the author demonstrated that the edge detection approach based on GT2 FSs outperformed the results obtained by the methods based on interval type-2 fuzzy sets (IT2 FSs), type-1 fuzzy sets (T1 FSs), and of course the traditional edge detection methods.
The contribution of this paper is focused on exploiting the benefits of using digital images in color format and combining this process with GT2 FSs, which has shown satisfactory results in image processing applications; especially, when the image is corrupted by noise, this kind of technique is helpful to handle the uncertainty, so we are proposing a novel method of edge detection based on GT2 FSs to be applied to color images. The process is designed using Lab, HSV, and RGB to show the advantages of using one kind of color format with respect to the others. The inputs and outputs of the fuzzy system are built with Gaussian membership functions (MFs), which have demonstrated good results in these kinds of applications. Moreover, we present a comparative analysis of the results achieved with this edge detection approach versus the results achieved by using TI and IT2 FSs.
The paper is organized as follows. In Section 2 important definitions about GT2 FSs are presented. Section 3 describes the color image edge detector using the gradient approach. Section 4 shows the color image edge detector based on GT2 FSs. In Section 5 the simulation results are presented and explained. Finally, Section 6 offers some conclusions about the results.
2. Fuzzy Logic Systems
Fuzzy sets theory was introduced by Lofti A. Zadeh in 1965 [10]. Fuzzy sets provide a way to model the uncertainty associated with vagueness, imprecision, and lack of information regarding a problem. The uncertainty arises from ignorance due to a lack of knowledge, from randomness, or from vagueness, like the fuzziness existing in human language [10,11]. In recent years we have witnessed a rapid growth in a number of applications of fuzzy logic in various areas, such as pattern recognition, neural networks, expert systems, artificial intelligence, theory control, automata theory, computer science, decision making, medical diagnosis, and robotics, to name a few. In digital image processing, which is the area of interest of this paper, there are some applications, like in edge detection [5,6,8], noise filtering [12,13], feature extraction [14], classification and clustering [2], and it also has been applied in video processing such as in background/foreground separation, and in 3D computer vision [15,16,17].
Advances in fuzzy sets theory have made it possible to research and apply more complex forms of fuzzy systems. In addition, great progress has been made in transitioning from traditional type-1 FS to interval type-2 FS [18,19,20,21], and recently there has been a growing interest in general type-2 FS [22,23,24,25].
In what follows, we introduce the basic concepts and properties about general type-2 FS and the α-planes representation, which are important because the main contribution of this paper is based on the use of these concepts.
2.1. Definition of General Type-2 Fuzzy Sets
A general type-2 fuzzy set (GT2 FS) , can be represented by Equation (1) [22,24]:
where is the universe for the primary variable of , . The 3D membership function is usually denoted by , where and and . If is continuous it can be expressed as
where ∫∫ denotes the union over all admissible and . For discrete universes of discourse, can be denoted by Equation (3):
In Equations (1)–(3) is called the secondary variable, and has the domain at each . When for and then is called an interval type-2 fuzzy set (IT2 FS).
At each point of , say , the 2D plane whose axes are and is called a vertical slice of . A secondary membership function is a vertical slice of , i.e.,
In Equation (4) is the subset of that is the support of , and is called the primary membership of . The amplitude of the secondary membership function , is called the secondary grade or secondary set.
The two-dimensional support of is called the footprint of uncertainty (FOU) of , i.e.,
can also be expressed as the union of all primary memberships, i.e.,
2.2. General Type-2 Fuzzy Sets Representation
In order to limit the complexity of general type-2 fuzzy logic, several efforts have been proposed; for example, Wagner and Hagras [1,26] have introduced the zSlices representation, and Mendel and Liu [23,27,28] have put forward a representation based on the α-plane concept, both of which enable the representation of, and computation with, general type-2 fuzzy sets.
An α-plane for the GT2 FS , denoted by , is the union of all primary memberships functions of whose secondary grades are greater than or equal to [24]. The equation of the α-plane is represented by Equation (7):
3. Edge Detection Process Based on the Gradient Approach
The edge detection process in a digital image consists in identifying the pixels, where the brightness changes dramatically or has discontinuities with respect with their neighbor pixels. There exist some approaches to perform the edge detection process; the majority are based on image gradients, which are calculated with the first derivative of an image. The most important and most used methods based on the image gradients are from Kirsch [29], Sobel [30], Prewitt [31], and Canny [32]. In these techniques the Euclidean distance is used to calculate the image gradients in conjunction with a kernel [33].
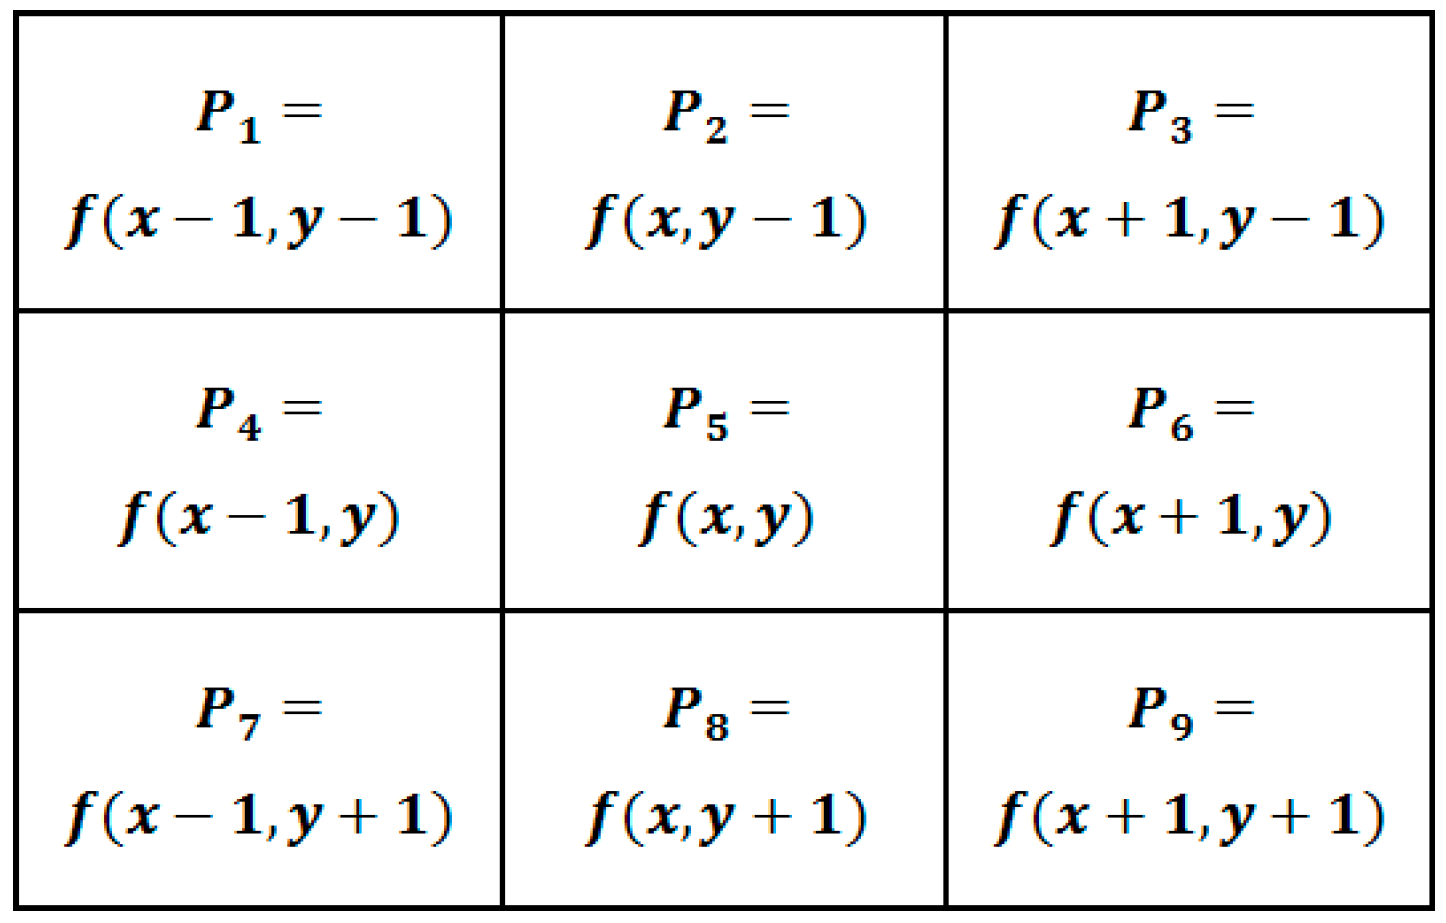
The edge detection method presented in this paper consists of calculating the image gradients with the Euclidean distance, but without using any kernel. This process consists of obtaining four image gradients based on a 3 × 3 matrix to indicate the edge direction (Figure 1). Each matrix position of Figure 1 is represented in Figure 2, where represents the image, x-axis the columns and y-axis the rows. According with these positions, the Euclidean distance is applied to calculate the gradients using the expressions illustrated in Figure 3a–d and the gradient magnitude or the output gradient is obtained with the aggregation of the four gradients .
Gradient Approach Edge Detection Applied on Color Format Images
In the literature we commonly find edge detection methods applied on grayscale format images (two-dimensional images); this is because the computational complexity is reduced, but the image could lose information when it is captured in color format and it is changed to grayscale to be processed. The aim of this paper is to perform the edge detection process using images in color.
There exist several models to represent color images; of the most used we could mention the HSV model, the Lab model, the RGB model, the CMY color model, the YUV model, the HIS color model, the CMYK color model [33,34,35], etc. In this paper the edge detection method is applied on the HSV, Lab, and RGB color models. HSV stands for hue, saturation, and value (brightness); it is the most common model in computer vision applications. Lab color space is a three-axis color system with the dimensions L for lightness and a and b for color; working with the Lab color space includes all of the colors in the spectrum, as well as colors outside of human perception. In the RGB model, an image consists of three independent image planes, one in each of the primary colors: red, green and blue; so, this model can be considered the fundamental color representation in computers, digital cameras, and scanners.
To apply the gradient approach on a color format image (Lab, HSV, and RGB), we need to calculate the four gradients (Steps 5 to 8), and after that the gradient magnitude (Step 11) for each channel and finally the output edge (Step 16). Considering that the Lab, HSV, and RGB color formats, the gradients are calculated for three channels. The step to process this is described in the following pseudocode:
| Pseudocode to calculate the gradients for each channel of a color format image . | |
| Input. The color format image where is the rows size of the image, the columns size and the channel number; d = 1, 2, 3. | |
| Output. The gradients , the gradient magnitude for each channel of the image (f), and the output edge (Edge). | |
| 1: | Calculate the for each channel to obtain |
| 2: | for d = 1 to 3 |
| 3: | for x = 2 to |
| 4: | for y = 2 to |
| 5: | |
| 6: | |
| 7: | |
| 8: | |
| 9: | end |
| 10: | end |
| 11: | |
| 12: | Normalize the Gradient in values between {0, 1} |
| 13: | , where min and max represent the maximum and minimum pixel value of , respectively |
| 14: | end |
| 15: | Calculate the output edge (Edge) |
| 16: | |
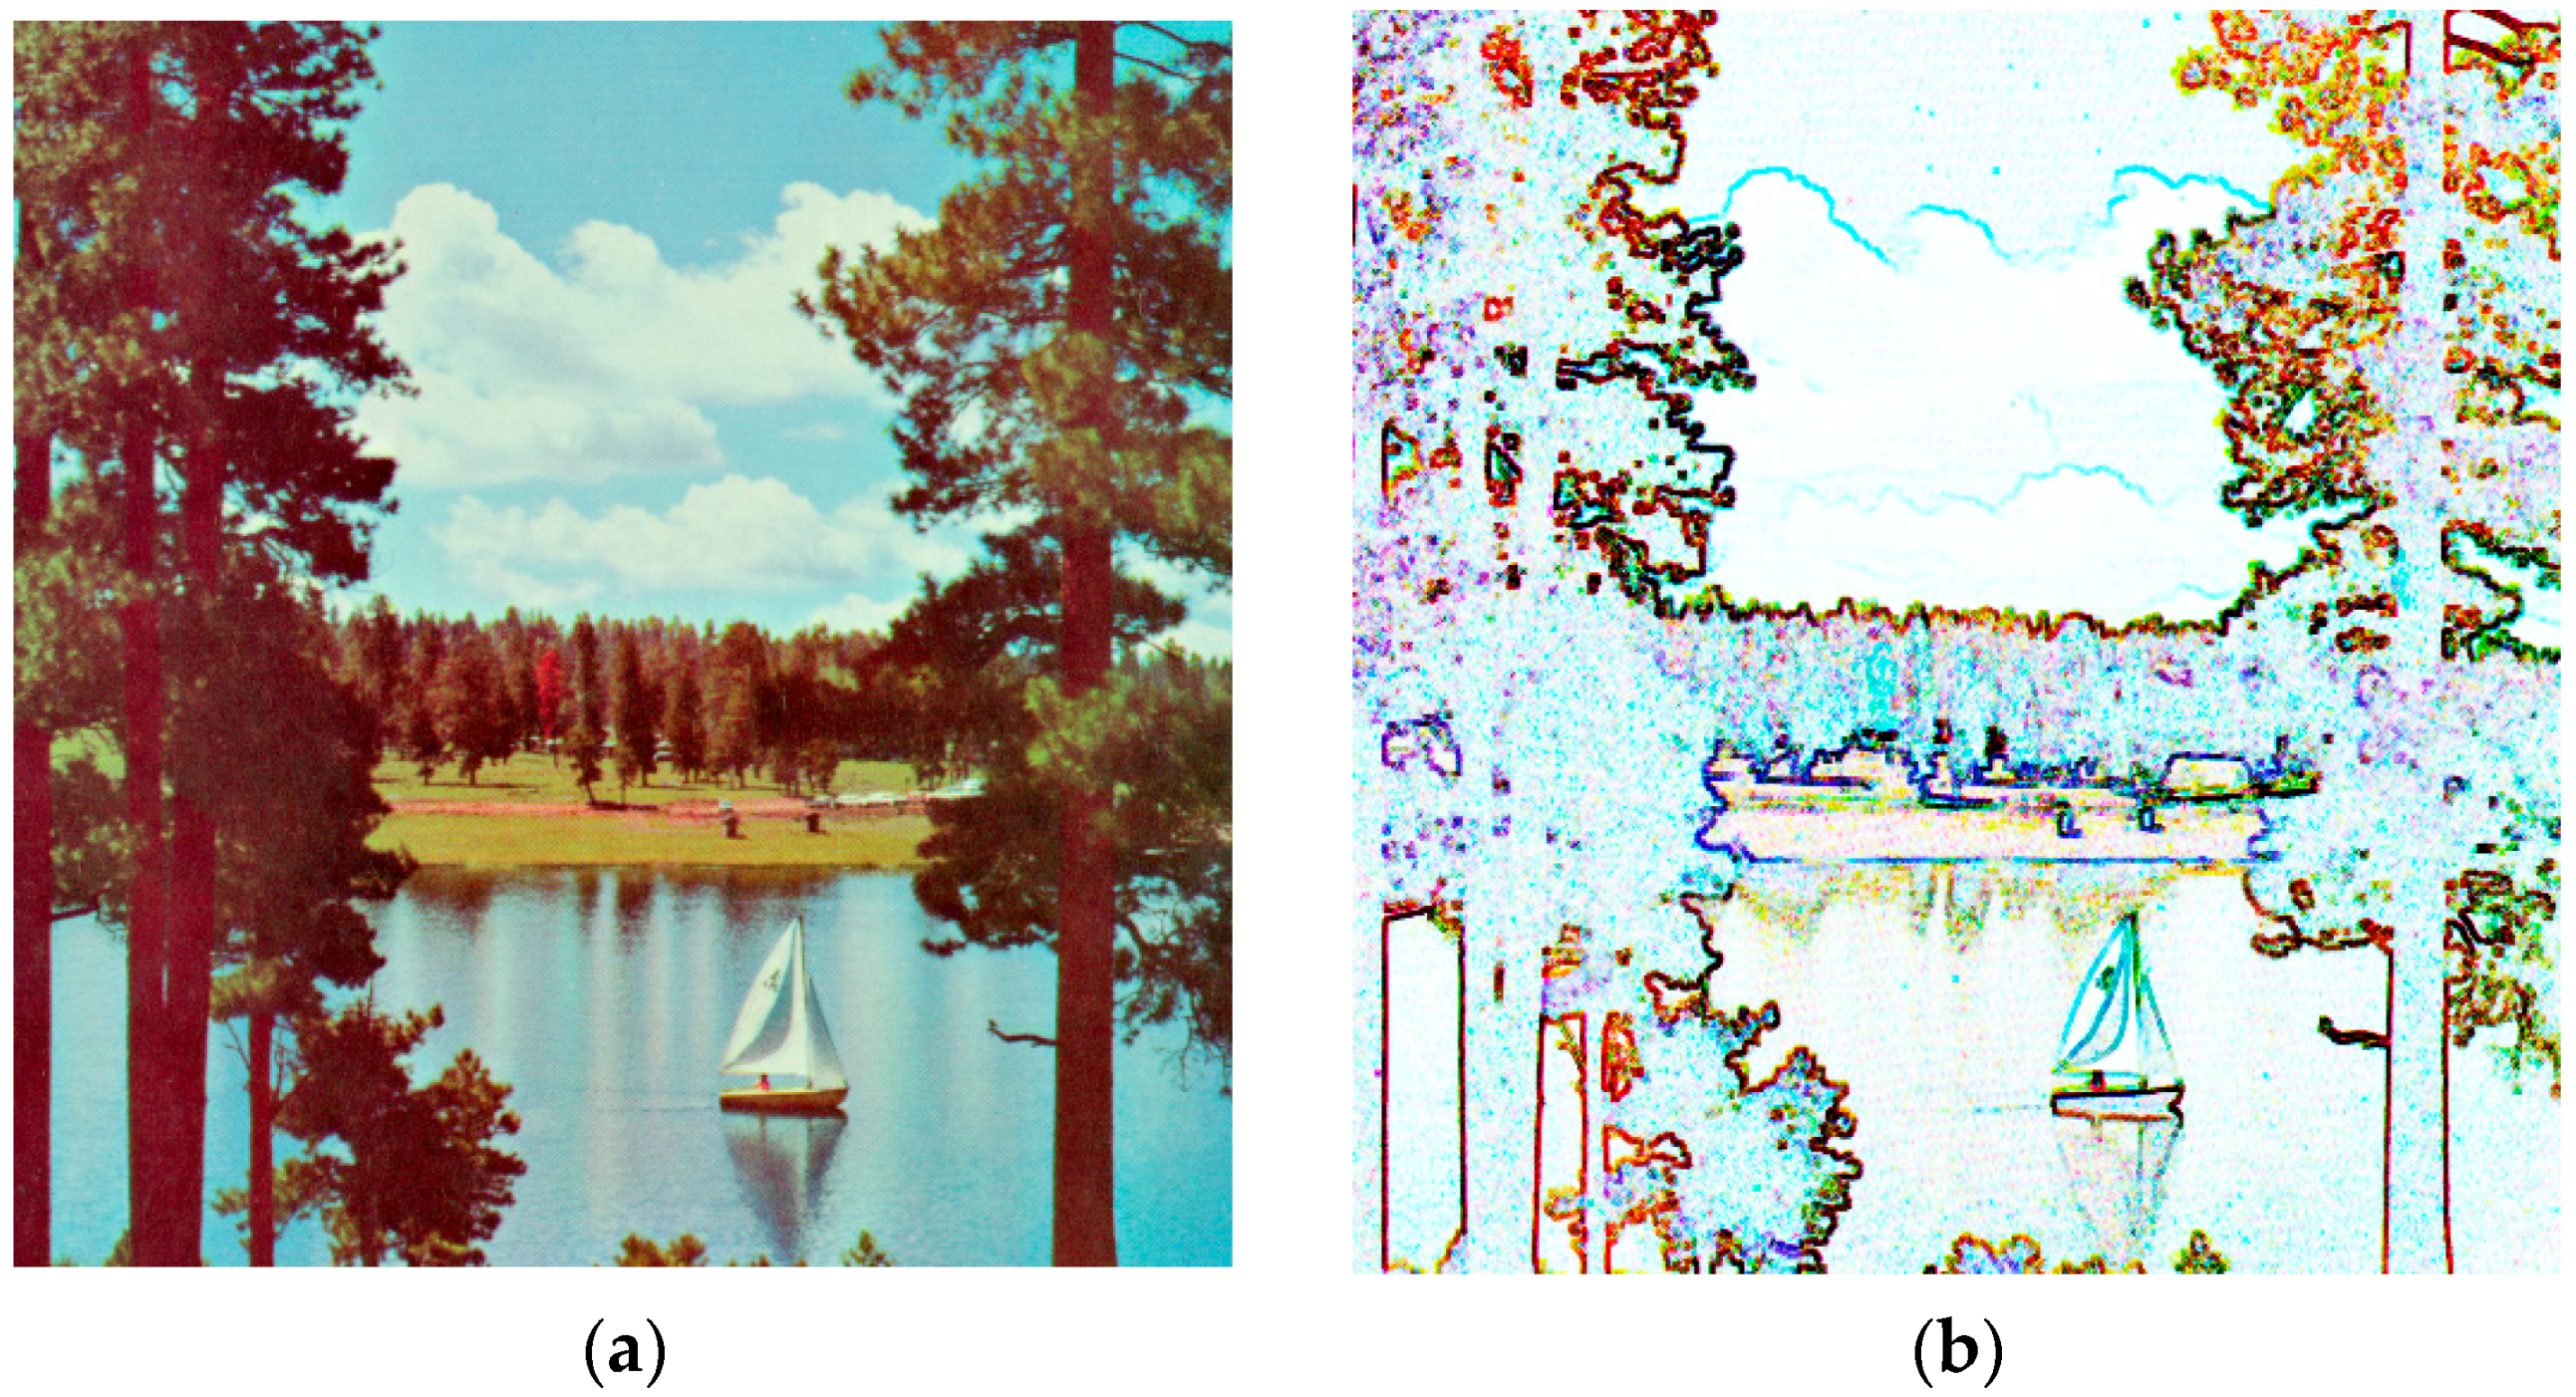
An example of the output achieved by the previous pseudocode is illustrated in Figure 4.
4. Edge Detection Process Based on the Gradient Approach and GT2 FS
This section presents an edge detection method based on the gradient approach combined with GT2 FSs to be applied on color format images (Lab, HSV, and RGB). The motivation of using GT FSs in the proposed edge detection method is to provide the ability to handle higher degrees of uncertainty in the edge detection process for color format images.
The methodology to develop the proposed method consists of three steps. At first, the input color image is separated into channels. Secondly, the gradient approach is applied in each single channel to obtain the four gradients ; these gradients are calculated with the Steps 5 to 8 of the pseudocode presented in Section 3. Finally, the 12 (four for each channel) gradients previously obtained are identified as and these are used as the inputs to the GT2 FSs.
The GT2 fuzzy system is a singleton Mamdani type, which was approximated using α-planes [24,27], where each α-plane centroid was computed by the Karnik–Mendel algorithm [19]. In more detail, the GT2 FSs was designed with 12 inputs and three outputs to generate the gradient magnitude for each image channel. According to the pseudocode presented in Section 3, the are calculated with the aggregation (Step 11) of the four gradients obtained in each channel. In the proposed method, the idea is to eliminate this step, and the values are inferred directly with a GT2 fuzzy system.
The inputs and outputs are fuzzified using GT2 Gaussian membership functions with uncertain mean (gausmgausstype2), each input has three linguistic values (low, middle, and high) to determine the grade that the evaluated gradient correspond to be the output edge. Each output is granulated in two linguistic values (background and edge) to produce the gradient magnitude for each color image channel and the combination of these generates the output color edge detection.
The parameters required for the GT2 MFs (gausmgausstype2) are expressed in Equation (8), and these are calculated depending of the image gradient values, i.e., considering the image of Figure 4a, the parameters are obtained with Equations (9) to (14).
low = min(Di)
high = max(Di)
medium = low + (high − low)/2
σ = high/4
m1 = high
m2 = m1 + (m1*FOU), where FOU is in (0, 1)
In Figure 5 an example of the membership functions for the inputs are illustrated, where the parameters were calculated with the previous equations. These inputs correspond to the first channel of the color image. The output for the first channel is shown in Figure 6.
Another important part of a fuzzy inference system is the fuzzy rules; for this proposed method the fuzzy rules were designed considering different combinations of the gradients obtained from the different channels of the color images to infer the gradient magnitude (outputs) for each image channel . In our approach, the fuzzy rules were separately combined according to the color image channel, based on experimental results and human experts in this kind of applications, with the idea of reaching the best accuracy edge detection with a minimum number of rules. After several tests, the best performance was obtained by the set of nine fuzzy rules presented in Table 1; these fuzzy rules represent the knowledge about the edge detection process.
5. Experimental Results
This section presents the edge detection accuracy and noise robustness achieved by the proposed method based on the gradient technique and GT2 FSs (explained in Section 4) when this is applied on color images in the Lab, HSV, and RGB formats. The experiments were applied on the image database presented in Table 2 and the performance of the proposed method is compared with two other fuzzy edge detection approaches (T1 and IT2 FSs), and with the two classic methods (Canny and Sobel).
The performance is measured by using the figure of merit of Pratt (Figure of Merit; FOM) [36]; where the FOM is a useful metric for assessing the quality of edge detectors, which consists of evaluating the distance between two images—the first represents the output edges obtained by the proposed method (GT2 fuzzy edge detector) and the second is a reference image or the ground truth (in Table 2). The output measure varies in the range [0, 1], where 1 is the optimal value, i.e., the output edges are similar with respect to the reference image.
Fuzzy Edge Detection Method Applied on the Synthetic Color Images
In the first test, the fuzzy edge detection methods based on T1, IT2, and GT2 FSs were applied on the image database presented in Table 2. These images were converted to the Lab, HSV, and RGB color formats in order to analyze the advantage of using one format color over the others.
In Table 3 the FOM values achieved by the T1 FSs edge for the Lab, HSV, and RGB formats are presented.
The results achieved by the IT2 fuzzy edge detection for the Lab, HSV, and RGB color format images are shown in Table 4.
The FOM values achieved by the proposed method based on GT2 FSs are presented in Table 5.
In Table 6, a summary of Table 3, Table 4 and Table 5 is presented and we also include the results achieved by the Canny and Sobel edge detection methods. According to these results, we can conclude that the edge detection method based on IT2 FSs achieved better FOM values than the T1 FSs for the three different color formats. Nevertheless, the proposed method based on GT2 FSs improved most of the results in comparison with the IT2 FSs, T1 FSs, Canny, and Sobel methodologies; additionally, we can notice that the FOM values obtained by the Sobel operator are the lowest, followed by those of the Canny method.
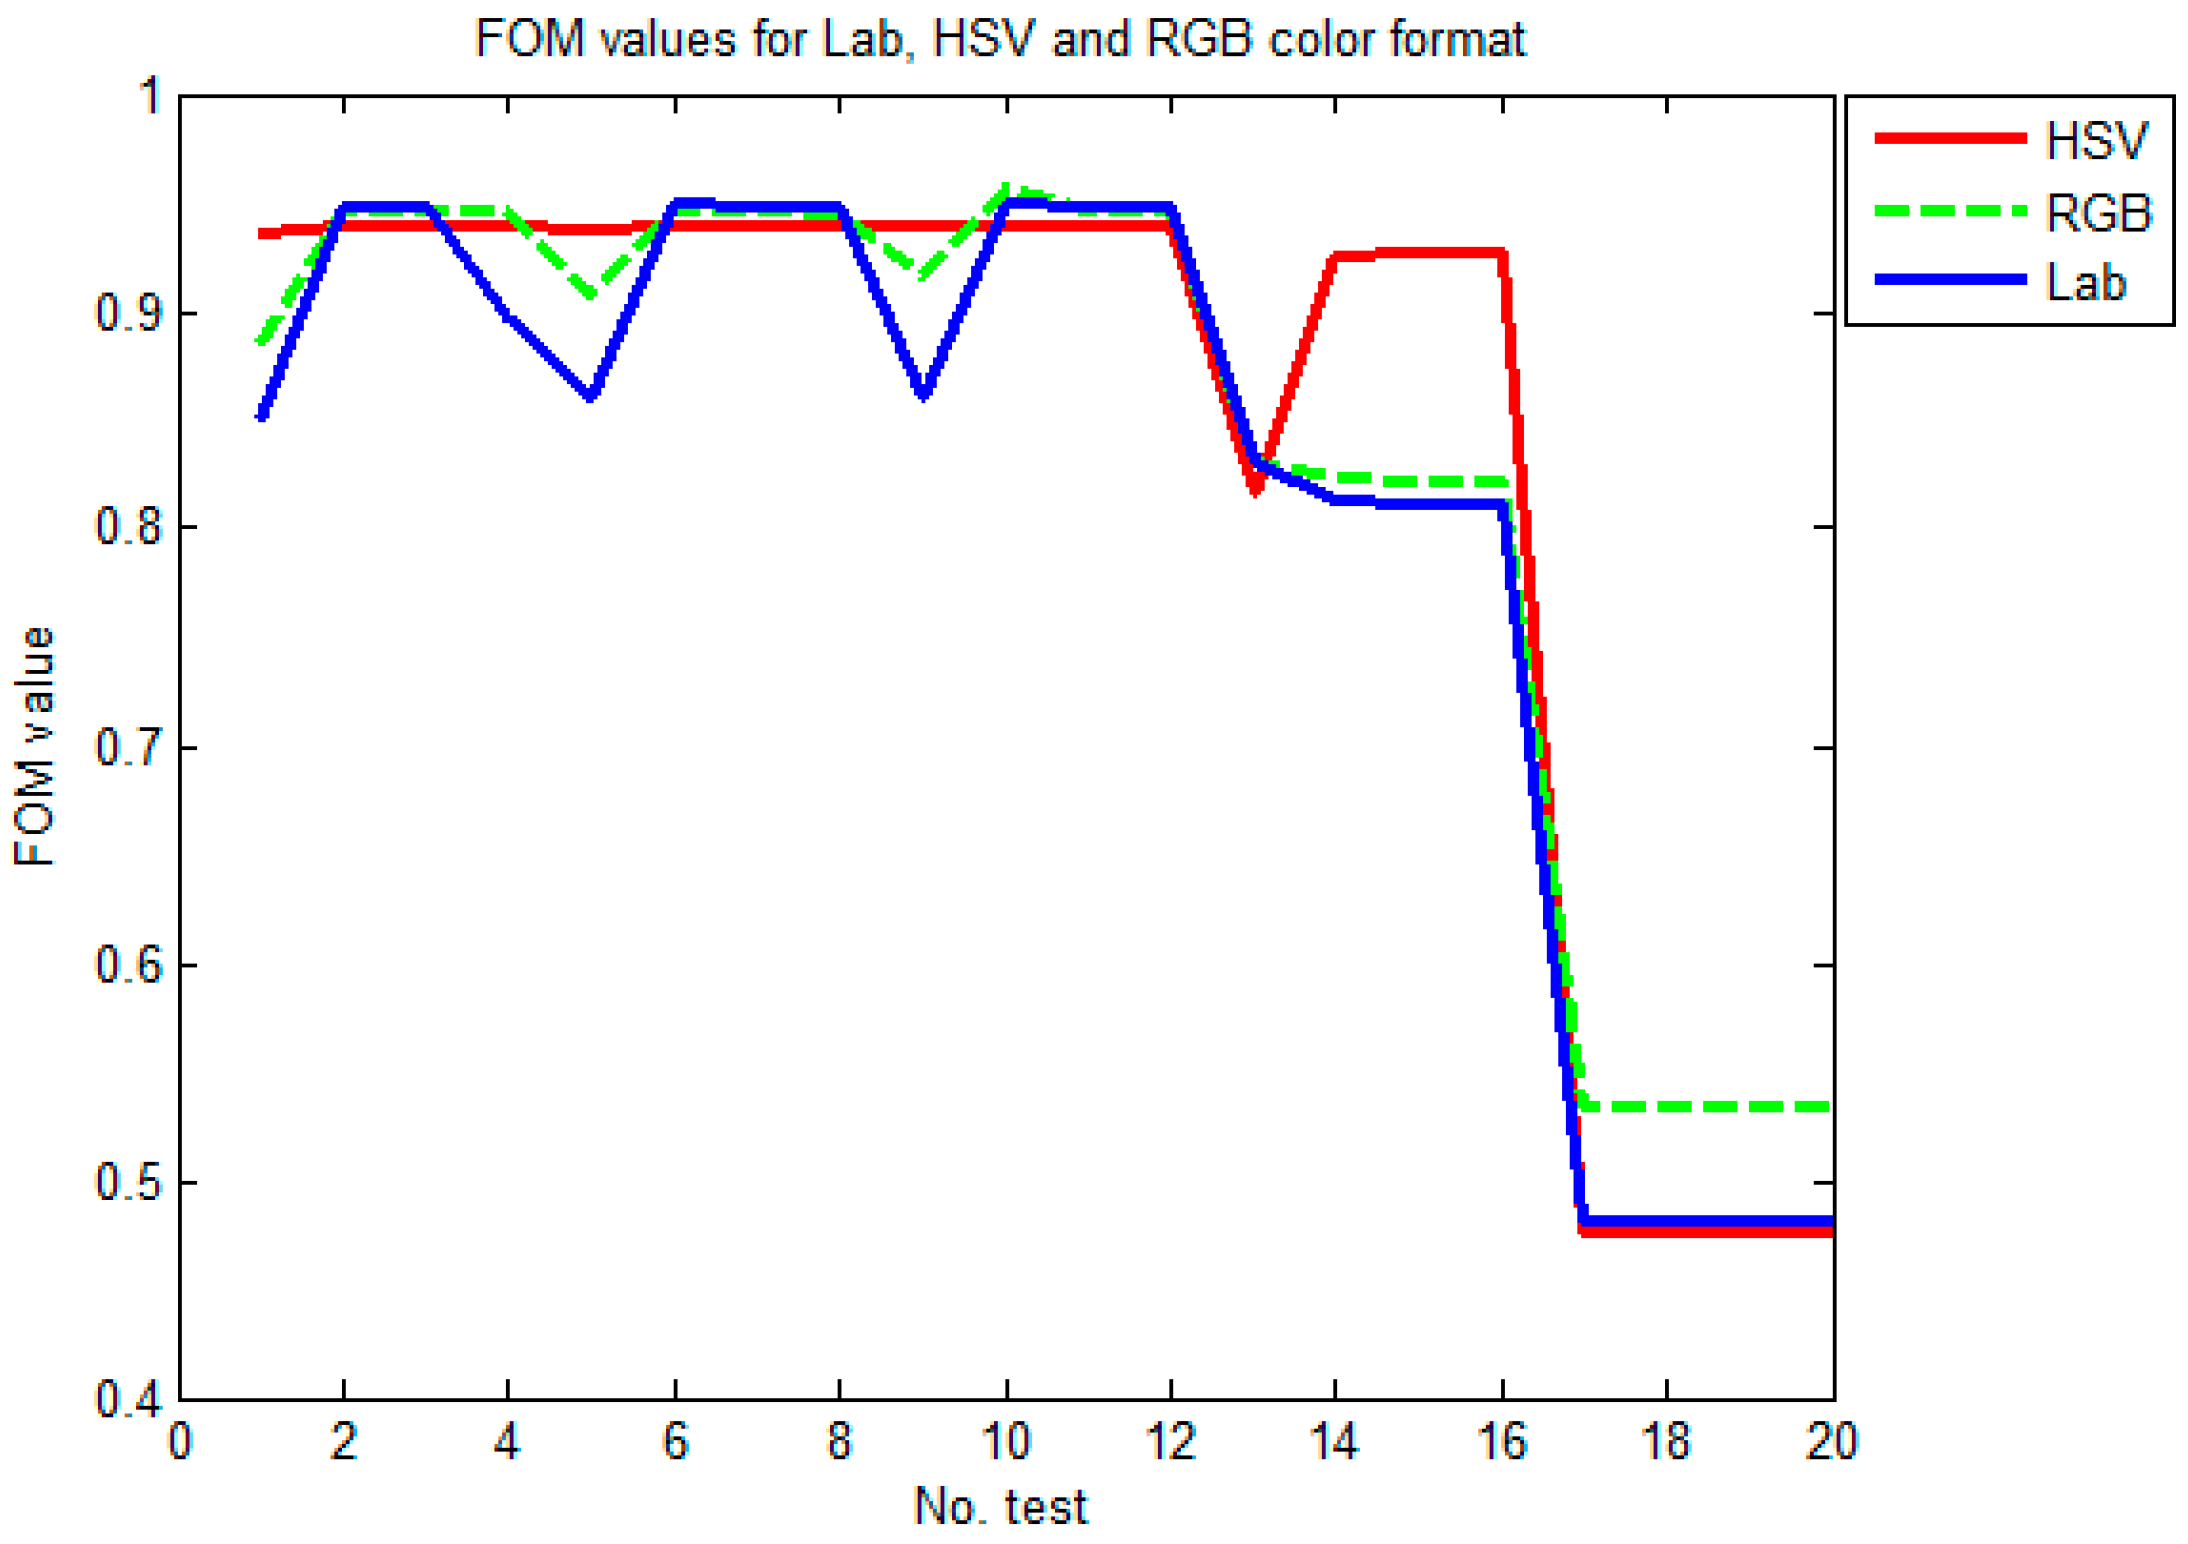
An interesting finding in Table 6 is that, according to the FOM values, four of the five methods achieved better results when the Lab color format was used; this means that the Lab format provides more information about the image, which is a good point to consider in image processing applications, especially those that work with the edge detection process. In Figure 7, we present a plot of the FOM values achieved by the three different fuzzy edge detection methods when these are applied over the Lab, HSV, and RGB formats; we can see the advantage of using the Lab color format in this kind of application.
In order to evaluate the ability of the fuzzy techniques to handle the uncertainty (noise) of the images of Table 2, they were corrupted using Gaussian noise levels (20, 30, 40, and 50 dBi). In Table 7, Table 8 and Table 9 we present the FOM average value achieved by the T1, IT2, and GT2 FSs edge detection after these were applied on Lab, HSV, and RGB images.
From Table 7 (T1 FSs) we see that for images with Gaussian noise of 20 dBi, the FOM value (0.9367) was better in the HSV color format. For 30 and 40 dBi the FOM values (0.9489, 0.9485) were better with the Lab color format; for 50 dBi the FOM result (0.9457) was higher using the RGB color format.
From Table 8 (IT2 FSs) we observe that for the images with 20 dBi of Gaussian noise, the HSV color format has a better FOM value (0.9385); however, for 30, 40, and 50 dBi the FOM values were higher in the Lab format.
In Table 9, the simulation results after applying the GT2 FS edge detection on images with Gaussian noise are presented. In these results we notice that the FOM value (0.9392) was better when the HSV color format was used under a noise level of 20 dBi; for 40 and 50 dBi the FOM values (0.9491, 0.9489) were better using the Lab color format; in this test the RGB format has higher FOM for a noise level of 30 dBi (0.9563).
Finally, we present a comparative analysis in which the results are classified by color format. In Table 10, Table 11 and Table 12 we present the results achieved by the three fuzzy edge detection methods and two traditional methods (Canny and Sobel) when these are applied on Lab, HSV, and RGB color format images, respectively. According to the results of Table 10, the FOM values were better when the GT2 FS was applied for the different noise levels (20, 30, 40, and 50 dBi). Moreover, in Table 11 (HSV) and Table 12 (RGB) we notice that the GT2 FSs also improved the results, obtaining the best FOM accuracy. Additionally, we notice that the Sobel method achieved the lowest results for all the cases, followed by Canny; this means that the traditional methods do not have additional parameters to handle uncertainty, which is the advantage of using fuzzy techniques in this kind of application.
In Figure 8, we present a plot to illustrate the FOM values by color format obtained by the five edge detection methods when these are applied in images with noise; in this figure we cannot observe clearly the difference, and for this reason we calculate the mean for each format color. For Lab color we obtained a FOM mean of 0.8126, for HSV a FOM mean of 0.8385, and for RGB a mean value of 0.8333. Therefore, for these tests we conclude that when the images are corrupted by noise, the HSV color format represents a good option, followed by the RGB color format.
The visual edge detections for T1, IT2, and GT2 FSs are presented in Table 13. Of course, graphically we cannot clearly appreciate the difference in the detected edges and for this reason the FOM measure was applied, but tests support the conclusion that GT2 FSs can outperform IT2 and T1 in edge detection process.
6. Conclusions
In this paper we presented an edge detection approach based on the gradient technique combined with three fuzzy approaches (T1, IT2, and GT2 FSs), where the main aim was to show the advantage of using GT2 FSs in image processing systems and analyze their performance with respect to the higher uncertainty levels. In general, we can conclude that the edge detection based on GT2 Fs has a good control on the image gradients in images with noise and without noise for the different color formats.
On the other hand, different color format images were analyzed (Lab, HSV, and RGB) and, according to the FOM metric, based on the simulation results in images without noise the fuzzy edge detection approaches were better for images in Lab color format, followed by the RGB format; the lowest performance was from the HSV color format. In images with noise, the performance was better for the HSV format and worst for the Lab format. This represents an important and helpful characteristic to be considered when we are working with this kind of application.
In future work the idea is to improve the fuzzy system using a metaheuristic to optimize the main components of the GT2 FSs, such as the type of MF, the parameters of the MF, and of course the fuzzy rules; in addition, the next goal will be improving the GT2 FSs method to reduce the computing time for achieving faster results, which is required in this kind of area for real-world application.
Author Contributions
Claudia I. Gonzalez proposed the idea of color images and implemented the software, as well as made the experiments. Patricia Melin proposed the general idea of type 2 edge detection and verified the correctness of implementation and results. Oscar Castillo verified the correctness of type-2 fuzzy logic implementation and the writing of the paper.
Conflicts of Interest
The authors declare no conflict of interest.
References
- Torre, V.; Poggio, T.A. On Edge Detection. IEEE Trans. Pattern Anal. Mach. Intell. 1986, 8, 147–163. [Google Scholar] [CrossRef] [PubMed]
- Koschan, A.; Abidi, M. Detection and classification of edges in color images. IEEE Signal Process. Mag. 2005, 22, 64–73. [Google Scholar] [CrossRef]
- Bhardwaja, S.; Mittalb, A. A Survey on Various Edge Detector Techniques. Procedia Technol. 2012, 4, 220–226. [Google Scholar] [CrossRef]
- Biswas, R.; Sil, J. An Improved Canny Edge Detection Algorithm Based on Type-2 Fuzzy Sets. Procedia Technol. 2012, 4, 820–824. [Google Scholar] [CrossRef]
- Bustince, H.; Barrenechea, E.; Pagola, M.; Fernandez, J. Interval-valued fuzzy sets constructed from matrices: Application to edge detection. Fuzzy Sets Syst. 2009, 160, 1819–1840. [Google Scholar] [CrossRef]
- Melin, P.; Gonzalez, C.I.; Castro, J.R.; Mendoza, O.; Castillo, O. Edge-Detection Method for Image Processing Based on Generalized Type-2 Fuzzy Logic. IEEE Trans. Fuzzy Syst. 2014, 22, 1515–1525. [Google Scholar] [CrossRef]
- Melin, P.; Mendoza, O.; Castillo, O. An improved method for edge detection based on interval type-2 fuzzy logic. Expert Syst. Appl. 2010, 37, 8527–8535. [Google Scholar] [CrossRef]
- Tao, C.; Thompson, W.; Taur, J. A fuzzy if-then approach to edge detection. In Proceedings of the Second IEEE International Conference on Fuzzy Systems, San Francisco, CA, USA, 28 March–1 April 1993; pp. 1356–1360. [Google Scholar]
- Gonzalez, C.I.; Melin, P.; Castro, J.R.; Mendoza, O.; Castillo, O. An improved sobel edge detection method based on generalized type-2 fuzzy logic. Soft Comput. 2016, 20, 773–784. [Google Scholar] [CrossRef]
- Zadeh, L.A. Fuzzy Sets; Academic Press Inc.: Amsterdam, The Netherlands, 1965; Volume 8. [Google Scholar]
- Zadeh, L.A. The concept of a linguistic variable and its application to approximate reasoning—I. Inf. Sci. 1975, 8, 199–249. [Google Scholar] [CrossRef]
- Schulte, S.; De Witte, V.; Kerre, E.E. A Fuzzy Noise Reduction Method for Color Images. IEEE Trans. Image Process. 2007, 16, 1425–1436. [Google Scholar] [CrossRef] [PubMed]
- Yuksel, M.E.; Basturk, A. Application of Type-2 Fuzzy Logic Filtering to Reduce Noise in Color Images. IEEE Comput. Intell. Mag. 2012, 7, 25–35. [Google Scholar] [CrossRef]
- Teruhisa, S.; Futoki, S.; Hiroshi, K.; Toshiaki, O. Application of an edge detection method to satellite images for distinguishing sea surface temperature fronts near the Japanese coast. Remote Sens. Environ. 2005, 98, 21–34. [Google Scholar]
- El Baf, F.; Bouwmans, T.; Vachon, B. Type-2 Fuzzy Mixture of Gaussians Model: Application to Background Modeling. Int. Sympos. Vis. Comput. 2008, 2008, 772–781. [Google Scholar]
- Guo, Y.; Ji, Y.; Zhang, J.; Gong, S.; Liu, C. Robust Dynamic Background Model with Adaptive Region Based on T2FS and GMM. In International Conference on Knowledge Science, Engineering and Management; Springer: Cham, Cambodia, 2015; Volume 9403, pp. 764–770. [Google Scholar]
- Zhao, Z.; Bouwmans, T.; Zhang, X.; Fang, Y. A Fuzzy Background Modeling Approach for Motion Detection in Dynamic Backgrounds. Multimed. Signal Process. Commun. Comput. Inf. Sci. 2012, 346, 177–185. [Google Scholar]
- Karnik, N.N.; Mendel, J.M.; Liang, Q. Type-2 fuzzy logic systems. IEEE Trans. Fuzzy Syst. 1999, 7, 643–658. [Google Scholar] [CrossRef]
- Liang, Q.; Mendel, J. Interval type-2 fuzzy logic systems: Theory and design. IEEE Trans. Fuzzy Syst. 2000, 8, 535–550. [Google Scholar] [CrossRef]
- Mendel, J. Uncertain Rule-Based Fuzzy Logic Systems: Introduction and New Directions; Prentice-Hall: Upper-Saddle, NJ, USA, 2001. [Google Scholar]
- Mendel, J.M. Advances in type-2 fuzzy sets and systems. Inf. Sci. 2007, 177, 84–110. [Google Scholar] [CrossRef]
- Hao, M.; Mendel, J.M. Similarity measures for general type-2 fuzzy sets based on the α-plane representation. Inf. Sci. 2014, 277, 197–215. [Google Scholar] [CrossRef]
- Liu, F. An efficient centroid type-reduction strategy for general type-2 fuzzy logic system. Inf. Sci. 2008, 178, 2224–2236. [Google Scholar] [CrossRef]
- Mendel, J.M. General Type-2 Fuzzy Logic Systems Made Simple: A Tutorial. IEEE Trans. Fuzzy Syst. 2014, 22, 1162–1182. [Google Scholar] [CrossRef]
- Wagner, C.; Hagras, H. Toward general type-2 fuzzy logic systems based on zSlices. IEEE Trans. Fuzzy Syst. 2010, 18, 637–660. [Google Scholar] [CrossRef]
- Wagner, C.; Hagras, H. Employing zSlices based general type-2 fuzzy sets to model multi level agreement. In Proceedings of the IEEE Symposium on Advances in Type-2 Fuzzy Logic Systems (T2FUZZ), Paris, France, 11–15 April 2011; pp. 50–57. [Google Scholar]
- Mendel, J.M.; Liu, F.; Zhai, D. α-Plane representation for type-2 fuzzy sets: Theory and applications. IEEE Trans. Fuzzy Syst. 2009, 17, 1189–1207. [Google Scholar] [CrossRef]
- Mendel, J.M. Comments on alpha-plane representation for type-2 fuzzy sets: Theory and applications. IEEE Trans. Fuzzy Syst. 2010, 18, 229–230. [Google Scholar] [CrossRef]
- Kirsch, R. Computer determination of the constituent structure of biological images. Comput. Biomed. Res. 1971, 4, 315–328. [Google Scholar] [CrossRef]
- Sobel, I. Camera Models and Perception. Ph.D. Thesis, Stanford University, Stanford, CA, USA, 1970. [Google Scholar]
- Prewitt, J.M.S. Object Enhancement and Extraction; Lipkin, B.S., Rosenfeld, A., Eds.; Picture Analysis and Psychopictorics; Academic Press: New York, NY, USA, 1970; pp. 75–149. [Google Scholar]
- Canny, J. A computational approach to edge detection. IEEE Trans. Pattern Anal. Mach. Intell. 1986, 8, 679–698. [Google Scholar] [CrossRef] [PubMed]
- Gonzalez, R.C.; Woods, R.E.; Eddins, S.L. Digital Image Processing Using Matlab; Prentice Hall: Upper-Saddle, NJ, USA, 2004. [Google Scholar]
- Kulkarni, A.D. Computer Vision and Fuzzy Neural Systems; Prentice Hall: Upper-Saddle, NJ, USA, 2001. [Google Scholar]
- Pratt, W.K. Digital Image Processing, 2nd ed.; John Wiley & Sons, Inc.: New York, NY, USA, 1991. [Google Scholar]
- Abdou, I.A.; Pratt, W. Quantitative design and evaluation of enhancement/thresholding edge detectors. Proc. IEEE 1979, 67, 753–766. [Google Scholar] [CrossRef]
Figure 1.
3 × 3 matrix to indicate direction of the four gradients .
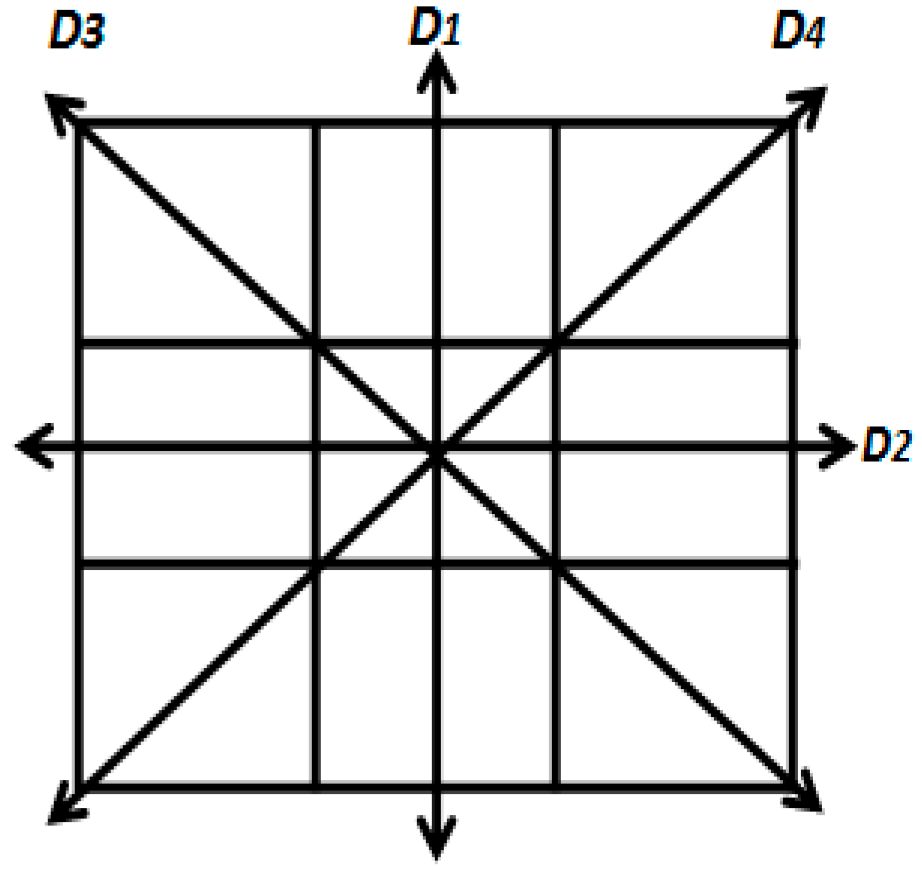
Figure 2.
Matrix position.

Figure 3.
Positions to calculate the gradients D1, D2, D3, and D4.
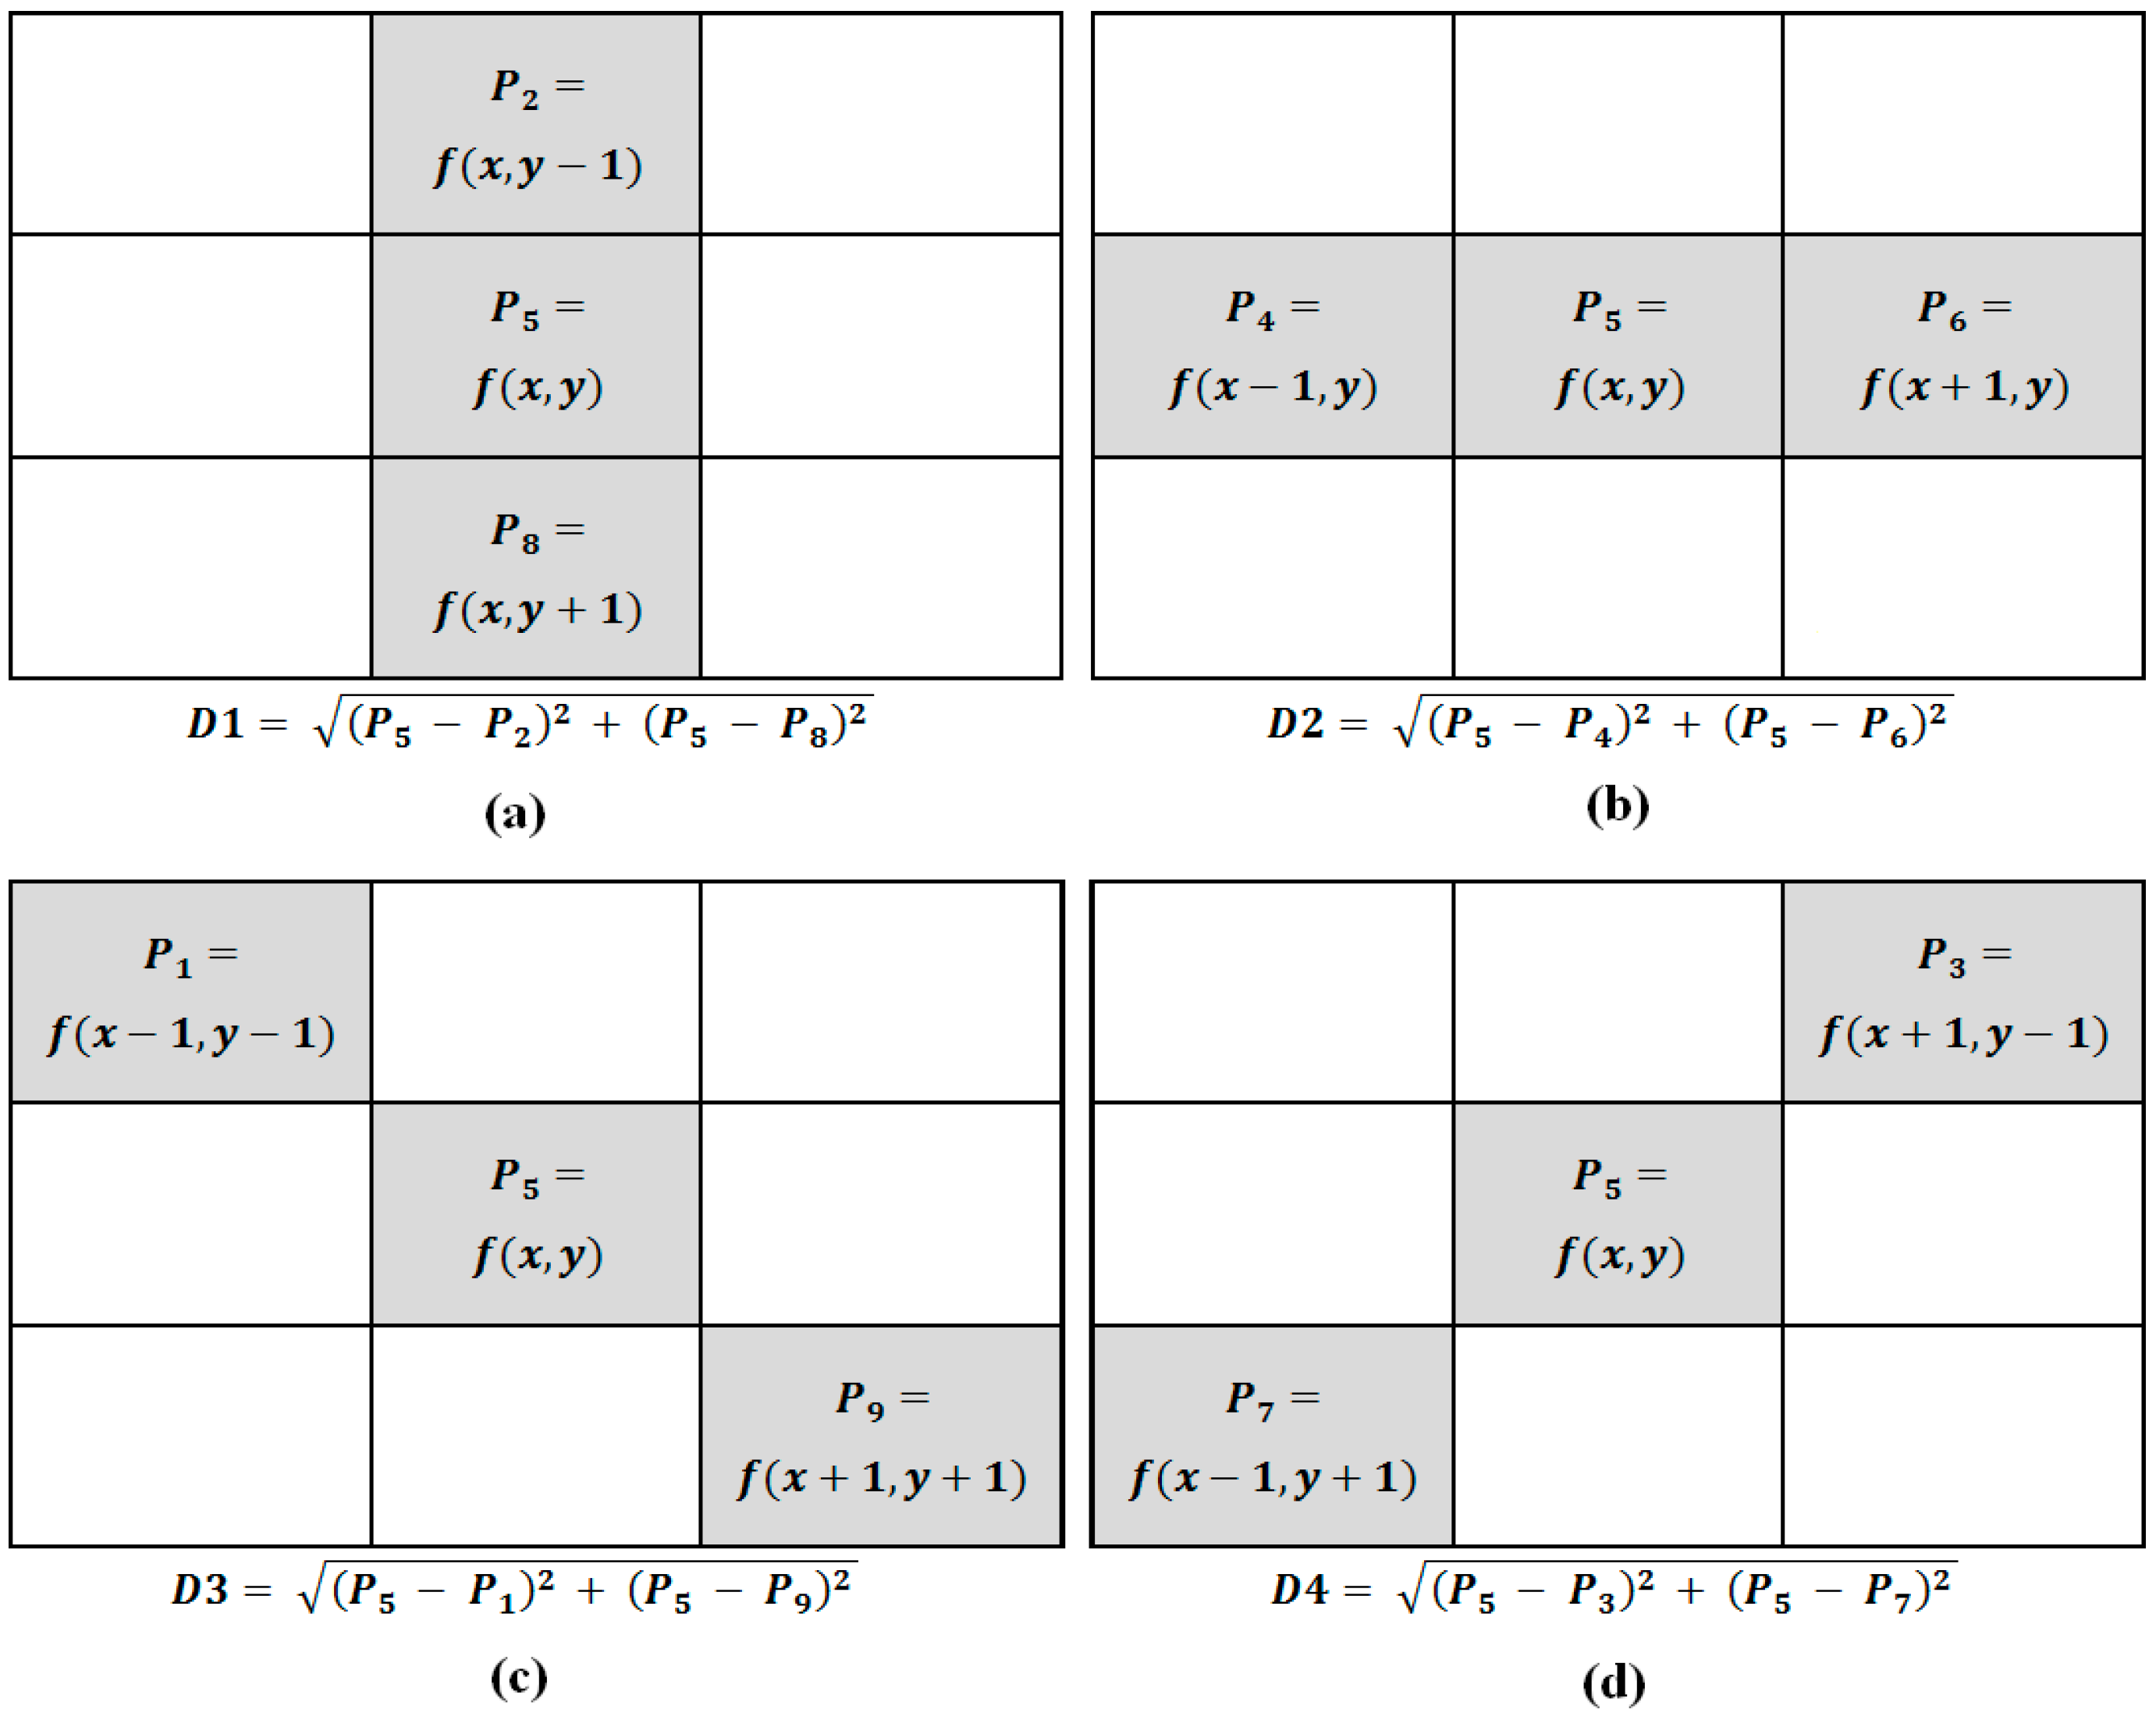
Figure 4.
Output color edge detection based on the gradient approach. (a) Input image; (b) edge detection output.
Figure 4.
Output color edge detection based on the gradient approach. (a) Input image; (b) edge detection output.

Figure 5.
GT2 input membership function for the variables .
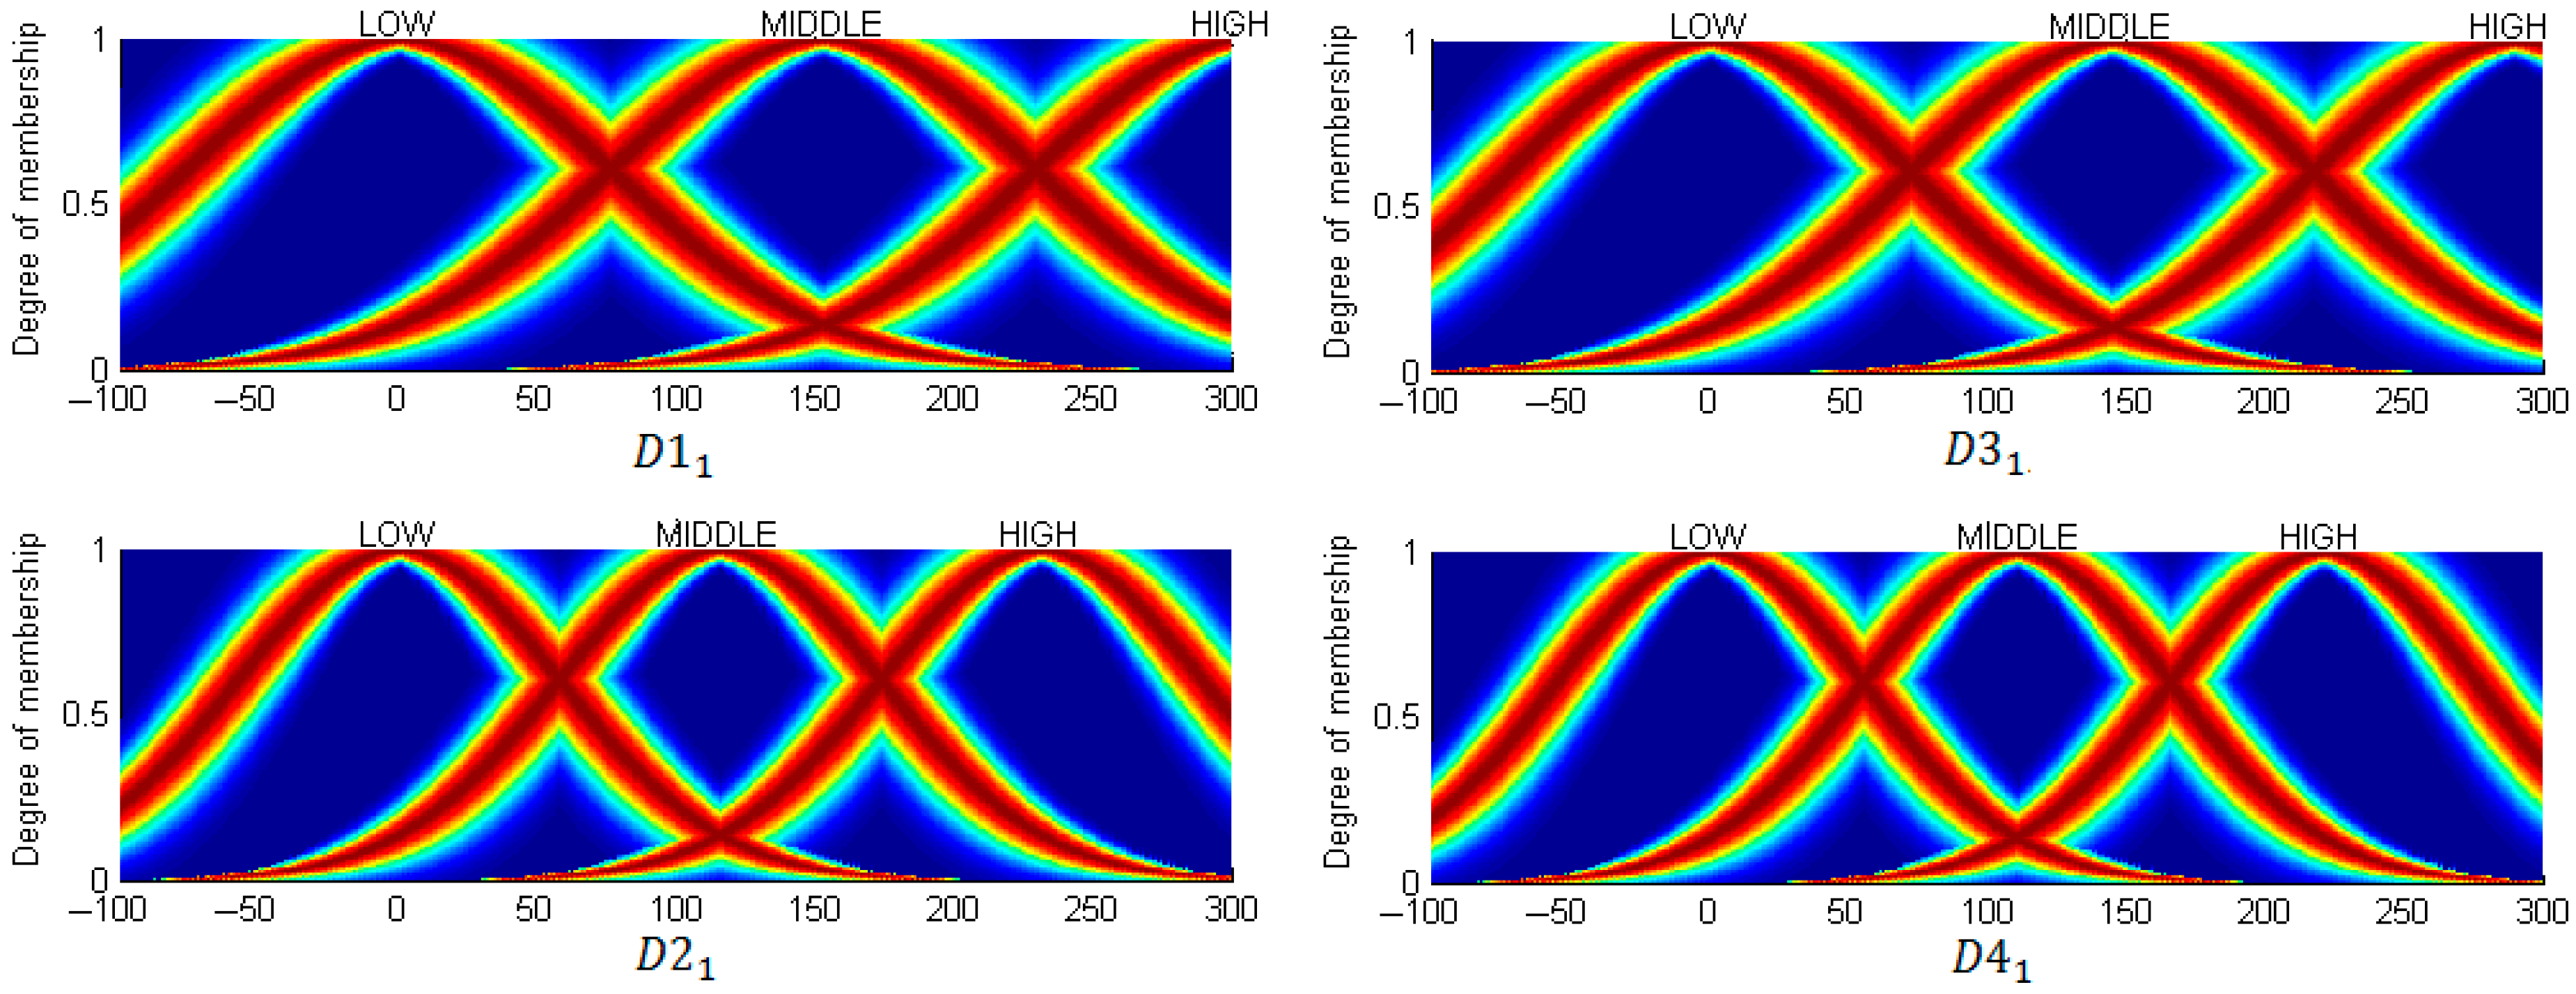
Figure 6.
GT2 output membership function for the variable .
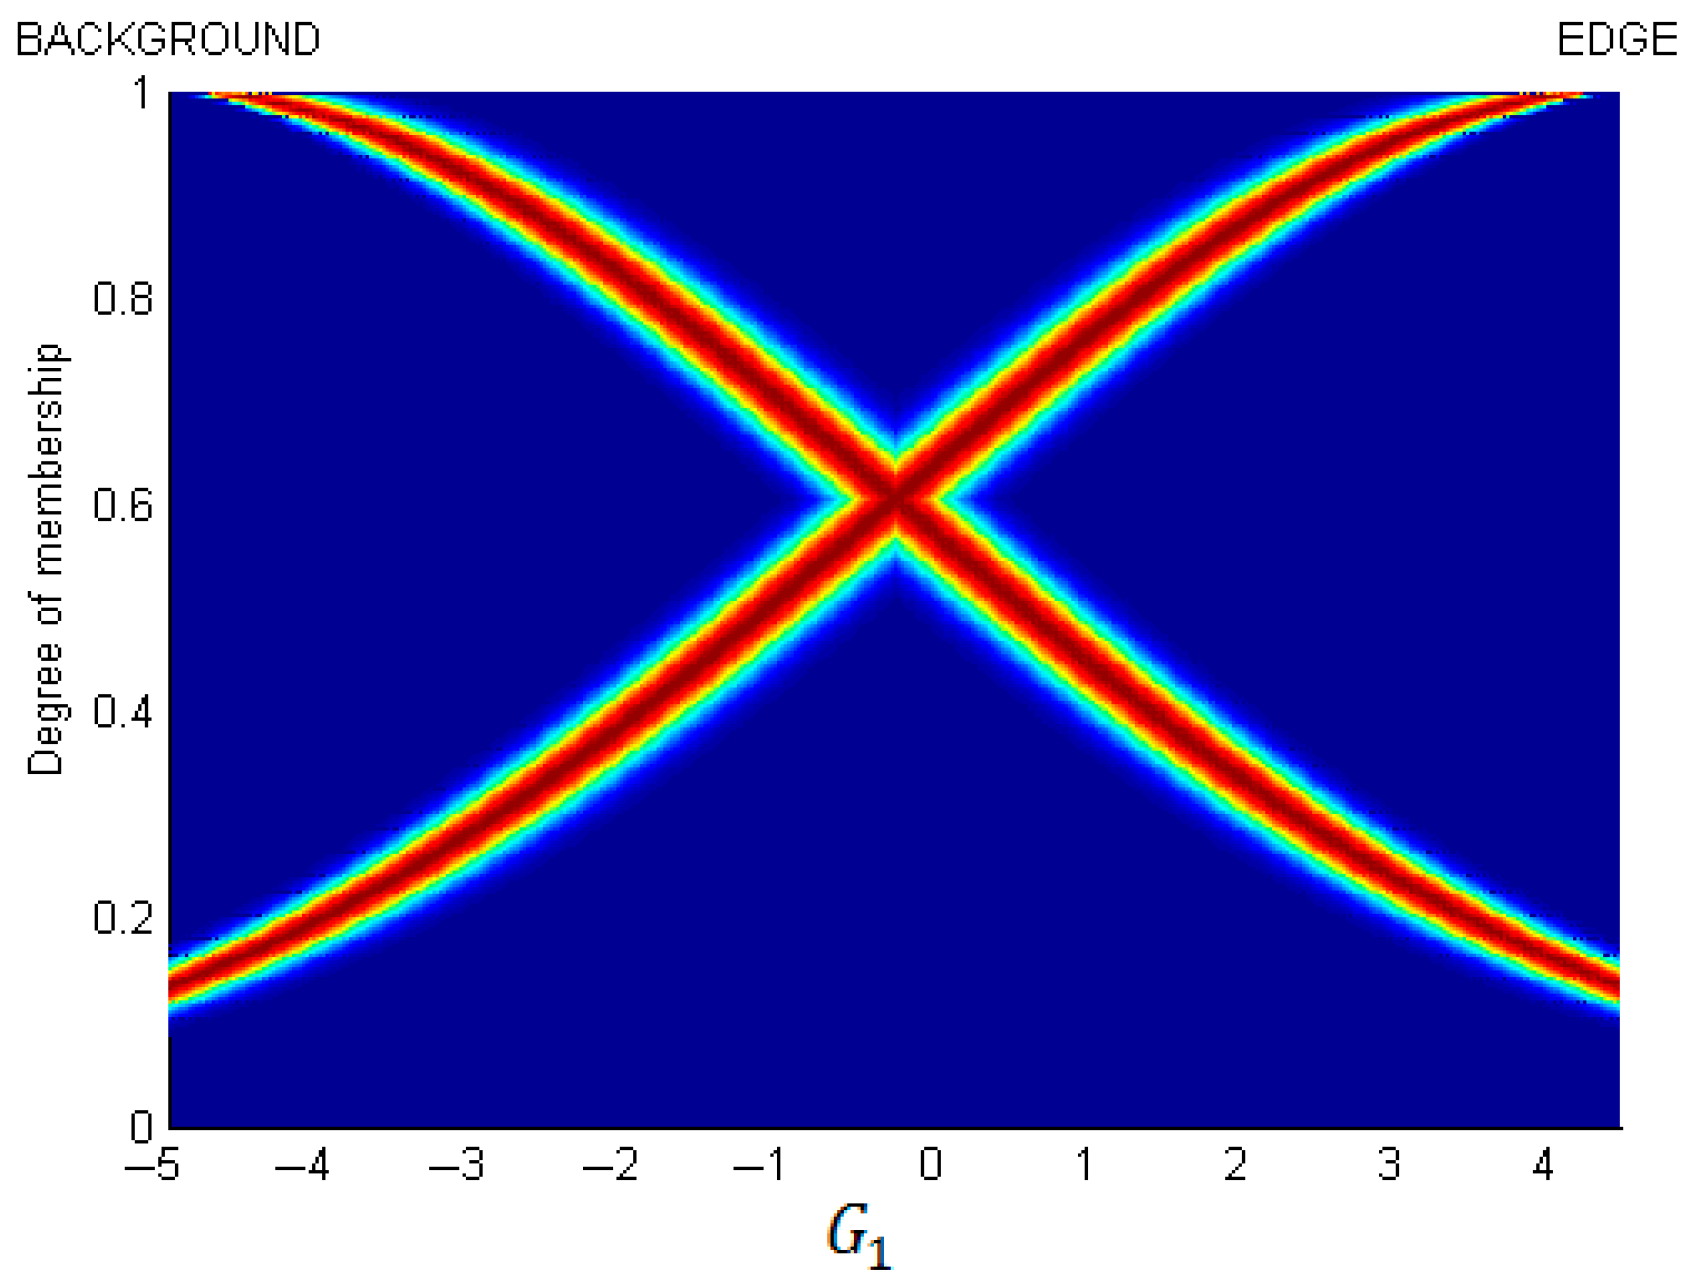
Figure 7.
FOM values achieved by the fuzzy edge detectors in Lab, HSV, and RGB color format images.

Figure 8.
Comparison of results of the FOM values for the different color formats.

Table 1.
Knowledge base of nine fuzzy rules for edge detection process.
| Fuzzy Rules |
|---|
| 1. If (RD1 is HIGH) or (RD2 is HIGH) or (RD3 is HIGH) or (RD4 is HIGH) then (GR is EDGE) 2. If (RD1 is MIDDLE) or (RD2 is MIDDLE) or (RD3 is MIDDLE) or (RD4 is MIDDLE) then (GR is EDGE) 3. If (RD1 is LOW) and (RD2 is LOW) and (RD3 is LOW) and (RD4 is LOW) then (GR is BACKGROUND) 4. If (GD1 is HIGH) or (GD2 is HIGH) or (GD3 is HIGH) or (GD4 is HIGH) then (GG is EDGE) 5. If (GD1 is MIDDLE) or (GD2 is MIDDLE) or (GD3 is MIDDLE) or (GD4 is MIDDLE) then (GG is EDGE) 6. If (GD1 is LOW) and (GD2 is LOW) and (GD3 is LOW) and (GD4 is LOW) then (GG is BACKGROUND) 7. If (BD1 is HIGH) or (BD2 is HIGH) or (BD3 is HIGH) or (BD4 is HIGH) then (GB is EDGE) 8. If (BD1 is MIDDLE) or (BD2 is MIDDLE) or (BD3 is MIDDLE) or (BD4 is MIDDLE) then (GB is EDGE) 9. If (BD1 is LOW) and (BD2 is LOW) and (BD3 is LOW) and (BD4 is LOW) then (GB is BACKGROUND) |
Table 2.
Synthetic color image database.
| Image Number | Synthetic Images | Reference Images | Resolution |
|---|---|---|---|
| 1 |  |  | Type of file: PNG file |
| Width: 420 pixels | |||
| Height: 182 pixels | |||
| 2 |  |  | Type of file: PNG file |
| Width: 143 pixels | |||
| Height: 241 pixels | |||
| 3 |  |  | Type of file: PNG file |
| Width: 219 pixels | |||
| Height: 219 pixels | |||
| 4 |  |  | Type of file: PNG file |
| Width: 307 pixels | |||
| Height: 183 pixels | |||
| 5 |  |  | PNG file |
| Width: 310 pixels | |||
| Height: 207 pixels |
Table 3.
T1 FSs edge detection applied on Lab, HSV, and RGB images.
| Image Number | T1 FSs Edge Detection | ||
|---|---|---|---|
| FOM | |||
| Lab | HSV | RGB | |
| 1 | 0.9430 | 0.9380 | 0.9393 |
| 2 | 0.9504 | 0.9372 | 0.9478 |
| 3 | 0.9485 | 0.9403 | 0.9464 |
| 4 | 0.9493 | 0.9453 | 0.9491 |
| 5 | 0.9428 | 0.9353 | 0.9415 |
| Mean | 0.9468 | 0.9392 | 0.9448 |
Table 4.
IT2 FSs edge detection applied on Lab, HSV, and RGB images.
| Image Number | IT2 FSs Edge Detection | ||
|---|---|---|---|
| FOM | |||
| Lab | HSV | RGB | |
| 1 | 0.9437 | 0.9401 | 0.9401 |
| 2 | 0.9510 | 0.9478 | 0.9479 |
| 3 | 0.9491 | 0.9464 | 0.9470 |
| 4 | 0.9496 | 0.9491 | 0.9493 |
| 5 | 0.9430 | 0.9415 | 0.9417 |
| Mean | 0.9473 | 0.9450 | 0.9452 |
Table 5.
GT2 FSs edge detection applied on Lab, HSV, and RGB color format images.
| Image Number | GT2 FSs Edge Detection | ||
|---|---|---|---|
| FOM | |||
| Lab | HSV | RGB | |
| 1 | 0.9457 | 0.9416 | 0.9416 |
| 2 | 0.9523 | 0.9481 | 0.9481 |
| 3 | 0.9497 | 0.9472 | 0.9473 |
| 4 | 0.9503 | 0.9497 | 0.9497 |
| 5 | 0.9434 | 0.9419 | 0.9420 |
| Mean | 0.9483 | 0.9457 | 0.9457 |
Table 6.
Results achieved by T1FSs, IT2FSs, and GT2FSs edge detectors applied on Lab, HSV, and RGB format color images.
Table 6.
Results achieved by T1FSs, IT2FSs, and GT2FSs edge detectors applied on Lab, HSV, and RGB format color images.
| Fuzzy Edge Detector | FOM | ||
|---|---|---|---|
| Lab | HSV | RGB | |
| T1 FSs | 0.9468 | 0.9392 | 0.9448 |
| IT2 FSs | 0.9473 | 0.9450 | 0.9452 |
| GT2 FSs | 0.9483 | 0.9457 | 0.9457 |
| Canny | 0.8113 | 0.9264 | 0.8021 |
| Sobel | 0.5343 | 0.4762 | 0.4396 |
Table 7.
FOM values achieved by T1 FSs in images with Gaussian noise.
| T1 FSs | ||||
|---|---|---|---|---|
| Color Format | FOM | |||
| 20 dBi | 30 dBi | 40 dBi | 50 dBi | |
| Lab | 0.8494 | 0.9489 | 0.9485 | 0.8972 |
| HSV | 0.9367 | 0.9393 | 0.9392 | 0.9391 |
| RGB | 0.8844 | 0.9461 | 0.9458 | 0.9457 |
Table 8.
FOM values achieved by IT2 FSs in images with Gaussian noise.
| IT2 FSs | ||||
|---|---|---|---|---|
| Color Format | FOM | |||
| 20 dBi | 30 dBi | 40 dBi | 50 dBi | |
| Lab | 0.8597 | 0.9492 | 0.9485 | 0.9483 |
| HSV | 0.9385 | 0.9394 | 0.9393 | 0.9393 |
| RGB | 0.9081 | 0.9466 | 0.9458 | 0.9456 |
Table 9.
FOM values achieved by GT2 FSs in images with Gaussian noise.
| GT2 FSs | ||||
|---|---|---|---|---|
| Color Format | FOM | |||
| 20 dBi | 30 dBi | 40 dBi | 50 dBi | |
| Lab | 0.8600 | 0.9496 | 0.9491 | 0.9489 |
| HSV | 0.9392 | 0.9395 | 0.9393 | 0.9392 |
| RGB | 0.9158 | 0.9563 | 0.9470 | 0.9460 |
Table 10.
T1, IT2, and GT2 FS edge detection applied on Lab color format images with Gaussian noise.
Table 10.
T1, IT2, and GT2 FS edge detection applied on Lab color format images with Gaussian noise.
| Lab | ||||
|---|---|---|---|---|
| Fuzzy Edge Detection | FOM | |||
| 20 dBi | 30 dBi | 40 dBi | 50 dBi | |
| T1 FSs | 0.8494 | 0.9489 | 0.9485 | 0.8972 |
| IT2 FSs | 0.8597 | 0.9492 | 0.9485 | 0.9483 |
| GT2 FSs | 0.8600 | 0.9496 | 0.9491 | 0.9489 |
| Canny | 0.8306 | 0.8126 | 0.8113 | 0.8110 |
| Sobel | 0.4824 | 0.4824 | 0.4824 | 0.4824 |
Table 11.
T1, IT2, and GT2 FS edge detection applied on HSV color format images with Gaussian noise.
Table 11.
T1, IT2, and GT2 FS edge detection applied on HSV color format images with Gaussian noise.
| HSV | ||||
|---|---|---|---|---|
| Fuzzy Edge Detection | FOM | |||
| 20 dBi | 30 dBi | 40 dBi | 50 dBi | |
| T1 FSs | 0.9367 | 0.9393 | 0.9392 | 0.9391 |
| IT2 FSs | 0.9385 | 0.9394 | 0.9393 | 0.9393 |
| GT2 FSs | 0.9392 | 0.9395 | 0.9393 | 0.9392 |
| Canny | 0.8175 | 0.9261 | 0.9264 | 0.9264 |
| Sobel | 0.4762 | 0.4762 | 0.4762 | 0.4762 |
Table 12.
T1, IT2, and GT2 FS edge detection applied on RGB color format images with Gaussian noise.
Table 12.
T1, IT2, and GT2 FS edge detection applied on RGB color format images with Gaussian noise.
| RGB | ||||
|---|---|---|---|---|
| Fuzzy Edge Detection | FOM | |||
| 20 dBi | 30 dBi | 40 dBi | 50 dBi | |
| T1 FSs | 0.8844 | 0.9461 | 0.9458 | 0.9457 |
| IT2 FSs | 0.9081 | 0.9466 | 0.9458 | 0.9456 |
| GT2 FSs | 0.9158 | 0.9563 | 0.9470 | 0.9460 |
| Canny | 0.8302 | 0.8230 | 0.8220 | 0.8212 |
| Sobel | 0.5343 | 0.5343 | 0.5343 | 0.5343 |
Table 13.
Edge detection output using T1, IT2, and GT2 FSs.
| T1 FSs | IT2 FSs | GT2 FSs |
|---|---|---|
 |  |  |
 |  |  |
 |  |  |
 |  |  |
 |  |  |
© 2017 by the authors. Licensee MDPI, Basel, Switzerland. This article is an open access article distributed under the terms and conditions of the Creative Commons Attribution (CC BY) license (http://creativecommons.org/licenses/by/4.0/).
Share and Cite
MDPI and ACS Style
Gonzalez, C.I.; Melin, P.; Castillo, O. Edge Detection Method Based on General Type-2 Fuzzy Logic Applied to Color Images. Information 2017, 8, 104. https://doi.org/10.3390/info8030104
AMA Style
Gonzalez CI, Melin P, Castillo O. Edge Detection Method Based on General Type-2 Fuzzy Logic Applied to Color Images. Information. 2017; 8(3):104. https://doi.org/10.3390/info8030104
Chicago/Turabian StyleGonzalez, Claudia I., Patricia Melin, and Oscar Castillo. 2017. "Edge Detection Method Based on General Type-2 Fuzzy Logic Applied to Color Images" Information 8, no. 3: 104. https://doi.org/10.3390/info8030104
Note that from the first issue of 2016, this journal uses article numbers instead of page numbers. See further details here.