Article

Non-Negative Tensor Factorization for Human Behavioral Pattern Mining in Online Games

USC Information Sciences Institute, Marina del Rey, CA 90292, USA
*
Author to whom correspondence should be addressed.
Information 2018, 9(3), 66; https://doi.org/10.3390/info9030066
Submission received: 24 January 2018 / Revised: 12 March 2018 / Accepted: 14 March 2018 / Published: 16 March 2018
(This article belongs to the Special Issue Data Mining for the Analysis of Performance and Success)

Abstract

:
Multiplayer online battle arena is a genre of online games that has become extremely popular. Due to their success, these games also drew the attention of our research community, because they provide a wealth of information about human online interactions and behaviors. A crucial problem is the extraction of activity patterns that characterize this type of data, in an interpretable way. Here, we leverage the Non-negative Tensor Factorization to detect hidden correlated behaviors of playing in a well-known game: League of Legends. To this aim, we collect the entire gaming history of a group of about 1000 players, which accounts for roughly 100K matches. By applying our framework we are able to separate players into different groups. We show that each group exhibits similar features and playing strategies, as well as similar temporal trajectories, i.e., behavioral progressions over the course of their gaming history. We surprisingly discover that playing strategies are stable over time and we provide an explanation for this observation.

1. Introduction

Multiplayer Online Battle Arena (MOBA) is a genre of strategy online games that has drawn growing attention and has become extremely popular. MOBA consist of match-based games, where players, divided into two opposing teams, compete against each other. Each player during the match controls a single character (a.k.a., champion), having a specific role and abilities. The main goal in each match is to destroy the enemy team’s base, while enhancing the player level, increasing the abilities of the controlled character, and cooperating with one’s own teammates.
This genre of games, including Heroes of the Storm, Dota 2, and League of Legends, has attracted researchers from different fields, especially because they provide a unique way to study the influence of role-playing in competitive games [1,2], the impact of cooperation [3,4] versus individual player attitudes [5,6], social behaviors [7,8,9], user commitment [10], etc. The analysis of MOBA games also allows for the discovery of useful information to study the social dynamics of player communities. For example, by extracting players’ social activities and relations, researchers addressed issues such as gender gap [11] and improved the user experience [12].
One advantage of analyzing players’ records in online games is the possibility of monitoring how their behaviors evolve over time. The temporal dimension exhibited by such data enables the study of the evolution of player performance, specifically how players learn, adapt, and modify their playing strategies over time.
We propose to study both the temporal and social dynamics of players in MOBA games at once. Here, we will focus on the analysis of League of Legends (LoL), a popular MOBA game. Our goal will be that of identifying different groups of players with common strategies, such as collaborative versus individualist players, and understanding how these groups of players behave in time, i.e., how their strategies evolve over time.
To this aim, we take advantage of Non-negative Tensor Factorization (NTF) [13,14,15] techniques, which derive from multi-linear algebra. Non-negative Tensor Factorization models can be seen as an extension of Matrix Factorization, a method which provides a low-rank approximation of the data that has been widely used to detect hidden structures among data in several contexts, such as face recognition [16,17,18], hyperspectral unmixing [19,20], community detection [21,22], recommender systems [23,24], etc. Analogously to matrix factorization, tensor factorization allows to approximate data in a lower dimensional space. However, due to their multiple dimensions, tensors are suitable objects to represent multimodal data [25]. This allows to identify correlation in the data at different levels [26]: on the one hand, the application of the NTF helps in the identification of hidden topological structures in the data, like groups or communities, which are easy to interpret as they reflect individuals’ social dynamics [27]. On the other hand, these topological structures share correlated activity patterns [28,29]. A major advantage in mining tensors, instead of using more common matrix factorization techniques, is the possibility of extracting these correlations in the data in more than two dimensions, thus avoiding studying data at an aggregated level. Moreover, the use of non-negative constraints eases the interpretation of the patterns provided by the tensor factorization. Our purpose is therefore to leverage NTF to detect groups of players characterized by similar features (i.e., actions they perform during the game) and strategies as well as their temporal trajectories, i.e., their evolution.

Contributions

In this work, we present a framework based on NTF to study players’ behavior in online games. The framework, shown in Figure 1, consists of a combination of machine learning and classification methods. In particular, we use Decision Tree to select the features in the data that will become part of the input of the NTF. We then apply the NTF in combination with other methods, such as k-means, to extract meaningful information about users’ activity. Through the lens of this framework, we study the gaming history of about 1000 League of Legends players accounting for a total of roughly 100 K matches. Our analysis will:
  • Highlight the existence of an underlying structure in the data, that allows us to divide players into groups characterized by similar features and having correlated temporal behaviors;
  • Provide an interpretation of the components extracted by the NTF;
  • Validate the interpretation of the NTF results by analyzing the uncovered groups and their evolution over time;
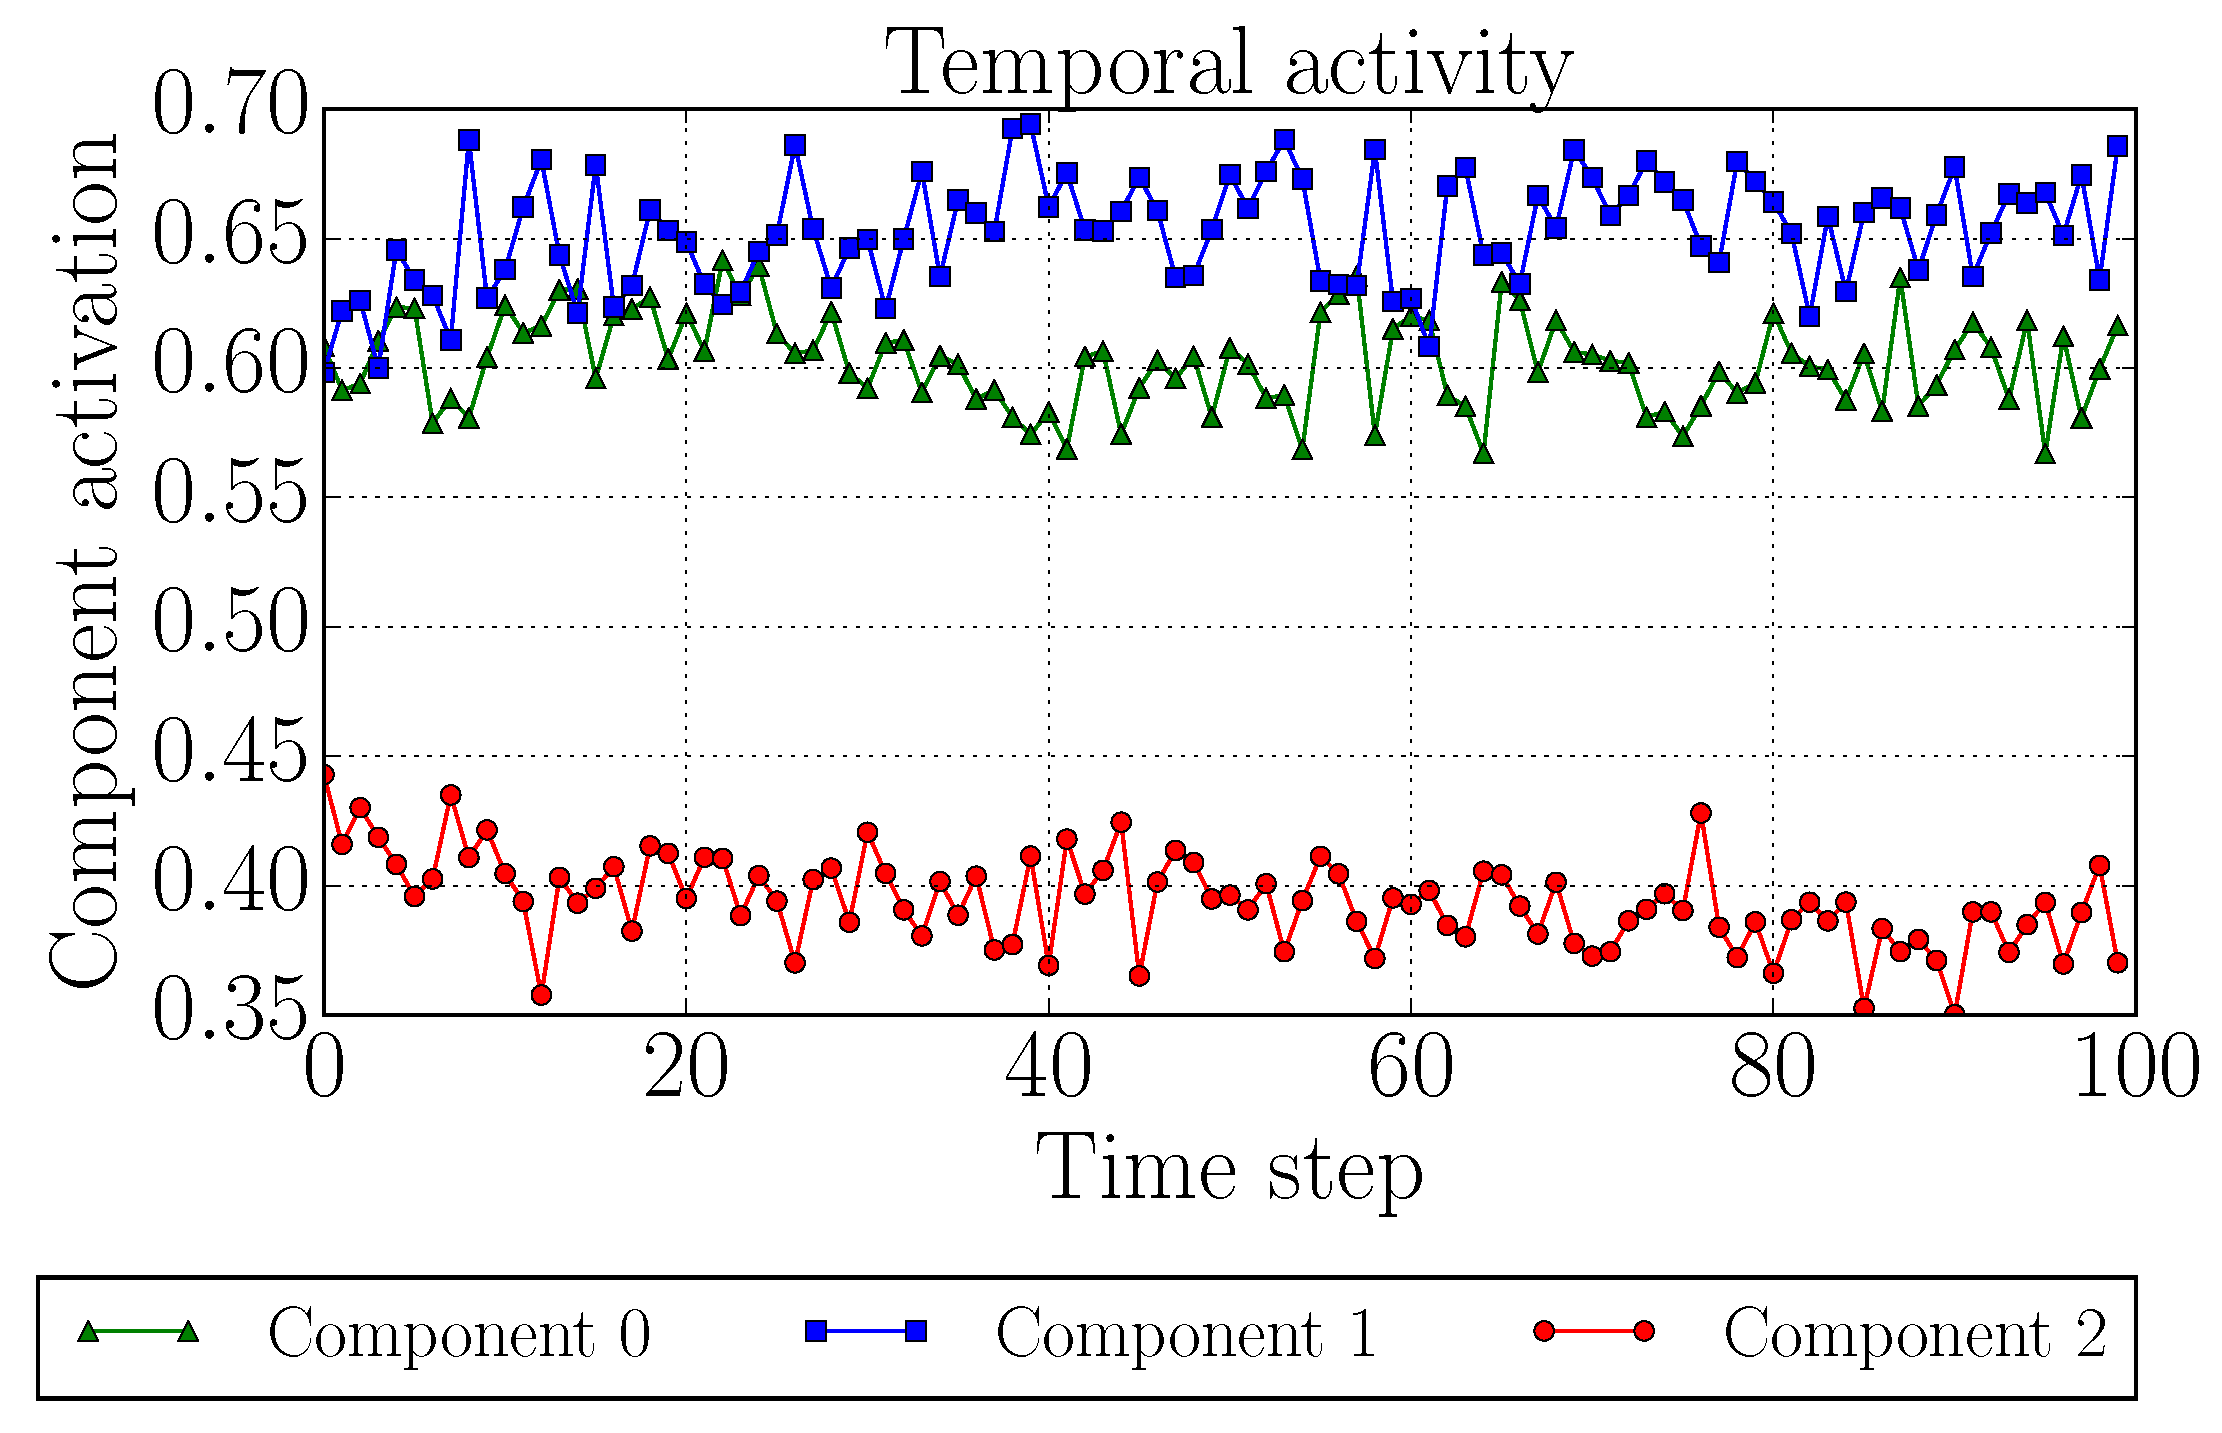
  • Discover, by analyzing the temporal components, that players’ playing strategies are consistent over time;
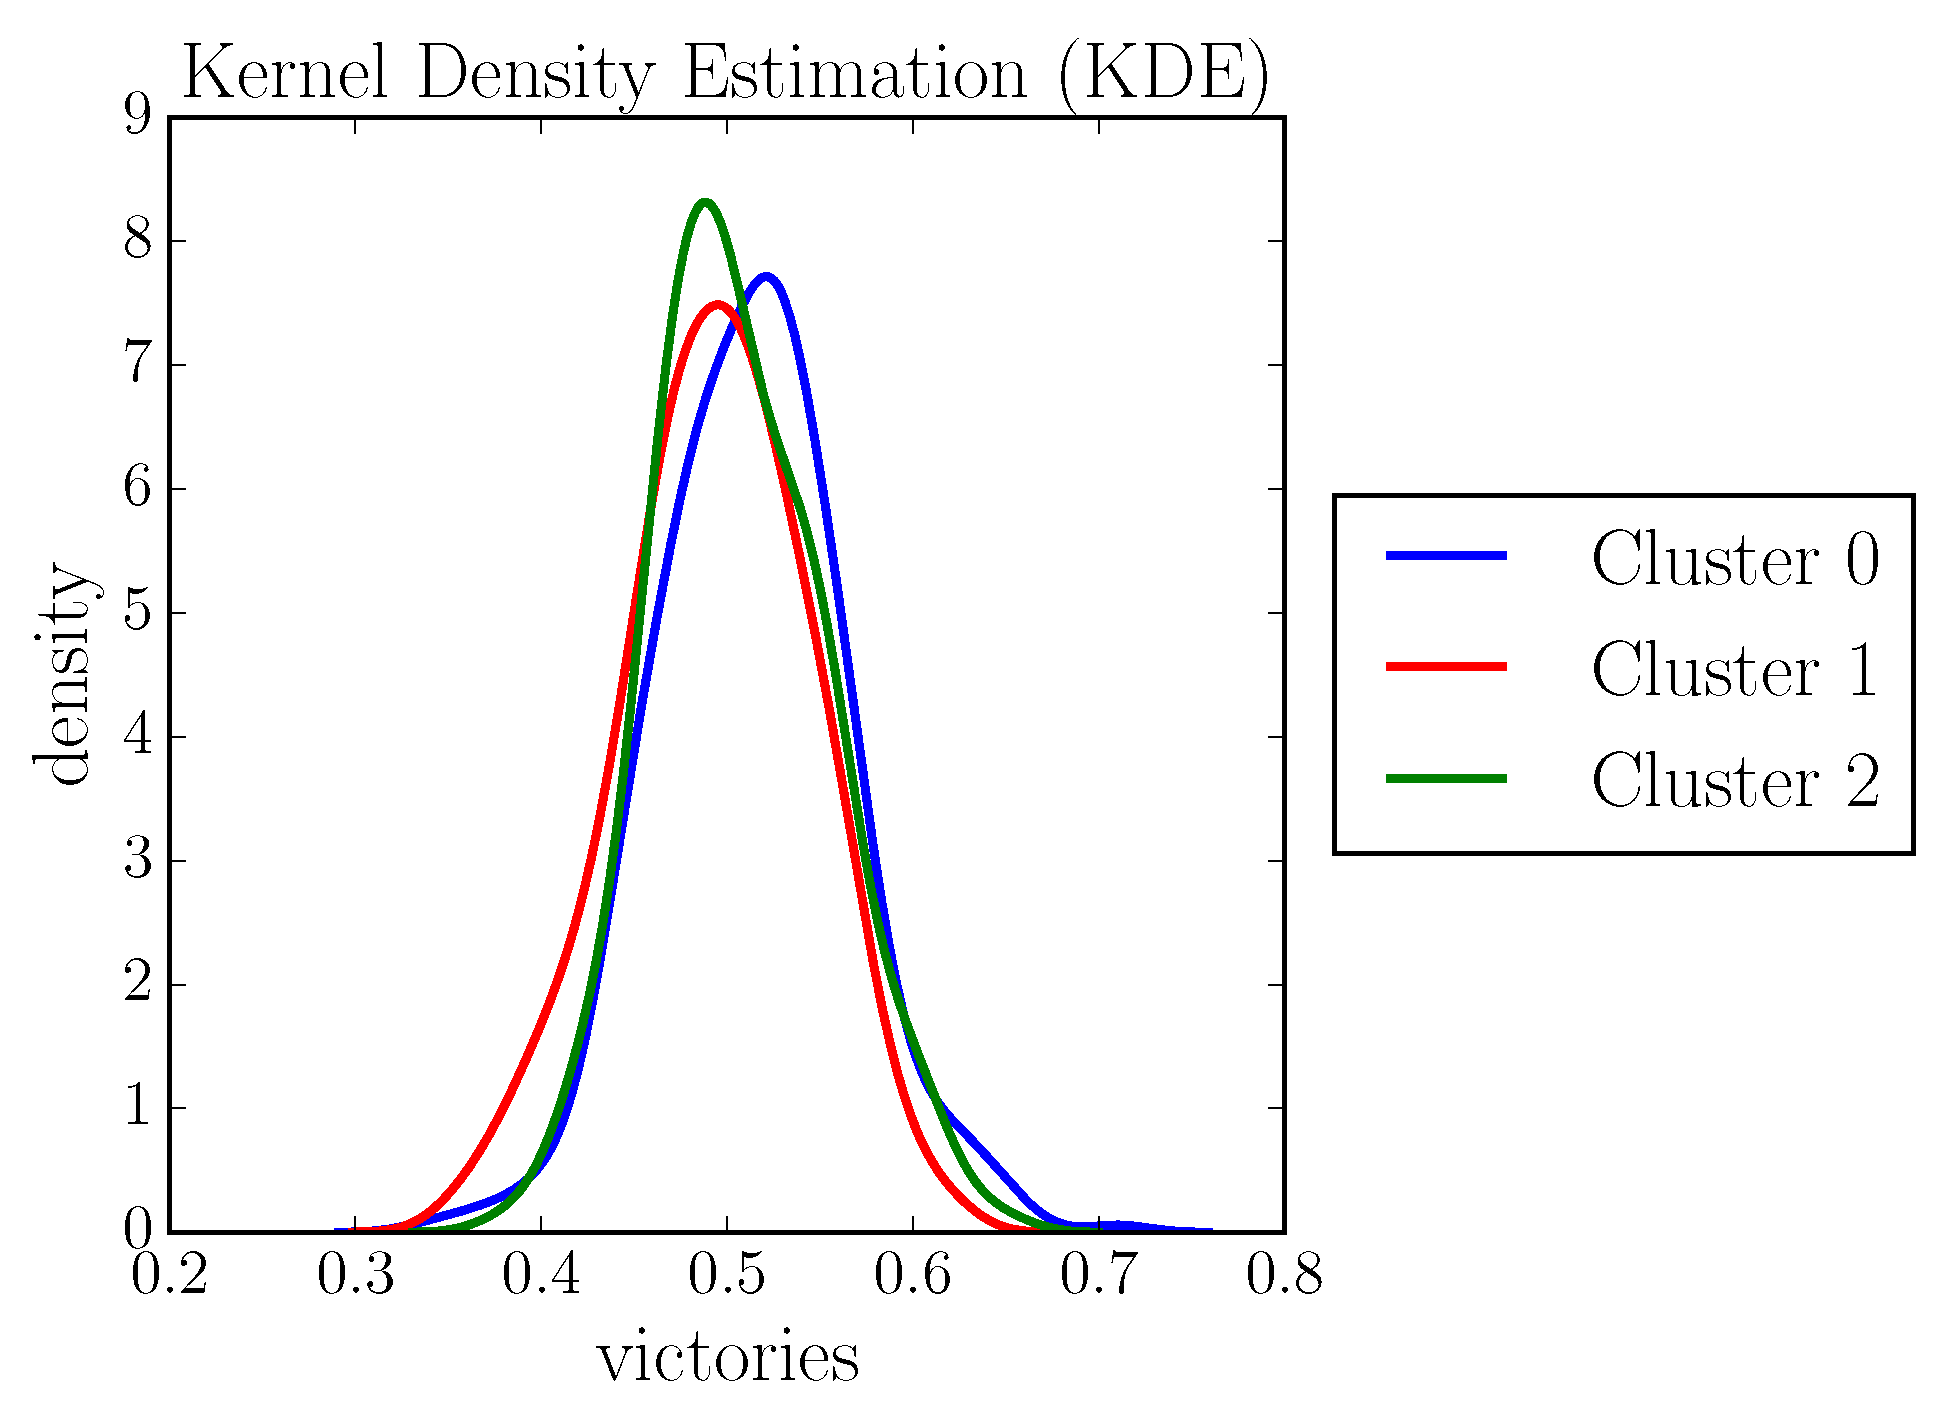
  • Provide and validate an explanation for players behavioral stability, namely that the design of the game strongly impacts team formation in each match, thus manipulating the team’s probability of victory.

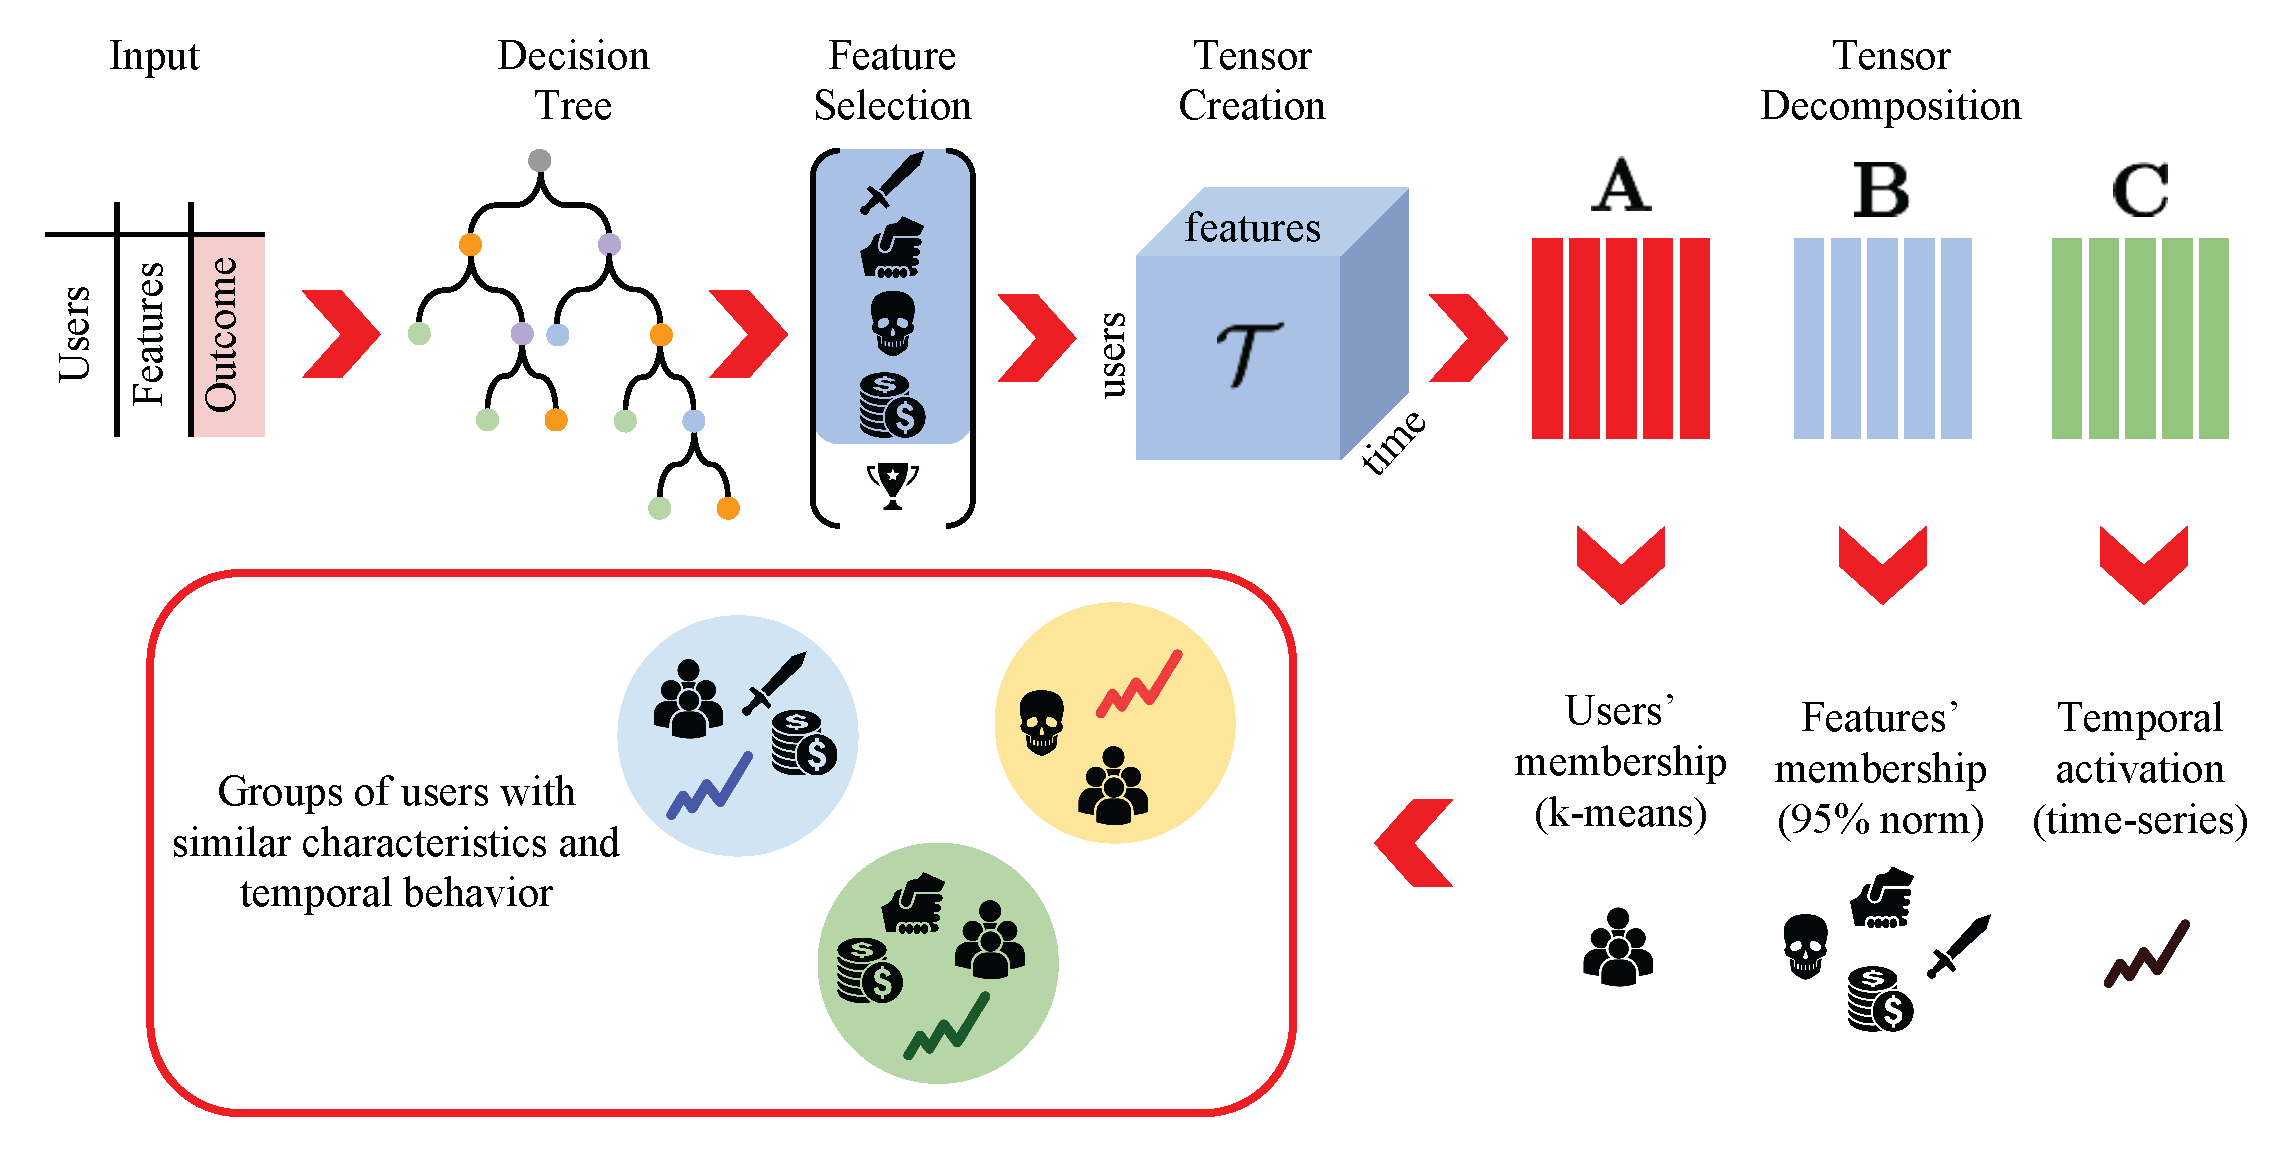
2. Materials and Methods

Given a dataset composed by users (i.e., players), whose features (i.e., actions performed by the players) evolve over time, we aim at extracting meaningful patterns of behavior by applying tensor decomposition techniques. To this aim, we need to represent our data as a tensor (i.e., a multi-dimensional array). This can be done by assigning to each dimension of the tensor the different dimensions of the data, namely users, features, and time. However, not all the available features might be predictive of a user’s performance or behavior. Thus, our framework, shown in Figure 1, includes a feature selection step (described in the following) that allows us to identify the most informative features that will be then used to create the tensor.

2.1. Feature Selection

The first step in our framework is to evaluate which features we need to build our multi-dimensional representation (tensor) of the data. We use Decision Trees to design a simple prediction task and detect those features that are mostly predictive of users’ performance. Decision Trees are well-known machine learning techniques used for predicting a target outcome (in our case, users’ performance) by learning decision rules through the features describing the data. The model also provides as an output the importance of each feature, i.e., the Gini importance or impurity. (https://www.stat.berkeley.edu/~breiman/RandomForests/cc_home.htm) Each node of a decision tree indeed represents a condition on one feature to split the dataset in two parts. The Gini importance is the measure used by the algorithm (here we use the Python scikit-learn implementation (http://scikit-learn.org/stable/modules/generated/sklearn.tree.DecisionTreeClassifier.html#r251) to chose the optimal split condition, and it is defined as
I G ( p ) = 1 j = 1 J p j 2 ,
where J is the set of classes, and p j is the fraction of items labeled with the j-th class. The features in the datasets can then be ranked according to the Gini importance yielded by their addition to the model. We select those features whose sum of Gini values explain more than 90 % of the overall sum (i.e., sum of Gini values of all features).
Finally, as the selected features might be characterized by different ranges of values, we normalize them as follows. Given the vector x f related to feature f, we normalize each entry i of the vector as
x ^ f , i = x f , i x m i n x m a x x m i n ,
where x m i n and x m a x respectively are the minimum and maximum values of vector x f .

2.2. Non-Negative Tensor Factorization

The dataset now composed by users, selected features and their temporal sequence, which in our data is the series of matches played by each player, can be represented as a tensor. This tensor will be then decomposed in our framework to identify groups of users with similar behaviors in time and characterized by common sets of features.
Following the notation reported in Table 1, we thus define a three-dimensional array, denoted as X R I × J × K , where I is the number of users, J is the number of features, and K is the number of time steps (i.e., played matches). In this formulation, the entry x i j k of the tensor corresponds to the entry related to the i-th user in the j-th feature at the k-th match in her/his gaming history.
Once the dataset is represented in the tensor form, we can decompose the tensor to perform a dimensionality reduction on the data. Here, we focus on the Non-negative Tensor Factorization which is given by the PARAFAC/CANDECOMP (CP) decomposition with non-negative constraints [30]. The NTF approximates the tensor X into the sum of rank-one tensors, called components:
X r = 1 R λ r a r b r c r ,
where R is the rank of the tensor, which is the number of lower-dimensional components found by the decomposition to approximate the data; λ r are the values of the tensor core L = d i a g ( λ ) ; and the outer product a r b r c r identifies the component r, with r = 1 , , R .
The vectors a r , b r and c r respectively provide the level of membership of the users to the component r, the level of membership of the features to the component r, and the temporal activation of the component r. These vectors can be encoded in three matrices A R I × R , B R J × R , and C R K × R , called factor matrices, whose r-th columns coincide to the vectors a r , b r and c r . Therefore, the approximation in Equation (3) can be rewritten in the Kruskal form [31] as
X L ; A , B , C .
Note that the Kruskal operator . is just a compact notation to write Equation (3) in terms of the core and factor matrices.
To obtain the factor matrices, and thus the approximated tensor, we need to solve an optimization problem of the form:
min X L ; A , B , C F 2 s . t . λ , A , B , C 0
where · F is the Frobenius norm, and non-negativity constraints are imposed on the factor matrices. To solve the optimization problem, we rely on the Alternating Non-negative Least Squares (ANLS) [32], combined with the Block Principal Pivoting (BPP) method, developed by [33]. In particular, we use the Python package available online (https://github.com/panisson/ntf-school/blob/master/ncp.py) to compute the tensor decomposition.

2.3. Rank Selection

To find the best approximation, we run 5 simulations for each rank value and we assess the suitable number of components, i.e., rank, by using two approaches: the Core Consistency Diagnostic (CORCONDIA) by [34] and the Automatic Relevance Determination (ARD) for Tucker models (i.e., a generalization of the CP decomposition) [35].
CORCONDIA
We compute the core consistency value for each simulation and look at the change in the slope of the resulting core consistency curve to select a suitable number of components R. In particular, the core consistency values provide an evaluation of the closeness of the computed decomposition to the ideal one. This is done by comparing the core tensor L of the decomposition to a super-diagonal tensor G , i.e., a tensor having entries equal to 1 on the diagonal and 0 otherwise. Therefore, the core consistency between L and G is defined as:
c c = 100 1 l = 1 R m = 1 R n = 1 R λ l m n g l m n 2 R ,
where λ l m n are the entries of the core tensor L R R × R × R and g l m n are the entries of the ideal core G R R × R × R .
The core consistency has an upper bound: its values cannot exceed 100. As a result, high values of the core consistency mean high similarity between the cores, while low values indicate that the model selected could be problematic. Finally, the core consistency can assume negative values, thus indicating that the model selected is inappropriate. In the Results section (see Section 4) we will discuss the optimal number of components as discovered by the the Core Consistency Diagnostic.
ARD Tucker
The algorithm is based on a hierarchical Bayesian framework, whose parameters directly define features importance. Thus, approximating the tensor ARD automatically optimizes the hyperparameters and prunes irrelevant components. In particular, the minimization problem based on the least square objective function coincides to the minimization of the negative log-likelihood assuming i.i.d. tensor’s values with Gaussian noise. We refer the interested reader to [35] for further details.
As a result the ARD Tucker algorithm detects the relevant components, while pruning the others and minimizing the negative log-likelihood corresponding to the ANLS problem. The best model corresponds to the one having the largest log-likelihood. In the Results section (see Section 4) we will show the detected model and to select the rank we will compare this result with the one provided by the CORCONDIA.
Once the number of components is identified, we can analyze the information provided by the resulting factor matrices. By the study of the matrices A and B , we can define the level of membership of each user to a specific component, as well as the level of membership of each feature to the components. It is worth noting that NTF allows users (or features) to belong to several components leading to overlapping groups, but also allows users (or features) to have a low level of membership such that it could be not enough to label users (or features) as members of a specific component.
The are two possible strategies to define whether a user (analogously for features) belongs to a component: either we accumulate the membership of a component until the 95 % of its norm is reached [28]; or, we compute an intra-component k-means with k = 2 clusters [27], i.e., for each component we divide the users into two groups: those who belong to the specific component, and those who do not. These methods allow to identify user clusters that might overlap. However, the use of such methods could lead to having users that do not belong to any component.
We use the first of the two methods to analyze the level of membership of the features, provided by the matrix B . This decision is justified by our expectation that, in League of Legends (and in MOBA games in general), players can exhibit different strategies during each match, reflecting different personal goals: for example, a user may try to kill as many enemies as possible to earn a great amount of gold; this however would potentially incur in risking her/his hero’s death more frequently; an alternative could be avoiding getting the hero killed too often by helping (assisting) other teammates, which however results in earning less gold at the end of the match.
However, since our aim is to identify groups of users with different behaviors, we decided to study the user membership as follows. We consider the components of A as observations recorded for each user, and we fit the k-means algorithm by imposing k = R , i.e., we want to obtain one cluster of users for each component. In this way, the users are divided in k disjoint clusters. Here, the k-means is applied on the lower-dimensional representation provided by the NTF, and thus on the components’ values in A . The algorithm aims at finding centroids that minimize the distance between elements in each cluster. Formally, given a set of observations the algorithm partitions, the observations into k sets S = { S 1 , , S k } so that the within-cluster sum of squares will be minimized:
min S i = 1 k a S i a μ i 2 ,
where a is one observation (here a row of A ) and μ i is the mean of set S i . As the values of A provide how strongly each component represents a user, we can thus select the group of users that mostly belong to each component. Note that the use of k-means on the raw data would not provide the same level of information given by NTF, which discovers correlations in the data in multiple dimensions at a time, and allows to follow the temporal evolution of the uncovered groups.
Finally, we can recover the temporal activation of each component in the columns of the factor matrix C . This information can be used to investigate the evolution of each extracted behavior.

3. Data and Feature Selection

3.1. League of Legends

We tested our framework on a dataset of a MOBA game: League of Legends. League of legends is a match-based game developed by Riot Games, in which each player, i.e., user, controls a champion characterized by specific abilities and fight, together with other players, against a team of other players. The final goal is to defeat the opposing team in an arena. Each champion starts the match with a low strength level which increases by killing adversaries, helping members of the team in kills, i.e., assists, and performing other actions. During the match, each champion can be killed many times, i.e., number of deaths. The player can earn gold (i.e., the LoL currency) by performing some actions, such as killing or assisting in kills, and can use the earned gold to improve the abilities of the champion.
We collected the LoL data by means of the Riot Games API, (https://developer.riotgames.com/) which provides metadata related to each match, including players’ performance, such as number of assists, kills, deaths, etc. Each player is identified by a unique label and each match is marked by temporal information, such as match datetime and duration.

3.2. The League of Legends Dataset

The dataset analyzed in the present work consists of 961 players, and the complete game history of their first 100 matches are played exclusively in one specific battle arena, i.e., the characteristic map in which LoL teams fight. We decided to focus on a specific battle arena to minimize the variability in players’ behaviors (and their evolution) induced by different game scenarios. To this purpose, we selected the most popular LoL battle arena, namely the Summoner’s Rift (map_id = 11): the largest map in LoL, composed by three lanes (paths) connecting the opponents’ bases, jungles at the edges, and a central river. This is (by a large margin) the most played battle arena in the game; its choice provided us with a significant amount of players who played this scenario at least 100 times. We decided to set this threshold because we wanted to guarantee that a sufficient number of matches were played by each single individual to capture a pattern of temporal behavior evolution. One hundred matches resulted in a good trade-off between the number of users (nearly 1000) and the number of total matches (nearly 100K) yielded by the selected threshold.

3.3. Feature Selection

For each match, the Riot Games API returns 51 features (https://developer.riotgames.com/api-methods) (full list and explanations are provided in the Appendix A) associated with different aspects of the game. In summary, the API provides: IDs (e.g., map ID, player ID, match ID, etc.); temporal information related to the match; features related to minions (i.e., the AI-controlled characters that spawn in the game map); damages dealt and taken by players, gold (i.e., the currency of LoL, used to purchase items and champions’ upgrades), all the different types of kills (such as killing champions, minions, towers, or other entities in the game); other types of actions, such as assisting, dying, healing, wards related actions; the binary feature “winner” which provides the final outcome of the game (win/lose); and some additional in-game detailed scores (cf., Appendix A). Not all these features are predictive of players’ game performance, thus we first apply our feature selection step. To identify informative features in LoL, we use Decision Trees to predict whether a user had won a specific match, given the vector of all the features describing her/his performance in that match (as shown in Figure 1). Here, the target values are provided by the feature “winner”, a binary feature which is 1 if the player won the game and 0 otherwise.
We then rank features, as described in Section 2, based on their Gini importance. The best model, which obtains a prediction accuracy above 80%, selects the following four features as cumulatively responsible for over 99% of the Gini importance: (1) number of assists; (2) number of kills; (3) number of deaths; and (4) gold earned. We retain these four features, normalize them as in Equation (2), and discard all the others in the rest of the analysis. The final dataset is available online in the Supplementary Materials: data are provided in a table format in which each line contains the id of a user playing in a certain match, and his/her number of actions.
We can finally build the tensor X I × J × K used for the analysis. This is a three-dimensional array where I = 961 users, J = 4 features, and K = 100 time steps, i.e., number of successive matches.

4. Results and Discussion

Our LoL data is now represented as a tensor X I × J × K , where I = 961 , J = 4 , and K = 100 . Therefore, the resulting three-way tensor has dimensions related to the players, the selected features, and the time steps, which here coincide with the matches. Once the tensor is created, we compute its approximation X a p p by applying NTF to detect the groups of players with similar characteristics and temporal evolution. As shown in Section 2, NTF decomposes the tensor into the sum of R components. Thus, we first have to find the value of R which provide the best approximation of the tensor. To this aim we compare the results provided by the Core Consistency Diagnostic (CORCONDIA) and the Automatic Relevance Determination (ARD) for Tucker models.
CONCORDIA
We run 5 simulations for each number of components r. We performed the simulations for the rank values r = 1 , , 10 and study the core consistency curve. The number of components that yields the largest knee in the slope of the core consistency curve is R = 3 .
ARD Tucker
As we are comparing two PARAFAC/CANDECOMP (CP) decomposition models [30] (see details in Section 2), we require to have a diagonal core in the ARD Tucker. By following [35], we run 20 different ARD CP models initialized with 10 components based on Gaussian priors. Results indicate that 7 components out of 10 were pruned during the approximation, thus leading to the rank value R = 3 .
As the results provided by the two techniques are consistent, we set R = 3 (i.e., three components) for the following analysis and then select the best approximation, by choosing the one corresponding to the maximum value of core consistency for the selected rank R. Each component can be interpreted as a group of users sharing similar temporal trajectories and being characterized by some features. We reiterate that each component is described by the columns of the three factor matrices A , B , C (which we examine in the following): the first component corresponds to the first column of each matrix, the second component to the second column, and the third component to the third column.
We first analyze the results provided in the matrix B , which are shown in Figure 2. Here, we report the values of the matrix B that have a key role in the components. To this aim, for each component we sort their squared values in descending order, sum them (starting from the highest value) until we reach the 95 % of the overall component norm, and set the remaining values equal to zero. The result of this procedure, shown in Figure 2, highlights the features that are involved in each component. As an example, the component 0 is characterized by the features related to the assists and the earned gold. Here, the features are marked as follows: (0) number of assists; (1) number of deaths; (2) number of kills; (3) amount of earned gold.
We then analyze the factor matrix A to find user memberships to each component. As we explain in detail in Section 2, we find the users belonging to each component through a k-means method with a number of clusters equal to the number of components, k = 3 in this case. This assumption is also supported by the Silhouette scores, computed for several values of k. In particular, for k = 3 the score is equal to 0.35 , while by increasing the number of clusters the score decreases, assuming values equal to 0.32 and 0.29 respectively for k = 4 and k = 5 and stabilizing below 0.29 for k > 5 . Thus, by fixing k = 3 the method assigns a unique label to each user and divides them into three disjoint groups.
As we can observe from Figure 3a, the k-means with k = 3 finds three clusters of users, which are disjoint in the component space, i.e., given a user i its coordinates in the component space are given by the entries in the columns of the factor matrix A . This grouping allows to identify the users whose membership to a specific component is higher than to the others. Clusters 0, 1, and 2 respectively contain 411, 304, and 246 users. Figure 3b shows the Silhouette profiles of the three clusters, proportional to their sizes.
The difference in the level of membership of users belonging to the different clusters is clear if we look at the values of A and how they are modulated in time. This is possible by computing for each r-th component the product P = a r c r T R I × K , which represents the membership of each user to the r-th component modulated over time by the temporal activity of the r-th component. In Figure 4, we report the average membership score over time and the related standard error (represented by error bars), computed by separately taking into account the three clusters of users. Each cluster is systematically characterized by an overall level of membership to one specific component that is much greater than to the other components. Figure 4a demonstrates the strong relation between Cluster 0 and Component 1 (cf. black squares), Figure 4b shows the strong relation between Cluster 1 and Component 2 (cf. dark red circles), while Figure 4c exhibits the strong relation between Cluster 2 and Component 0 (cf., dark green triangles). It is worth noting that there is a high gap between the average memberships over time to the cluster-related component and the remaining two components. This pattern indicates that:
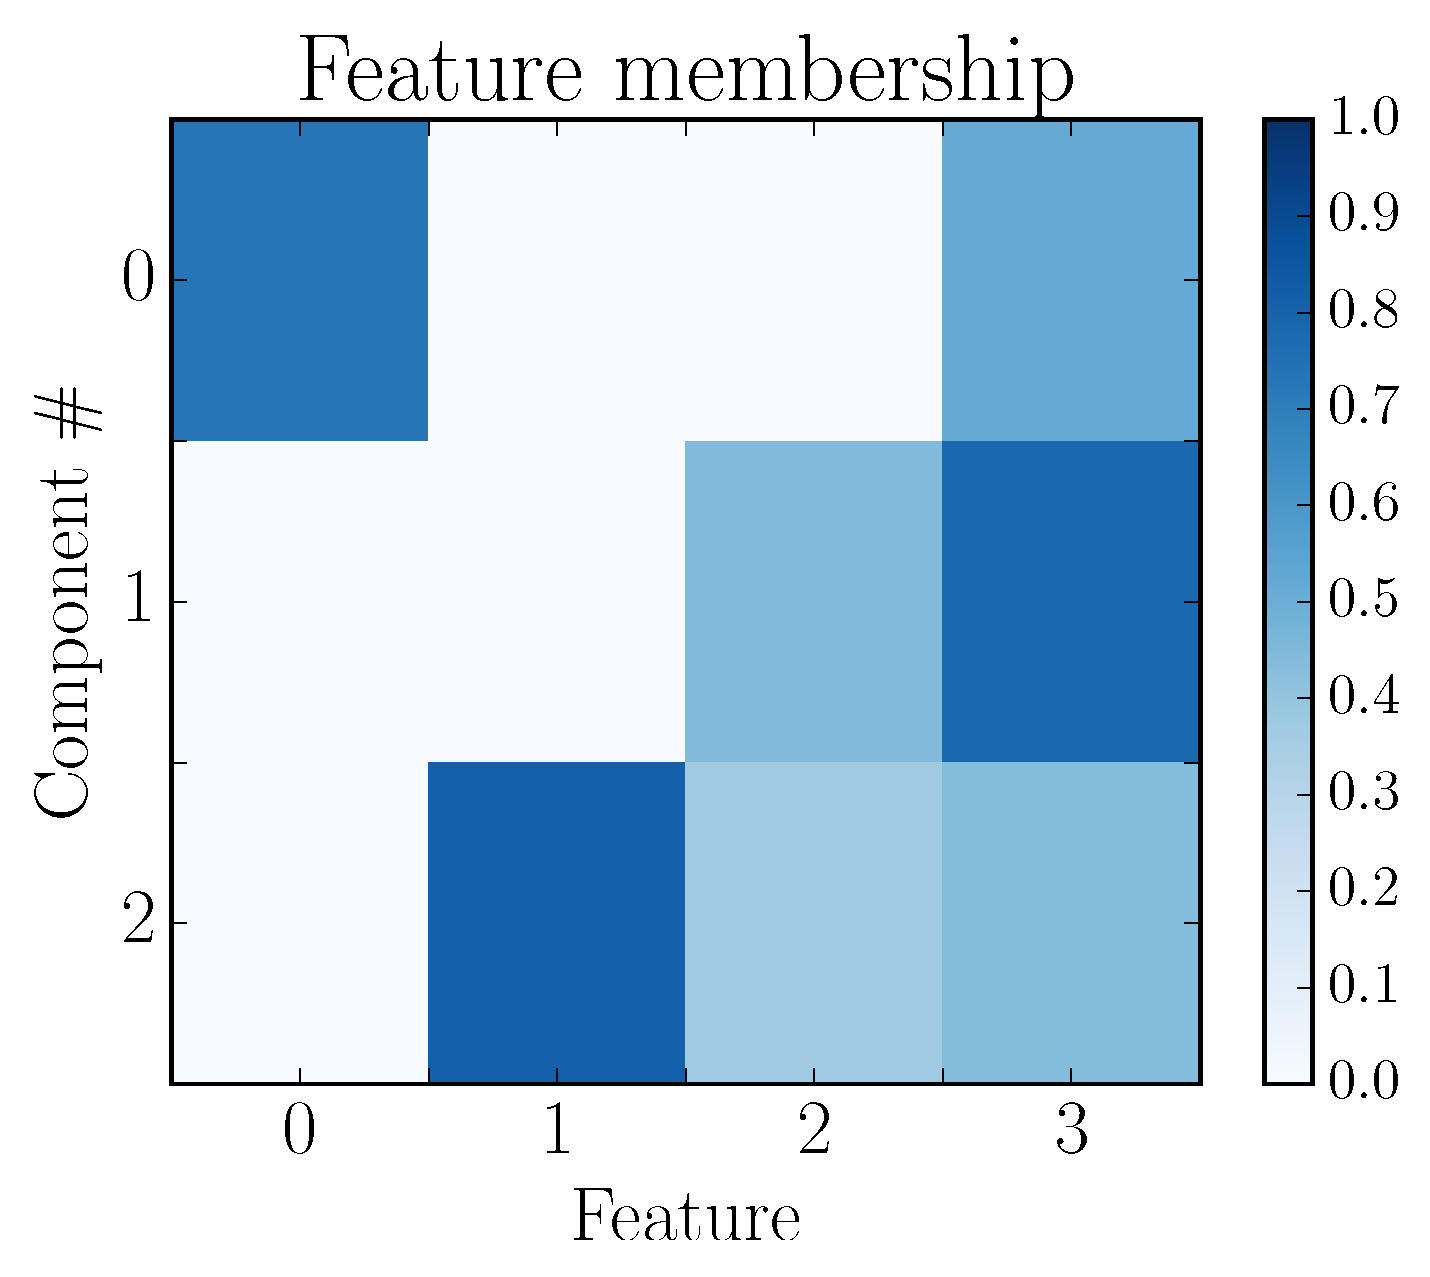
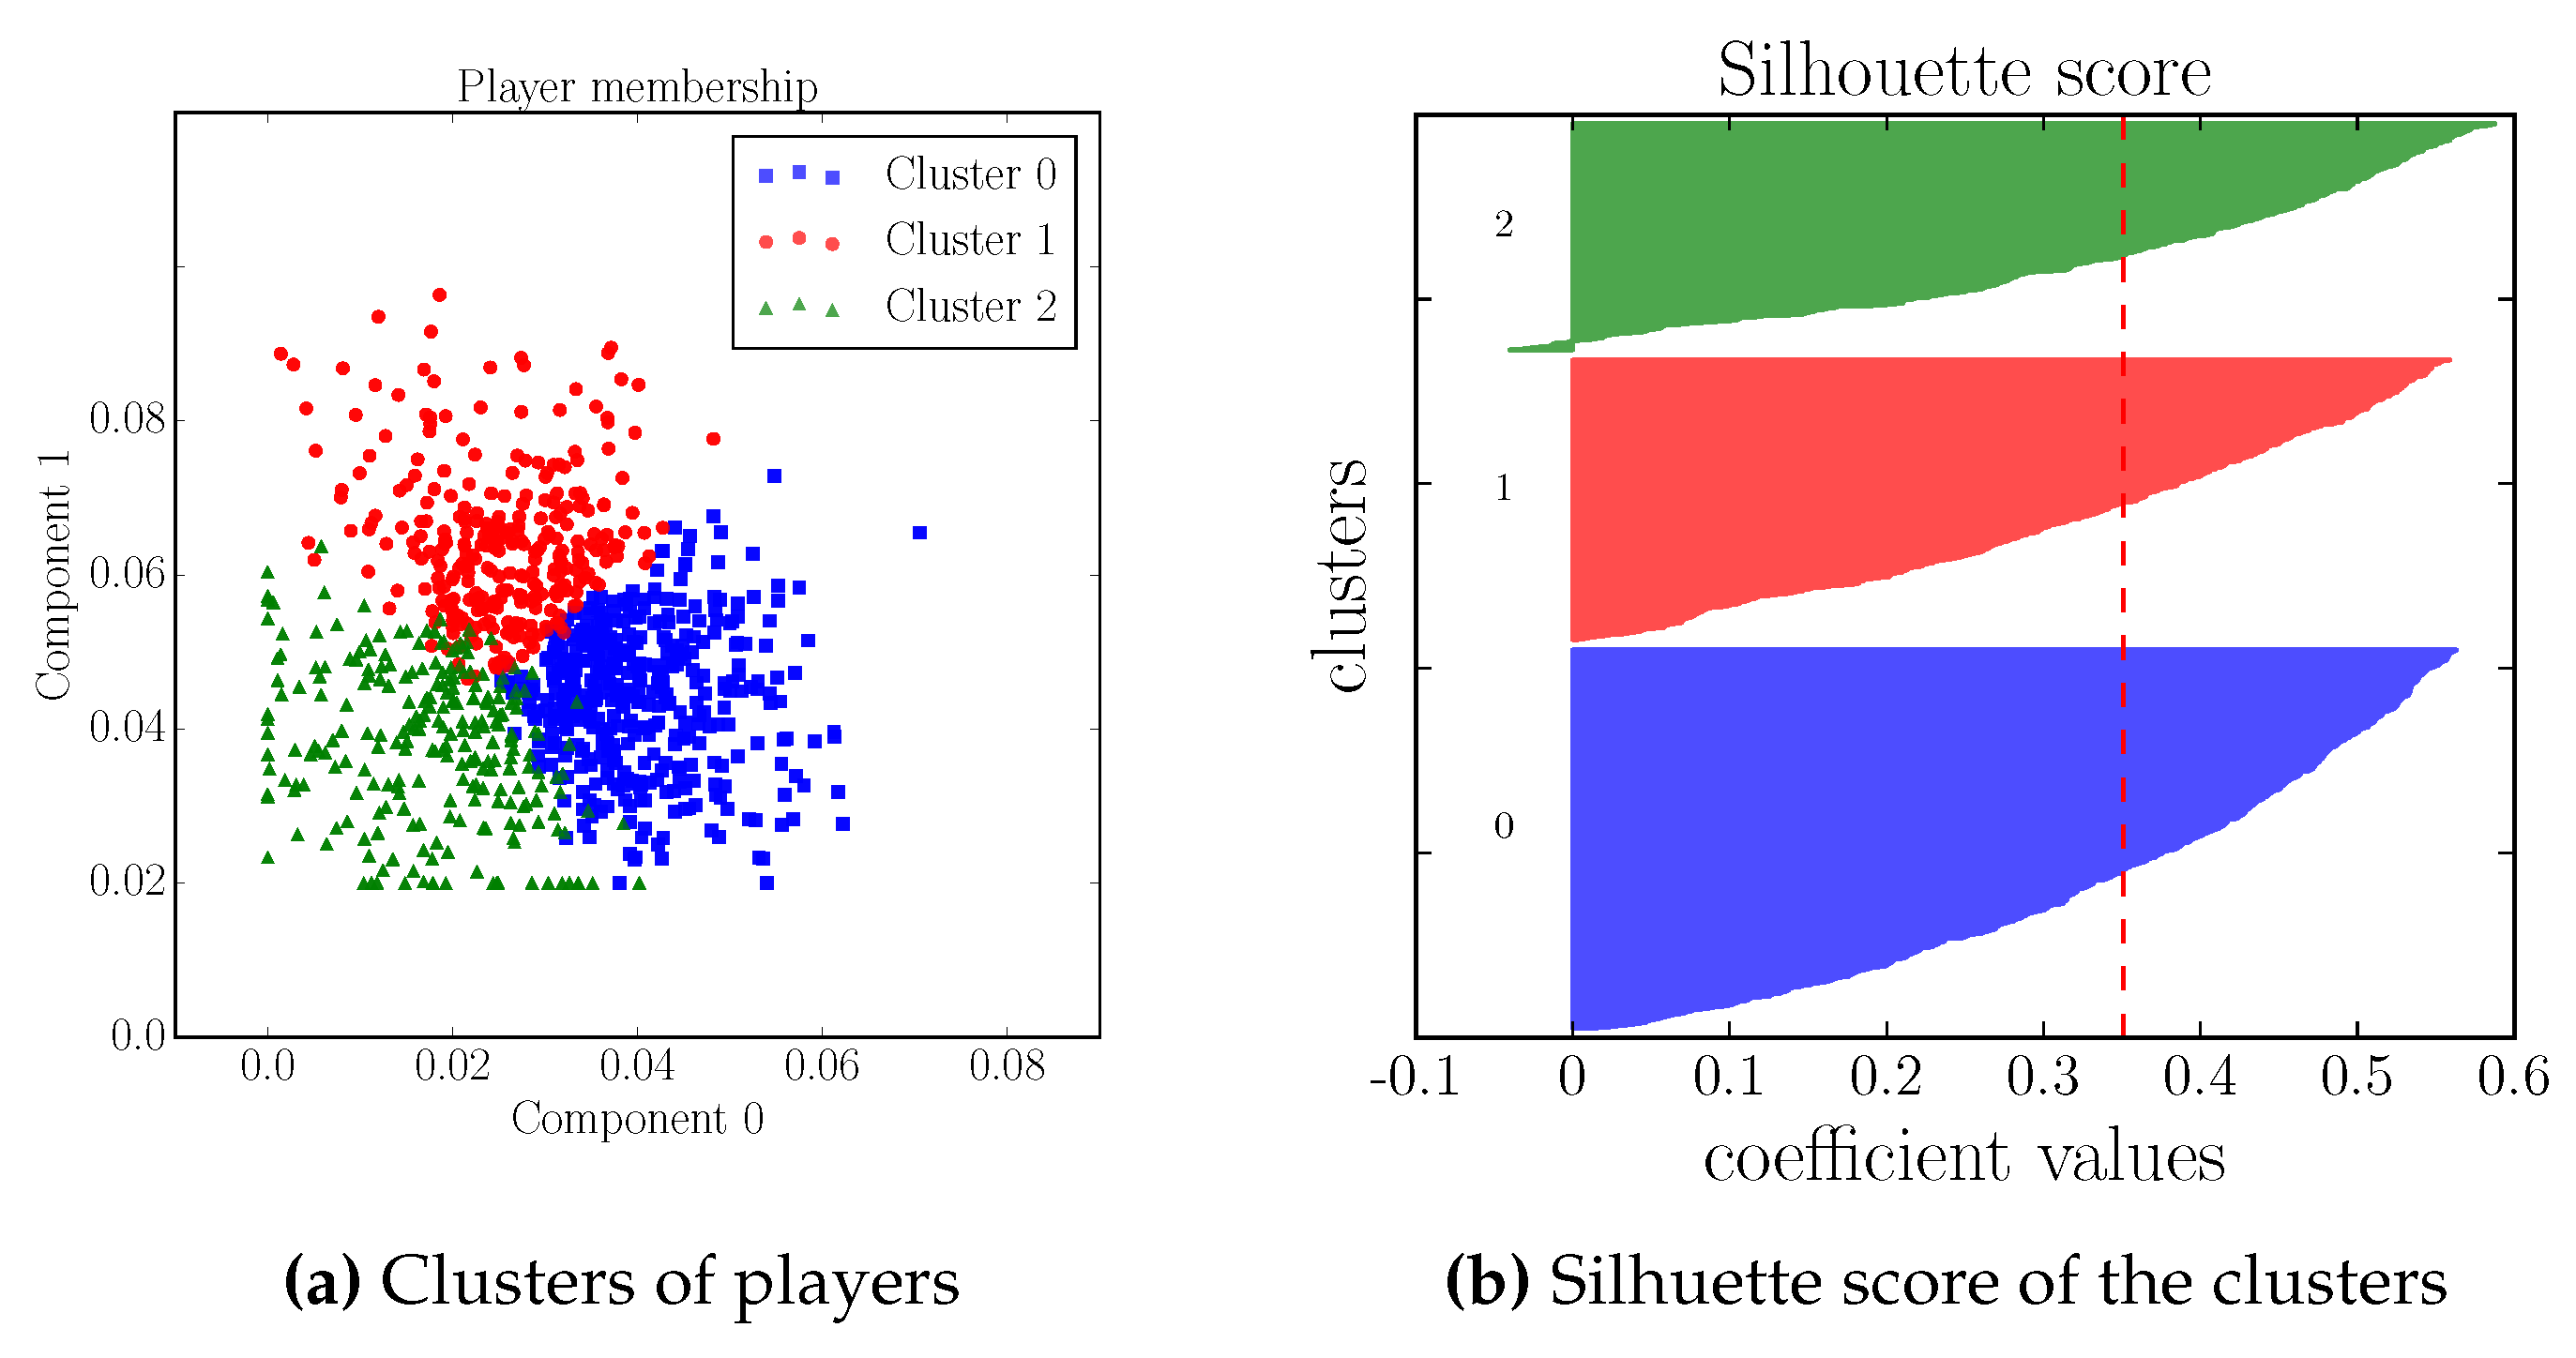
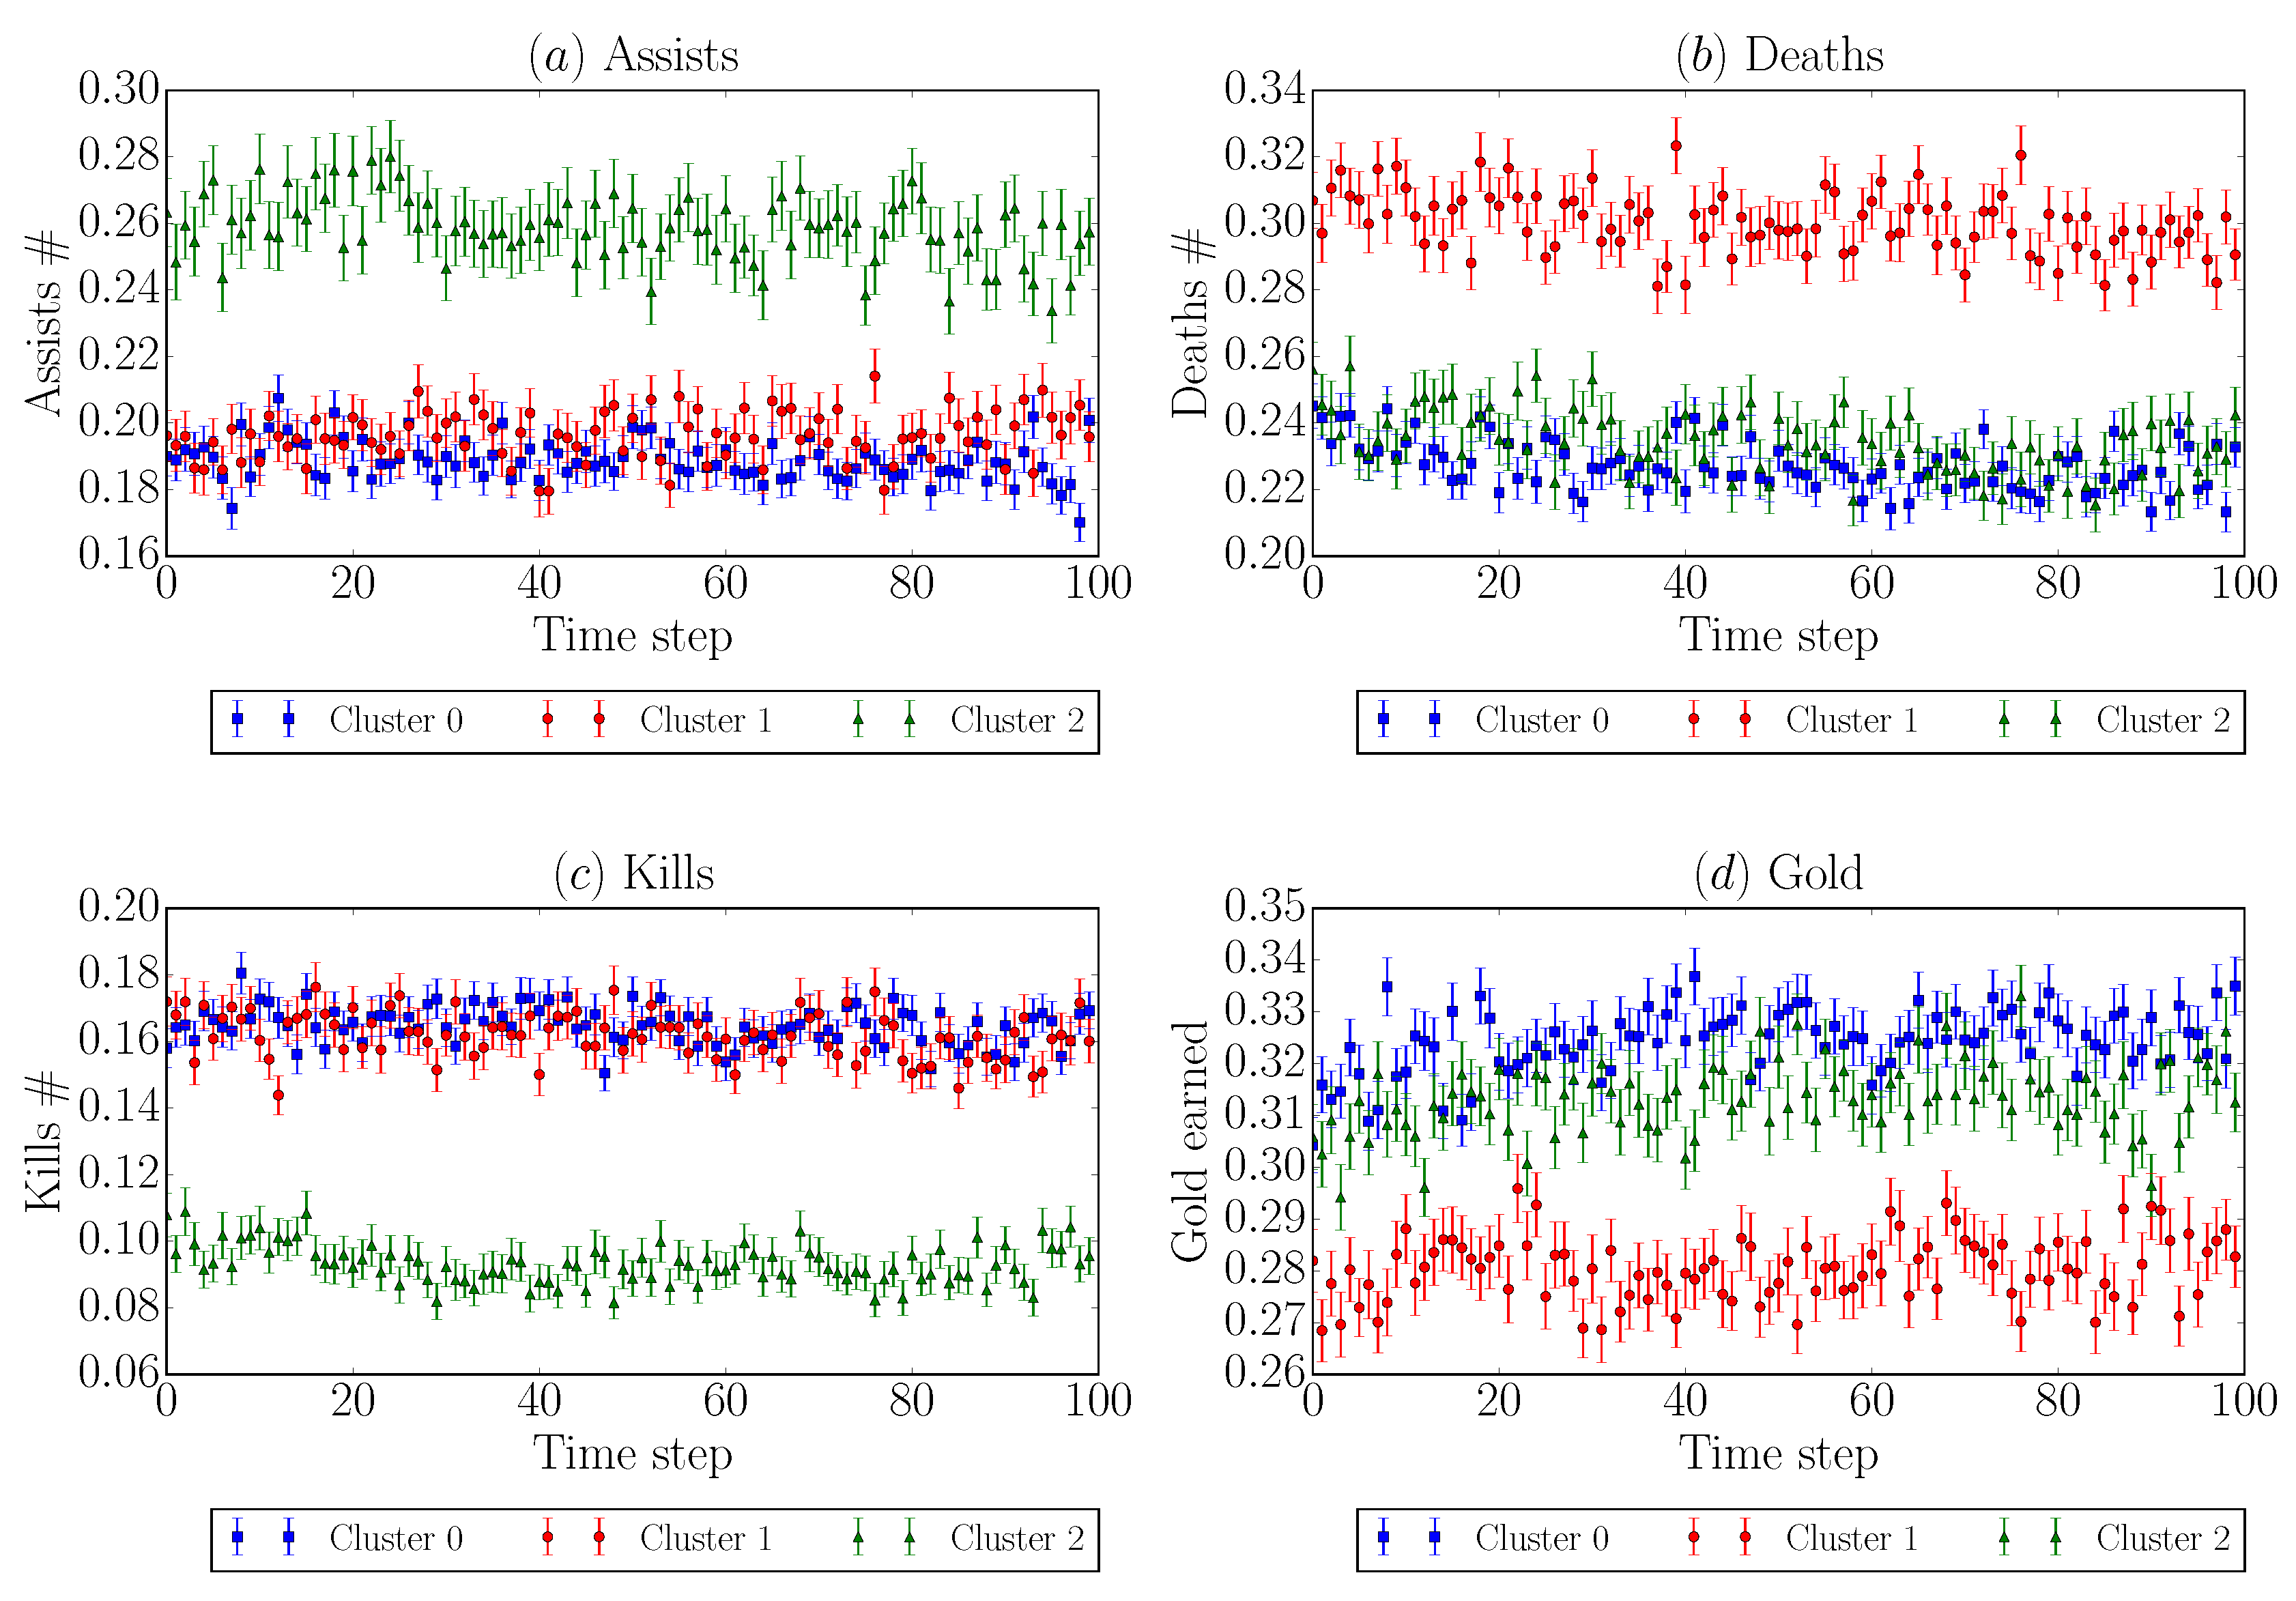
  • Users belonging to Cluster 0 and thus to Component 1 are strongly characterized by the features kills and earned gold;
  • Users in Cluster 1 and thus belonging to Component 2 are characterized by deaths, kills, and earned gold;
  • Users belonging to Cluster 2 and Component 0 are strongly characterized by assists and earned gold.
Through the analysis of NTF results, we are able not only to identify the features that play a key role in a certain component, but we can easily find the user membership to the component. This enables linking each user in the component to the features that characterize the strategy used in the game. An interpretation for these results is indeed that different groups of users are characterized by a playing behavior which is different from group to group. In particular, some users, such as those related to Component 0, tend to collaborate more than others with their teammates, as they prefer to assist in fighting an enemy rather than killing him directly. Other users (e.g., Component 1) are prone to performing individual actions, focusing on personal goals, such as earning a greater amount of gold, which can be spent to upgrade the player’s champion abilities. Finally, in Component 2 we detect a group of users that perform individual actions, such as a high number of kills, but are significantly more likely to cause their hero to die during these actions. This might pinpoint a group of users characterized by an overall lower performance if compared with the other players.

4.1. Validation

To validate the results obtained via NTF and the related interpretation, we selected the players in each cluster, and then we computed the mean and standard error of the different feature values at each time step (i.e., each match). The results are shown in Figure 5, where each plot is related to a specific feature, namely (a) number of assists; (b) number of deaths; (c) number of kills; and (d) amount of earned gold.
The results support the hypothesis and interpretation derived by the NTF analysis: Cluster 0 (cf., blue squares) is composed by players whose major behavior dynamic over time is summarized by performing a high number of kills and earning at the same time a greater amount of gold than other players (as we mentioned earlier, the amount of gold is proportional to the number of kills, which here serves as a further sanity check). Cluster 1 (cf., red circles) consists of players that obtain a number of kills comparable to the users in Cluster 0, however their higher-than-average number of deaths causes them to systematically collect less gold (if compared with the other two clusters). Finally, Cluster 2 involves players characterized by stronger social behavior, resulting in collaboration with the other team members, as conveyed by the larger number of assists and smaller number of kills. This strategy allows players in Cluster 2 to collect a good amount of gold while at the same time keeping a low level of deaths.
One of the strengths of using a technique such as NTF is that we can disentangle the topological characteristics in the data, such as group of users characterized by similar features, from the temporal behaviors. The temporal information is indeed contained in the matrix C , whose columns represent the timeseries of the temporal activation of each component, from which we can extract some meaningful interpretation of the evolution of players’ behaviors.
We expect that by testing different strategies, players can modify or adapt their way of playing to achieve better performances. This fact would be described by a change (such as an abrupt jump) in the temporal activity of a component, meaning that the component would activate or deactivate at a certain time.
However, by the analysis of the factor matrix C , we can notice that each component is systematically active over time, i.e., despite different levels of activation, no significant behavioral change is noticeable in the behavioral trajectories of the players over the course of their 100 matches.
This result, illustrated in Figure 6, suggests that the group of users characterized by a specific strategy (i.e., one of the three leading strategies we highlighted above) is consistent over time; in other words, players are reluctant to continuously in changing their gaming behavior and strategy, even if that could occasionally entail a benefit.
We found an explanation for this phenomenon, which we suspect is related to the game design. League of Legends is based on a mathematical framework, that at the beginning of each match compares the players’ skills to create the opposing teams as follows. Each player in LoL is characterized by an Elo-like rating (https://en.wikipedia.org/wiki/Elo_rating_system) which represents the player skill level, based on the performances in the previous matches. Thus, the resulting matchmaking rating is used by the system in assembling the teams and creating a game in which both teams have an equal chance of winning. (https://support.riotgames.com/hc/en-us/articles/201752954-Matchmaking-Guide).
Considering the LoL game design, we then compute the probability distribution of match winning for all players in each cluster identified by NTF. In Figure 7, we report the Kernel Density Estimation (KDE) for the distribution of the victories in each cluster. The KDE estimates the probability density function of the feature winner of each player involved in a certain cluster. This binary feature is equal to 1 if a player wins a match, and 0 otherwise.
By looking at the density function for each cluster, it appears that the distributions are centered around 0.5 , suggesting that each player at the beginning of each match has roughly a 50 % probability of winning or losing the match. However, closer inspection shows that these distributions are slightly skewed: Cluster 0 leans toward values higher than 0.5 , suggesting that the individualist strategy (aiming for a larger number of kills and less assists), in the long run yields marginally more victories than the cooperative strategy of Cluster 2. We verified, using a pairwise two-tailed t-test, that these distributions are indeed statistically significantly different (all p-values 10 3 ).
In conclusion, the League of Legends game design, and in particular the method used to create the opposing teams of a match, strongly affects the matches’ outcomes. Each user has roughly the same probability of winning a match, which is largely independent from the strategy used by players. Marginal changes can be noticed thanks to our NTF analysis that would otherwise get lost in the aggregated statistical analysis if oblivious of the social and temporal behavioral dynamics. We suggest that players do not have enough incentives to change their natural behavior as they likely perceive themselves to achieve the same winning performances of players characterized by a different strategy. This explains the temporal activity patterns discovered by NTF and their continuous and almost constant activation over time.
The findings of the present work might benefit players and game companies alike. As for players, knowing the features that characterize them the most could help to identify better strategies or character that align more to their play-style, skills, and performance. For instance, if a player can be informed that s/he belongs to the group mostly characterized by number of kills, s/he might prefer to focus on champions with a focus on combat that better align to the player’s skills. Conversely, if a player belongs to the group of those better characterized by supporting roles, they may benefit from learning about their effectiveness and choose champions accordingly. Moreover, realizing how players’ performance evolves would constitute an incentive to the players to improve their strategies and focus their efforts on certain aspects of the game as opposed to others. For example, discovering that the number of deaths is the strongest indicator of one’s performance may encourage a player to try different strategies and improve their scores.
Monitoring how players perform over time can provide useful insights for game developers aimed to improve engagement and game experience. For example, if a player changes his/her playing behavior and the performance in terms of actions decreases over time, this might be a signal that the player’s engagement in the game is diminishing: detecting these change-points in a timely manner may yield an opportunity to the game designers to intervene (for example by providing in-game digital incentives) to prevent the player to ultimately quit the game.

4.2. Related Work

Several facets of League of Legends, including players behaviors, expertise, and features have been already investigated [36,37]. Many works are focused on the analysis of League of Legends team composition. In [38], the authors analyze player behaviors by developing a framework based on unsupervised learning techniques to discover behavior clusters in the data. In particular, they try to learn the optimal team composition and demonstrate how the result of matches can be predicted on the basis of the features characterizing the team. In our work, we used the winning prediction task to determine the most informative features that characterize players’ behaviors.
In [3] the authors study the social interactions and organization patterns of LoL players, to understand how collaboration arises during MOBA games. They collected a dataset based on interviews of experienced LoL players and found that team members collaborate and coordinate to reach the same goal and increase their performance in the game.
Other studies of LoL are focused on the analysis of specific game features, such as the usage of different characters (i.e., champions) [39], or the player choice of a specific role with respect to the one selected by the other team members [40]. The main goal in these studies is to investigate how roles and specific features have an impact on the players’ performance, to recommend team design and evaluations that can be used by players when selecting a character. Our study, however, discovers in an unsupervised fashion the playing behaviors and the players’ roles during the matches: we believe that our strategy could enrich the insights that game designers and analysts need to improve the game experience.
It is also worth noting that most of the existing studies are mainly focused on the analysis of LoL from a team-based perspective, to characterize groups performance. In the present work, we investigated individual player behaviors, and how that related to player performances at the level of single matches. In our analysis, we also highlighted the crucial importance of the temporal dimension. We monitored the evolution of features over time, to determine whether and how players learn or modify their strategy, and to detect if a common activity pattern can be found.

5. Conclusions

League of Legends is a multiplayer online battle game in which two teams fight each other to destroy the respective enemy base. We collected data related to League of Legends matches and player performances with the aim of extracting meaningful information about human behavioral patterns. For this purpose, we took advantage of Non-negative Tensor Factorization (NTF), a technique that allows to extract correlation in the data in several dimensions at a time. The advantage of using such a technique lies indeed in the opportunity of disentangling the topological and temporal characteristics in the data, and exploring and validating them separately.
Here, we analyzed a dataset composed by nearly 1000 players, characterized by different features, e.g., number of kills, number of deaths, etc., which varies over time, from match to match. We represented the data as a tensor and we applied NTF to extract the factor matrices related to the players, the features, and the temporal activities.
The analysis of the NTF outcome and the application of clustering methods, such as the k-means, highlighted the presence in the data of several groups of players, characterized by a correlated behavior in time and topology. In particular, players belonging to the same component (cluster) are characterized by similar features and activation over time. We carried out the analysis of the topological characteristics of each group of player by looking at the features highlighted by NTF, and comparing the interpretation derived by these results with the original data. We found good agreement between the NTF output and the characteristics of the discovered groups of players in the original data. Therefore, NTF successfully identified groups of distinct behaviors in the data that can be interpreted as different player strategies.
It would be expected that different strategies (e.g., collaborative vs. individualist playing) would lead to diverse performances (e.g., affecting the winning/losing ratio). However, by investigating the temporal activity patterns of the player groups, we found that they are mainly characterized by a constant behavior that is active continuously over time. Thus, the analysis of the temporal activation of the NTF components stressed the reluctance of players to adapt their strategy and gaming behavior over time.
This finding might be due to the game design of League of Legends: the team formation in the game is based on a mathematical rule which aims at contrasting teams with comparable skills, thus yielding the same prior probability of victory to each team.
We supported this fact by computing the Kernel Density Estimation over the feature winner for each player, divided by clusters. Only marginal, yet statistically significant, differences emerged, which are likely not perceivable by the players. Thus, players are not incentivized to change their strategy with another one.
In conclusion, the techniques and approaches used in this work are promising, and open new questions about human behaviors in multiplayer online games. The information provided by our framework could help game developers to design recommending systems for users and enhance users’ engagement. Uncovering players’ strategies would allow to recommend different types of champions, such as “support” champions if players are characterized by assisting actions, or “action” champions if they are otherwise more inclined in killing. Moreover, monitoring the group each user belongs to over time could help in promoting engagement in the game, through the use of custom rewards.
Future work will be devoted to the analysis of both different aspects of the game and of additional game datasets with the aim of exploring behavioral patterns in different scenarios. We are indeed interested in verifying if player strategies change depending on the champion player select and how different roles affect their performance over time. Moreover, we would like to study if the characteristics identified by the NTF might reflect the strategies of players with different skill levels. We are working on reproducing the evolution of skill level for players in LoL by computing a proxy, namely the TrueSkill (https://www.microsoft.com/en-us/research/project/trueskill-ranking-system/), for the actual score used in the game, which is not publicly available in the game data. We also aim to investigate, given the possibility of disentangling player’s behaviors over time, if it is possible to nudge players to change their strategies by the use of incentives, such as high percentage of victory. We finally plan to test other tensor factorization techniques, such as PARAFAC2, which will allow to integrate players having variable numbers of matches in their gaming history.

Supplementary Materials

The supplementary materials are available online at https://www.mdpi.com/2078-2489/9/3/66/s1.

Acknowledgments

The authors are grateful to DARPA for support (grant #D16AP00115). This project does not necessarily reflect the position/policy of the Government; no official endorsement should be inferred. Approved for public release; unlimited distribution.

Author Contributions

All authors substantially contributed to the present work. A.S. and E.F. conceived and designed the experiments. A.B. collected the data. A.S. performed the experiments. All authors analyzed the data and contributed to writing the paper.

Conflicts of Interest

The authors declare no conflict of interest.

Appendix A

In this section, we report the complete list of features (51 total features) provided by the Riot API for each match of LoL. The features can be divided into the following unofficial categories: IDs (5), Temporal Informations (3), Minions (4), Wards (3), Damages (12), Heals (2), Gold (2), Kills (10), Other Actions (4), Scores (5), Game Outcome (1).

Appendix A.1. IDs

This category refers to the in-game identification numbers of the player, of the match, of the champion used by the player, of the team in the match (100 or 200 in each match), and id of the map (battle arena of the match).

Appendix A.2. Temporal Information

In this category we find information about the date-time of the match, the match duration, and the time needed to create the match.

Appendix A.3. Minions

Minions are AI controlled units that can be both allies of one of the two teams or neutral. They automatically attack any enemy unit or structure they encounter. We have information about how many minions are killed by the players. In particular, we have the total number of minions killed, the number of neutral minions killed, the number of neutral minions killed in the enemy’s jungle, and the number of minions killed in the team’s jungle.

Appendix A.4. Wards

A ward is a unit of the game that can be used to remove the “fog of war”, which is the area of the map in which a team does not have sight over. We have information about how many wards are bought, are placed and are destroyed in the match.

Appendix A.5. Damages

There are four different types of damages in LoL: true, physical, magical and total damage. For each of these types of damage we know the amount of damage that was dealt, dealt to champions, and taken in the match.

Appendix A.6. Heals

Heal is an action that instantly restores health to your champion and an ally, also granting a temporary movement speed bonus. We have information about the total heal and the total units healed in the match.

Appendix A.7. Gold

Gold is the internal currency of LoL, which is used to purchase items and upgrade champions. We know for each player the amount of Gold earned in the game and the amount spent.

Appendix A.8. Kills

A kill is the action of decreasing an enemy champion’s health to zero. The act of killing several champions within 10 s between each kill is a multi-kill. We have information about the total amount of kills, double, triple, quadra, penta-kills, unreal kills (higher then penta-kills) and the largest multi-kill a player performs. Another type of kill is the kill spree, which is the action of killing multiple champions without dying. We have the total number of kill spree and the largest kill spree performed. Finally, we know about the number of inhibitors kills, where an inhibitor is a structure that blocks the training of minions.

Appendix A.9. Other Actions

Other features are related to the number of assists (when a player assists a teammate in killing), the number of times a player dies (deaths). We also know the largest critical strike, which is a basic attacks that deals twice its normal damage. Players can increase their probability to critically strike by using items, abilities, etc. Finally, we have information about the total crowd control dealt. Crowd control is a general term used to describe abilities that remove or diminish a unit’s combat ability.

Appendix A.10. Scores

There are different scores and levels achieved during the match. The champion level is the final level achieved during the match and related to the upgrades in abilities and powers a player do with his/her champion, it goes from level 1 to level 18. Finally, the Riot API returns a combat, objective, and total player score and a total score rank. However, these score values returned by the API for any match and player are always 0.

Appendix A.11. Outcome

The outcome of the game is provided by the feature winner, which is a binary feature equal to 0 if the team loses and 1 if wins.

References

  1. Ferrari, S. From generative to conventional play: Moba and league of legends. In Proceedings of the 2013 DiGRA International Conference: DeFragging Game Studies, Atlanta, GA, USA, 26–29 August 2013; pp. 1–17. [Google Scholar]
  2. Foo, C.Y.; Koivisto, E.M. Defining grief play in MMORPGs: Player and developer perceptions. In Proceedings of the 2004 ACM SIGCHI International Conference on Advances in Computer Entertainment Technology, Singapore, 3–5 June 2005; ACM: New York, NY, USA, 2004; pp. 245–250. [Google Scholar]
  3. Kou, Y.; Gui, X. Playing with strangers: Understanding temporary teams in League of Legends. In Proceedings of the First ACM SIGCHI Annual Symposium on Computer-Human Interaction in Play, Toronto, ON, Canada, 19–21 October 2014; ACM: New York, NY, USA, 2014; pp. 161–169. [Google Scholar]
  4. Brown, B.; Bell, M. CSCW at play: ‘there’ as a collaborative virtual environment. In Proceedings of the 2004 ACM conference on Computer Supported Cooperative Work, Chicago, IL, USA, 6–10 November 2004; ACM: New York, NY, USA, 2004; pp. 350–359. [Google Scholar]
  5. Nuangjumnong, T. The effects of gameplay on leadership behaviors: An empirical study on leadership behaviors and roles in multiplayer online battle arena games. In Proceedings of the 2014 IEEE International Conference on Cyberworlds (CW), Santander, Spain, 6–8 October 2014; pp. 300–307. [Google Scholar]
  6. Sapienza, A.; Peng, H.; Ferrara, E. Performance Dynamics and Success in Online Games. In Proceedings of the 2017 IEEE International Conference on Data Mining Workshops (ICDMW), New Orleans, LA, USA, 18–21 November 2017; pp. 902–909. [Google Scholar]
  7. Kou, Y.; Nardi, B. Regulating anti-social behavior on the Internet: The example of League of Legends. In Proceedings of the iConference 2013, Fort Worth, TX, USA, 12–15 February 2013; pp. 616–622. [Google Scholar]
  8. Ducheneaut, N.; Moore, R.J. The social side of gaming: A study of interaction patterns in a massively multiplayer online game. In Proceedings of the 2004 ACM Conference on Computer Supported Cooperative Work, Chicago, IL, USA, 6–10 November 2004; ACM: New York, NY, USA, 2004; pp. 360–369. [Google Scholar]
  9. Shores, K.B.; He, Y.; Swanenburg, K.L.; Kraut, R.; Riedl, J. The identification of deviance and its impact on retention in a multiplayer game. In Proceedings of the 17th ACM Conference on Computer Supported Cooperative Work & Social Computing, Baltimore, MD, USA, 15–19 February 2014; ACM: New York, NY, USA, 2014; pp. 1356–1365. [Google Scholar]
  10. Dabbish, L.; Kraut, R.; Patton, J. Communication and commitment in an online game team. In Proceedings of the SIGCHI Conference on Human Factors in Computing Systems, Austin, TX, USA, 5–10 May 2012; ACM: New York, NY, USA, 2012; pp. 879–888. [Google Scholar]
  11. Ratan, R.A.; Taylor, N.; Hogan, J.; Kennedy, T.; Williams, D. Stand by your man: An examination of gender disparity in League of Legends. Games Cult. 2015, 10, 438–462. [Google Scholar] [CrossRef]
  12. Véron, M.; Marin, O.; Monnet, S. Matchmaking in multi-player on-line games: Studying user traces to improve the user experience. In Proceedings of the Network and Operating System Support on Digital Audio and Video Workshop, Singapore, 19–21 March 2014; ACM: New York, NY, USA, 2014; pp. 7–12. [Google Scholar]
  13. Cichocki, A.; Zdunek, R.; Phan, A.H.; Amari, S.I. Nonnegative Matrix and Tensor Factorizations: Applications to Exploratory Multi-Way Data Analysis and Blind Source Separation; John Wiley & Sons: Hoboken, NJ, USA, 2009. [Google Scholar]
  14. Lim, L.H.; Comon, P. Nonnegative approximations of nonnegative tensors. J. Chemom. 2009, 23, 432–441. [Google Scholar] [CrossRef] [Green Version]
  15. Liavas, A.P.; Kostoulas, G.; Lourakis, G.; Huang, K.; Sidiropoulos, N.D. Nesterov-based Alternating Optimization for Nonnegative Tensor Factorization: Algorithm and Parallel Implementation. IEEE Trans. Signal Process. 2017, 66, 944–953. [Google Scholar] [CrossRef]
  16. Rajapakse, M.; Tan, J.; Rajapakse, J. Color channel encoding with NMF for face recognition. In Proceedings of the 2004 IEEE International Conference on Image Processing, Singapore, 24–27 October 2004; pp. 2007–2010. [Google Scholar]
  17. Buciu, I.; Pitas, I. Application of non-negative and local non negative matrix factorization to facial expression recognition. In Proceedings of the IEEE 17th International Conference on Pattern Recognition, Cambridge, UK, 26 August 2004; pp. 288–291. [Google Scholar]
  18. Zhang, T.; Fang, B.; Tang, Y.Y.; He, G.; Wen, J. Topology preserving non-negative matrix factorization for face recognition. IEEE Trans. Image Process. 2008, 17, 574–584. [Google Scholar] [CrossRef] [PubMed]
  19. Yuan, Y.; Fu, M.; Lu, X. Substance dependence constrained sparse NMF for hyperspectral unmixing. IEEE Trans. Geosci. Remote Sens. 2015, 53, 2975–2986. [Google Scholar] [CrossRef]
  20. Tsinos, C.G.; Rontogiannis, A.A.; Berberidis, K. Distributed blind hyperspectral unmixing via joint sparsity and low-rank constrained non-negative matrix factorization. IEEE Trans. Comput. Imaging 2017, 3, 160–174. [Google Scholar] [CrossRef]
  21. Yang, J.; Leskovec, J. Overlapping community detection at scale: A nonnegative matrix factorization approach. In Proceedings of the Sixth ACM International Conference on Web Search and Data Mining, Rome, Italy, 4–8 February 2013; ACM: New York, NY, USA, 2013; pp. 587–596. [Google Scholar]
  22. Psorakis, I.; Roberts, S.; Ebden, M.; Sheldon, B. Overlapping community detection using bayesian non-negative matrix factorization. Phys. Rev. E 2011, 83, 066114. [Google Scholar] [CrossRef] [PubMed]
  23. Koren, Y.; Bell, R.; Volinsky, C. Matrix factorization techniques for recommender systems. Computer 2009, 42. [Google Scholar] [CrossRef]
  24. Ma, H.; Yang, H.; Lyu, M.R.; King, I. Sorec: Social recommendation using probabilistic matrix factorization. In Proceedings of the 17th ACM Conference on Information and Knowledge Management, Napa Valley, CA, USA, 26–30 October 2008; ACM: New York, NY, USA, 2008; pp. 931–940. [Google Scholar]
  25. Papalexakis, E.E.; Faloutsos, C.; Sidiropoulos, N.D. Tensors for data mining and data fusion: Models, applications, and scalable algorithms. ACM Trans. Intell. Syst. Technol. (TIST) 2017, 8, 16. [Google Scholar] [CrossRef]
  26. Kolda, T.G.; Bader, B.W. Tensor decompositions and applications. SIAM Rev. 2009, 51, 455–500. [Google Scholar] [CrossRef]
  27. Gauvin, L.; Panisson, A.; Cattuto, C. Detecting the community structure and activity patterns of temporal networks: A Non-negative Tensor Factorization approach. PLoS ONE 2014, 9, e86028. [Google Scholar] [CrossRef] [PubMed]
  28. Sapienza, A.; Panisson, A.; Wu, J.; Gauvin, L.; Cattuto, C. Detecting Anomalies in Time-varying Networks using Tensor Decomposition. In Proceedings of the 2015 IEEE International Conference on Data Mining Workshop (ICDMW), Atlantic City, NJ, USA, 14–17 November 2015; pp. 516–523. [Google Scholar]
  29. Panisson, A.; Gauvin, L.; Quaggiotto, M.; Cattuto, C. Mining concurrent topical activity in microblog streams. arXiv, 2014; arXiv:1403.1403. [Google Scholar]
  30. Royer, J.P.; Thirion-Moreau, N.; Comon, P. Computing the polyadic decomposition of nonnegative third order tensors. Signal Process. 2011, 91, 2159–2171. [Google Scholar] [CrossRef] [Green Version]
  31. Kolda, T.G. Multilinear Operators for Higher-Order Decompositions; Technical Report; Sandia National Laboratories: Albuquerque, NM, USA, 2006.
  32. Kim, H.; Park, H.; Eldén, L. Non-negative Tensor Factorization based on alternating large-scale non-negativity-constrained least squares. In Proceedings of the 2007 IEEE 7th International Symposium on BioInformatics and BioEngineering, Boston, MA, USA, 14–17 October 2007; pp. 1147–1151, NTF algorithm based on ANLS + regularization. [Google Scholar]
  33. Kim, J.; Park, H. Fast nonnegative tensor factorization with an active-set-like method. In High-Performance Scientific Computing; Springer: Berlin/Heidelberg, Germany, 2012; pp. 311–326. [Google Scholar]
  34. Bro, R.; Kiers, H.A. A new efficient method for determining the number of components in PARAFAC models. J. Chemom. 2003, 17, 274–286. [Google Scholar] [CrossRef]
  35. Mørup, M.; Hansen, L.K. Automatic relevance determination for multi-way models. J. Chemom. 2009, 23, 352–363. [Google Scholar] [CrossRef]
  36. Kou, Y.; Nardi, B.A. Governance in League of Legends: A hybrid system. In Proceedings of the Foundation of Digital Games, Fort Lauderdale, FL, USA, 3–7 April 2014. [Google Scholar]
  37. Donaldson, S. Mechanics and metagame: Exploring binary expertise in League of Legends. Games Cult. 2017, 12, 426–444. [Google Scholar] [CrossRef]
  38. Ong, H.Y.; Deolalikar, S.; Peng, M. Player Behavior and Optimal Team Composition for Online Multiplayer Games. arXiv, 2015; arXiv:1503.02230. [Google Scholar]
  39. Lee, C.S.; Ramler, I. Investigating the impact of game features and content on champion usage in league of legends. In Proceedings of the Foundation of Digital Games, Pacific Grove, CA, USA, 22–25 June 2015. [Google Scholar]
  40. Kim, J.; Keegan, B.C.; Park, S.; Oh, A. The Proficiency-Congruency Dilemma: Virtual Team Design and Performance in Multiplayer Online Games. In Proceedings of the 2016 CHI Conference on Human Factors in Computing Systems, San Jose, CA, USA, 7–12 May 2016; ACM: New York, NY, USA, 2016; pp. 4351–4365. [Google Scholar]
Figure 1. Framework. Our methodology is divided into several steps. First, we use Decision Trees to find the features of the dataset that are meaningful in predicting users’ performance (the outcome is the feature “winner”). Once the features are selected, we create a tensor whose dimensions coincide to users, selected features, and time. We then decompose the tensor by applying NTF and detect the factor matrices A, B, and C, providing the users’ and features membership, and temporal activity respectively. Finally, we use this information to analyze the discovered groups of users characterized by similar features and temporal behavior.
Information 09 00066 g001
Figure 2. Feature membership in the components: we show the matrix B in which we zero-out the entries which are not included in the 95 % of the norm of the component. Here, the colorbar indicates the level of membership of each feature to the three different components. The features are respectively: assists (0), deaths (1), kills (2), and gold (3).
Information 09 00066 g002
Figure 3. K-means results: (a) 2-dimensional projection of the three clusters identified by the k-means. Each dot represents a player in its corresponding cluster, and the dot’s coordinates are given by the first two columns of the matrix A . (b) Silhouette scores of the users belonging to the three clusters. The red line identifies the final Silhouette score of 0.35, and the width of the Silhouette profiles indicates the size of the corresponding clusters.
Information 09 00066 g003
Figure 4. Membership modulated in time, given by the product a r c r T . The product is computed by separately taking into account the users belonging to the different clusters. For each cluster we report the mean of the users’ membership to each component over time, and the related standard error, marked with an error bar. Different shades of blue for cluster 0, red for cluster 1, and green for cluster 2 are assigned to distinguish the components.
Information 09 00066 g004
Figure 5. Mean values and related standard errors over time of: (a) number of assists; (b) number of deaths; (c) number of kills; and (d) amount of gold earned. We computed the mean and the standard error over the values related to users belonging to the same cluster. Clusters are marked by a unique symbol and color, which is maintained in all the figures, to highlight the different cluster characteristics.
Information 09 00066 g005
Figure 6. Temporal activity of each component. The values displayed coincide to those in the columns of C . The different markers characterize the different components, according to the clusters colouring.
Information 09 00066 g006
Figure 7. Kernel Density Estimation (KDE) computed on the values related to the feature winner (binary feature equal to 1 if a player wins the match and equal to 0 if a player loses). The figure shows the probability density function for each cluster. We maintained the color code used throughout the text to discriminate the different clusters.
Information 09 00066 g007
Table 1. Notation used throughout the text.
NotationDefinition
Xconstant
xscalar
x vector
X matrix
x i j matrix entry
X tensor
x i j k entry of a three-dimensional tensor
outer product

