Analysis of Document Pre-Processing Effects in Text and Opinion Mining
by
 , , , ,
Danilo Medeiros Eler
1,* ,
,
Denilson Grosa
1,
Ives Pola
2,
Rogério Garcia
1,
Ronaldo Correia
1 and
Jaqueline Teixeira
1 1
Departamento de Matematica e Computação, Sao Paulo State University—UNESP, Presidente Prudente 19060-900, Brazil
2
Departamento de Informática, University of Technology—UTFPR, Pato Branco 85503-390, Brazil
*
Author to whom correspondence should be addressed.
Information 2018, 9(4), 100; https://doi.org/10.3390/info9040100
Submission received: 23 February 2018
/
Revised: 10 April 2018
/
Accepted: 17 April 2018
/
Published: 20 April 2018
(This article belongs to the Special Issue Information Technology: New Generations (ITNG 2017))
Abstract
:Typically, textual information is available as unstructured data, which require processing so that data mining algorithms can handle such data; this processing is known as the pre-processing step in the overall text mining process. This paper aims at analyzing the strong impact that the pre-processing step has on most mining tasks. Therefore, we propose a methodology to vary distinct combinations of pre-processing steps and to analyze which pre-processing combination allows high precision. In order to show different combinations of pre-processing methods, experiments were performed by comparing some combinations such as stemming, term weighting, term elimination based on low frequency cut and stop words elimination. These combinations were applied in text and opinion mining tasks, from which correct classification rates were computed to highlight the strong impact of the pre-processing combinations. Additionally, we provide graphical representations from each pre-processing combination to show how visual approaches are useful to show the processing effects on document similarities and group formation (i.e., cohesion and separation).
1. Introduction
Many documents are continuously generated and stored by distinct institutions, organizations and researchers. Considering the amount of data and their complexity, text mining techniques are widely employed to classify, organize and provide useful knowledge from textual data [1]. Usually, the input data are unstructured and need to be pre-processed before mining tasks.
The document pre-processing phase is composed of essential steps for several techniques that deal with textual data, such as text and opinion mining tasks. The pre-processing steps usually filter documents of interest, eliminate irrelevant terms and assign weights to relevant terms. However, the pre-processing phase is less focused on the text mining scenario [2] due to its non-automatic nature, in which the user needs to define parameters. In order to analyze the effects of pre-processing and parameter configurations in text and opinion mining tasks, quality measures are used to verify which pre-processing step leads to the best mining result [3]. For example, the classification rate can be employed to evaluate the effect of pre-processing on the accuracy of the classification of texts and opinions [4]. It is important to note that in this paper, we focus on texts and opinions because they are tasks widely discussed in the literature, but there are other subjects that would be benefited by the proposed approach, such as risk prediction modeling [5], patent analysis [6] and sales reports [7].
In this paper, for text mining tasks, distinct vector space models [8] are computed from document collections by varying the pre-processing steps, such as stemming [9], term weighting based on Term Frequency-Inverse Document Frequency (TF-IDF) [10] and the reduction of the amount of terms based on frequency cut [11]. For opinion mining, a combination of stop words elimination and stemming is employed to analyze the pre-processing effects. Additionally, we use multidimensional projection techniques [12] to build graphical representations based on text similarities as a form of textual data representation [13,14]. The results of pre-processing combinations are visualized in a 2D space by using multidimensional projection techniques. The visual analysis facilitates the comprehension of pre-processing effects on document similarities, that is what steps or parameter configuration can improve both groups’ cohesion and separation or the correct classification rate.
The main contributions of this work are the generalization of the approach proposed by Eler et al. [15], which presented a visualization-based approach for analyzing the pre-processing effects in text mining techniques, and the detailed analysis of the pre-processing effects in text and opinion mining, showing that the pre-processing phase plays an important role in mining tasks and the visualization of pre-processing effects, in which graphical representations show the cohesion or separation of document groups when changing the parameters of the configuration during pre-processing. In addition, we show a validation of the best vector space model with the silhouette coefficient [16] and neighborhood hit [13] quality measures, comparing the results with the correct classification rate.
This paper is organized as follows. Section 2 presents the theoretical foundation of the pre-processing steps used in text mining tasks, a brief foundation about multidimensional projection techniques and the main concepts of the opinion mining techniques used in this paper. Section 3 presents the methodology used to analyze the document pre-processing effects. Section 4 presents the experiments performed on text and opinion mining, as well as a discussion about the visual analysis of the vector space models computed from the combination of distinct pre-processing methods. Section 5 concludes the paper, summarizing the main achievements and proposing future work.
2. Theoretical Foundation
This section presents the main concepts and techniques employed in this work, regarding document pre-processing and multidimensional projections, focusing on opinion mining (we discuss specific concepts related to opinion mining [17]).
2.1. Document Pre-Processing
Structured data comprise the main source for most data mining tasks. However, several research fields are supported by unstructured data (e.g., document collections). Thus, when dealing with unstructured data, data mining tasks have to perform several pre-processing steps to compute a structured model for mining tasks. Some of these processing steps are presented in the following:
- Document selection: filters which documents will be used in the text mining task;
- Tokenization: identifies the terms that will be considered in the pre-processing;
- Stop-word elimination: several terms are not relevant to mining tasks and can be eliminated in this step. Usually, these terms are words that commonly appear in any document (i.e., articles and prepositions);
- Stemming: in this step, each word is reduced to its minimized form, by extracting the root of the word. For example, the root form of “fishing” is “fish”;
- Luhn cut: this step can eliminate terms for which the frequency is below a given threshold;
- Weighting: is employed to minimize or maximize the term contribution on the mining tasks. For example, a well-known technique is TF-IDF (Term Frequency-Inverse Document Frequency).
The result of the pre-processing pipeline is a vector space model [8], also called as document × term matrix. In such a model, each row represents a document, each column a term, and each element is the frequency (TF) or the term influence in the respective document (e.g., TF-IDF). Thus, data mining algorithms, such as clustering and classifying, can be employed in the structured document collection. Additionally, most of the information visualization techniques also require structured data, and therefore, those pre-processing steps are also useful for visualizing document collections.
2.2. Multidimensional Projection
In the literature, multidimensional projections have been used to support the exploration of multidimensional datasets from different domains [14,18,19,20,21]. Those techniques are commonly employed to reduce the dataset dimensionality to a lower dimensionality dataset. For that, projection techniques transform a space into a space () [12], preserving the original structures and the neighborhood of the multidimensional space as much as possible. Therefore, projection techniques can be employed to organize datasets and aid in similarity exploration by computing meaningful graphical representations on a computer screen (2D space). Thus, similar instances are placed near each other in the 2D space, and dissimilar ones are placed far apart, keeping the instances’ relationship from the original multidimensional space.
2.3. Opinion Mining
Opinion mining is the task of inferring the sentiment state from a given text, transmitting the opinion it expresses. In this paper, we used three opinion mining techniques: SentiWordNet [22], SenticNet [23] and naive Bayes.
SentiWordNet is a lexical base developed from the WordNet dataset, which is a lexical database for the English language. WordNet is composed of nouns, verbs, adjectives and adverbs grouped into synonyms (known as synsets). Each synset was previously classified as positive, negative or neutral. Thus, SentiWordNet can classify an opinion according to each correspondent synset that appears in the text. In the same way, SenticNet technique uses a lexical database composed of 50,000 concepts of natural language. SenticNet classifies an opinion by comparing each term with the lexical database. Thus, the final classification is the average of all term rankings, which vary between −1 and 1 (varying from negative to positive). On the other hand, instead of using lexical databases, classifiers can be employed to learn the sentiment from texts. In this paper, we used the well-known naive Bayes classifier, which is a probabilistic classifier based on Bayes’ theorem. Naive Bayes is a supervised classifier and needs a training dataset to fit a classification model. Once it has been trained, new opinions may be classified as positive, negative or neutral.
3. Analysis of Document Pre-Processing Effects
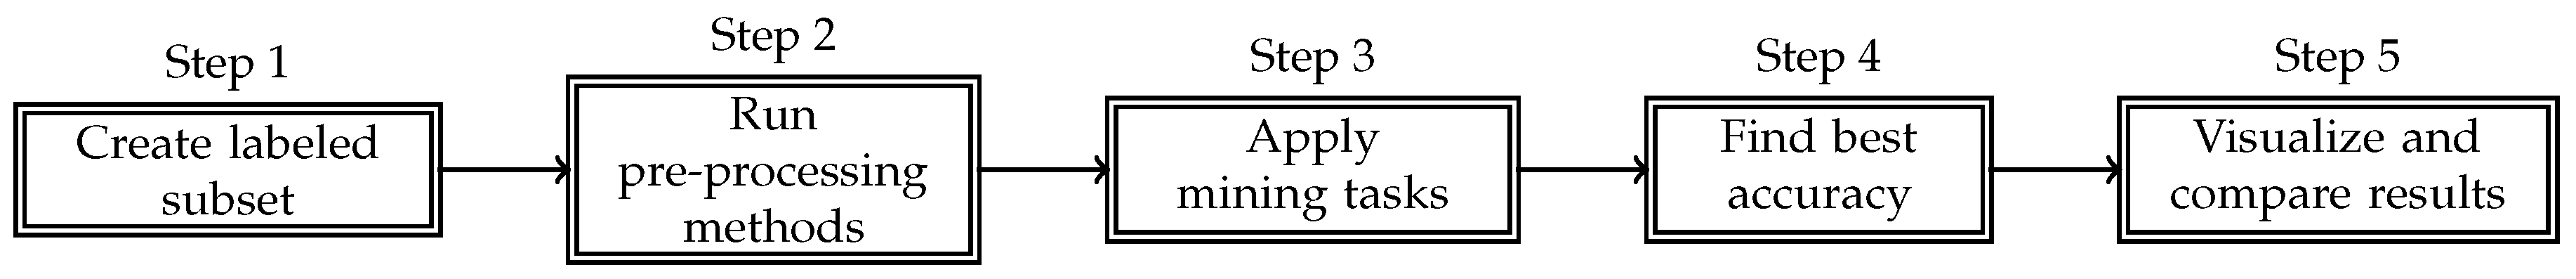
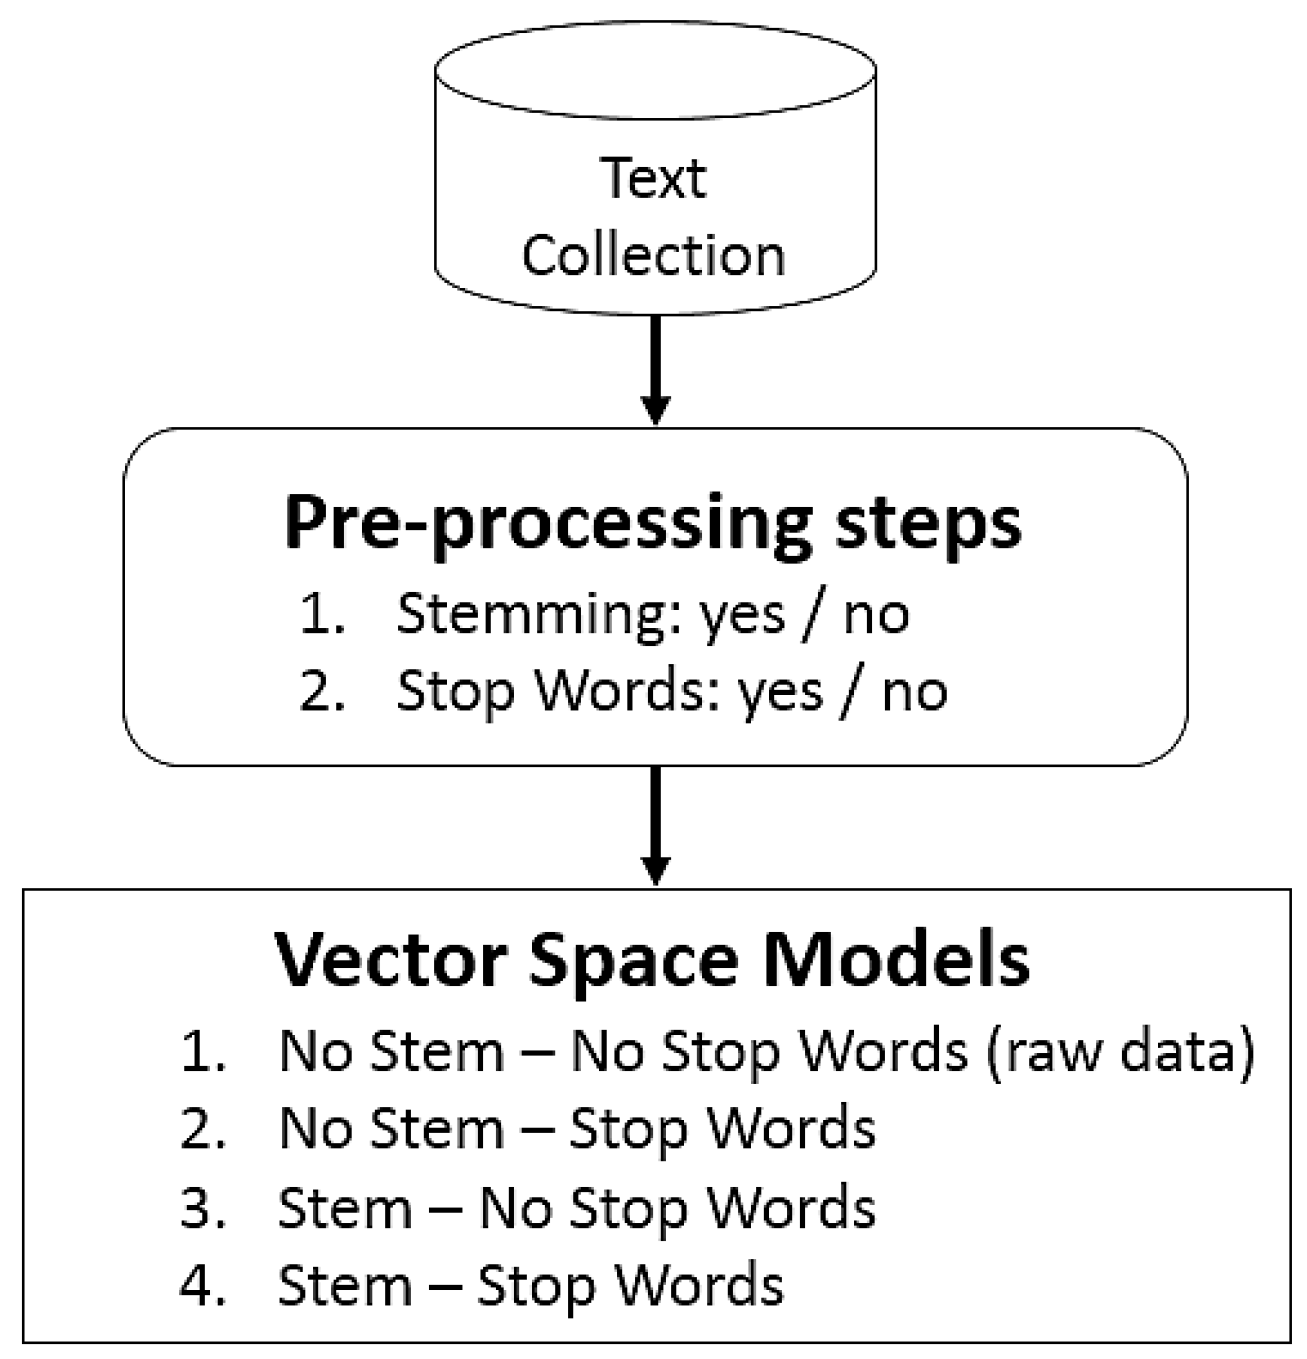
This paper highlights the importance of the document processing steps prior to text mining tasks. Therefore, a methodology can be employed to make a decision about which pre-processing method has to be used to improve the accuracy of a text mining task. The methodology is presented in Figure 1 and is described as follows.
- Labeled subset of data: the analyst has to create a labeled subset of data for decision making based on a small sample of the whole dataset;
- Run pre-processing methods: with the labeled subset of data, the analyst can run several pre-processing methods to compute distinct vector space models;
- Mining tasks: each vector space model is processed by a mining task in order to classify each document;
- Accuracy computation: after executing a mining task, the analyst has to analyze which method or combination of them produces the best accuracy value. For that, quality measures (e.g., correct classification rate) are computed allowing the comparison of the resulting vector space models;
- Comparison: based on the accuracy computation, the analyst makes a decision about the best pre-processing methods that can be employed for a dataset. In addition, visualization techniques may be used to properly understand the impact of pre-processing methods in document similarities and group formation.
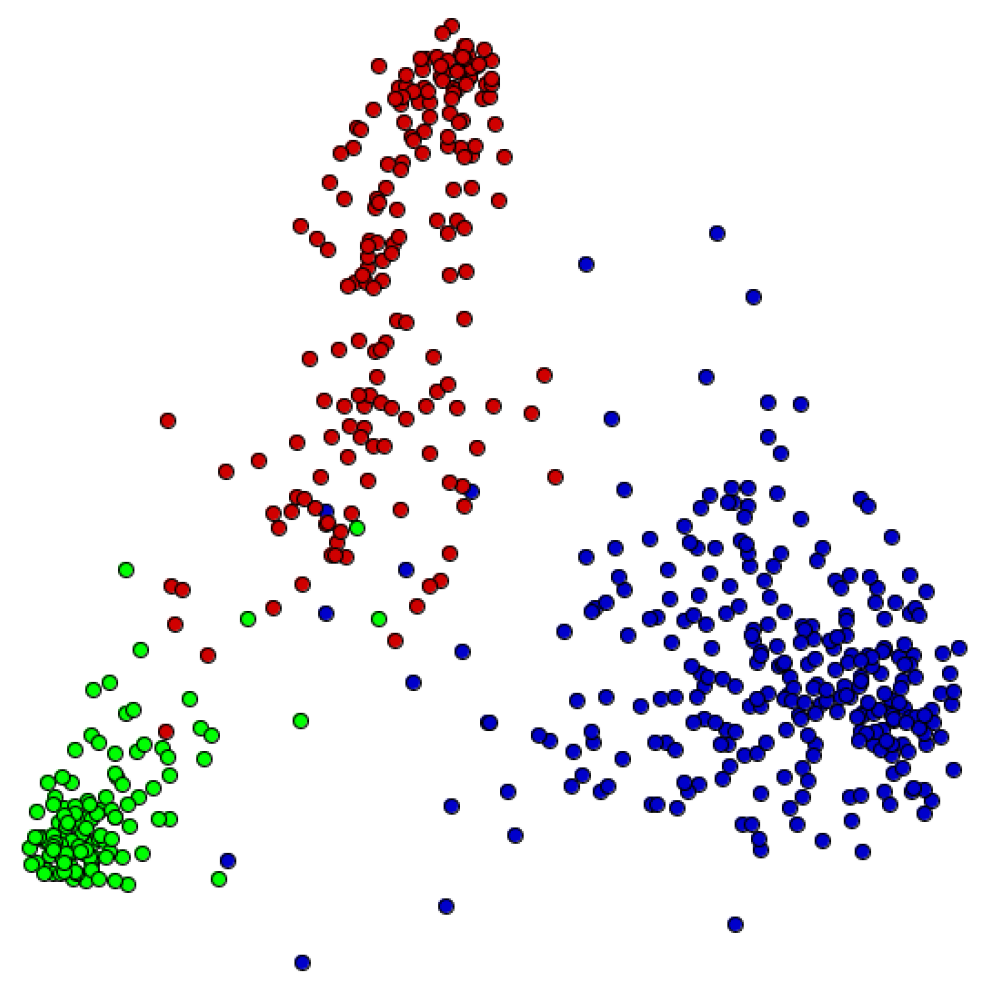
In this methodology, the correct classification rate is used to evaluate mining techniques, as well as the quality of a vector space model; the higher the classification rate (maximum 100%), the higher the precision. This accuracy measure is computed for all documents, representing an average rate. Therefore, in this paper, for a better understanding of the effect of pre-processing methods in text mining tasks, we also used visualization techniques to show text similarities. For that, once all vector space models are computed, a multidimensional visualization approach creates a graphical representation (projection) to represent the document similarities in a 2D space. An example of a graphical representation generated by a multidimensional projection technique is shown in Figure 2, in which each text is a point in 2D space, and the color represents the document class. In this visualization, closer points indicate documents with very similar content. In addition, clusters’ formation is highly dependent on the vector space models, which can change the cohesion and separation of distinct groups of documents.
The visualization approach can improve the comprehension of how the feature space changes according to each pre-processing method. The document similarities are very dependent on the pre-processing methods because the feature space also changes. Then, the visual approach can provide a detailed inspection of the resulting vector space models. Additionally, in order to evaluate which projection represents the better group of collections, two quality measures were employed, the silhouette coefficient [16] and the neighborhood hit [13], as detailed in the next section.
4. Experiments
This section starts by showing two experiments to analyze the pre-processing effects in text and opinion mining. For the text mining task, pre-preprocessing effects are shown by means of correct classification rates from classifiers, and a visualization approach is also employed to show the impact of pre-processing methods in document similarities and cluster formation. For the opinion mining task, only the correct classification rate is employed. Distinct combinations of pre-processing methods are used in both applications. Finally, a complete application is presented for the opinion mining task.
4.1. Text Mining
We used the following pre-processing methods for the text mining application:
- Stemming: in this step, similar words can be grouped by obtaining the root of each work. In this paper, we used Porter’s stemming [9];
- Frequency cut: in this step, some terms can be discarded based on their frequency. For that, a low-frequency cut is chosen (), and all terms below this threshold are discarded. If no frequency cut is set (), all terms are used to compute the Vector Space Model (VSM). In this paper, we used an automatic approach based on Otsu’s threshold selection method [24], which is an approach proposed to estimate a good low-frequency cut;
As shown Figure 3, all pre-processing methods were combined to generate eight distinct VSM from the combination of stemming, term weighting and frequency cutting steps.
We used document collections of scientific papers and news, commonly used in the literature [13,24]. They are listed as follows:
- CBR-ILP-IR: 574 papers from three areas of artificial intelligence: Case-Based Reasoning (CBR), Inductive Logic Programming (ILP), Information Retrieval (IR);
- NEWS-8: 495 news from Reuters, AP, BBC and CNN, classified into eight classes;
We also used the k-Nearest Neighbor (k-NN) and naive Bayes classifiers of Weka (Weka is a system composed of several data mining algorithms; Weka v3.0 is available at http://www.cs.waikato.ac.nz/ml/weka/), with default parameters and k-NN set as 1-NN in order to evaluate the pre-processing effects.
We present the traditional approach of measuring the vector space model quality based on the correct classification rate. For visualizing the pre-processing effects, we employed the Least Square Projection (LSP) [13] technique to compute the projections. LSP is a technique that preserves as many of the instances of neighborhood relations from the multidimensional space (i.e., vector space model) as possible (in this paper, the multidimensional space was projected into 2D space).
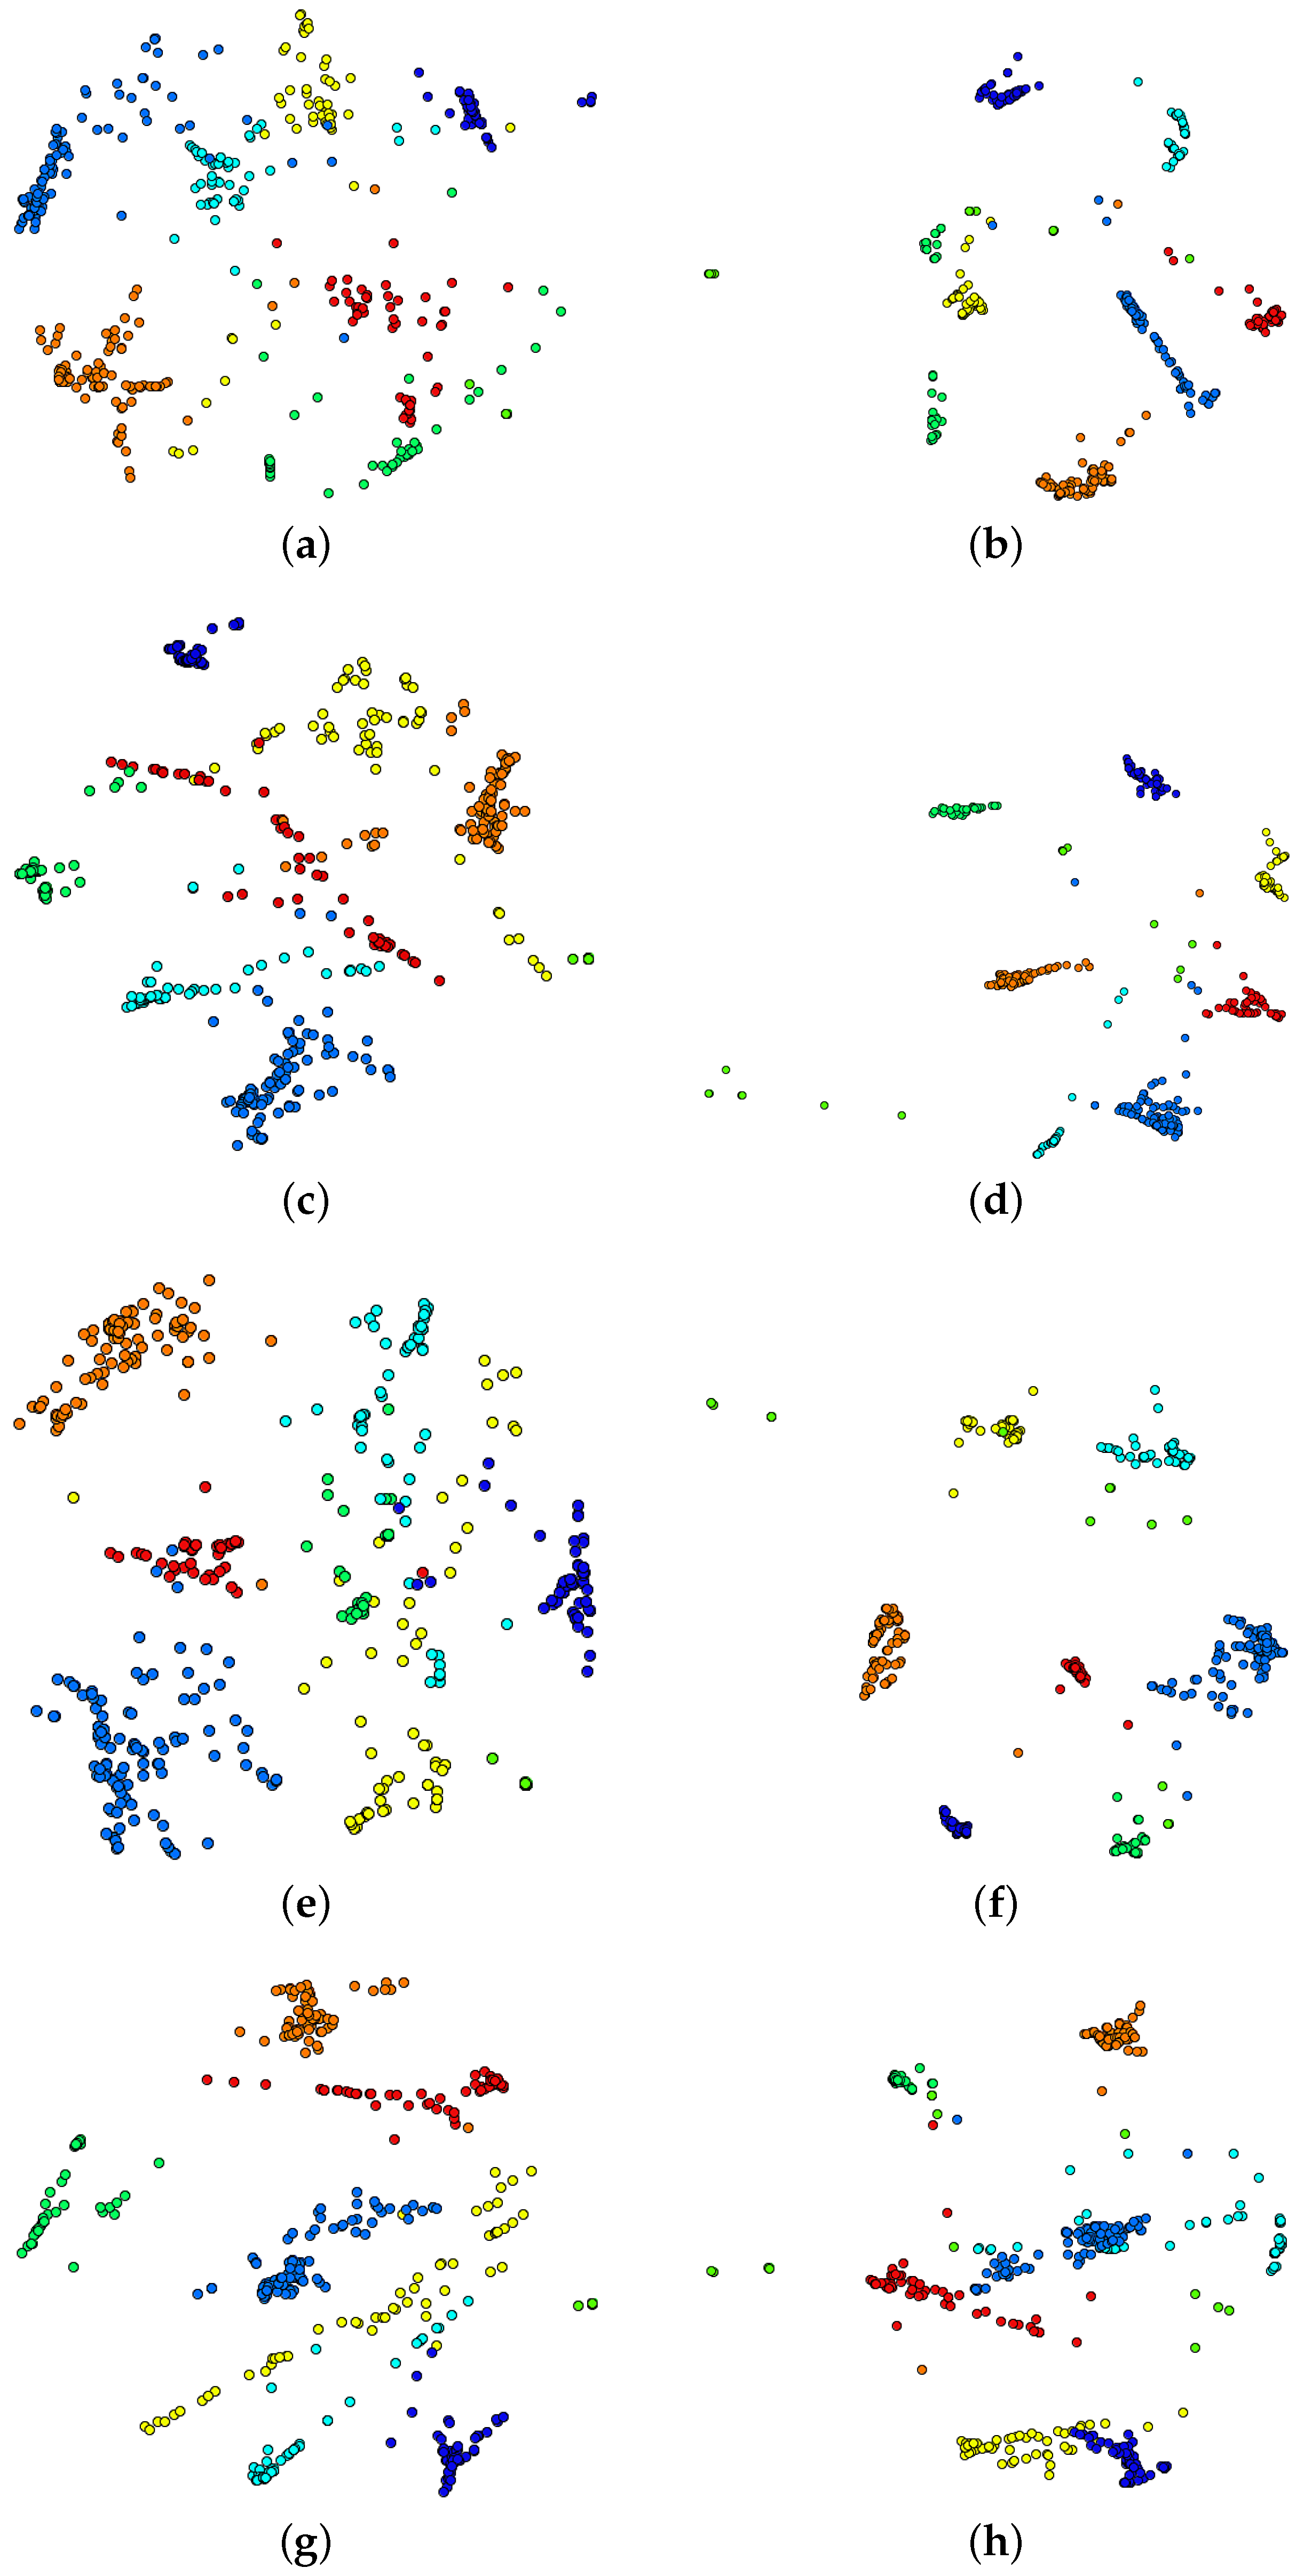
The first experiment evaluates eight VSMs generated from the CBR-ILP-IR dataset. The LSP technique was employed for each VSM, and distinct graphical representations were computed, as shown in Figure 4. Each point represents a document, and its color represents the respective document class; the closer the points, the more similar they are. Using Otsu’s threshold method [24] the term frequency cut was obtained, which was set to 475.
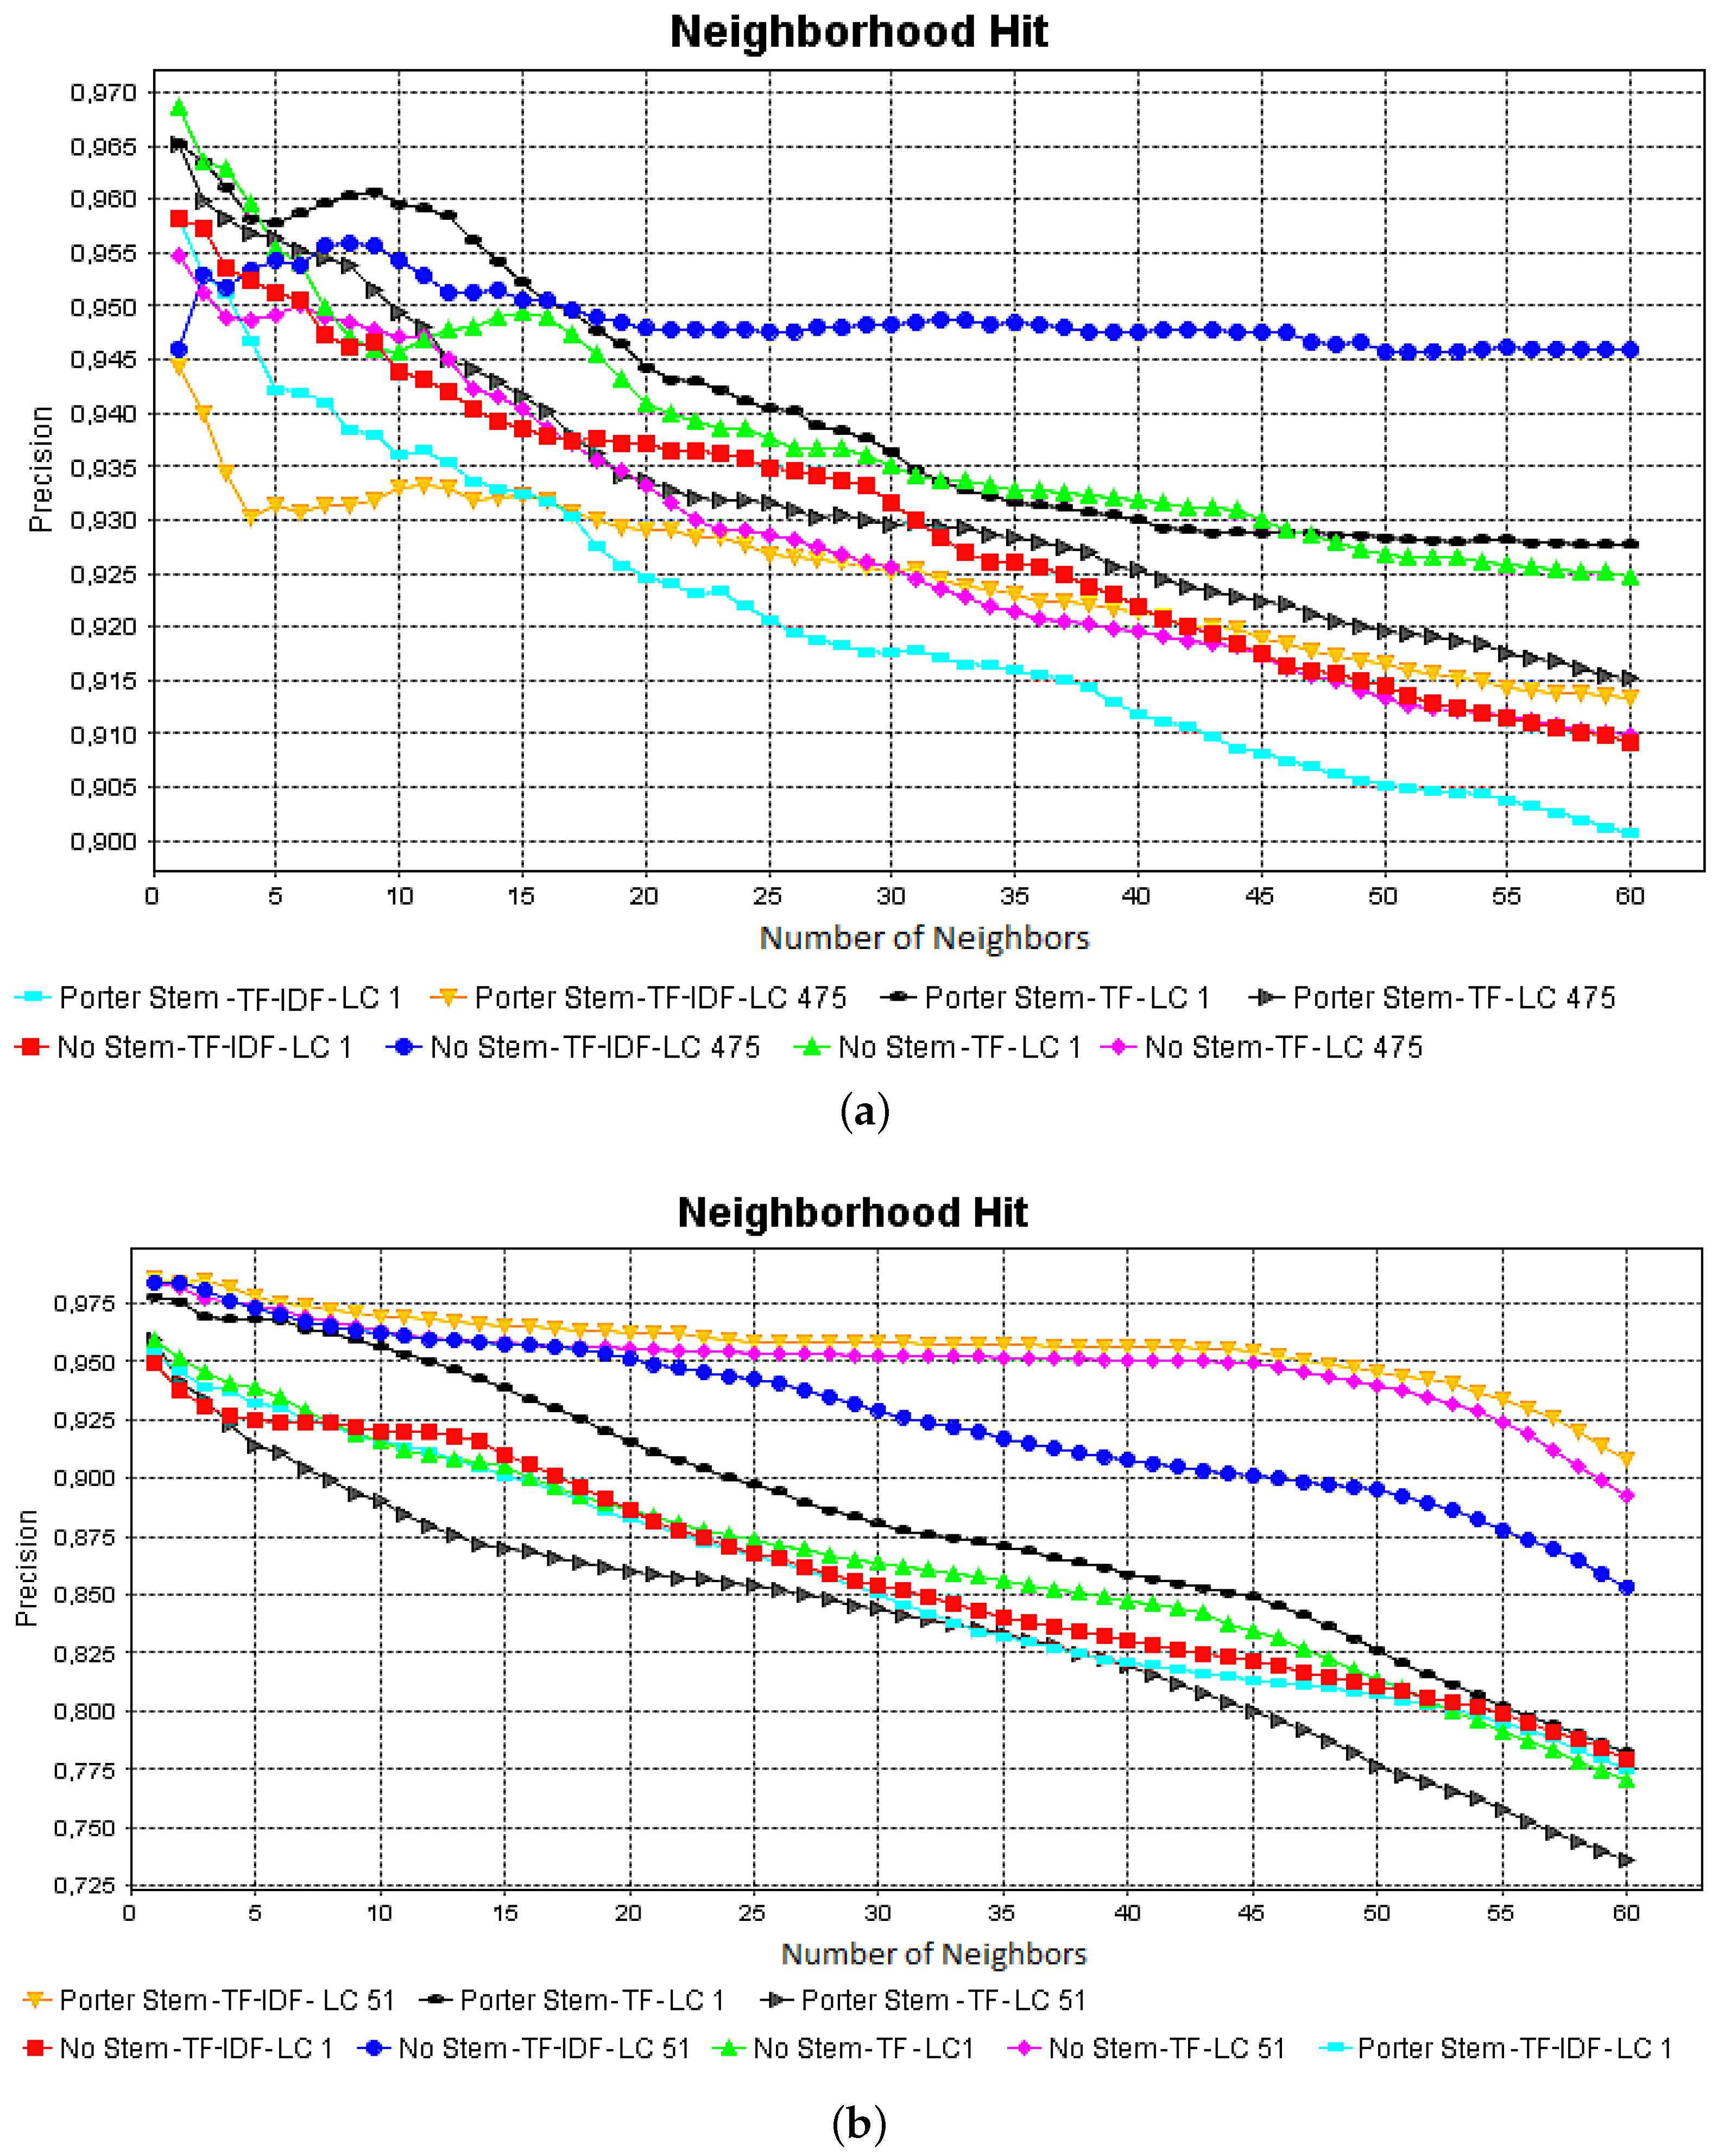
The stemming pre-processing did not produce great changes in the cluster, but this pre-processing produced the spread of red groups, as shown in Figure 4b,f. The frequency cut pre-processing improved the cohesion of the green groups, as shown in Figure 4e,f. When observing Figure 4h,f, one might note that using TF-IDF to attribute weights for each term did not improve the group formation, further to spreading the groups. As presented in Table 1, we used the silhouette coefficient to identify the VSM that best preserved the group cohesion and separation. The silhouette coefficient shows which is the best projection computed from the CBR-ILP-IR dataset, as shown in Figure 4b: the best projection corresponds to the VSM computed with stemming, TF-IDF and low cut 475. In addition, as shown in Figure 5a, the neighborhood hit measure was computed to present an evaluation of each projection presented in Figure 4. The neighborhood hit measures the percentage of instances of the same class that are in a certain neighborhood in 2D space. Thus, the projection presented in Figure 4b is the one that better preserves the document similarities when increasing the number of neighbors.
The second experiment was executed with the NEWS-8 dataset, from which eight VSMs were evaluated. We used the same pre-processing steps employed in the previous experiment and LSP technique to compute the projections for each VSM. Again, Otsu’s threshold method was employed to compute the term frequency cut. For the NEWS-8 dataset, the threshold value was 51. All computed projections are shown in Figure 6.
The best result is presented in Figure 6f, which is the projection computed from the VSM generated with stemming, TF-IDF and low cut 51 pre-processing. In this projection, the stemming could improve the group cohesion, even though it did not occur when comparing Figure 6d,h, in which the use of stemming processing scattered some groups. Using the frequency cut threshold to eliminate some terms improved the groups’ cohesion and separation. However, when observing the projections presented in Figure 6g,h, the groups’ separation was decreased. Using the TD-IDF to set weights for each term, a unique improvement was observed on the projections presented in Figure 6e,f. To confirm the visual inspection, we used the silhouette coefficient to evaluate each projection, as presented in Table 2. Based on the silhouette coefficient, the high-quality projection is the one shown in Figure 6f, which also indicates the best VSM. The projections shown in Figure 6b,d did not use stemming in the pre-processing pipeline and were evaluated with a similar silhouette coefficient. Additionally, as shown in Figure 5b, the visual inspection and the silhouette coefficient evaluation were confirmed by the neighborhood hit graphs computed for each projection presented in Figure 6.
Based on the experiments, the silhouette coefficient can be employed to indicate the best vector space models, when comparing the coefficient values with the classification rates of the k-NN and naive Bayes classifiers, as presented in Table 1 and Table 2. In addition, the neighborhood hit graphics presented in Figure 5 could also aid in this evaluation.
4.2. Opinion Mining
We also performed an experiment to analyze the pre-processing effects in opinion mining tasks. As shown in Figure 7, stemming and stop words were employed to pre-process the original text collection. For processing the opinion datasets, we used the techniques SentiWordNet [22], SenticNet [23] and naive Bayes. These techniques, described in Section 2.3, can classify each opinion as positive, negative or neutral. We used a Twitter dataset composed of 256 twitter opinions about the Brazilian bank Banco do Brasil. We used 40 opinions for training.
Table 3 summarizes the accuracy results for the mining techniques employed in these experiments, showing how each pre-processing method can impact the opinion mining tasks. The naive Bayes classifier reaches the best result using stemming and stop words elimination and the worst result with no pre-processing. SentiWordNet reaches the best result with stemming, and the worst one with no pre-processing. SenticNet reaches the best result with stop words elimination and the worst one with stemming or stemming and stop words elimination.
There is no consistency among the mining techniques used in this experiment, that is each one reaches a better precision with a distinct vector space model. In the next experiment, we describe a complete application of the methodology presented in Section 3.
4.3. Complete Application for Opinion Mining
This experiment shows a complete application of the methodology presented in Section 3, which aids the analyst in making a decision about the best pre-processing methods in mining tasks. According to the methodology, the best pre-processing method is chosen by comparing the accuracy of mining techniques employed in a labeled subset, that is, a training dataset. To validate the methodology, we executed the same pre-processing pipeline and mining techniques with a test dataset and compared the results with those results reached with the training dataset.
We used the same experimental setup presented in the previous section, but this experiment was performed in a movie dataset known as UMICHSI650 (Sentiment Classification from Michigan University) (available at https://www.kaggle.com/c/si650winter11/data), from which we separated 30% for training.
Table 4 presents the accuracy of each mining technique employed to distinct vector space models computed from the training dataset. Based on these results, for SentiWordNet, no pre-processing reaches the best result; for SenticNet, the best pre-processing method is the combination of stemming and stop words; and for naive Bayes, the analyst could choose only to use stop words or stemming and stop words.
To show if the accuracy of the test dataset is kept, we used the same pre-processing pipelines and mining techniques. As shown in Table 5, it is worth noting again that each technique presents a particular behavior with different vector space models (VSM). SentiWordNet reaches the best precision with stop words elimination, presenting a different result from the training dataset; SenticNet reaches the best precision with stemming and stop words, presenting a consistent behavior when compared with the training dataset; and naive Bayes also presents a consistent behavior, presenting the best results with stemming and stop words and only using stop words. The worst results also vary for each technique: SentiWordNet reaches the worst precision with stemming and stop words elimination, SenticNet with stop words and naive Bayes with no pre-processing.
According to the experiments, the combination of distinct pre-processing methods can affect the precision of each opinion mining technique, and the best combination can be different for each mining technique. Additionally, the dataset characteristics may influence the choice of the appropriate pre-processing; for instance, naive Bayes presented a consistent behavior for the movies and Twitter datasets, as well as for the training and test datasets. Even though SenticNet presented a consistent behavior for the training and test datasets, the pre-processing methods that reach the best accuracy in mining tasks of the Twitter dataset were not the same for the movie dataset. The same analysis can be performed for SentiWordNet, when comparing both opinion mining experiments.
We do not focus on creating guidelines and suitable combinations, but the proposed approach intends to lead the data analyst to obtain an adequate combination for his/her dataset, according to its characteristics.
5. Conclusions and Future Works
Several research fields are supported by text mining tasks. The success of text and opinion mining tasks is highly dependent on the pre-processing steps in which textual information is selected or eliminated, which relevant words are chosen, which terms are eliminated and what weights are assigned to terms. Thus, the raw textual data are transformed into a vector space model (VSM) capable of discriminating each document. Usually, the correct classification rate is employed to verify the quality of VSMs computed from a distinct combination of pre-processing steps or parameter configuration.
In this paper, we vary combinations of stemming, term weighting, frequency cut and stop words elimination for text and opinion mining tasks. The experiments showed the importance of a good pre-processing step to reach better precision in mining tasks. Furthermore, the combination of distinct pre-processing methods is crucial to find the best classification rates.
The classification rate can indicate the best combinations of pre-processing methods. However, the classification rate does not show document similarities or group cohesion and separation. To tackle this problem, we proposed a visualization-based approach to aid in the analysis and comprehension of the pre-processing effects in text mining. In such an approach, graphical representations were computed with multidimensional projection techniques to show the group formation in 2D space and the document similarities described in the vector space model. Thus, the analyst can note the effects of pre-processing on a document, the groups of documents, a class of documents and the whole collection. To support the visual inspection proposed in this approach, we used two quality measures to analyze the quality of the computed projections. They are the silhouette coefficient and neighborhood hit. To validate this visual approach, we compared the quality of each projection with the traditional approach based on classification rates, and for that, we used the k-nearest neighbor and naive Bayes classifiers.
In future works, we intend to apply other pre-processing steps for opinion and text mining; for example, outlier removal and feature selection. Additionally, we also intend to analyze different stemming algorithms, as well as distinct weighting methods.
Acknowledgments
The authors acknowledge the financial support of the Brazilian financial agency São Paulo Research Foundation (FAPESP), Grant # 2013/03452-0.
Author Contributions
D.E. conceived of the proposed approach, performed the text mining and visualization experiments, reviewed the opinion mining experiments and wrote the paper. D.G. and R.C. performed the opinion mining experiments. I.P. , R.G. and J.T. analyzed the visualization experiments, reviewed the concepts and experiments and wrote the paper.
Conflicts of Interest
The authors declare no conflict of interest.
References
- Hu, Y.; Milios, E.E.; Blustein, J. Enhancing Semi-supervised Document Clustering with Feature Supervision. In Proceedings of the 27th Annual ACM Symposium on Applied Computing, Trento, Italy, 26–30 March 2012; ACM: New York, NY, USA, 2012; pp. 929–936. [Google Scholar]
- Nogueira, B.M.; Moura, M.F.; Conrado, M.S.; Rossi, R.G.; Marcacini, R.M.; Rezende, S.O. Winning Some of the Document Preprocessing Challenges in a Text Mining Process. In Proceedings of the Anais do IV Workshop em Algoritmos e Aplicações de Mineração de Dados—WAAMD, XXIII Simpósio Brasileiro de Banco de Dados—SBBD, Campinas, Sao Paulo, Brazil, 26–30 October 2008; pp. 10–18. [Google Scholar]
- Chandrasekar, P.; Qian, K. The Impact of Data Preprocessing on the Performance of a Naive Bayes Classifier; IEEE Computer Society: Los Alamitos, CA, USA, 2016; Volume 2, pp. 618–619. [Google Scholar]
- Tugizimana, F.; Steenkamp, P.; Piater, L.; Dubery, I. Conversation on Data Mining Strategies in LC-MS Untargeted Metabolomics: Pre-Processing and Pre-Treatment Steps. Metabolites 2016, 6, 40. [Google Scholar] [CrossRef] [PubMed]
- Lee, J.L.; Yi, J.-S. Predicting Project’s Uncertainty Risk in the Bidding Process by Integrating Unstructured Text Data and Structured Numerical Data Using Text Mining. Appl. Sci. 2017, 7, 1141. [Google Scholar] [CrossRef]
- Roh, T.; Jeong, Y.; Yoon, B. Developing a Methodology of Structuring and Layering Technological Information in Patent Documents through Natural Language Processing. Sustainability 2017, 9, 2117. [Google Scholar] [CrossRef]
- Lee, B.; Park, J.; Kwon, L.; Moon, Y.; Shin, Y.; Kim, G.; Kim, H. About relationship between business text patterns and financial performance in corporate data. J. Open Innov. Technol. Mark. Complex. 2018, 4, 3. [Google Scholar] [CrossRef]
- Salton, G.; Wong, A.; Yang, C.S. A vector space model for automatic indexing. Commun. ACM 1975, 18, 613–620. [Google Scholar] [CrossRef]
- Porter, M.F. An Algorithm for Suffix Stripping; Morgan Kaufmann Publishers Inc.: San Francisco, CA, USA, 1997; pp. 313–316. [Google Scholar]
- Salton, G.; Yang, C.S. On the specification of term values in automatic indexing. J. Doc. 1973, 29, 351–372. [Google Scholar] [CrossRef]
- Luhn, H.P. The automatic creation of literature abstracts. IBM J. Res. Dev. 1958, 2, 159–165. [Google Scholar] [CrossRef]
- Tejada, E.; Minghim, R.; Nonato, L.G. On improved projection techniques to support visual exploration of multidimensional datasets. Inf. Vis. 2003, 2, 218–231. [Google Scholar] [CrossRef]
- Paulovich, F.V.; Nonato, L.G.; Minghim, R.; Levkowitz, H. Least Square Projection: A fast high precision multidimensional projection technique and its application to document mapping. IEEE Trans. Vis. Comput. Graph. 2008, 14, 564–575. [Google Scholar] [CrossRef] [PubMed]
- Eler, D.M.; Paulovich, F.V.; de Oliveira, M.C.F.; Minghim, R. Coordinated and Multiple Views for Visualizing Text Collections. In Proceedings of the 12th International Conference Information Visualisation, London, UK, 9–11 July 2008; IEEE Computer Society: Washington, DC, USA, 2008; pp. 246–251. [Google Scholar]
- Eler, D.M.; Pola, I.R.V.; Garcia, R.E.; Teixeira, J.B.M. Visualizing the Document Pre-processing Effects in Text Mining Process. In Advances in Intelligent Systems and Computing, Proceedings of the 14th International Conference on Information Technology: New Generations (ITNG 2017), Las Vegas, NV, USA, 10–12 April 2017; Springer International Publishing: Cham, Switzerland, 2017; pp. 485–491. [Google Scholar]
- Tan, P.N.; Steinbach, M.; Kumar, V. Introduction to Data Mining, 1st ed.; Addison-Wesley Longman Publishing Co., Inc.: Boston, MA, USA, 2005. [Google Scholar]
- Liu, B. Sentiment Analysis and Opinion Mining; Morgan and Claypool Publishers: San Rafael, CA, USA, 2012. [Google Scholar]
- Eler, D.M.; Almeida, A.; Teixeira, J.; Pola, I.R.V.; Pola, F.P.B.; Olivete, C. Feature Space Unidimensional Projections for Scatterplots. Colloq. Exactarum 2017, 9, 58–68. [Google Scholar] [CrossRef]
- Eler, D.; Nakazaki, M.; Paulovich, F.; Santos, D.; Andery, G.; Oliveira, M.; Batista, J.E.S.; Minghim, R. Visual analysis of image collections. Vis. Comput. 2009, 25, 923–937. [Google Scholar] [CrossRef]
- Paulovich, F.V.; Eler, D.M.; Poco, J.; Botha, C.; Minghim, R.; Nonato, L.G. Piecewise Laplacian-based Projection for Interactive Data Exploration and Organization. Comput. Graph. Forum 2011, 30, 1091–1100. [Google Scholar] [CrossRef]
- Bodo, L.; de Oliveira, H.C.; Breve, F.A.; Eler, D.M. Performance Indicators Analysis in Software Processes Using Semi-supervised Learning with Information Visualization. In Proceedings of the 13th International Conference on Information Technology, New Generations (ITNG 2016), Las Vegas, NV, USA, 10–13 April 2016; Springer International Publishing: Cham, Switzerland, 2016; pp. 555–568. [Google Scholar]
- Esuli, A.; Sebastiani, F. SENTIWORDNET: A Publicly Available Lexical Resource for Opinion Mining. In Proceedings of the 5th Conference on Language Resources and Evaluation, Genoa, Italy, 22–28 May 2006; pp. 417–422. [Google Scholar]
- Cambria, E.; Speer, R.; Havasi, C.; Hussain, A. SenticNet: A Publicly Available Semantic Resource for Opinion Mining. In AAAI Fall Symposium: Commonsense Knowledge; AAAI Technical Report; AAAI Press: Menlo Park, CA, USA, 2010; Volume FS-10-02. [Google Scholar]
- Eler, D.M.; Garcia, R.E. Using Otsu’s Threshold Selection Method for Eliminating Terms in Vector Space Model Computation. In Proceedings of the International Conference on Information Visualization, London, UK, 16–18 July 2013; pp. 220–226. [Google Scholar]
- Salton, G.; Buckley, C. Term-weighting approaches in automatic text retrieval. Inf. Process. Manag. 1988, 24, 513–523. [Google Scholar] [CrossRef]
Figure 1.
Methodology for analyzing the best pre-processing methods prior to text mining tasks.

Figure 2.
Example of a graphical representation created to show document similarities in 2D space. Each point represents a document, and each color represents the document class.
Figure 2.
Example of a graphical representation created to show document similarities in 2D space. Each point represents a document, and each color represents the document class.

Figure 3.
Pre-processing pipelines applied to text mining tasks. TF-IDF, Term Frequency-Inverse Document Frequency.
Figure 3.
Pre-processing pipelines applied to text mining tasks. TF-IDF, Term Frequency-Inverse Document Frequency.
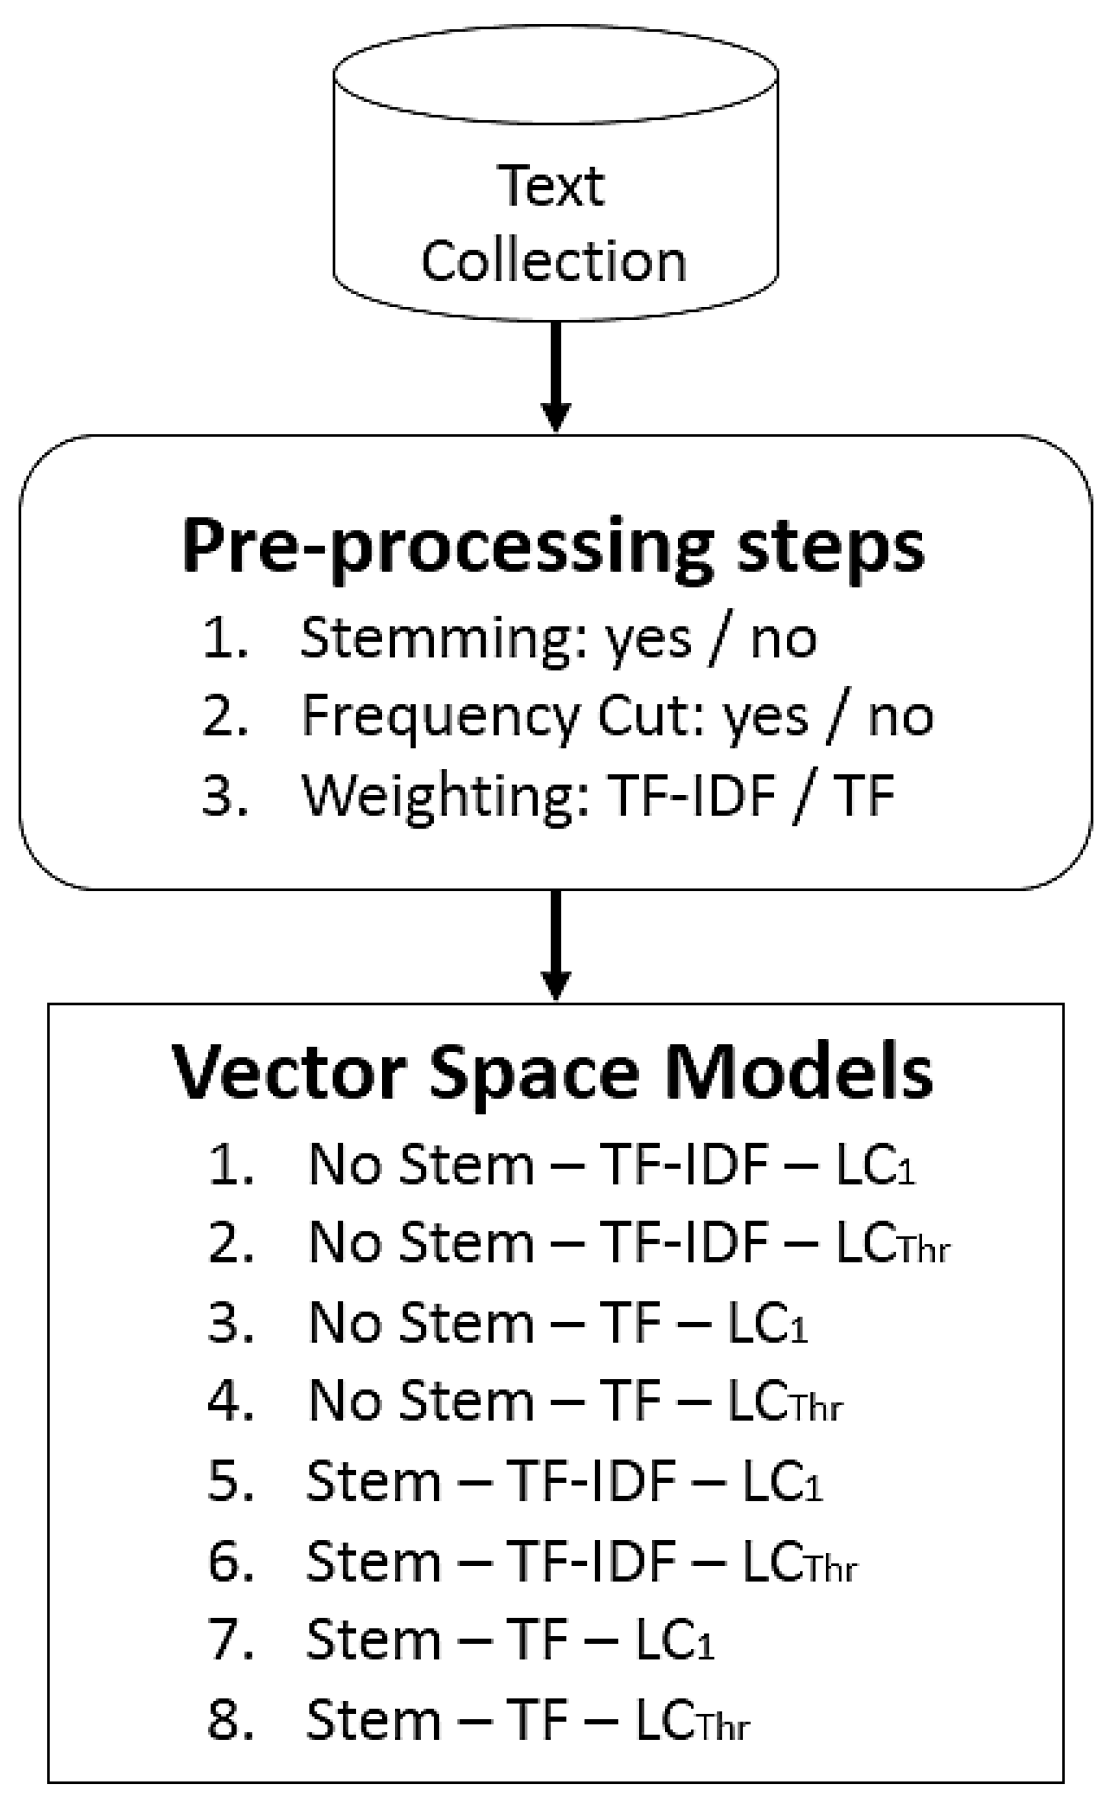
Figure 4.
Projection models computed from the Case-Based Reasoning (CBR), Inductive Logic Programming (ILP), Information Retrieval (IR) (CBR-ILP-IR) dataset. The Least Squares Projection (LSP) [13] technique was employed to generate these graphical representations. (a) no stem-TF-IDF-LC1; (b) no stem-TF-IDF-LC475; (c) no stem-TF-LC1; (d) no stem-TF-LC475; (e) Porter stem-TF-IDF-LC1; (f) Porter stem-TF-IDF-LC475; (g) Porter stem-TF-LC1; (h) Porter stem-TF-LC475.
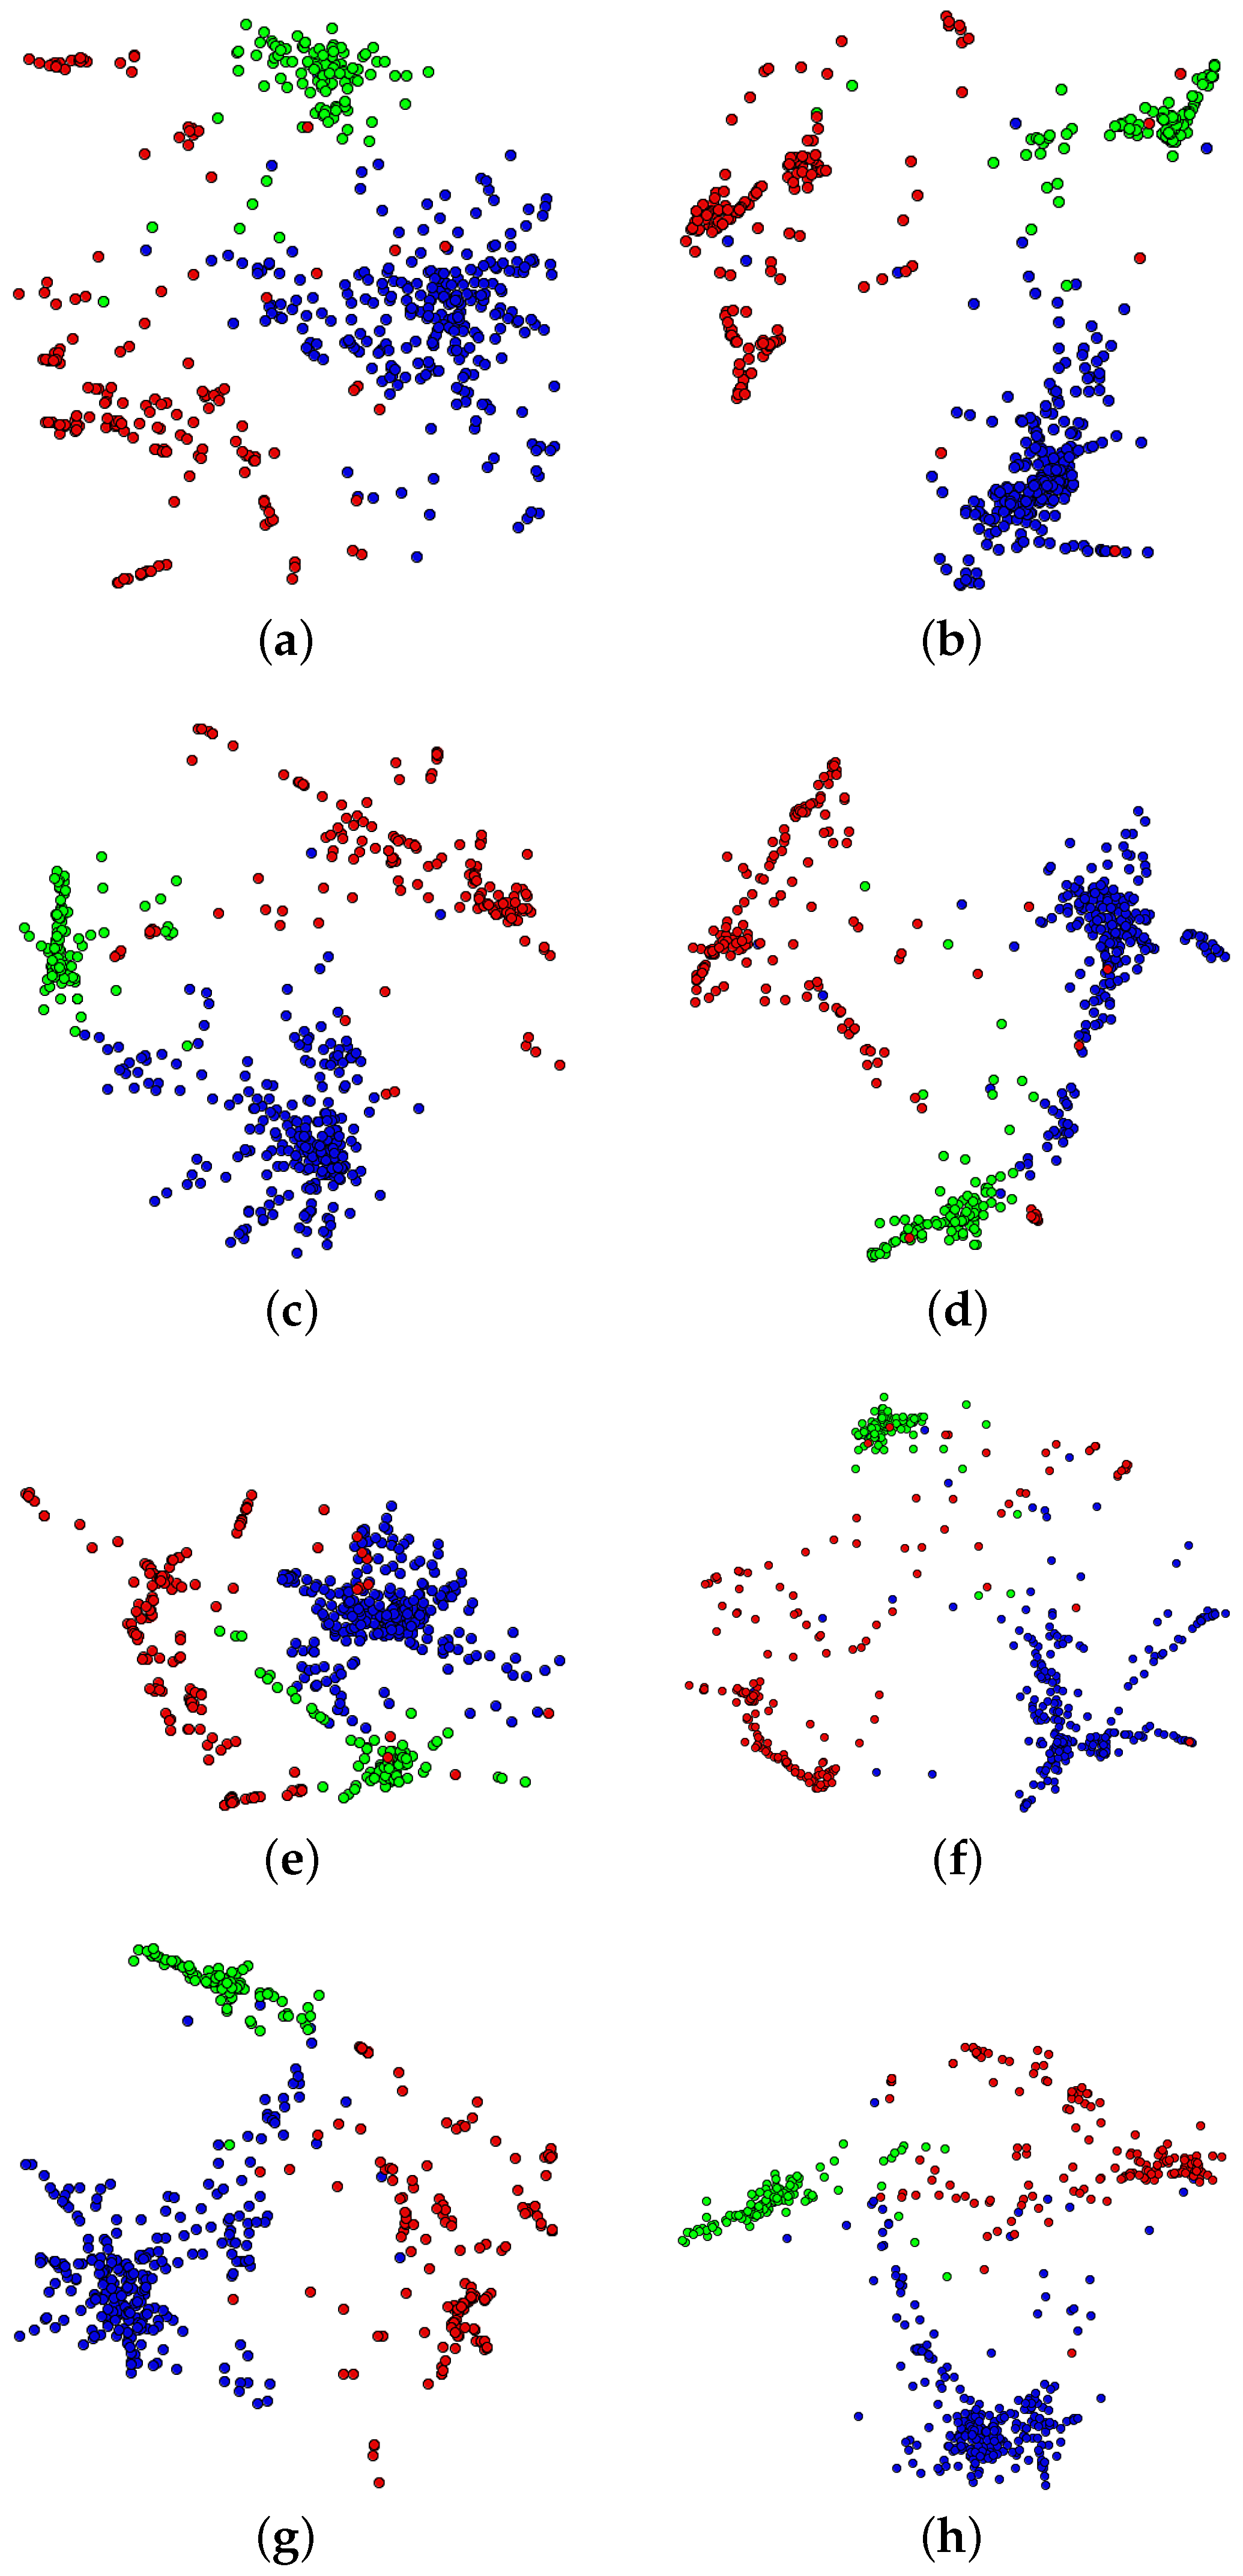
Figure 5.
Neighborhood hit graphics for analyzing the quality of projections computed from vector space models generated from the CBR-ILP-IR (a) and NEWS-8 (b) datasets.
Figure 5.
Neighborhood hit graphics for analyzing the quality of projections computed from vector space models generated from the CBR-ILP-IR (a) and NEWS-8 (b) datasets.

Figure 6.
Projections models computed from the NEWS-8 dataset. The Least Squares Projection (LSP) [13] technique was employed to generate these graphical representations. (a) No stem-TF-IDF-LC1; (b) no stem-TF-IDF-LC51; (c) no stem-TF-LC1; (d) no stem-TF-LC51; (e) Porter stem-TF-IDF-LC1; (f) Porter stem-TF-IDF-LC51; (g) Porter stem-TF-LC1; (h) Porter stem-TF-LC51.

Figure 7.
Pre-processing pipelines for opinion mining.


Table 1.
Silhouette coefficient evaluated for each projection presented in Figure 4 and the classification rate from the k-NN and naive Bayes classifiers: vector space models from the CBR-ILP-IR dataset.
Table 1.
Silhouette coefficient evaluated for each projection presented in Figure 4 and the classification rate from the k-NN and naive Bayes classifiers: vector space models from the CBR-ILP-IR dataset.
| Vector Space Model | Silhouette | k-NN | Naive Bayes |
|---|---|---|---|
| No Stem-TF-IDF-LC1 | 0.48 | 48% | 97% |
| No Stem-TF-IDF-LC475 | 0.67 | 93% | 98% |
| No Stem-TF-LC1 | 0.57 | 48% | 97% |
| No Stem-TF-LC475 | 0.58 | 93% | 97% |
| Porter Stem-TF-IDF-LC1 | 0.43 | 57% | 97% |
| Porter Stem-TF-IDF-LC475 | 0.56 | 91% | 95% |
| Porter Stem-TF-LC1 | 0.58 | 57% | 97% |
| Porter Stem-TF-LC475 | 0.58 | 91% | 95% |
Table 2.
Silhouette coefficient computed for each projection presented in Figure 6 and the classification rate from the k-NN and naive Bayes classifiers: vector space models from the NEWS-8 dataset.
Table 2.
Silhouette coefficient computed for each projection presented in Figure 6 and the classification rate from the k-NN and naive Bayes classifiers: vector space models from the NEWS-8 dataset.
| Vector Space Model | Silhouette | k-NN | Naive Bayes |
|---|---|---|---|
| No Stem-TF-IDF-LC1 | 0.48 | 88% | 97% |
| No Stem-TF-IDF-LC51 | 0.65 | 97% | 98% |
| No Stem-TF-LC1 | 0.53 | 88% | 97% |
| No Stem-TF-LC51 | 0.75 | 96% | 98% |
| Porter Stem-TF-IDF-LC1 | 0.48 | 90% | 97% |
| Porter Stem-TF-IDF-LC51 | 0.77 | 97% | 98% |
| Porter Stem-TF-LC1 | 0.56 | 90% | 97% |
| Porter Stem-TF-LC51 | 0.53 | 97% | 98% |
Table 3.
Classification rate from SentiWordNet, SenticNet and Naive Bayes techniques for opinion mining: vector space models from the Twitter dataset.
Table 3.
Classification rate from SentiWordNet, SenticNet and Naive Bayes techniques for opinion mining: vector space models from the Twitter dataset.
| Vector Space Model | SentiWordNet | SenticNet | Naive Bayes |
|---|---|---|---|
| No Stem-No Stop Words | 72.04% | 62.90% | 55.91% |
| No Stem-Stop Words | 73.12% | 63.44% | 62.90% |
| Stem-No Stop Words | 77.42% | 62.37% | 62.37% |
| Stem-Stop Words | 72.58% | 62.37% | 65.05% |
Table 4.
Classification rate from the SentiWordNet, SenticNet and naive Bayes techniques for opinion mining: vector space models from the movie training dataset.
Table 4.
Classification rate from the SentiWordNet, SenticNet and naive Bayes techniques for opinion mining: vector space models from the movie training dataset.
| Vector Space Model | SentiWordNet | SenticNet | Naive Bayes |
|---|---|---|---|
| No Stem-No Stop Words | 69.09% | 58.43% | 95.54% |
| No Stem-Stop Words | 67.54% | 56.98% | 97.00% |
| Stem-No Stop Words | 66.76% | 63.18% | 95.64% |
| Stem-Stop Words | 66.86% | 67.15% | 97.00% |
Table 5.
Classification rate representing the precision from the SentiWordNet, SenticNet and naive Bayes techniques for opinion mining: vector space models from the movies test dataset.
Table 5.
Classification rate representing the precision from the SentiWordNet, SenticNet and naive Bayes techniques for opinion mining: vector space models from the movies test dataset.
| Vector Space Model | SentiWordNet | SenticNet | Naive Bayes |
|---|---|---|---|
| No Stem-No Stop Words | 75.74% | 57.66% | 57.04% |
| No Stem-Stop Words | 77.81% | 56.55% | 60.80% |
| Stem-No Stop Words | 67.87% | 66.72% | 58.26% |
| Stem-Stop Words | 64.94% | 70.30% | 63.33% |
© 2018 by the authors. Licensee MDPI, Basel, Switzerland. This article is an open access article distributed under the terms and conditions of the Creative Commons Attribution (CC BY) license (http://creativecommons.org/licenses/by/4.0/).
Share and Cite
MDPI and ACS Style
Eler, D.M.; Grosa, D.; Pola, I.; Garcia, R.; Correia, R.; Teixeira, J. Analysis of Document Pre-Processing Effects in Text and Opinion Mining. Information 2018, 9, 100. https://doi.org/10.3390/info9040100
AMA Style
Eler DM, Grosa D, Pola I, Garcia R, Correia R, Teixeira J. Analysis of Document Pre-Processing Effects in Text and Opinion Mining. Information. 2018; 9(4):100. https://doi.org/10.3390/info9040100
Chicago/Turabian StyleEler, Danilo Medeiros, Denilson Grosa, Ives Pola, Rogério Garcia, Ronaldo Correia, and Jaqueline Teixeira. 2018. "Analysis of Document Pre-Processing Effects in Text and Opinion Mining" Information 9, no. 4: 100. https://doi.org/10.3390/info9040100
Note that from the first issue of 2016, this journal uses article numbers instead of page numbers. See further details here.