CSI Frequency Domain Fingerprint-Based Passive Indoor Human Detection


1
College of Computer, Nanjing University of Posts and Telecommunications, Nanjing 210003, China
2
Jiangsu High Technology Research Key Laboratory for Wireless Sensor Networks, Nanjing University of Posts and Telecommunications, Nanjing 210003, China
*
Author to whom correspondence should be addressed.
Information 2018, 9(4), 95; https://doi.org/10.3390/info9040095
Submission received: 4 April 2018
/
Revised: 12 April 2018
/
Accepted: 15 April 2018
/
Published: 17 April 2018
(This article belongs to the Section Information Applications)
Abstract
:Passive indoor personnel detection technology is now a hot topic. Existing methods have been greatly influenced by environmental changes, and there are problems with the accuracy and robustness of detection. Passive personnel detection based on Wi-Fi not only solves the above problems, but also has the advantages of being low cost and easy to implement, and can be better applied to elderly care and safety monitoring. In this paper, we propose a passive indoor personnel detection method based on Wi-Fi, which we call FDF-PIHD (Frequency Domain Fingerprint-based Passive Indoor Human Detection). Through this method, fine-grained physical layer Channel State Information (CSI) can be extracted to generate feature fingerprints so as to help determine the state in the scene by matching online fingerprints with offline fingerprints. In order to improve accuracy, we combine the detection results of three receiving antennas to obtain the final test result. The experimental results show that the detection rates of our proposed scheme all reach above 90%, no matter whether the scene is human-free, stationary or a moving human presence. In addition, it can not only detect whether there is a target indoors, but also determine the current state of the target.
1. Introduction
With the rapid development of network technology, wireless signals are basically everywhere. Since Wi-Fi is easy to use and low cost, indoor personnel detection based on Wi-Fi has become very popular. Passive personnel detection does not require the target to carry a specific device, which leads to a wide range of prospects in geriatric surveillance [1,2], fire search and rescue, security detection [3], smart homes, and so on. At the same time, it can also be applied to technologies like indoor positioning and tracking [4,5].
In indoor environments, wireless signals reach the receiving end through multiple paths including reflection, diffraction, and scattering. The received signal is the fusion of wireless signals transmitted through different paths, each of which has different time delay, signal attenuation and phase change. Passive indoor personnel detection can be achieved through the analysis of wireless signal changes under different situations. In general, passive indoor personnel detection is based on two main metrics in Wi-Fi signals: RSSI [6] (Received Signal Strength Indicator) and CSI [7] (Channel State Information). CSI is more fine-grained and stable than RSSI, but it requires specialized equipment to gain accurate CSI signals, which becomes a hindrance in initial research. In 1999, OFDM technology [8] (Orthogonal Frequency Division Multiplexing) was adopted as the physical layer standard in IEEE 802.11a. Due to its high transmission quality and anti-transmission interference, OFDM has been widely used in the communication process. Researchers can get a sample version of CFR on different sub-carriers (CSI) by modifying firmware, so recent research has turned to using finer-grained CSI information. Current intrusion detection technologies still have some problems that need to be improved. Some methods cannot detect immobile targets and some of the algorithms are too complicated to be applied. Therefore, passive indoor personnel detection technology needs further study.
Since the fingerprint model [9] is currently the mainstream technology due to its advantages such as small consumption, simple parameter acquisition and high precision, this paper proposes the passive indoor personnel detection based on CSI fingerprints. Specifically, the scheme is divided into two phases, offline and online. In the offline phase, we extract CSI and generate characteristic fingerprints based on the impact of different indoor wireless signals. Then, we match the online fingerprints with the offline fingerprints to determine the state in the scene, and employ a voting scheme that combines the detection results of three receiving antennas to output the final decision.
The main contributions of this paper are summarized as follows:
- Considering that existing passive personnel detection methods rely on a target’s mobility and suffer from environmental changes, low robustness and detection accuracy, we use the highly sensitive CSI information to design a method based on the frequency domain fingerprint, combining the results of multi antenna voting to improve the detection accuracy.
- Through experiments, we find that the detection rate is above 90%, no matter whether the scene is human-free, stationary or a moving human presence, which verifies the effectiveness of this scheme.
The rest of this paper is organized as follows. Section 2 introduces the related work. Section 3 presents some preliminaries. The overall design of passive intrusion detection is presented in Section 4. We also analyze the CSI frequency domain fingerprint under different states. The experimental verification and analysis are presented in Section 5. Finally, conclusions and future work are derived in Section 6.
2. Related Work
The traditional intrusion detection system relies on special devices such as video surveillance [6]. Due to the low accuracy of detection with a single visible light camera, Wang et al. [10] fused two kinds of video data based on visible light and infrared imaging equipment, and proposed a fusion of two-channel video personnel detection systems based on neural network technology. In addition to video surveillance, acoustic [7] or infrared technology [11] can also be used to identify intrusion to some extent. Choi et al. [12] estimated the amount of change in the acoustic signature in the house through the acoustic wave propagation function and then judged whether it was an intruder. Because the body temperature is similar to the constant temperature, and bodies will always emit heat, Cheng et al. [13] used a pyroelectric infrared sensor to detect the body’s infrared radiation. It can detect the moving human within the effective range covered by the sensor and judge the body appearance and gait characteristics of the human according to the collected imaging so as to make classification. This method is low cost and has high reliability. Although these intrusion detection methods can achieve a certain degree of detection accuracy, they all have limitations. Video surveillance relies on high-definition cameras and data processing equipment. Although the cameras are low cost, they are exposed to the environment and easily get damaged, which will negatively affect the effect of real-time monitoring. The technologies based on acoustic wave and infrared ray require special equipment, which is not cost-effective. Meanwhile, the infrared technology can not cover the target area completely and the detection accuracy is low. In addition, some methods can only detect the target that carries device in the monitoring.
With the continuous development of science and research, the technical means and methods of intrusion detection have been greatly improved, and a relatively complete technical system is gradually formed. The concept of passive detection in a wireless environment [14] was first proposed by Youssef et al. in 2007. Then, the DFL (Device-Free Localization) intrusion detection system [15] was implemented, i.e., the target can be detected without any wireless transceiver equipped. This method can be widely applied. Kaltiokallio et al. [16] proposed a distributed approach with the received signal strength collected by wireless network nodes to achieve intrusion detection. Mrazovac et al. [17] used the irregular phenomenon of wireless signal transmission and achieved intrusion detection by means of analyzing the main components of signal strength. Because when the target appears on the signal link, the signal strength received from sensor nodes will have some changes. Zhang et al. [18] conducted extensive research on passive intrusion detection techniques and proposed a method by using midpoint and cross-point algorithms. The main principle is that, if the target appears at different locations in a wireless link, the RSSI of each link will produce various degrees of change, and the intrusion detection can be achieved when multiple links are combined. Fernandes et al. [19] achieved intrusion detection through analyzing wavelet coefficient together with the change of RSSI data caused by the interference of intruders, and they combined with wavelet coefficient analysis to achieve intrusion detection. Alfandi et al. [20] used the ZigBee network to detect a person by analyzing the fluctuations of the signal strength in the network. Han et al. [21] used the received signal strength measured between the sender and the Anchor module to determine that an object has entered a predefined area on the condition that the RSSI must exceed a specified threshold. Younus et al. [22] made the detection based on the fact that the appearance of the intruder will change the received signal strength between the transmitter and receiver, and they established a controlled environment to approximate the intruder’s weight and its mode of motion. Although these algorithms are successful, RSSI signals are easily affected by environmental changes, multipath fading and frequency-selective fading, leading to low robustness and reliability of the system if the RSSI is used as an input signal.
CSI represents the more fine-grained physical layer information compared with RSSI. CSI describes the changes of amplitude and phase in subcarriers. The number of subcarriers in this paper is 30. Based on these characteristics of CSI, a large number of related applications have been proposed. Brauers et al. [23] proposed a process of using channel state information to detect the presence of mobile objects reliably. When people pass through the room, they used CSI instead of RSSI and took into account the frequency-selective fading characteristics of indoor wireless channels while eliminating consumption impact of power level fluctuations in wireless hardware. Lv et al. [24] proposed a detection method that will not be affected by the moving speed of the target. They captured the variance of the amplitude differences of the CSI subcarriers and the HMM (Hidden Markov model) was used to solve the problem of entity detection. Qian et al. [25] extracted the amplitude and phase information of CSI to form the sensitive index of target detection to detect the moving target. FIMD (Fine-grained Device-free Motion Detection) [26] and the intrusion detection part of Pilot system [27] were proposed by Xiao et al., both of which used CSI information to extract feature fingerprints in the time domain. However, the wireless signals in the time domain are affected by the environment, so the methods had limitations and the accuracy was low. Although these passive intrusion detection technologies require no special equipment and are low cost and easy to implement, there are still some problems that need to be improved. For example, some methods can only be achieved with the moving target in the detection area. Some algorithms are too complex to be practical.
In summary, passive personnel detection technologies need to be further investigated. In this paper, we propose a passive indoor personnel detection method based on Wi-Fi, which we call FDF-PIHD (Frequency Domain Fingerprint-based Passive Indoor Human Detection). Through this method, fine-grained physical layer channel state information can be extracted to generate feature fingerprints so as to help determine the state in the scene by matching online fingerprints with offline fingerprints. In order to improve accuracy, we combine the detection results of three receiving antennas to obtain the final test result.
3. Preliminary
Two main metrics of Wi-Fi signals (RSSI and CSI) are introduced in this section, and the feasibility of FDF-PIHD is also analyzed.
3.1. Received Signal Strength Indicator and Channel State Information
RSSI is easy to obtain in wireless communication technology and cellular network technology, so it is used in traditional wireless sensors. However, RSSI only represents the energy feature of the media access control (MAC) layer, making it very unstable and easily affected by multipaths, which can only be applied to the simple environment and a scene with low precision. Specifically, in the whole process of transmission indoors, the wireless signal needs reflection, diffraction and scattering, and finally arrives at the receiver through multiple paths. Wireless signals from different paths have different delays, attenuations, and phase changes. A receiver receives a signal composed of these complex wireless signals in a time point. RSSI is a very unstable superimposed value from multiple paths. Fluctuations occur at different time points, even in a static link with no human interference. This is due to the fact that, although the fluctuations from one path are very small, the superimposition of all the links may cause the final value to change drastically. CSI is a physical layer characteristic. In the field of wireless communication, CSI refers to a channel attribute of a communication link, and it describes the attenuation factors of the signal transmission between the transmitter and the receiver, including the information of scattering, environmental attenuation, distance attenuation, and so on. Figure 1 shows three of the multiple CSI indoor transmission paths. The corresponding signal waveform is drawn in Figure 2. CSI is more granular and stable than RSSI.
In a stable channel, channel information can be modeled in the frequency domain as Equation (1):
where and are vectors of the received and transmitted signals, respectively, is a channel information matrix, and is a Gaussian noise vector. Through Equation (2), we can get the CSI calculation of all subcarriers:
where is the estimated value. According to the different drivers of the receiving end, the CSI will be divided into different subcarrier groups, so the matrix of CSI can be expressed as Equation (3):
where N is the number of subcarriers divided according to the driver, and usually , is the CSI on the i-th subcarrier, which is expressed as Equation (4):
where and are the amplitude and phase of the i-th subcarrier.
3.2. Feasibility of Distinguishing Indoor Conditions through Frequency Domain Fingerprinting
In human-free indoor environments, wireless signals arrive at the receiver through multiple paths with different time-delays, attenuations and phase changes in the propagation process. When the target appears, it will influence 30 sub-carriers at the same time. The stationary target and the moving target have varying degrees of influence on the wireless signals transmitting in the space, so that the state of the target indoor can be judged. We show this effect through the correlation between CSI subcarriers, and then the characteristic fingerprint generated by the data received by each receiving antenna is:
where is the i-th subcarrier vector in the CSI matrix, and is the correlation coefficient between the i-th subcarrier and the -th subcarrier in the w-th window.
According to Equations (5) and (6), characteristic fingerprints are calculated with the CSI received by the three antennas under three states and the nuclear density image is drawn. As can be seen from Figure 3, the fingerprints of three states under each antenna are clearly distinguishable. From the correlation point of view, there is the least correlation in human-free state, followed by the stationary human presence, and the correlation becomes the highest in the state with moving human presence. This verifies three assumptions that it has no impact on the wireless signal when no one is in the room, the presence of stationary target in the room causes less influence on the wireless signal, and the moving target has the most obvious impact on the wireless signal. At the same time, there are also differences in CSI fingerprint density in three states. Therefore, the construction of frequency domain fingerprinting can be used to distinguish different states within the scene.
4. System and Methodology
This section mainly describes the detailed design of the indoor passive intrusion detection scheme, including the offline training phase and the online matching phase.
The FDF-PIHD is a device-free method. It only needs an ordinary commercial router capable of sending wireless signals and a computer equipped with an Intel 5300 network card. FDF-PIHD is low-cost and easy to implement without the need for additional wireless devices and the target to carry the related sensor devices.
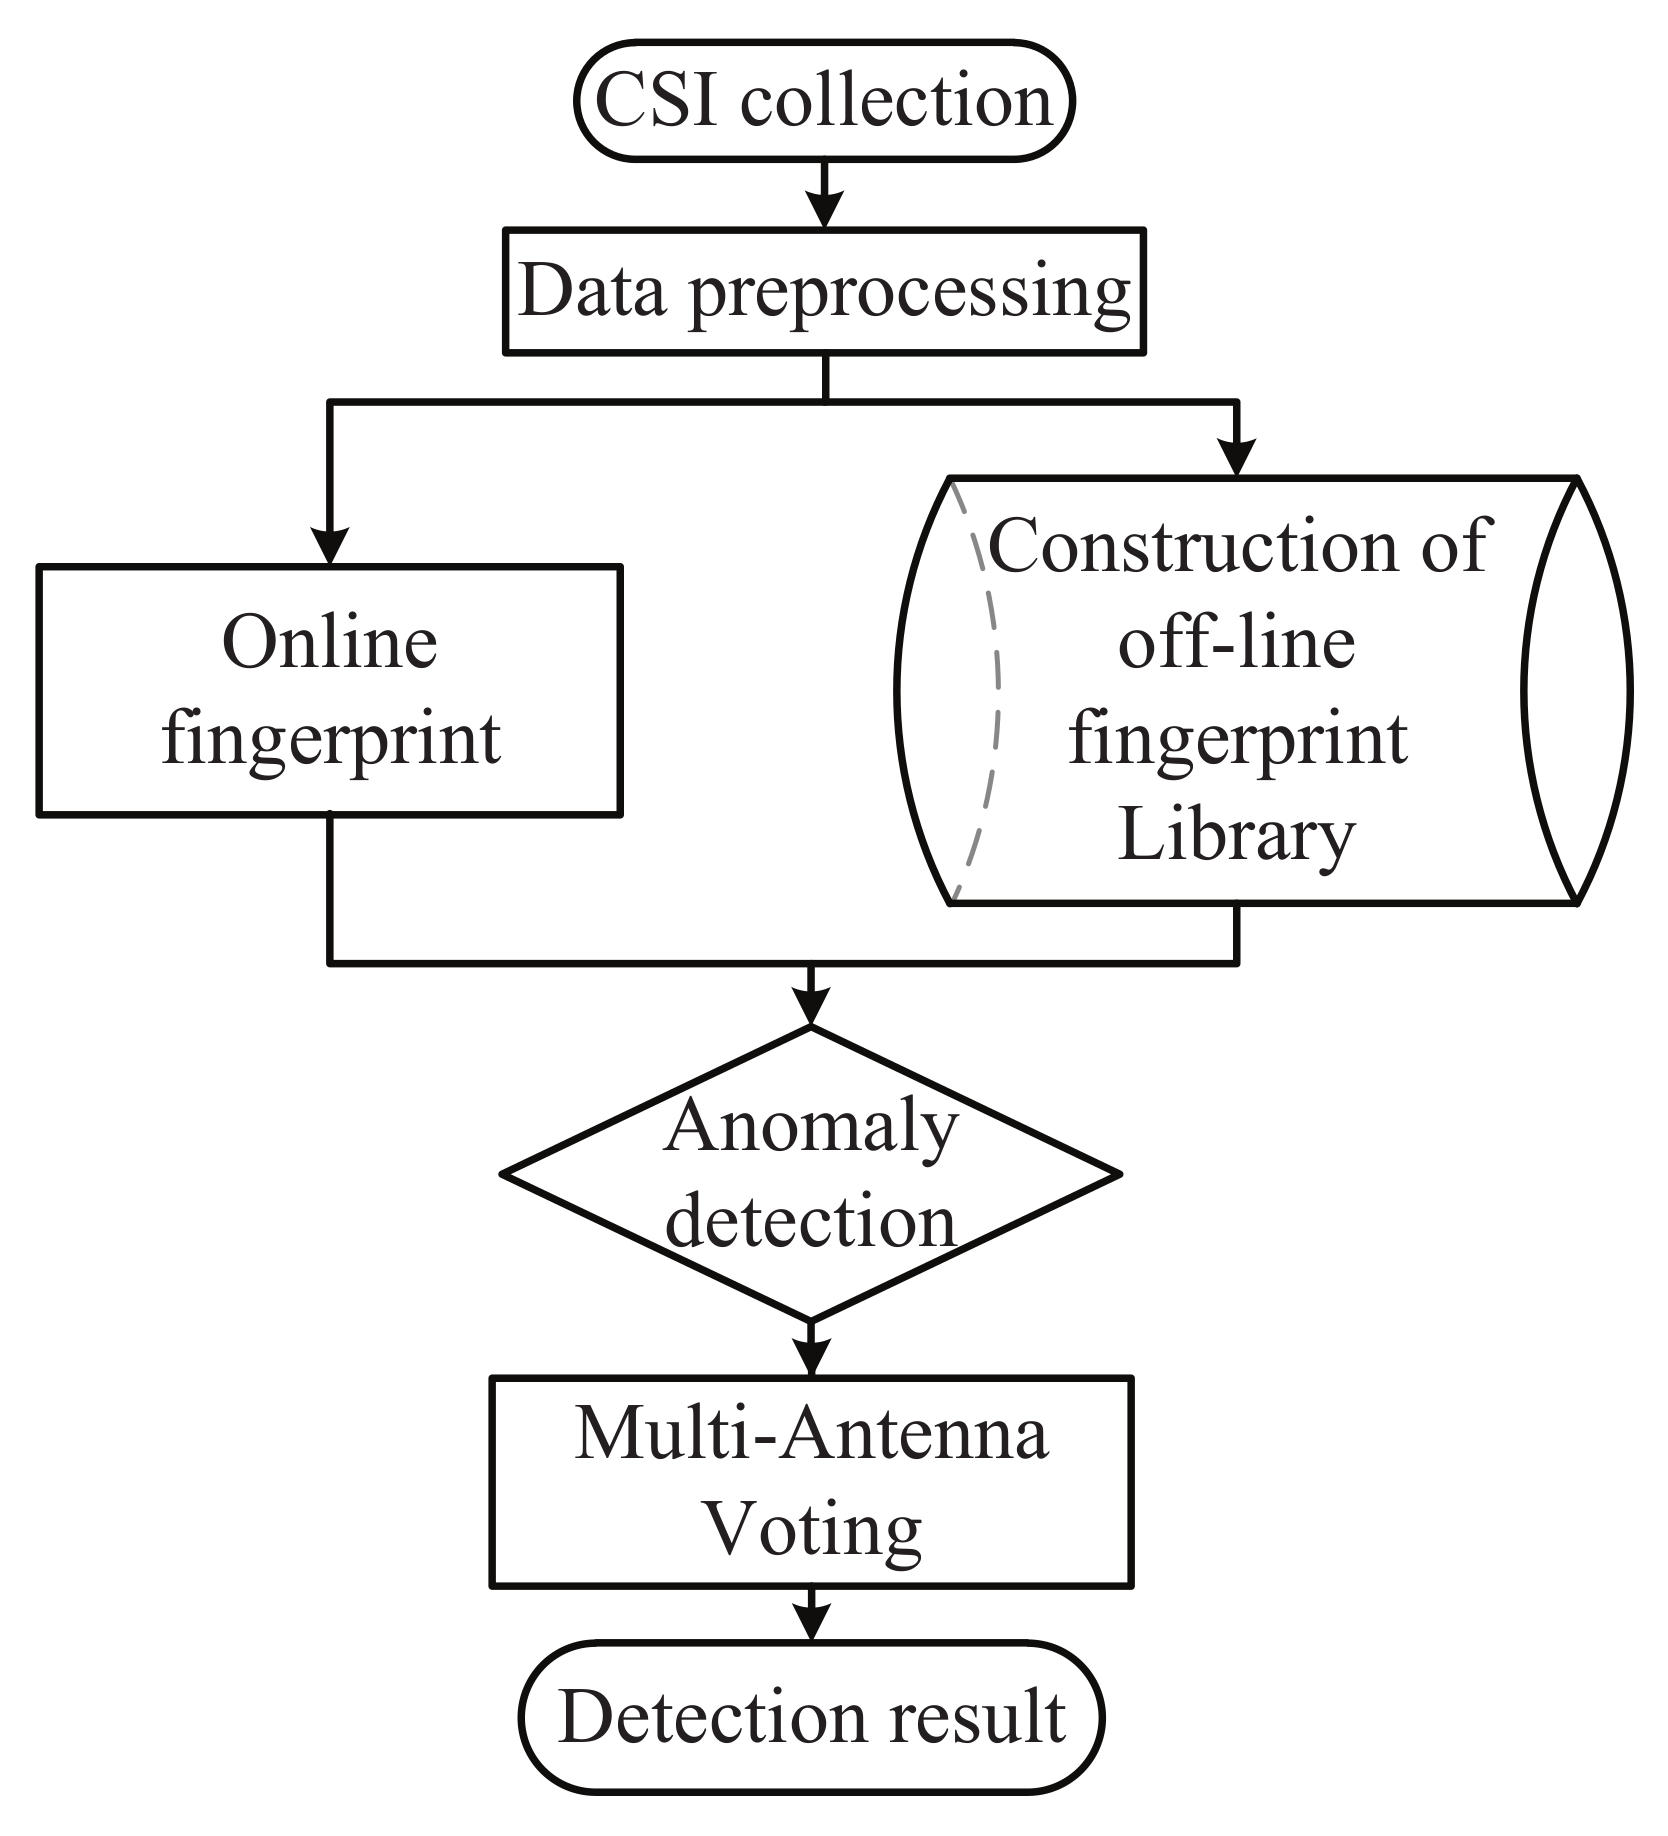
This scheme extracts the effective fingerprint in the frequency domain based on fine-grained physical layer information-CSI. The process is shown in Figure 4. In the offline part, we train the fingerprint corresponding to the three indoor states and store as the offline fingerprint library. In the online phase, the characteristics of the sampling signal is calculated and the online fingerprint and offline training fingerprint are compared so as to determine the current indoor state according to the degree of similarity and the state of the target indoors. After obtaining the results of each receiving antenna, we use the voting scheme to determine the final results.
4.1. Offline Phase
We collected data at multiple measurement points in three states: human-free state, a state with a static target and a state with a moving target. We used the correlation between sub-carriers to show the effect of the target on the wireless signal. At the same time, we selected one second as a sliding window to calculate M correlation coefficient values. In order to satisfy the generality, several sets of offline fingerprints of different periods were calculated and averaged. The collected CSI matrix shows the channel gain on different subcarriers from the transmitting antenna to the receiving antenna, and the CSI matrix H received by each antenna at one measurement point is shown in Equation (7):
Each line is shown as a subcarrier, and each subcarrier vector is expressed as (packet rate is 50 packets per second, t for time):
In wireless communication, the propagation of CSI is affected by multipath effects and the environmental changes, and the original data will be mixed with a certain amount of noise inevitably. We use median filtering to reduce noise and eliminate outliers. All the CSI matrices used in experiments were performed on the noise-reduced data. In the previous section, we have verified that frequency-domain fingerprint can distinguish different states under a scene. In the following, we construct an offline fingerprint library based on this conclusion.
in Equation (5) is the fingerprints trained by a set of offline training sets. In order to get more accurate results, the final offline fingerprint is the result of the average of the g groups’ fingerprints:
is the offline fingerprint in no one scene. We calculate it according to Equations (5) and (9). CSI data of multiple test points are collected when the target exists in the scene. Therefore, when the fingerprints are calculated under the other two situations, the fingerprints of each set of offline training sets are the result of the average fingerprints of the l test points, which is denoted as :
According to Equation (10), we computed the fingerprints (a stationary target in the scene) and the fingerprints (a dynamic target in the scene) by each set of offline training sets, and then put it into Equation (9), the final offline fingerprints and in both states together with are formed as an offline fingerprint library.
4.2. Online Detection and Status Judgment
Collecting a set of online data, we calculate the correlation coefficient matrix with the data of each receiving antenna according to Equation (5).
We use Euclidean distance to compare the similarity between online fingerprint and offline fingerprint . Similarity Measurement is normally achieved through calculating the “distance” between samples. The distance D is as follows:
, and are the distances between the online fingerprint and the offline fingerprints , and . They are calculated according to Equation (11), and the shortest distance is selected as Equation (12):
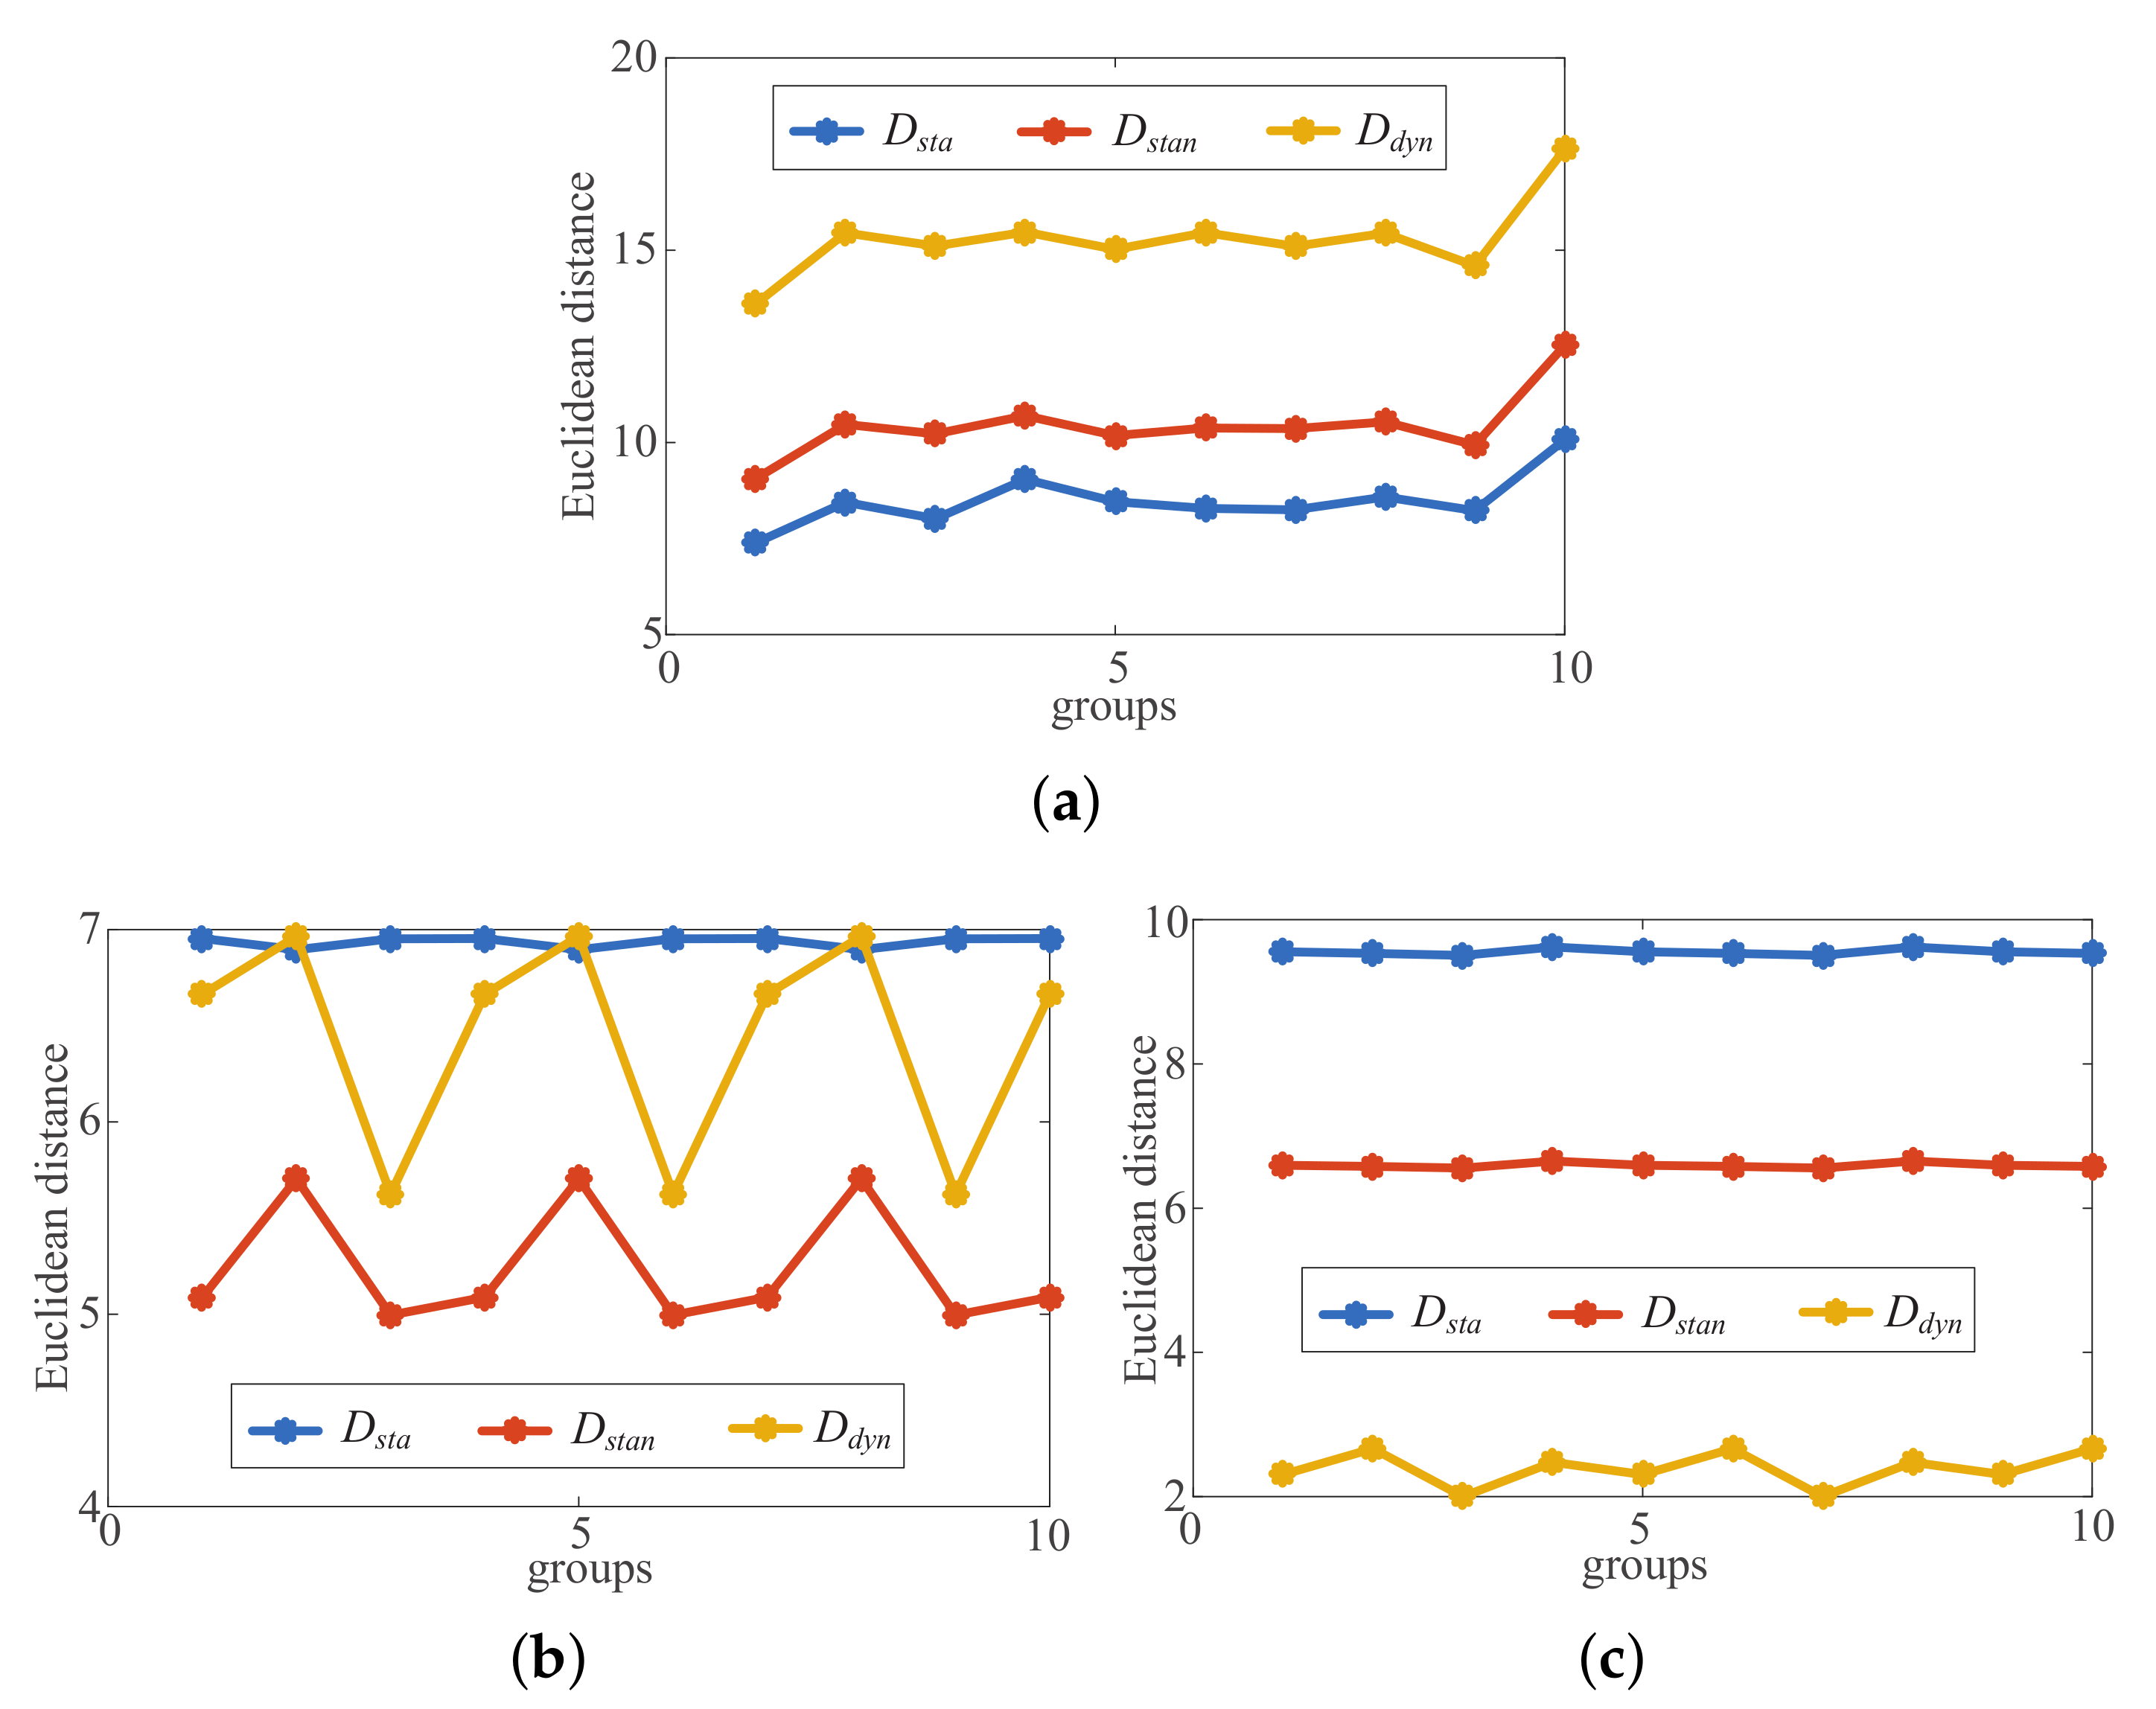
When , the output result shows no one is over the scene. When , the output result shows a stationary object in the scene. When , the output result is that there is a dynamic target in the scene. In order to verify whether the state of the scene can be judged according to the similarity between online fingerprints and offline fingerprints, we took 10 sets of online fingerprints in three states to calculate the Euclidean distance corresponding to antenna 1. Three line graphs in Figure 5 correspond to three states: no one in scene, a stationary object in scene and a dynamic target in scene. At the same time, and are the minimum distances corresponding to each state, and the similarity calculation method is feasible.
4.3. Multiple Antenna Voting
The online phase is the output of a single receiving antenna. In a practical experiment, we use three antennas to receive the CSI matrix transmitted from the transmit antenna. It is mentioned above that we determine the specific state of the scene by comparing the similarity of online and offline fingerprints based on a single receiving antenna. On this basis, if the output results of the two or more antennas are the same, the result is the final output result; if the judgment states of the three antennas are different from each other, the judgment fails.
5. Experiment Results
In this section, the layout of the experimental scenario is introduced, and the results of this scheme and the anomaly detection part in the pilot system are compared in this scenario. In the experiment, we choose different numbers of CSI data packets as a set of offline training sets to investigate whether the accuracy of the detection rate is affected. We collect enough data in three different states (human-free, a stationary and a moving human presence, we call them state 1, state 2 and state 3 in this section) under different time periods, and use these data as offline training sets and online test sets.
5.1. The Layout of the Experimental Scene
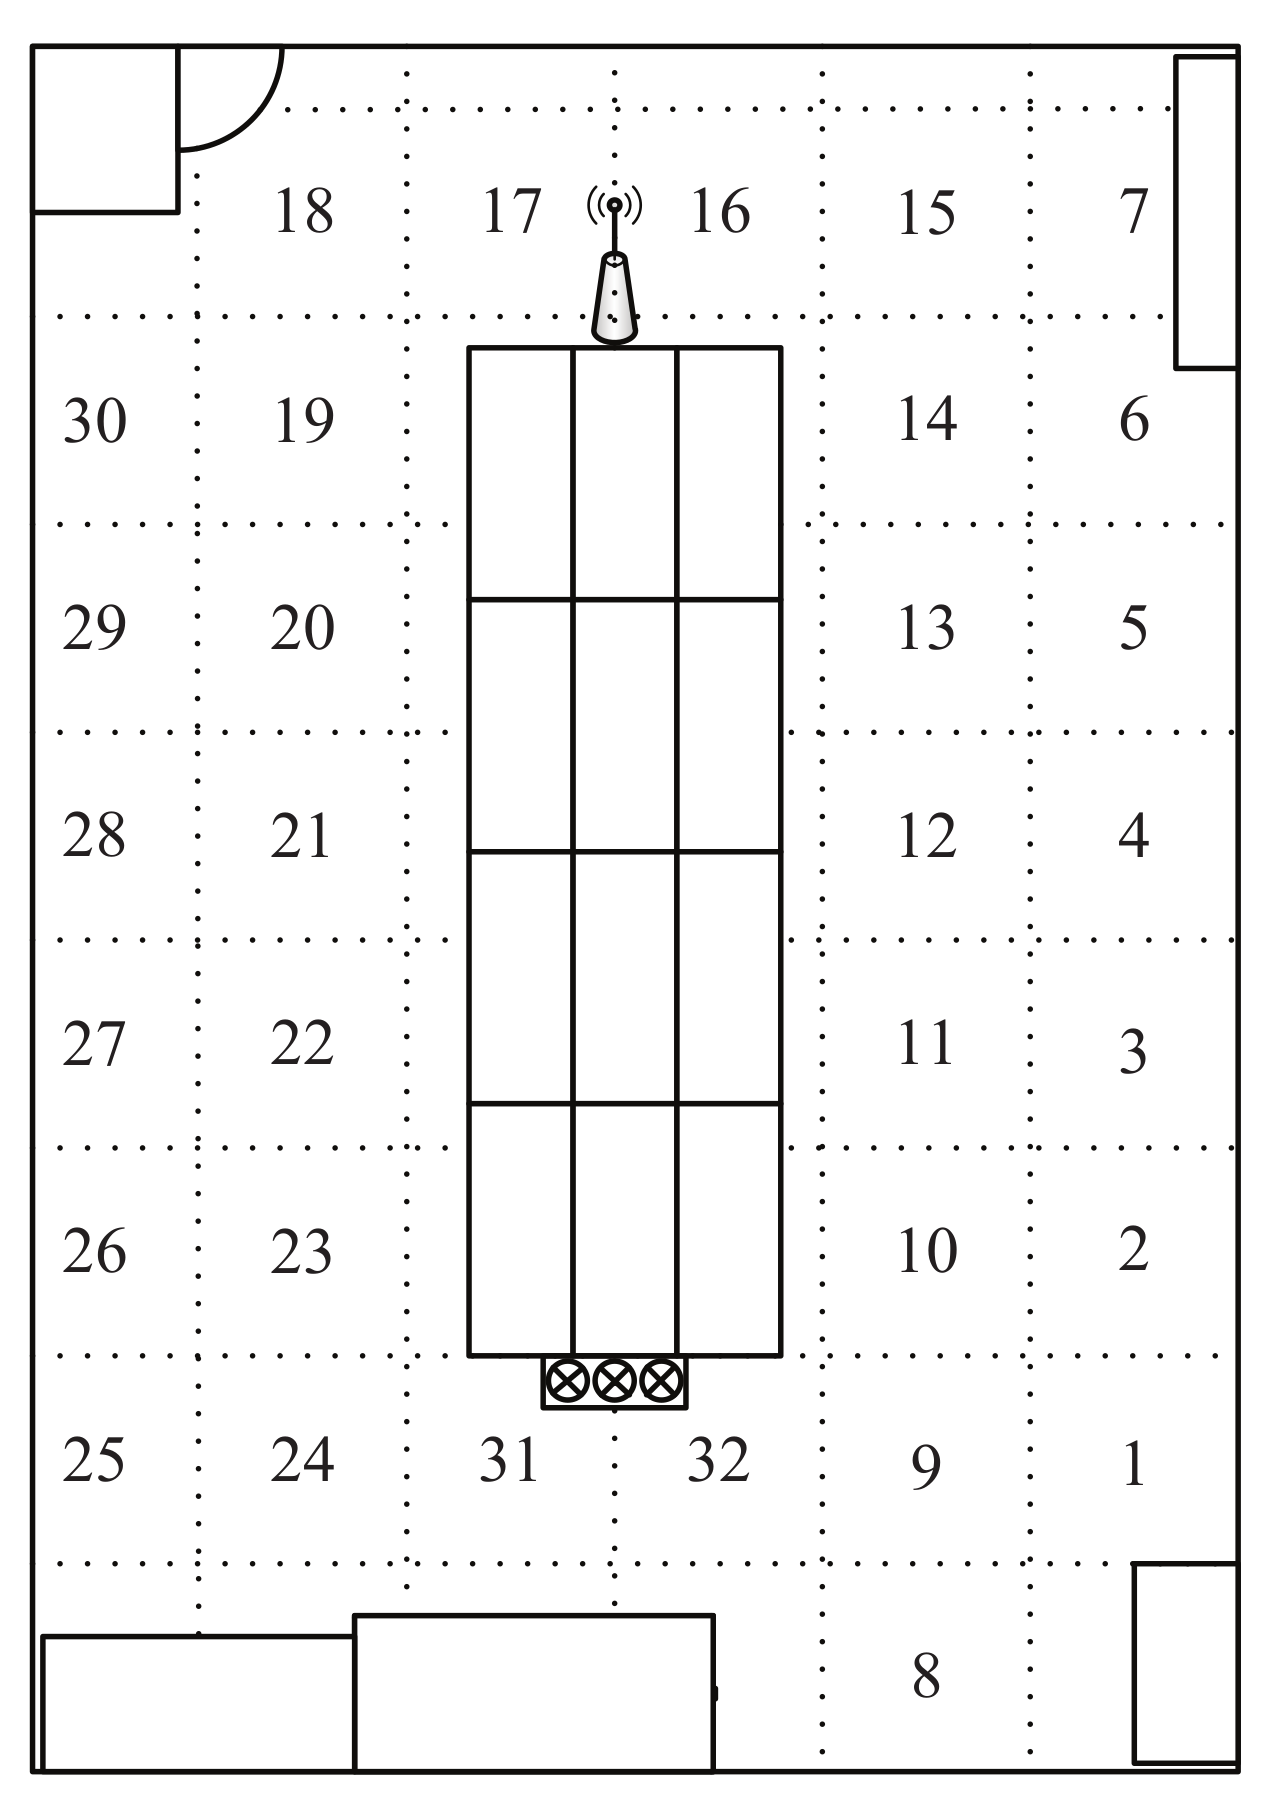
We use a Wireless Access Point (AP), a wireless router, and a computer with a 3-antenna Intel 5300 NIC (Network Interface Card) as a monitoring point (MP) in a 8.5 m × 5.7 m indoor scene and get CSI data by modifying the firmware. The experimental platform is a Wi-Fi based wireless sensing system platform built by the integrated installation tool (TNS-CSI Tool) based on a “Linux 802.11n CSI Tool”.
Before collecting offline data, we first need to establish a reasonable distribution of indoor measurement points. We divide the ground equally into 32 1 m × 1 m areas outside the occupied area by table and chairs. The center of each area is set as a measurement point; AP and MP are placed on two sides of the scene as shown in Figure 6.
5.2. Impact of Multiple Antennas’ Voting on Test Results
Considering the fact that the impacts of different target states on wireless signals are different, in this scheme, we generate feature fingerprint and determine the state of the scene by comparing the similarity between online and offline fingerprints. In the experiment, five groups of calculated by 10 groups of online data received by antenna 3 are not the shortest distances under the static environment. If the result of detection by one antenna is regarded as the final output result, half of the output results are wrong in these 10 groups of sampled data. However, we apply the method of multiple antennas voting. Then, in these five groups, corresponding to antenna 1 and antenna 2 are the smallest. In that way, the detection results of more than two antennas have static environments with the same sampling point, so 10 randomly selected sets of sample data have a detection rate of 100%. Similarly, when the stationary target and dynamic target are in the scene, the corresponding distances and are not the smallest ones under one of the three antennas, while they are likely to be the smallest distance under the two other antennas, except for individual examples. In Figure 7, the abscissas 1, 2, and 3 respectively represent three states. We find that when there is just one target in the scene, the detection rate of a single antenna is 69.5%; when there is a stationary target in the scene, the detection rate of a single antenna is 74.2%. The detection rate obtained after multiple antennas’ voting is obviously higher than that obtained from the single Antenna, without the situation when there is a moving target in a scene.
5.3. Detection Rate Comparison between FDF-PIHD and the Pilot
The Pilot method [27] used the time stability of CSI to complete the anomaly detection. The author formulated a threshold as a criterion to determine whether there is a target intrusion according to the stability of the signal in the time domain without interference combined with the fingerprints trained offline. After calculating the fingerprints according to the pilot method, we find that the correlation coefficient values of all three states are all between 0.9 and 1, and the correlation coefficients calculated under states 2 and 3 are very close without significant difference in these two situations. Figure 8 shows the bar graphs for detection rates and false alarm rates of the indoor state obtained in these two methods when 750 packets are taken as the training set for a group. We can know that the Pilot method cannot discriminate between two states well when there is a stationary target and a dynamic target in the scene, and the static detection rate is only 77% at the maximum. However, the detection results of three states in the scenario in our method can reach more than 90%. At the same time, the false alarm rate of this scheme is far lower than that of the Pilot method.
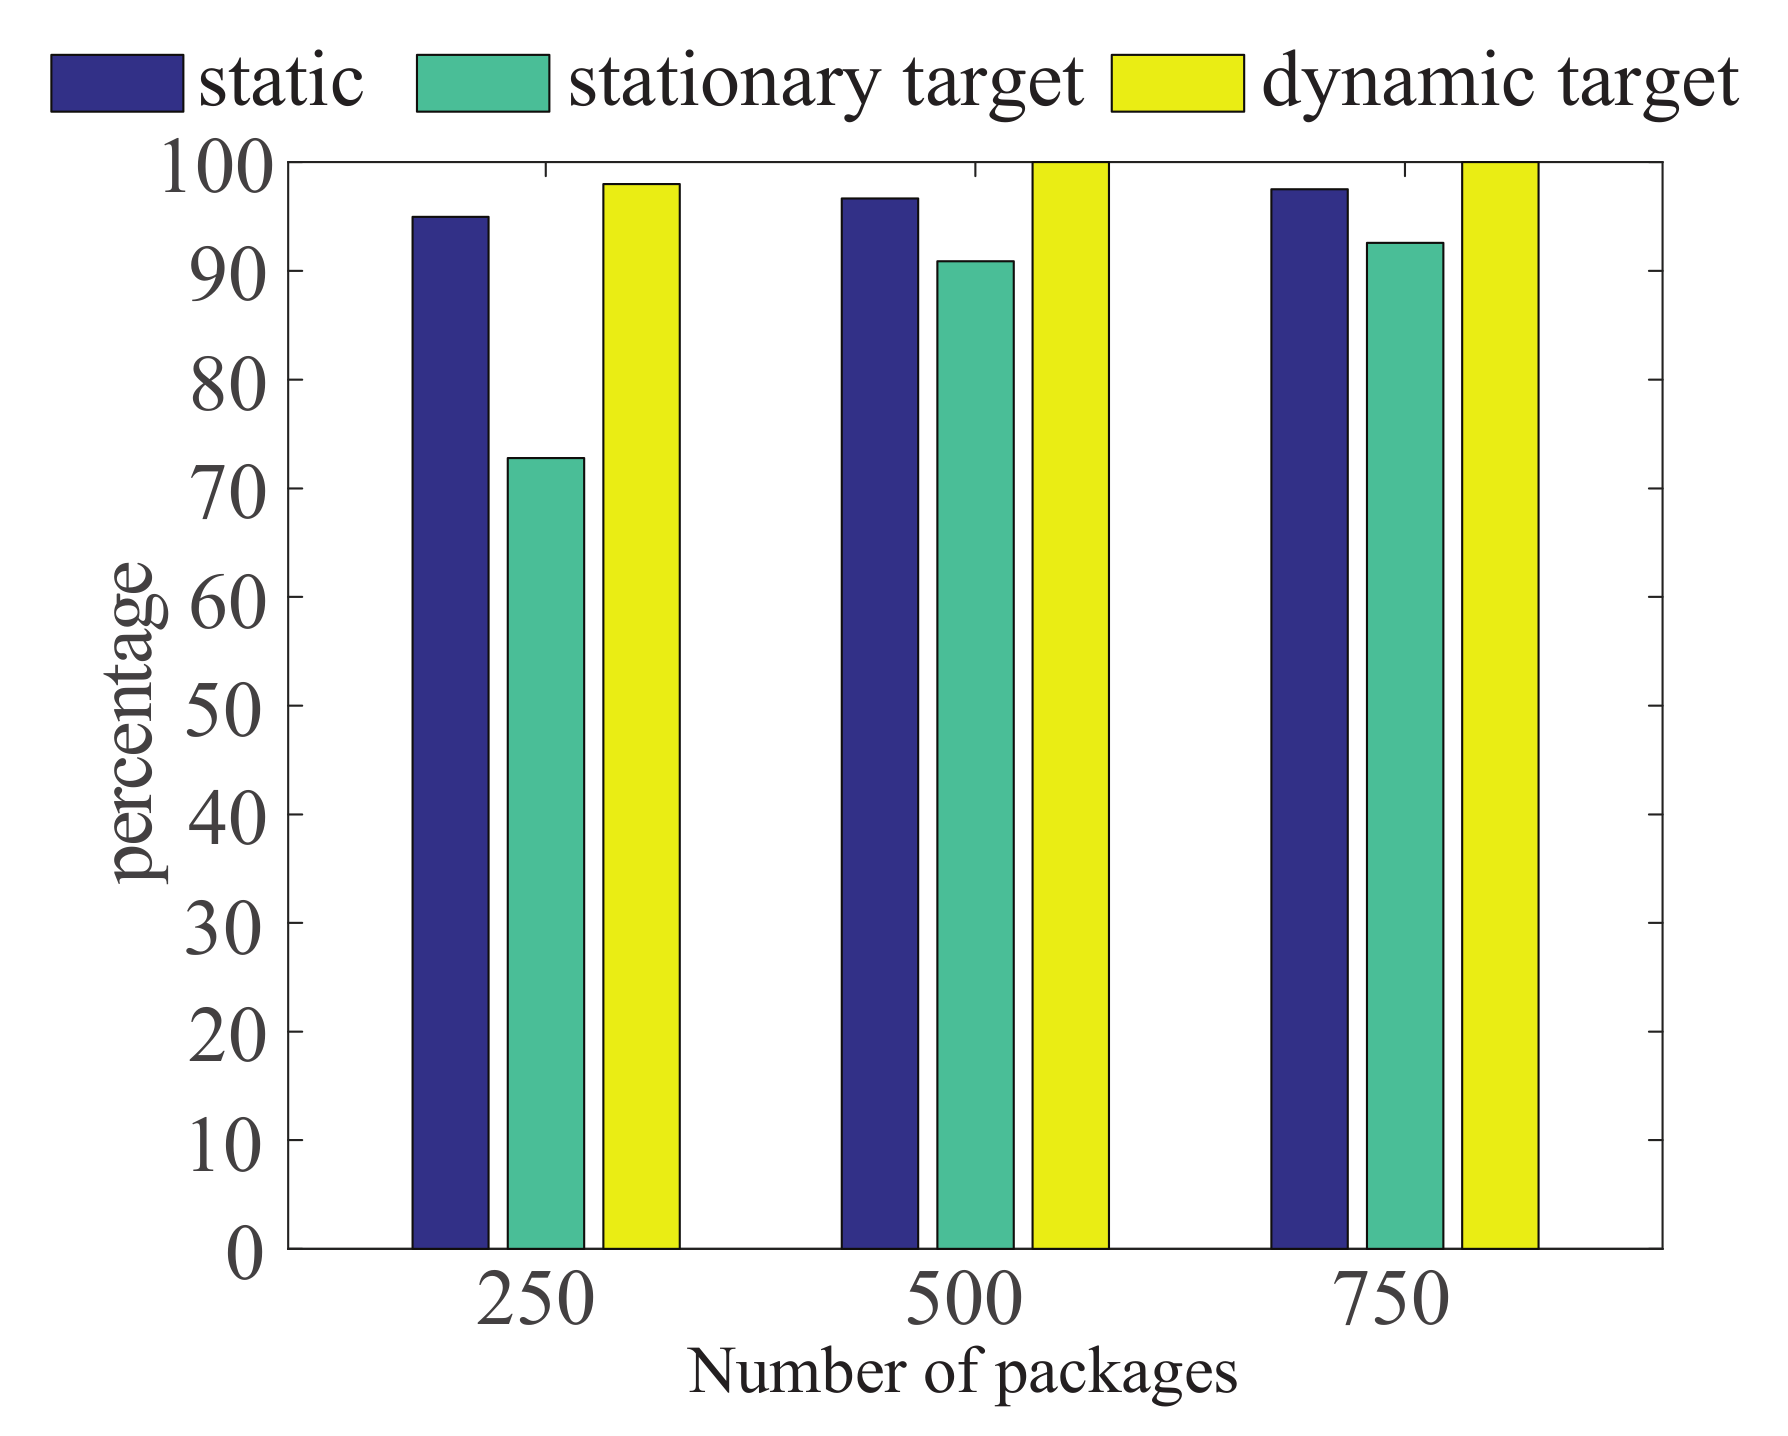
5.4. The Impact of the Number of Packets Used for Fingerprinting on Test Results
The greater the number of fingerprints in each state, the more accurate the corresponding detection rate will be. In order to ensure the generation of as many fingerprints as possible, we set the sliding window as 50. Based on the unchanged sliding window, we change the number of packets needed for online fingerprints by changing the number of packets that are used for each set of offline training sets, and analyze its impact on test accuracy. We use 750 and 500 data packets, respectively, as a set of offline training sets. We draw a histogram as shown in Figure 9 after finishing all the data collected in the experiment. It precisely indicates the changes of detection rate. The detection rates of three states are rising with the increase in the number of packets. When 500 packets are used, the static detection rate is 96.67%, a static target detection rate 90.89%, and the dynamic detection rate 100%. When 750 packets are used, the static detection rate is 97.5%, the static target detection rate is 92.58%, and the dynamic detection rate is 100%. Based on the assumption that the detection rates of all three states should be above 90%, the minimum number of packets required for the training set and the online test set is 500.
6. Conclusions
In FDF-PIHD proposed in this paper, we extract valid CSI features and calculate the correlation between subcarriers in the frequency domain to generate fingerprints, which can effectively avoid the problem that wireless signals in the time domain may be affected by the environment. Meanwhile, we use a voting method to reduce the mistakes in reporting, which guarantees high detection accuracy. In addition, the method can not only detect whether there is a target in the scene, but also determine the specific state of the target. On this basis, we intend to conduct further studies in the area of passive indoor positioning.
Acknowledgments
This work is partly supported by the National Natural Science Foundation of China under Grant No. 61572261, 61702284 and 61662039, the Natural Science Foundation of Jiangsu Province under Grant No. BK20150868, the Postdoctoral Found of Jiangsu Province under Grant No. 1701165C and the NUPTSF under Grant No. NY214013.
Author Contributions
Chong Han mainly came up with the research idea and wrote the paper. Qingqing Tan and Hai Zhu designed and performed the experiments; Jian Guo analyzed the data; Lijuan Sun supervised the work. All authors have read and approved the final manuscript.
Conflicts of Interest
The authors declare no conflict of interest.
References
- Alemdar, H.; Ersoy, C. Wireless sensor networks for healthcare: A survey. Comput. Netw. 2010, 54, 2688–2710. [Google Scholar] [CrossRef]
- Patwari, N.; Brewer, L.; Tate, Q.; Kaltiokallio, O.; Bocca, M. Breathfinding: A wireless network that monitors and locates breathing in a home. IEEE J. Sel. Top. Signal Process. 2014, 8, 30–42. [Google Scholar] [CrossRef]
- Wang, X.; Yi, P. Security Framework for Wireless Communications in Smart Distribution Grid. IEEE Trans. Smart Grid 2011, 2, 809–818. [Google Scholar] [CrossRef]
- Bisio, I.; Lavagetto, F.; Marchese, M.; Sciarrone, A. Performance Comparison of a Probabilistic Fingerprint-based Indoor Positioning System over Different Smartphones. In Proceedings of the 2013 International Symposium on Performance Evaluation of Computer and Telecommunication Systems, Toronto, ON, Canada, 7–10 July 2013. [Google Scholar]
- Bisio, I.; Cerruti, M.; Lavagetto, F.; Marchese, M.; Pastorino, M.; Randazzo, A.; Sciarrone, A. A Trainingless WiFi Fingerprint Positioning Approach over Mobile Devices. IEEE Antennas Wirel. Propag. Lett. 2014, 13, 832–835. [Google Scholar] [CrossRef]
- Erceg, V.; Greenstein, L.J.; Tjandra, S.Y.; Parkoff, S.R.; Gupta, A.; Kulic, B.; Julius, A.; Jastrzab, R. An empirically based path loss model for wireless channels in suburban environments. IEEE J. Sel. Areas Commun. 2002, 17, 1205–1211. [Google Scholar] [CrossRef]
- Xia, P.; Zhou, S.; Giannakis, G.B. Adaptive MIMO-OFDM based on partial channel state information. IEEE Trans. Signal Process. 2004, 52, 202–213. [Google Scholar] [CrossRef]
- Nee, R.V.; Prasad, R. OFDM for Wireless Multimedia Communications; Artech House: Norwood, MA, USA, 2000. [Google Scholar]
- Yang, Z.; Wu, C.; Liu, Y. Locating in fingerprint space: wireless indoor localization with little human intervention. In Proceedings of the 18th Annual International Conference on Mobile Computing and Networking, Istanbul, Turkey, 22–26 August 2012; pp. 269–280. [Google Scholar]
- Wang, Z.M.; Zhang, L.; Bao, H. Bi-channel Video Fusion Human Invasion Detection Based on Neural Network. Comput. Eng. 2012, 38, 183–187. [Google Scholar]
- Chan, Y.T.; Hang, H.Y.C.; Ching, P.C. Exact and approximate maximum likelihood localization algorithms. IEEE Trans. Veh. Technol. 2006, 55, 10–16. [Google Scholar] [CrossRef]
- Choi, Y.K.; Kim, K.M.; Jung, J.W. Acoustic intruder detection system for home security. IEEE Trans. Consum. Electron. 2005, 51, 130–138. [Google Scholar] [CrossRef]
- Cheng, W.D.; Dong, Y.G. Detection of human body motion features using pyroelectric sensor. Chin. J. Sci. Instrum. 2008, 29, 1020–1023. [Google Scholar]
- Youssef, M.; Mah, M.; Agrawala, A. Challenges: Device-free passive localization for wireless environments. In Proceedings of the 13th Annual ACM International Conference on Mobile Computing and Networking, Montréal, QC, Canada, 9–14 September 2007; pp. 222–229. [Google Scholar]
- Moussa, M.; Youssef, M. Smart devices for smart environments: Device-free passive detection in real environments. In Proceedings of the 2009 IEEE International Conference on Pervasive Computing and Communications, Galveston, TX, USA, 9–13 March 2009; pp. 1–6. [Google Scholar]
- Kaltiokallio, O.; Bocca, M. Real-Time Intrusion Detection and Tracking in Indoor Environment through Distributed RSSI Processing. In Proceedings of the IEEE 17th International Conference on Embedded and Real-Time Computing Systems and Applications, Toyama, Japan, 28–31 August 2011; pp. 61–70. [Google Scholar]
- Mrazovac, B.; Bjelica, M.Z.; Kukolj, D.; Vukosavljev, S.; Todorovic, B.M. System Design for Passive Human Detection Using Principal Components of the Signal Strength Space. In Proceedings of the 2012 IEEE 19th International Conference and Workshops on Engineering of Computer Based Systems, Novi Sad, Serbia, 11–13 April 2012; pp. 164–172. [Google Scholar]
- Zhang, D.; Ma, J.; Chen, Q.; Ni, L.M. An RF-Based System for Tracking Transceiver-Free Objects. In Proceedings of the IEEE 5th Annual International Conference on Pervasive Computing and Communications, White Plains, NY, USA, 19–23 March 2007; pp. 135–144. [Google Scholar]
- Fernandes, R.; Matos, J.N.; Varum, T.; Pinho, P. Wi-Fi intruder detection. In Proceedings of the 2014 IEEE Conference on Wireless Sensors, Subang, Malaysia, 26–28 October 2014; pp. 96–99. [Google Scholar]
- Alfandi, O.; Bochem, A.; Bulert, K.; Hogrefe, D.; Maier, A. Received signal strength indication for movement detection. In Proceedings of the 2015 Eighth International Conference on Mobile Computing and Ubiquitous Networking, Hakodate, Japan, 20–22 January 2015; pp. 82–83. [Google Scholar]
- Han, G.; Klinker, G.J. Dynamic threshold adjustment in a proximity-based location tracking system using reference modules. In Proceedings of the 2015 International Wireless Communications and Mobile Computing Conference, Dubrovnik, Croatia, 24–28 August 2015; pp. 1248–1253. [Google Scholar]
- Younus, M.U.; Li, Y.; Shahbaz, M.; Shafi, R.; He, H. Robust security system for intruder detection and its weight estimation in controlled environment using Wi-Fi. In Proceedings of the 2016 IEEE 2nd International Conference on Computer and Communications, Chengdu, China, 14–17 October 2016; pp. 985–990. [Google Scholar]
- Brauers, C.; Endemann, W.; Kays, R. Augmenting OFDM wireless local networks with motion detection capability. In Proceedings of the 2016 IEEE 6th International Conference on Consumer Electronics-Berlin, Berlin, Germany, 5–7 September 2016; pp. 253–257. [Google Scholar]
- Lv, J.; Yang, W.; Gong, L.; Man, D.; Du, X. Robust WLAN-Based Indoor Fine-Grained Intrusion Detection. In Proceedings of the 2016 IEEE Global Communications Conference, Washington, DC, USA, 4–8 December 2016; pp. 1–6. [Google Scholar]
- Qian, K.; Wu, C.; Yang, Z.; Liu, Y.; Zhou, Z. PADS: Passive detection of moving targets with dynamic speed using PHY layer information. In Proceedings of the IEEE International Conference on Parallel and Distributed Systems, Hsinchu, Taiwan, 16–19 December 2014; pp. 1–8. [Google Scholar]
- Xiao, J.; Wu, K.; Yi, Y.; Wang, L.; Ni, L.M. FIMD: Fine-grained Device-free Motion Detection. In Proceedings of the IEEE International Conference on Parallel and Distributed Systems, Singapore, 17–19 December 2012; pp. 229–235. [Google Scholar]
- Xiao, J.; Wu, K.; Yi, Y.; Wang, L.; Ni, L.M. Pilot: Passive Device-Free Indoor Localization Using Channel State Information. In Proceedings of the 2013 IEEE 33rd International Conference on Distributed Computing Systems, Philadelphia, PA, USA, 8–11 July 2013; pp. 236–245. [Google Scholar]
Figure 1.
Three signals of the propagation paths.
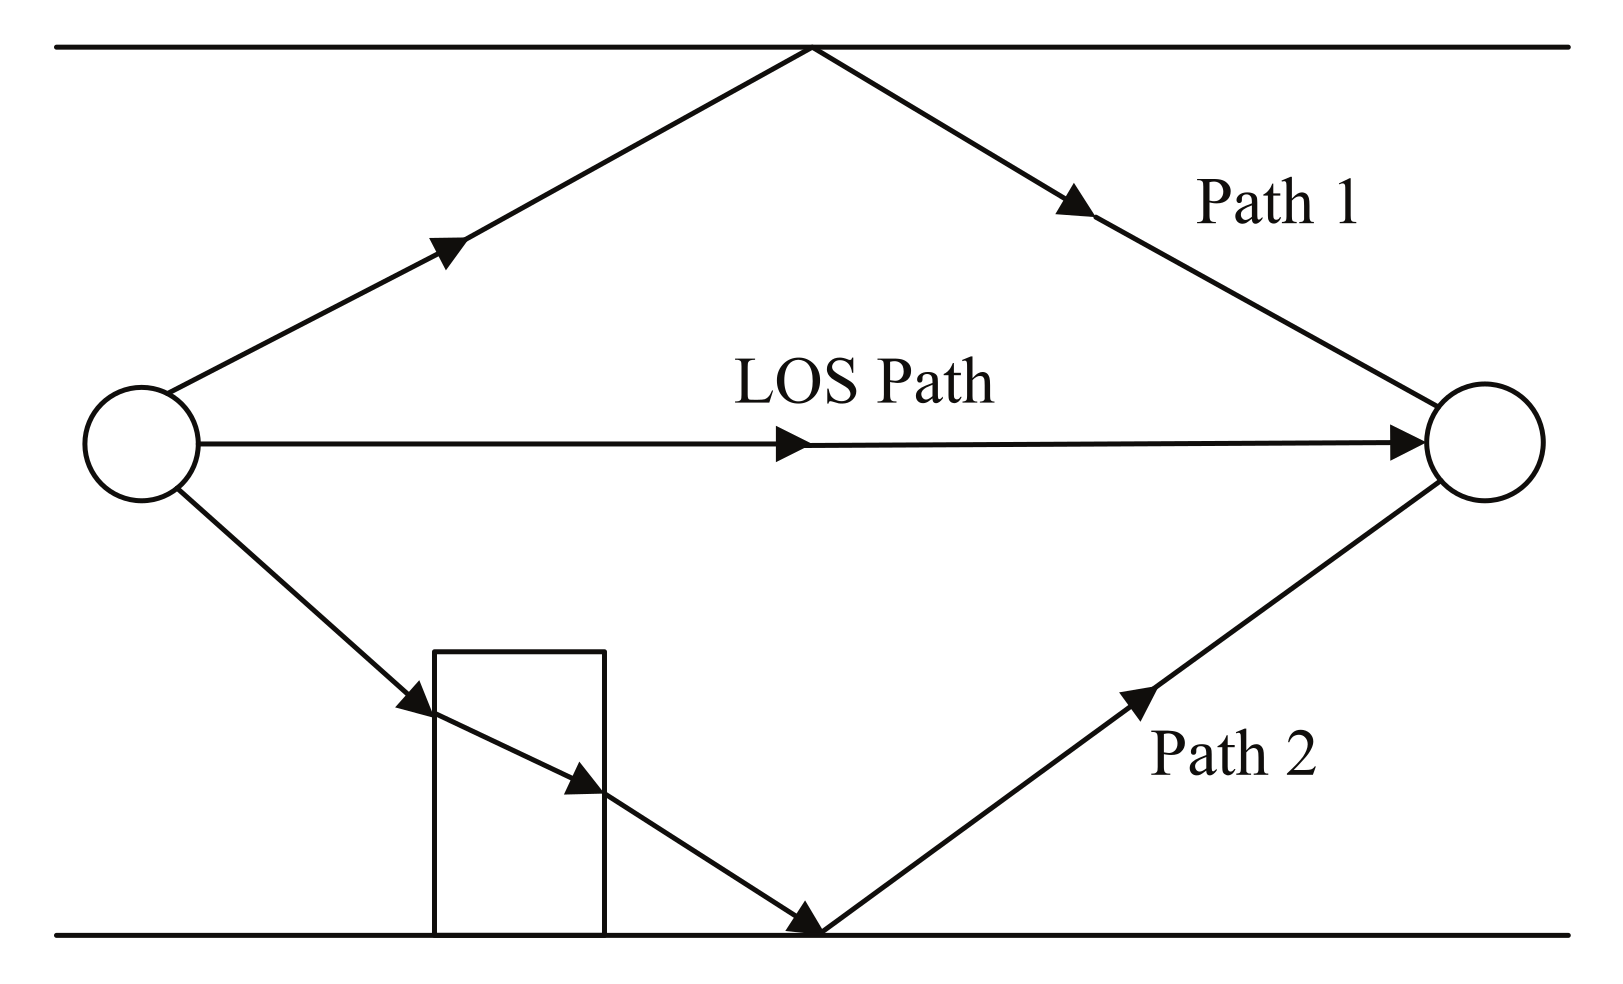
Figure 2.
Signal waveform of three propagation paths.
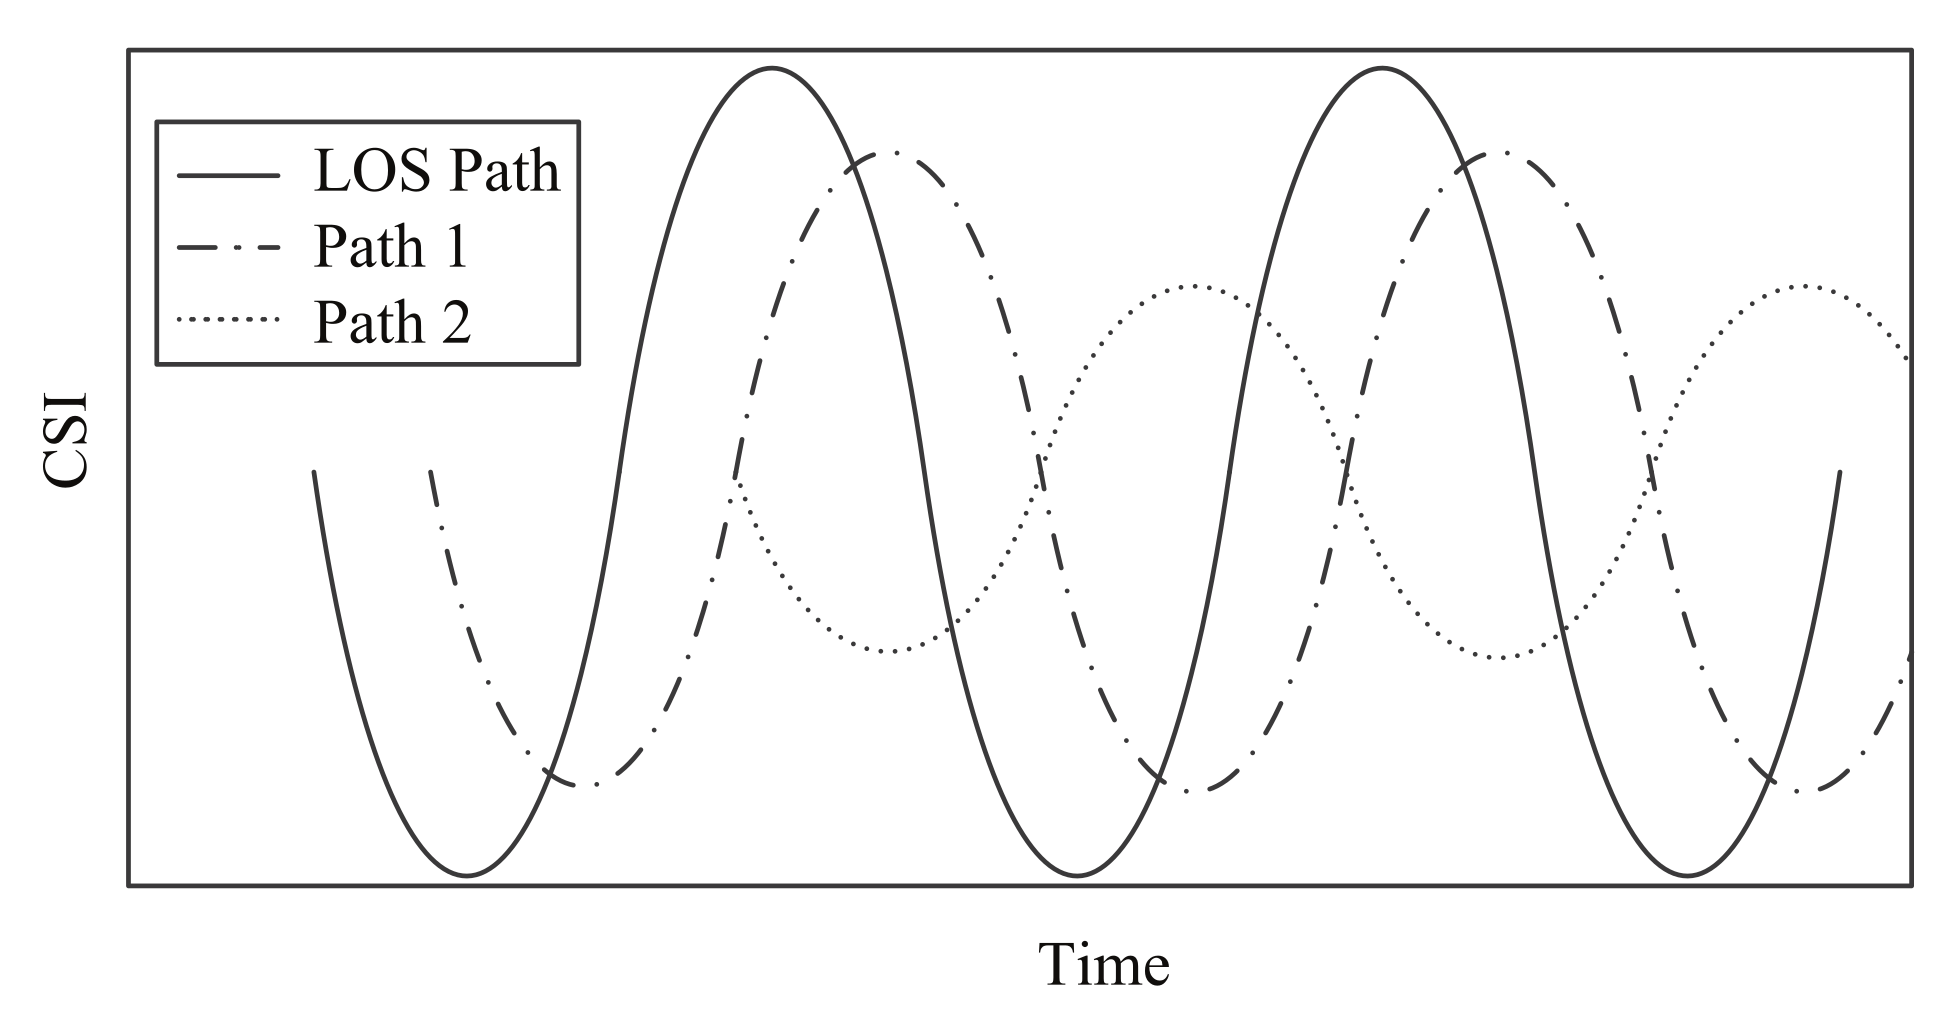
Figure 3.
Kernel density images on three antennas. (a) antenna 1; (b) antenna 2; (c) antenna 3.
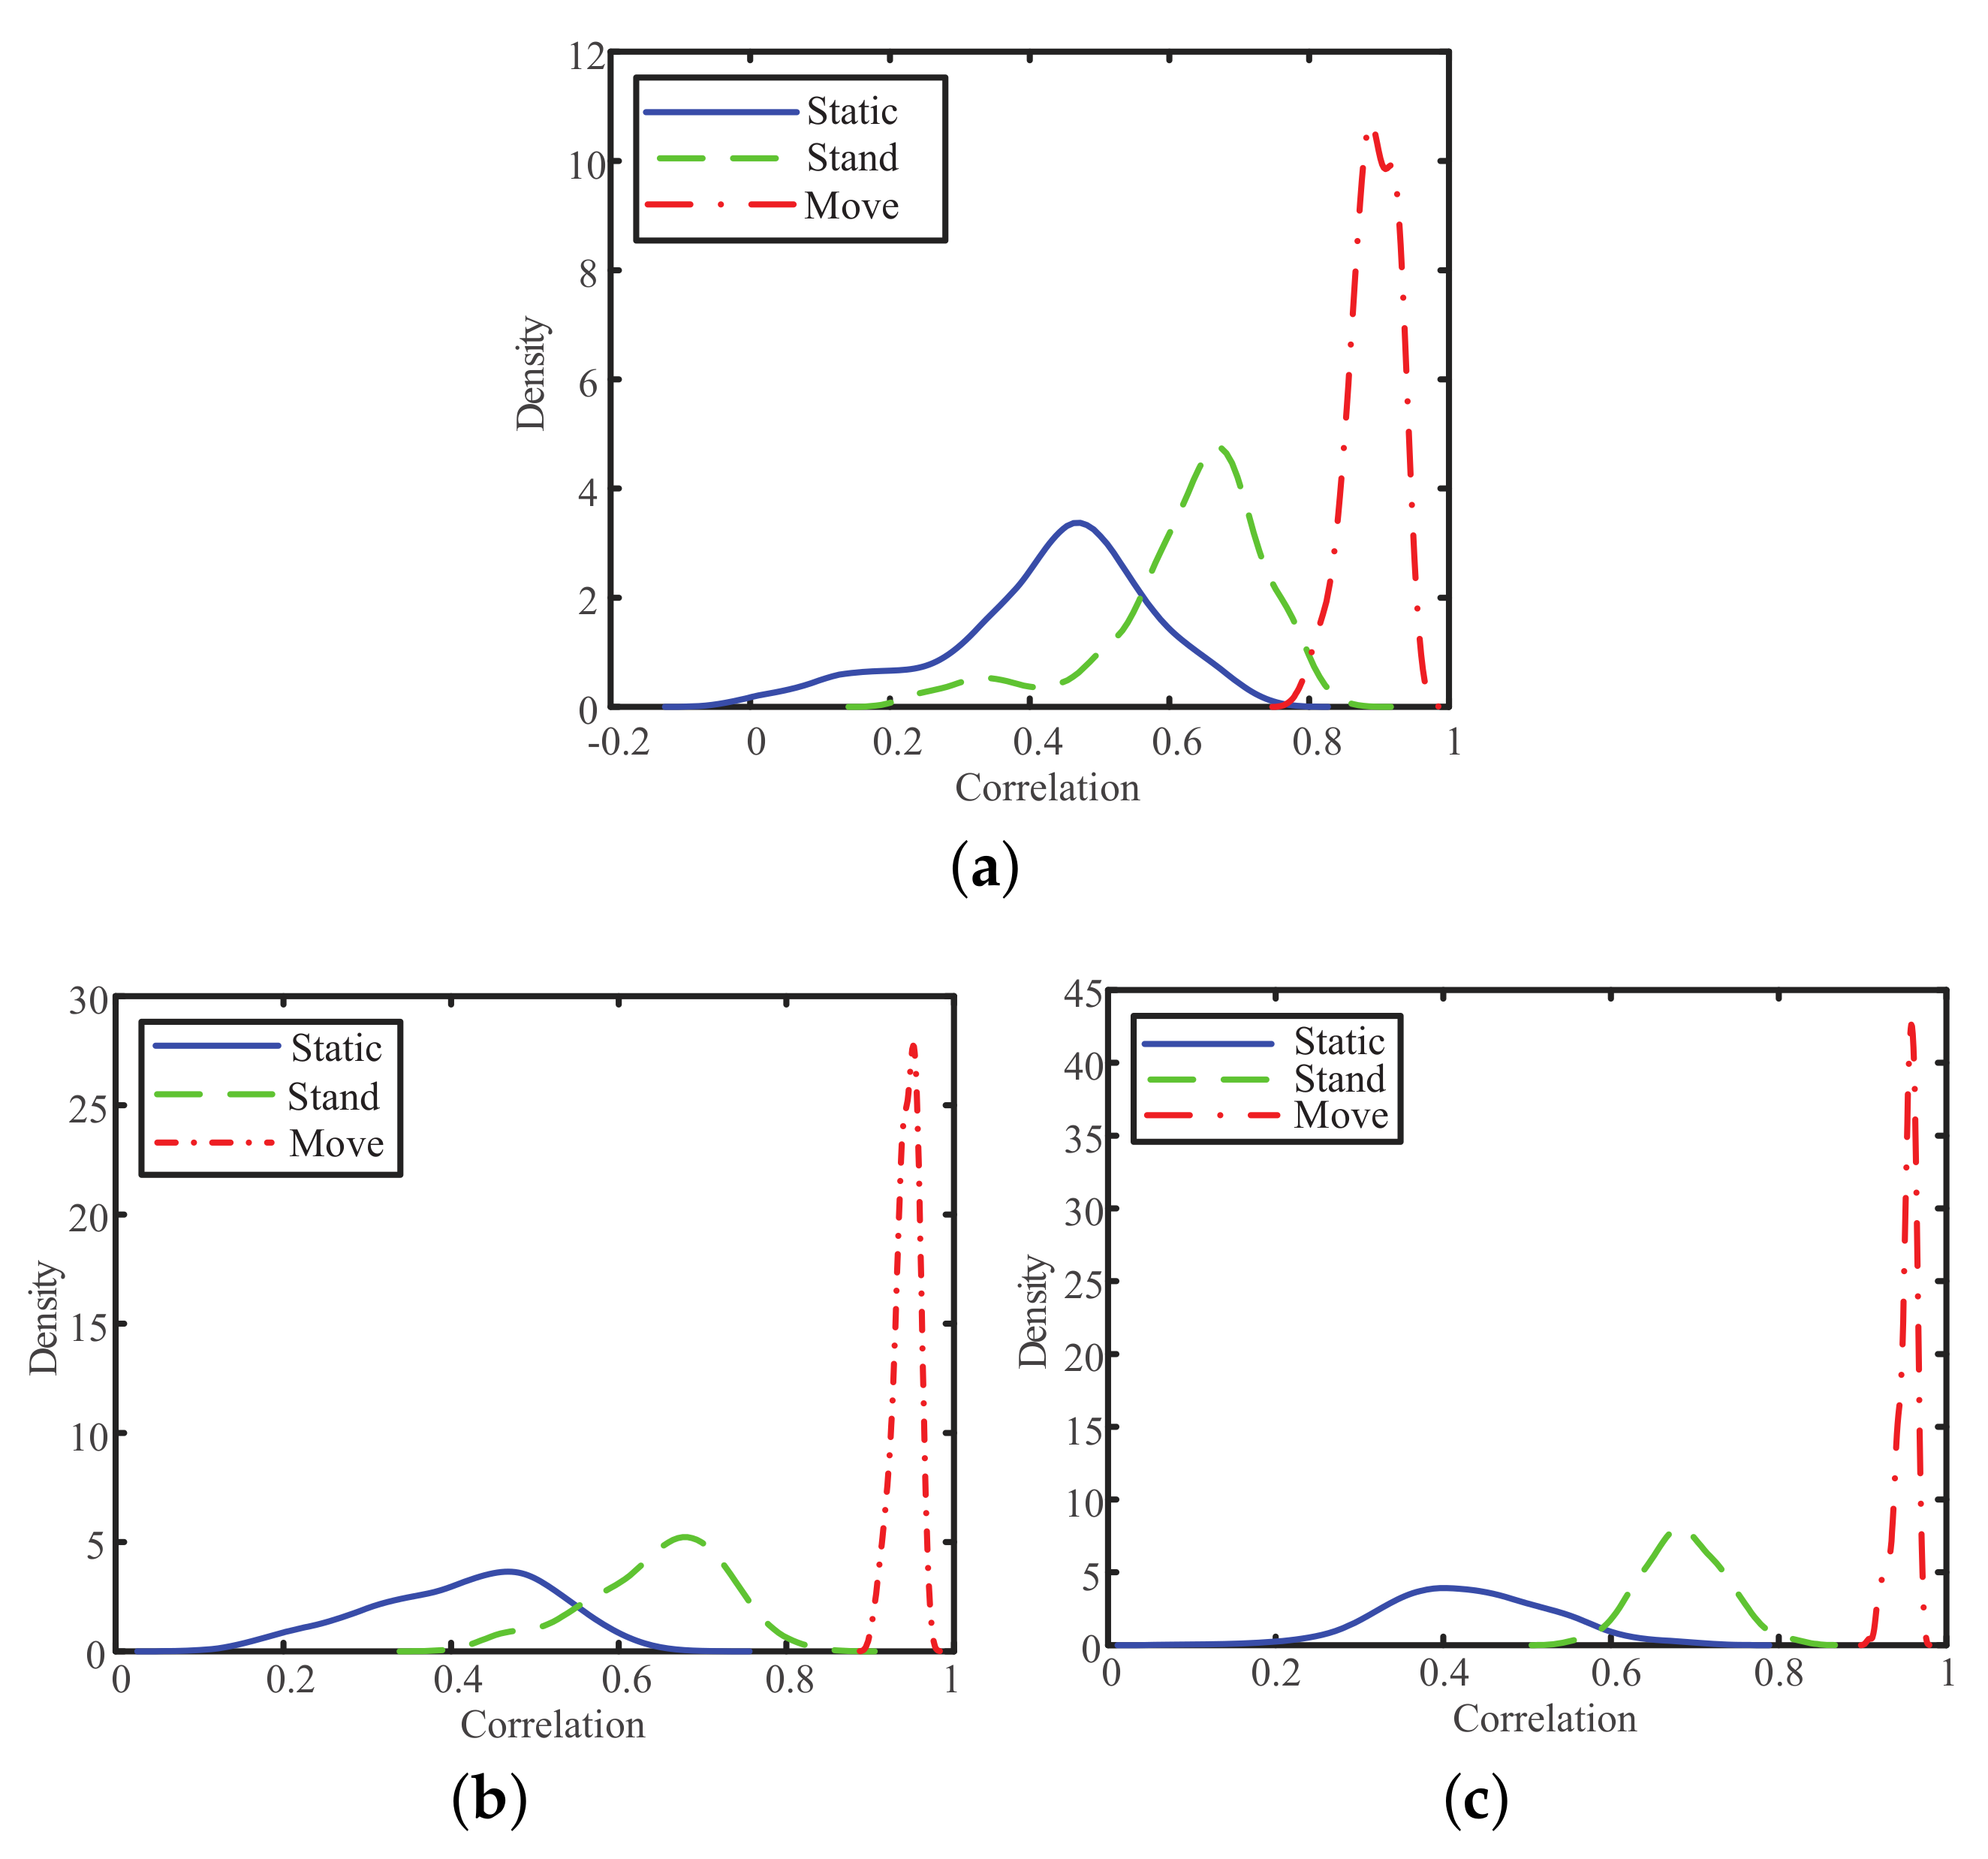
Figure 4.
Flow chart of the proposed FDF-PIHD (Frequency Domain Fingerprint-based Passive Indoor Human Detection) method.
Figure 4.
Flow chart of the proposed FDF-PIHD (Frequency Domain Fingerprint-based Passive Indoor Human Detection) method.

Figure 5.
The Euclidean distance of three states under 750 data packets on antenna 1. (a) online human-free fingerprint; (b) online stationary target fingerprint; (c) online moving target fingerprint.
Figure 5.
The Euclidean distance of three states under 750 data packets on antenna 1. (a) online human-free fingerprint; (b) online stationary target fingerprint; (c) online moving target fingerprint.

Figure 6.
The layout of the experimental scene.

Figure 7.
The influence of the number of antennas on the detection rate.
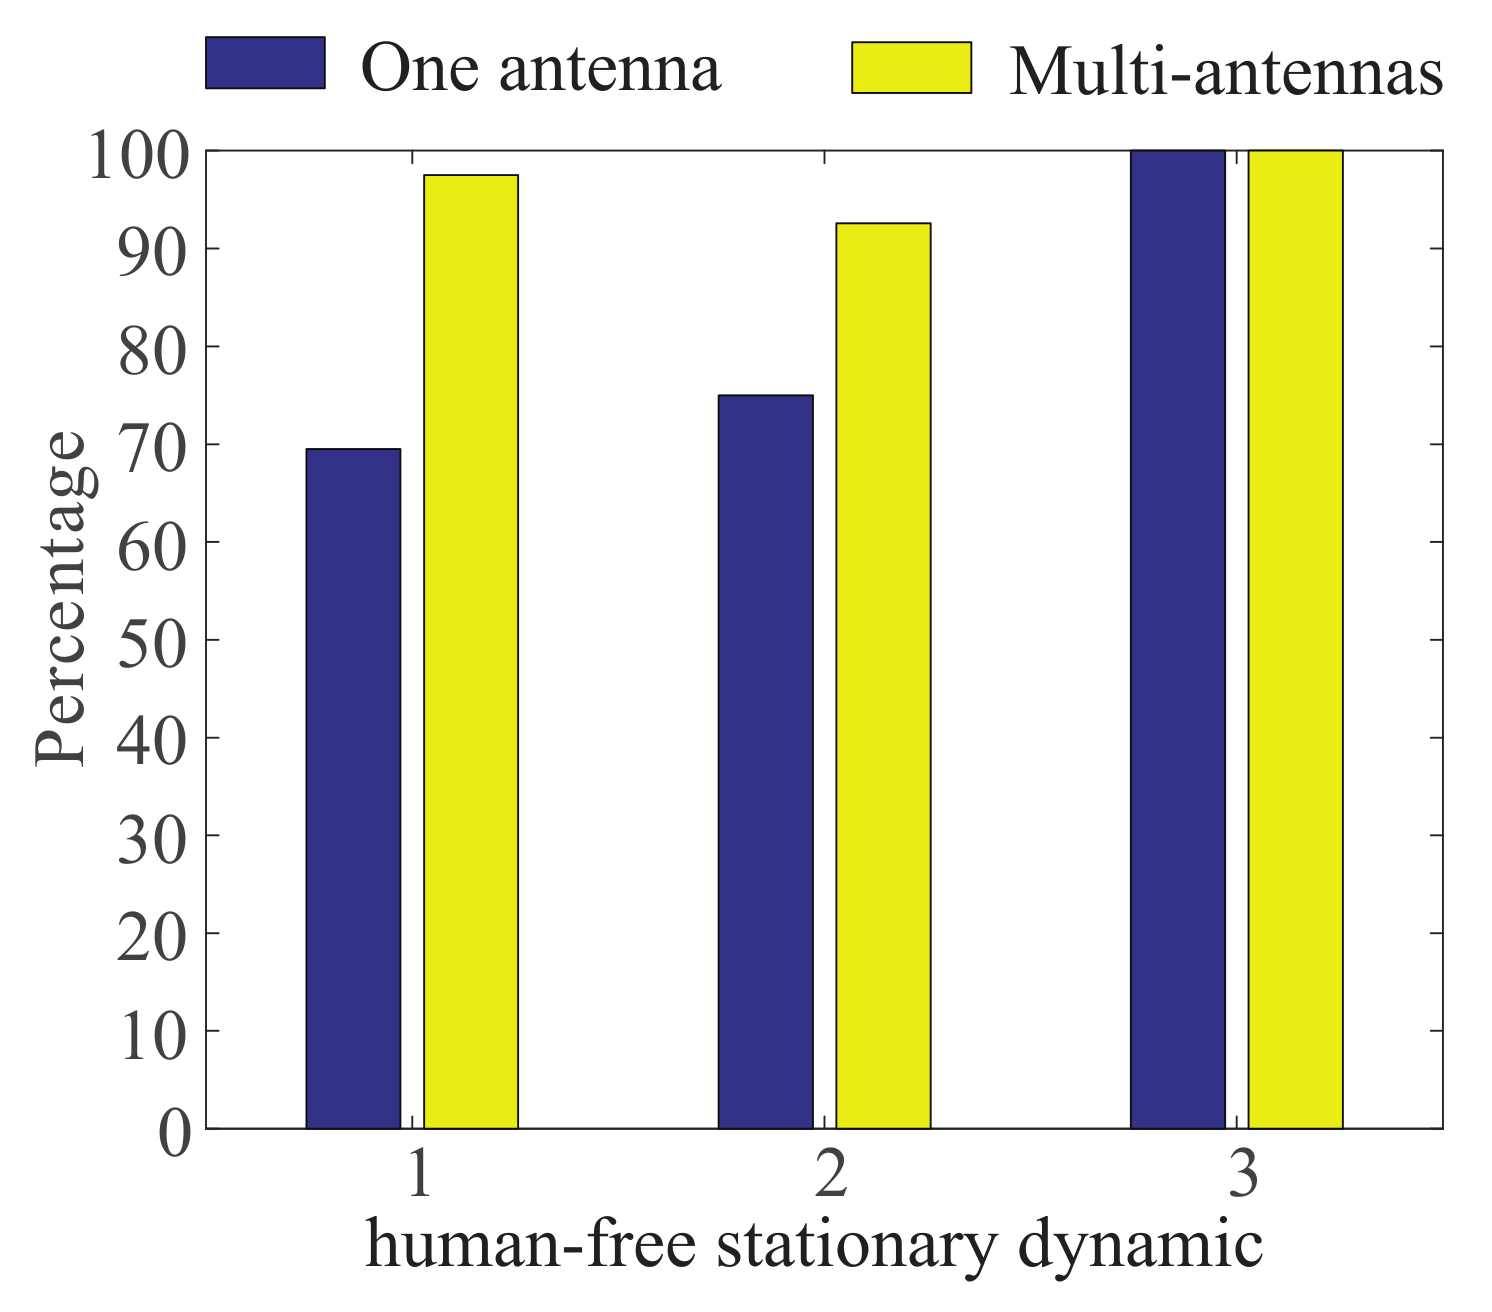
Figure 8.
Comparison diagram of detection rate and false alarm rate. (a) online human-free fingerprint; (b) online stationary target fingerprint.
Figure 8.
Comparison diagram of detection rate and false alarm rate. (a) online human-free fingerprint; (b) online stationary target fingerprint.
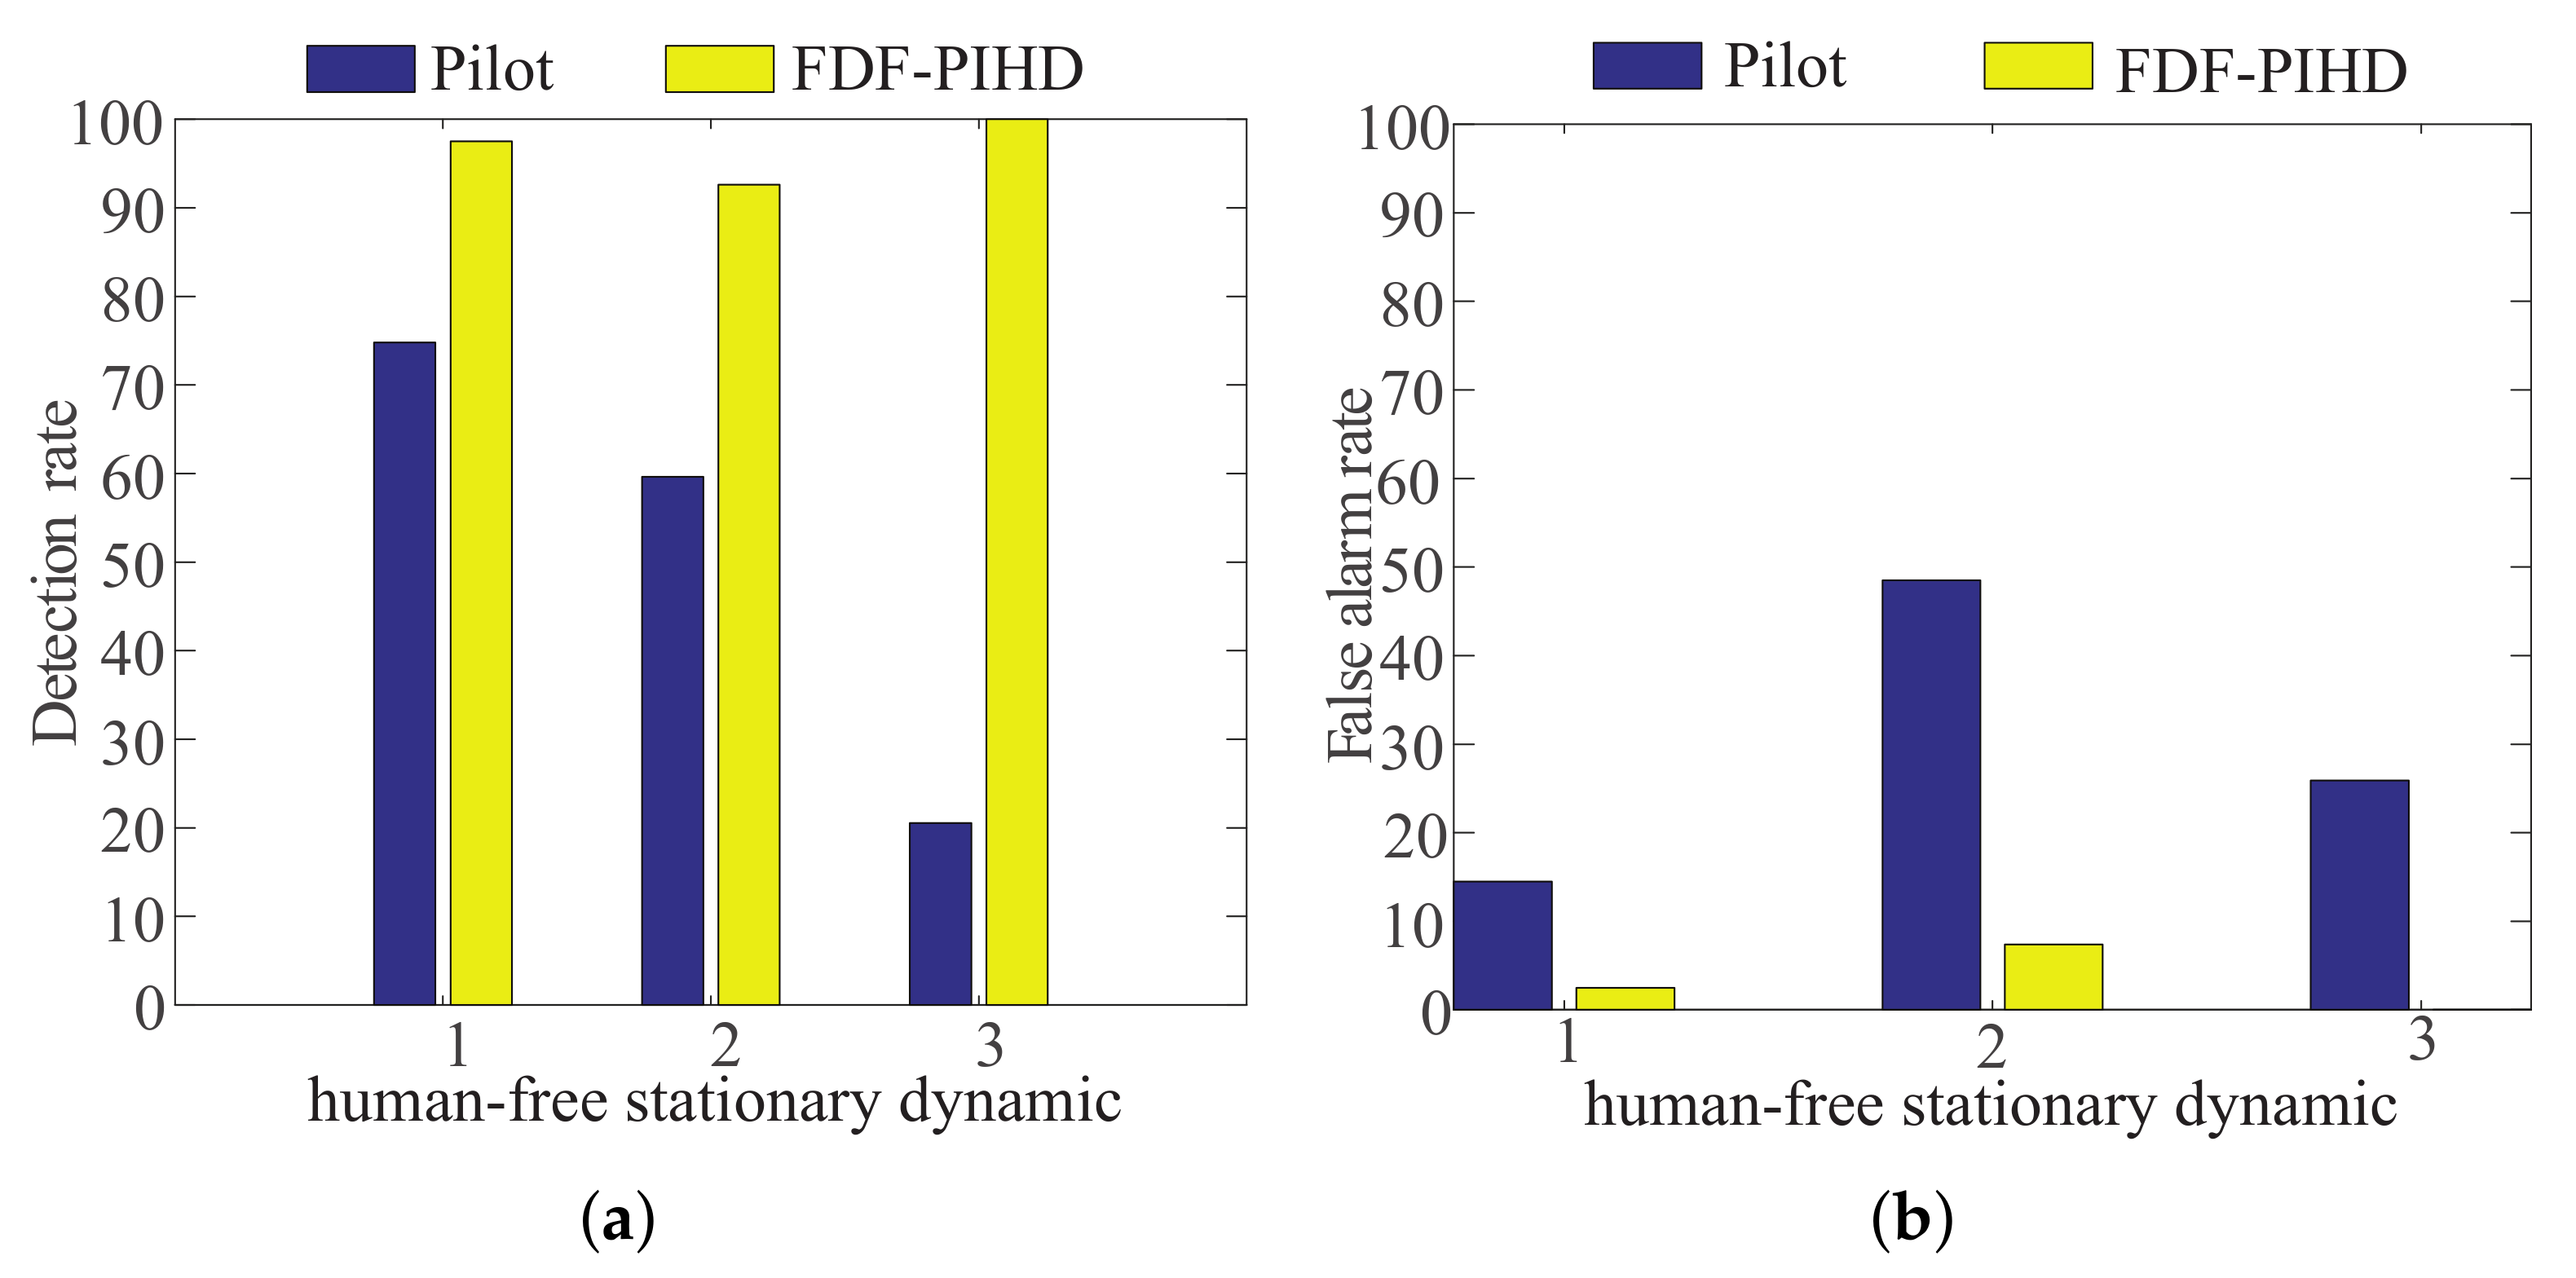
Figure 9.
Detection rate of different data packets.
© 2018 by the authors. Licensee MDPI, Basel, Switzerland. This article is an open access article distributed under the terms and conditions of the Creative Commons Attribution (CC BY) license (http://creativecommons.org/licenses/by/4.0/).
Share and Cite
MDPI and ACS Style
Han, C.; Tan, Q.; Sun, L.; Zhu, H.; Guo, J. CSI Frequency Domain Fingerprint-Based Passive Indoor Human Detection. Information 2018, 9, 95. https://doi.org/10.3390/info9040095
AMA Style
Han C, Tan Q, Sun L, Zhu H, Guo J. CSI Frequency Domain Fingerprint-Based Passive Indoor Human Detection. Information. 2018; 9(4):95. https://doi.org/10.3390/info9040095
Chicago/Turabian StyleHan, Chong, Qingqing Tan, Lijuan Sun, Hai Zhu, and Jian Guo. 2018. "CSI Frequency Domain Fingerprint-Based Passive Indoor Human Detection" Information 9, no. 4: 95. https://doi.org/10.3390/info9040095
Note that from the first issue of 2016, this journal uses article numbers instead of page numbers. See further details here.