1. Introduction
At the lowest level of factory automation systems, the communication infrastructure typically supports fast cyclic exchange of small payload data packets between sensors/actuators and controllers [
1]. A controller cyclically polls its attached nodes under tight timing requirements, which, in turn, imply that packet delivery is subject to strict determinism where jitter has to be kept as low as possible and, in any case, below a specified threshold [
2]. Time guarantees may also have to be provided for aperiodic traffic, since event notification messages (the most common type of aperiodic traffic in industrial applications) require real-time operations with quite tight delivery deadlines.
The demanding requirements of this communication environment, briefly summarized in
Table 1, have been largely addressed by wired networks such as field-busses (e.g., Profibus DP [
3], CANopen [
4] and DeviceNet [
5] to mention some) and Real-Time Ethernet (RTE), which is an effective family of communication systems for factory automation developed in the last decade [
6,
7,
8,
9].
Moving to the wireless domain, although dedicated industry standard solutions are currently available for process automation scenarios, such as WirelessHART and ISA 100.11a [
10,
11,
12], so far stand-alone wireless networks have not been widely considered at the field level in factory automation applications. Wireless links can nevertheless be found wherever network nodes can be used to effectively solve mobility or cabling-related issues in factory automation and process control systems. In this context, the IEEE 802.11 wireless LAN family of standards provides an effective answer to the conflicting needs of cabling simplification, coexistence, real-time behavior and reliability [
13,
14,
15], since it is able to provide performance theoretically comparable to those of RTE networks up to factory automation contexts.
As a matter of fact, a common employment of the IEEE 802.11 WLAN is the development of hybrid solutions that include wireless extensions of wired networks [
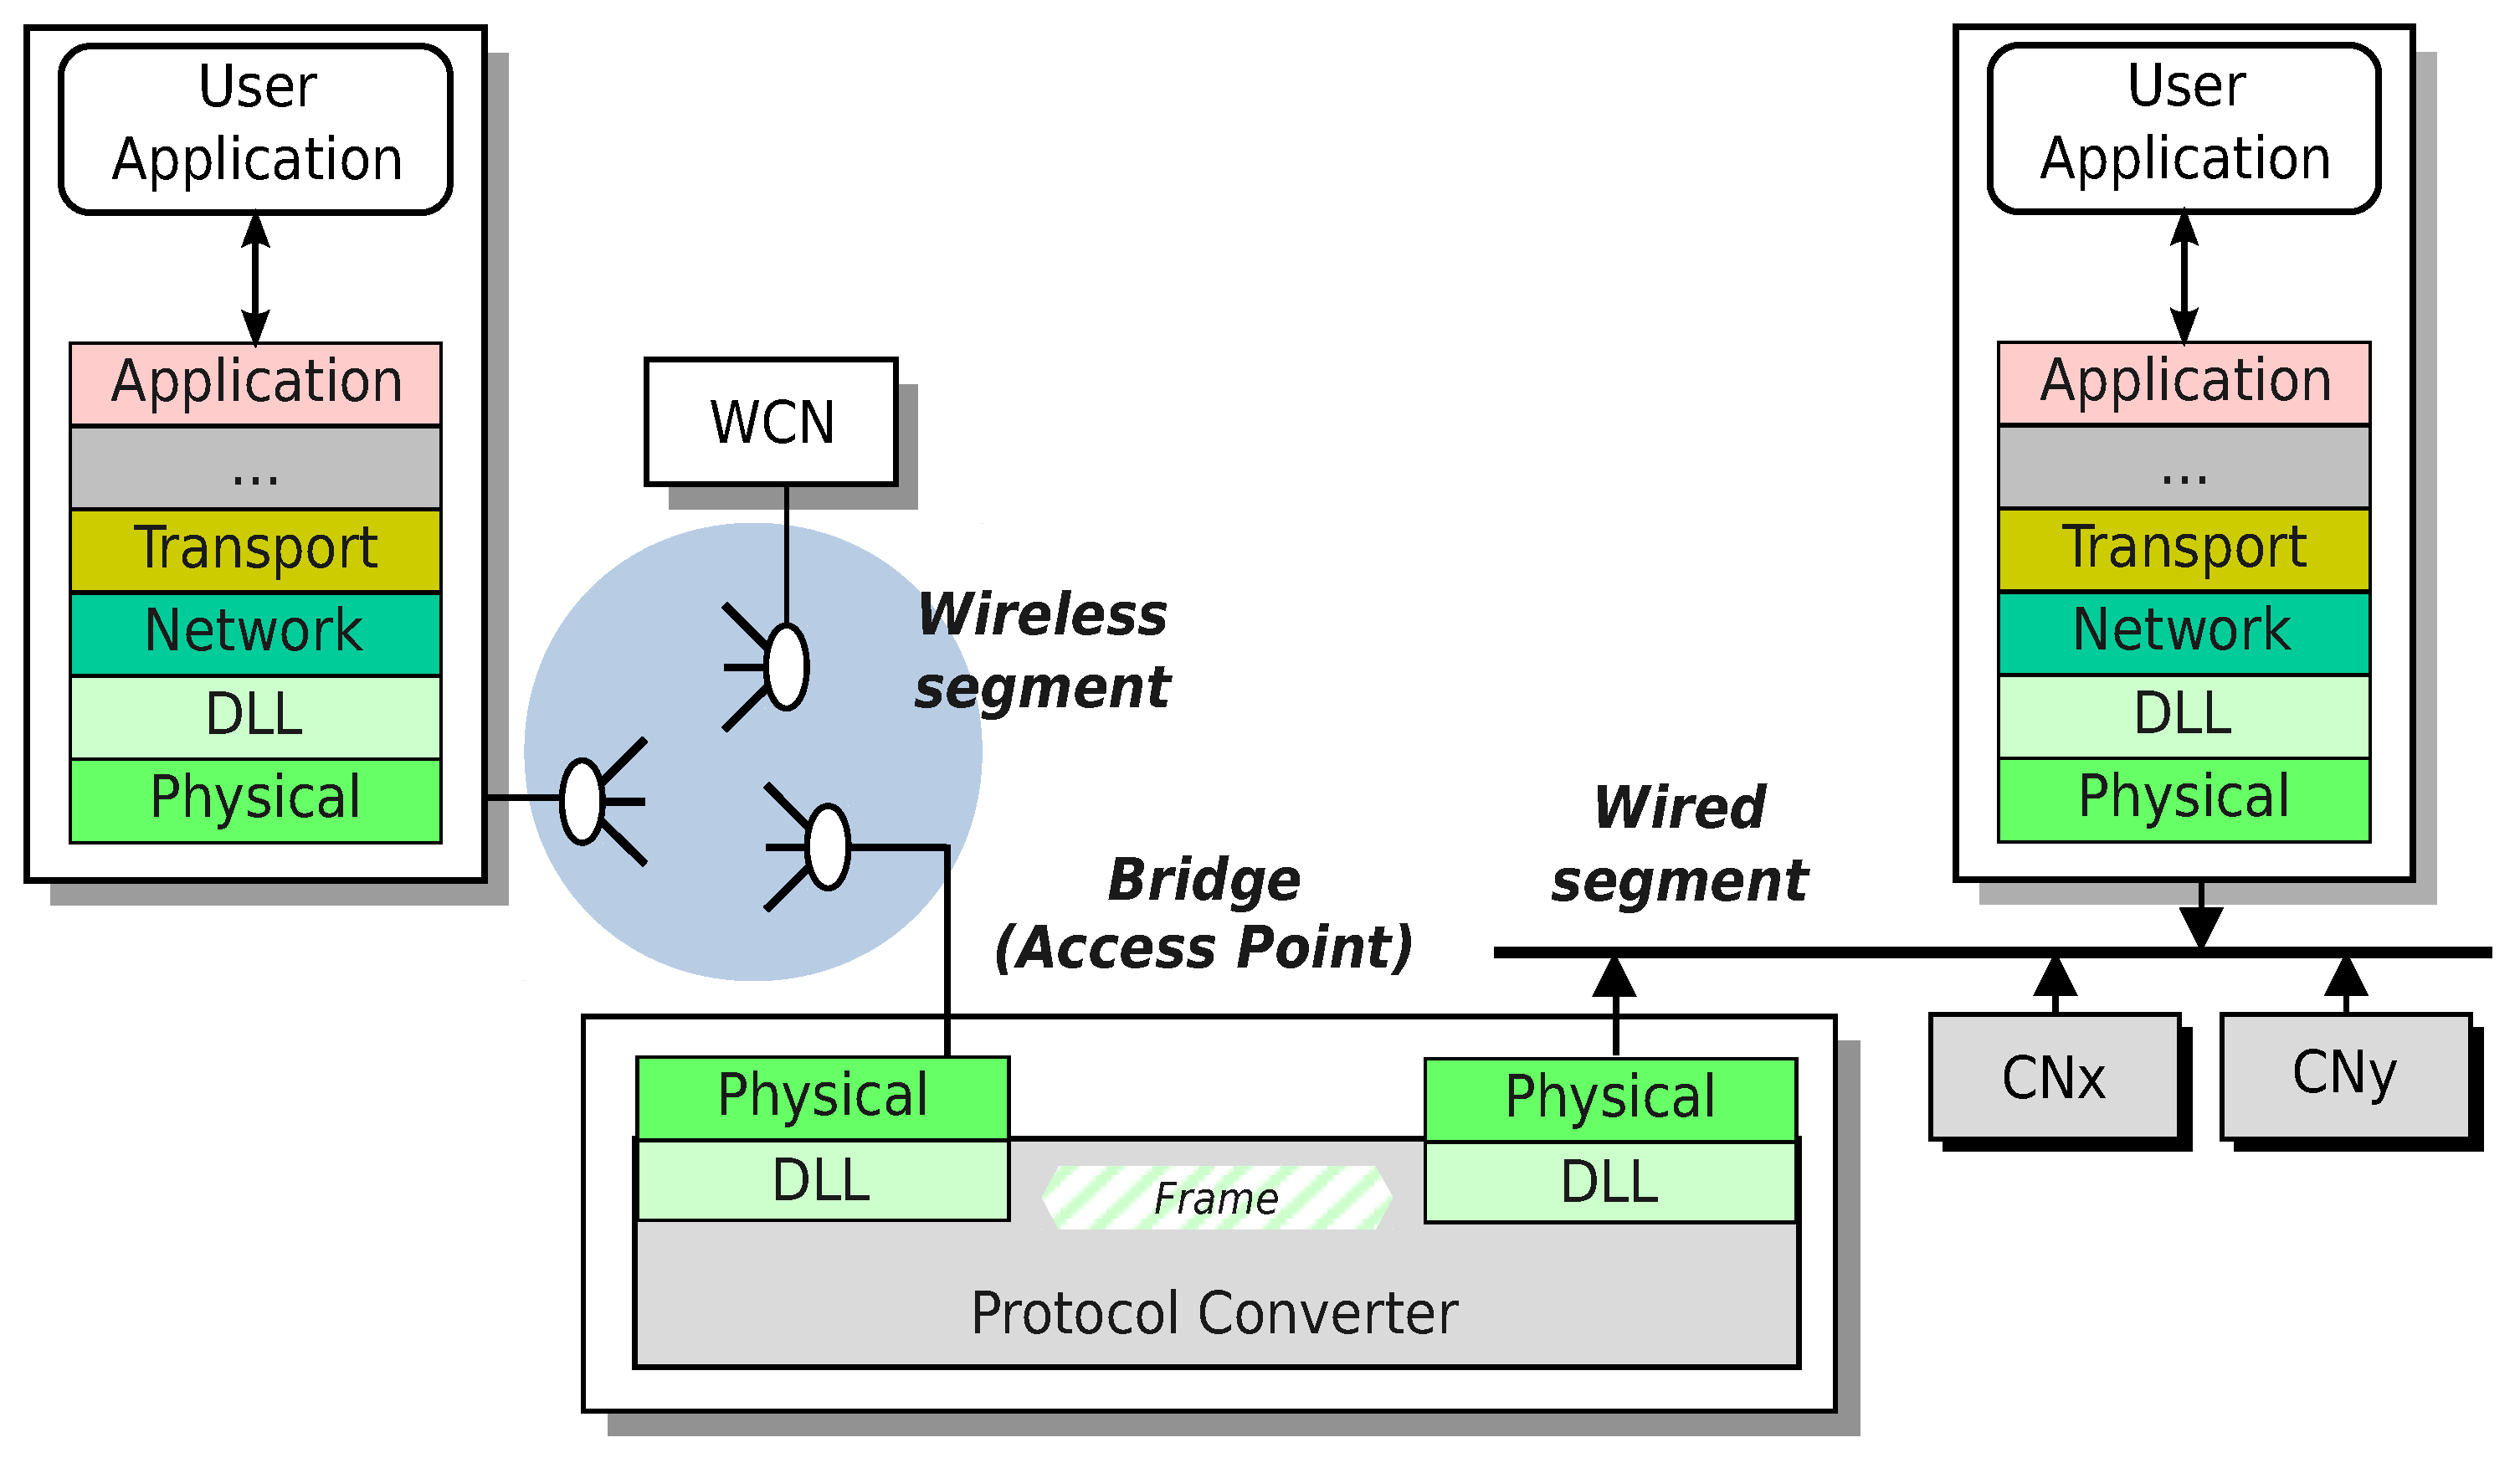
16]. A hybrid wired/wireless network is obtained by the interconnection of two different communication subsystems by means of an
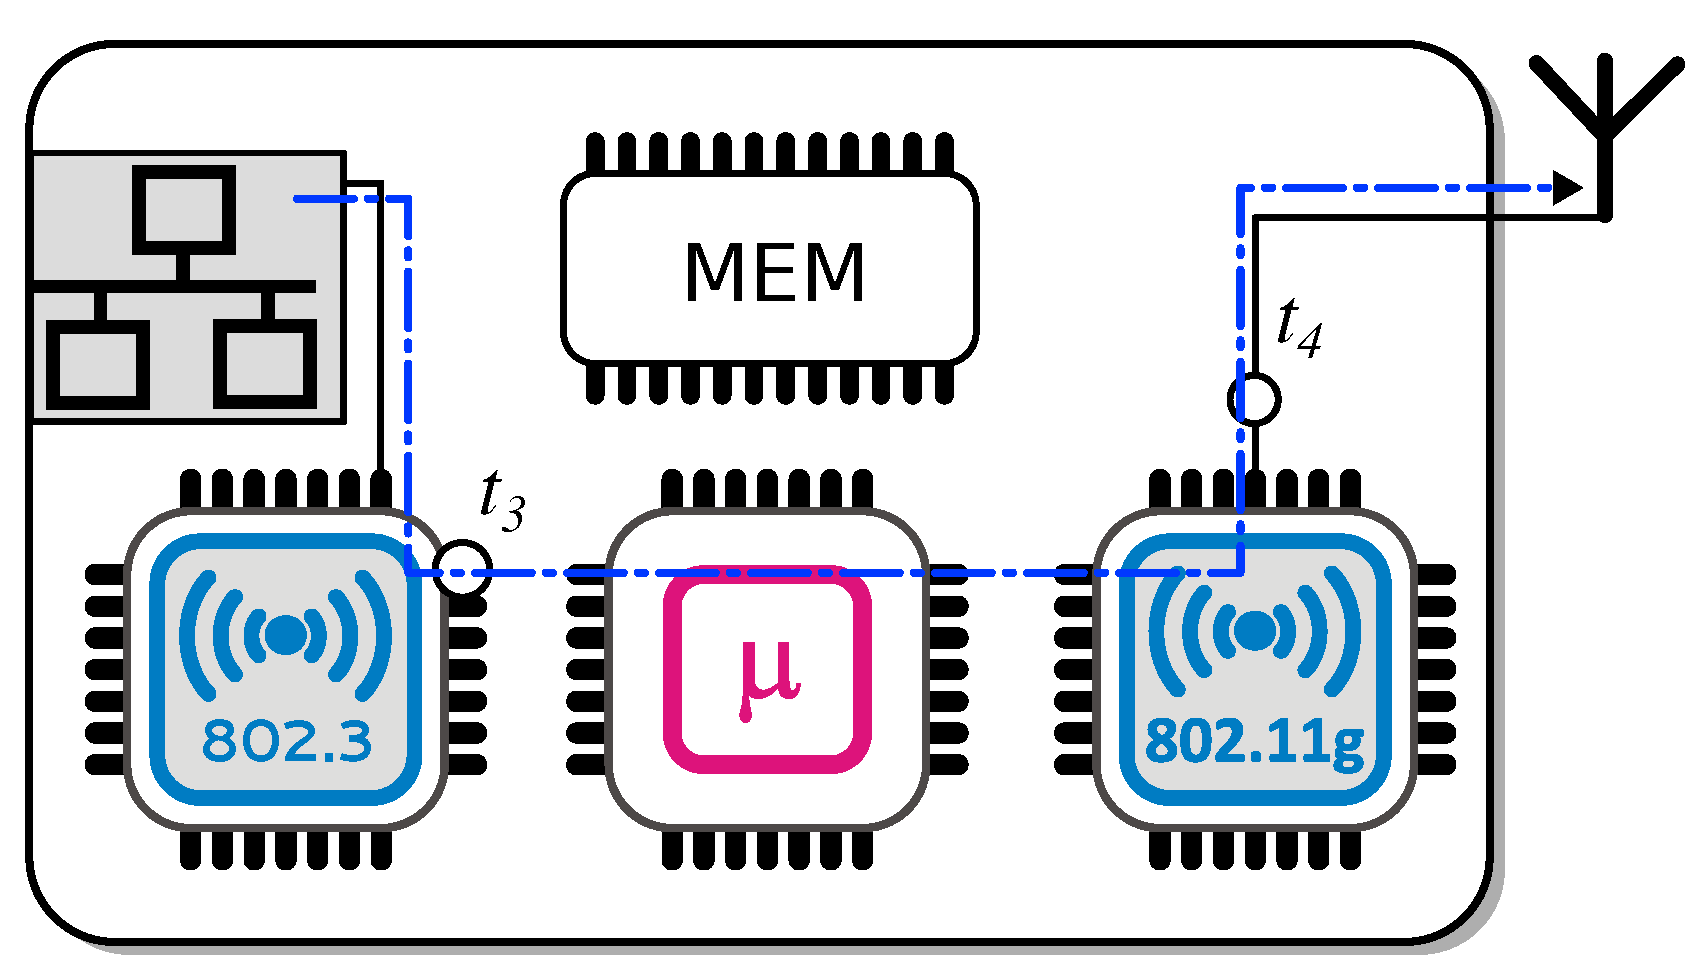
Intermediate System (IS), which is inserted at a specific layer of the ISO/OSI stack. In an IEEE 802.11-based wireless extension of a wired RTE link, interconnection takes place at the Data Link-Layer (DLL), just above the physical layer, by means of an
Access Point (AP) acting as a bridge between the two sides (
Figure 1). This provides connectivity in a so-called “infrastructured” network. In the real-time industrial scenario, such hybrid solutions are often deployed to solve reachability issues and to serve a distant or separate production cell in a factory automation system. In this perspective, we may find on the wired segment a set of Controlled Nodes (CN) connected on an RTE segment, and then bridged through the AP with the Wireless Controlled Nodes (WCN) on the wireless segment. For this reason, the wireless segment is interested by traffic profiles mostly relevant to automation purposes, hence with real-time and determinism requirements.
In view of the stringent requirements about factory automation networks, it is worth highlighting that the adoption of IEEE 802.11-based solutions might introduce several sources of delay, which, in turn, may significantly impact the timeliness of the network and consequently the performance of the whole factory automation system, as already addressed in [
17]. We need to mainly recognize two different sources of delay, that is, those strictly relevant to the IEEE 802.11 protocol behavior (i.e., channel access functions, random backoffs, etc.) and those due to the adopted network devices. As far as the first is concerned, unfortunately the Medium Access Control (MAC) layer of the WLAN standard is based on a random channel access strategy not specifically designed to serve deterministic real-time scenarios, as will be further discussed next in the paper. This strategy makes the overall delivery time of a frame a function of the channel condition and, in practice, of the number of retransmissions and the corresponding transmission rates needed to obtain a successful reception. Modeling this behavior in a closed form is theoretically though [
18], and in any case results in a stochastic behavior. Often, in a real-time perspective, it results in being very effective to provide an upper bound of the frame delivery time as a function of the transmission attempt [
19].
Conversely, looking at the latencies relevant to the adopted network devices, in the discussed configurations, the complexity of the bridging operation represented in
Figure 1 highlights the fact that particular care has to be paid to the possibly non-negligible random delays that the AP may introduce while forwarding data from the wired part of the network to the wireless segment and vice versa. Being a potentially critical device, the performance figures of an AP should be known and well understood in advance. Unfortunately, AP specifications are seldom documented with the necessary degree of detail and, particularly, frame forwarding delays and queue management are usually not provided, even for devices specifically conceived for industrial applications [
20,
21].
From the perspective of real-time factory communication systems, when an AP is deployed to extend a wired RTE segment, such a device is required to provide suitable time guarantees, since AP-related latencies together with the aforementioned protocol latencies may actually constitute a lower bound to the task completion time, eventually limiting the performance of the network itself. Therefore, the characterization of an AP represents a crucial task that has to be pursued via appropriate models and measurements.
The goal of this paper is to address the issue, providing a general, effective and simple-to-use measurement method for characterizing AP forwarding latency, namely
. To this aim, the paper presents a calibrated test-set enabling the measurement and discusses the necessary calibration steps, by taking inspiration and origin from the research reported in [
22]. In particular, a dedicated hybrid wired/wireless loop-back link is employed where the device under test (DUT) is being placed within the loop. The test-set is first calibrated by means of a characterized reference AP, so that the contributions to total transmission delay that are known to be unrelated to the DUT can be compensated for. Finally, the collected DUT data are post-processed by a deconvolution algorithm to provide the required corrected information. To prove the effectiveness of the proposed method, we present a set of experimental results aiming to show that measurements can accurately characterize AP devices, and could also help verify and validate analytic models.
The final aim of this work is hence to define a general, simple and inexpensive measurement procedure, rather than discuss actual latencies verified in our experiments. In this light, the proposed approach, which has been described in the context of factory automation systems, is demonstrated to be not constrained to a specific field of application and can thus be adopted in several different scenarios.
2. Measurement Test-Set
Since one of the aims of an industrial network is the timely delivery of packets, in a hybrid network there should ideally be no difference, in this respect, between the wired and the wireless segment. Knowledge of the degree of determinism provided for this basic service is a key aspect for the effective implementation of a wireless extension to a RTE network. Unfortunately, AP designers do not usually have such system requirements in mind targeting different applications.
Indeed, an AP is typically realized as an embedded system, running a lightweight operating system (OS) that manages the supported protocol stacks, implements bridging and schedules the execution of traffic and queue management algorithms. The architecture is conceived with general purpose communication, Internet browsing, file sharing, etc. as target applications, so that delays an AP may introduce are not guaranteed nor specified, even for devices declared to be specifically designed for industrial usage [
23]. Clearly, this does not represent an issue in general purpose, home or office communications, where the aforementioned delays are much lower with respect to other delay sources and are anyway well managed by more complex protocol mechanisms. Nevertheless, the diverse scenarios provided by the case of industrial communication systems for factory automation share different requirements, where delay sources should be limited to the minimum—in fact, looking at the problem from a real-time system perspective, what is needed is to have network components whose delays are accurately known and characterized, in order to take them into account in the planning of network cycle, or at a scheduling phase.
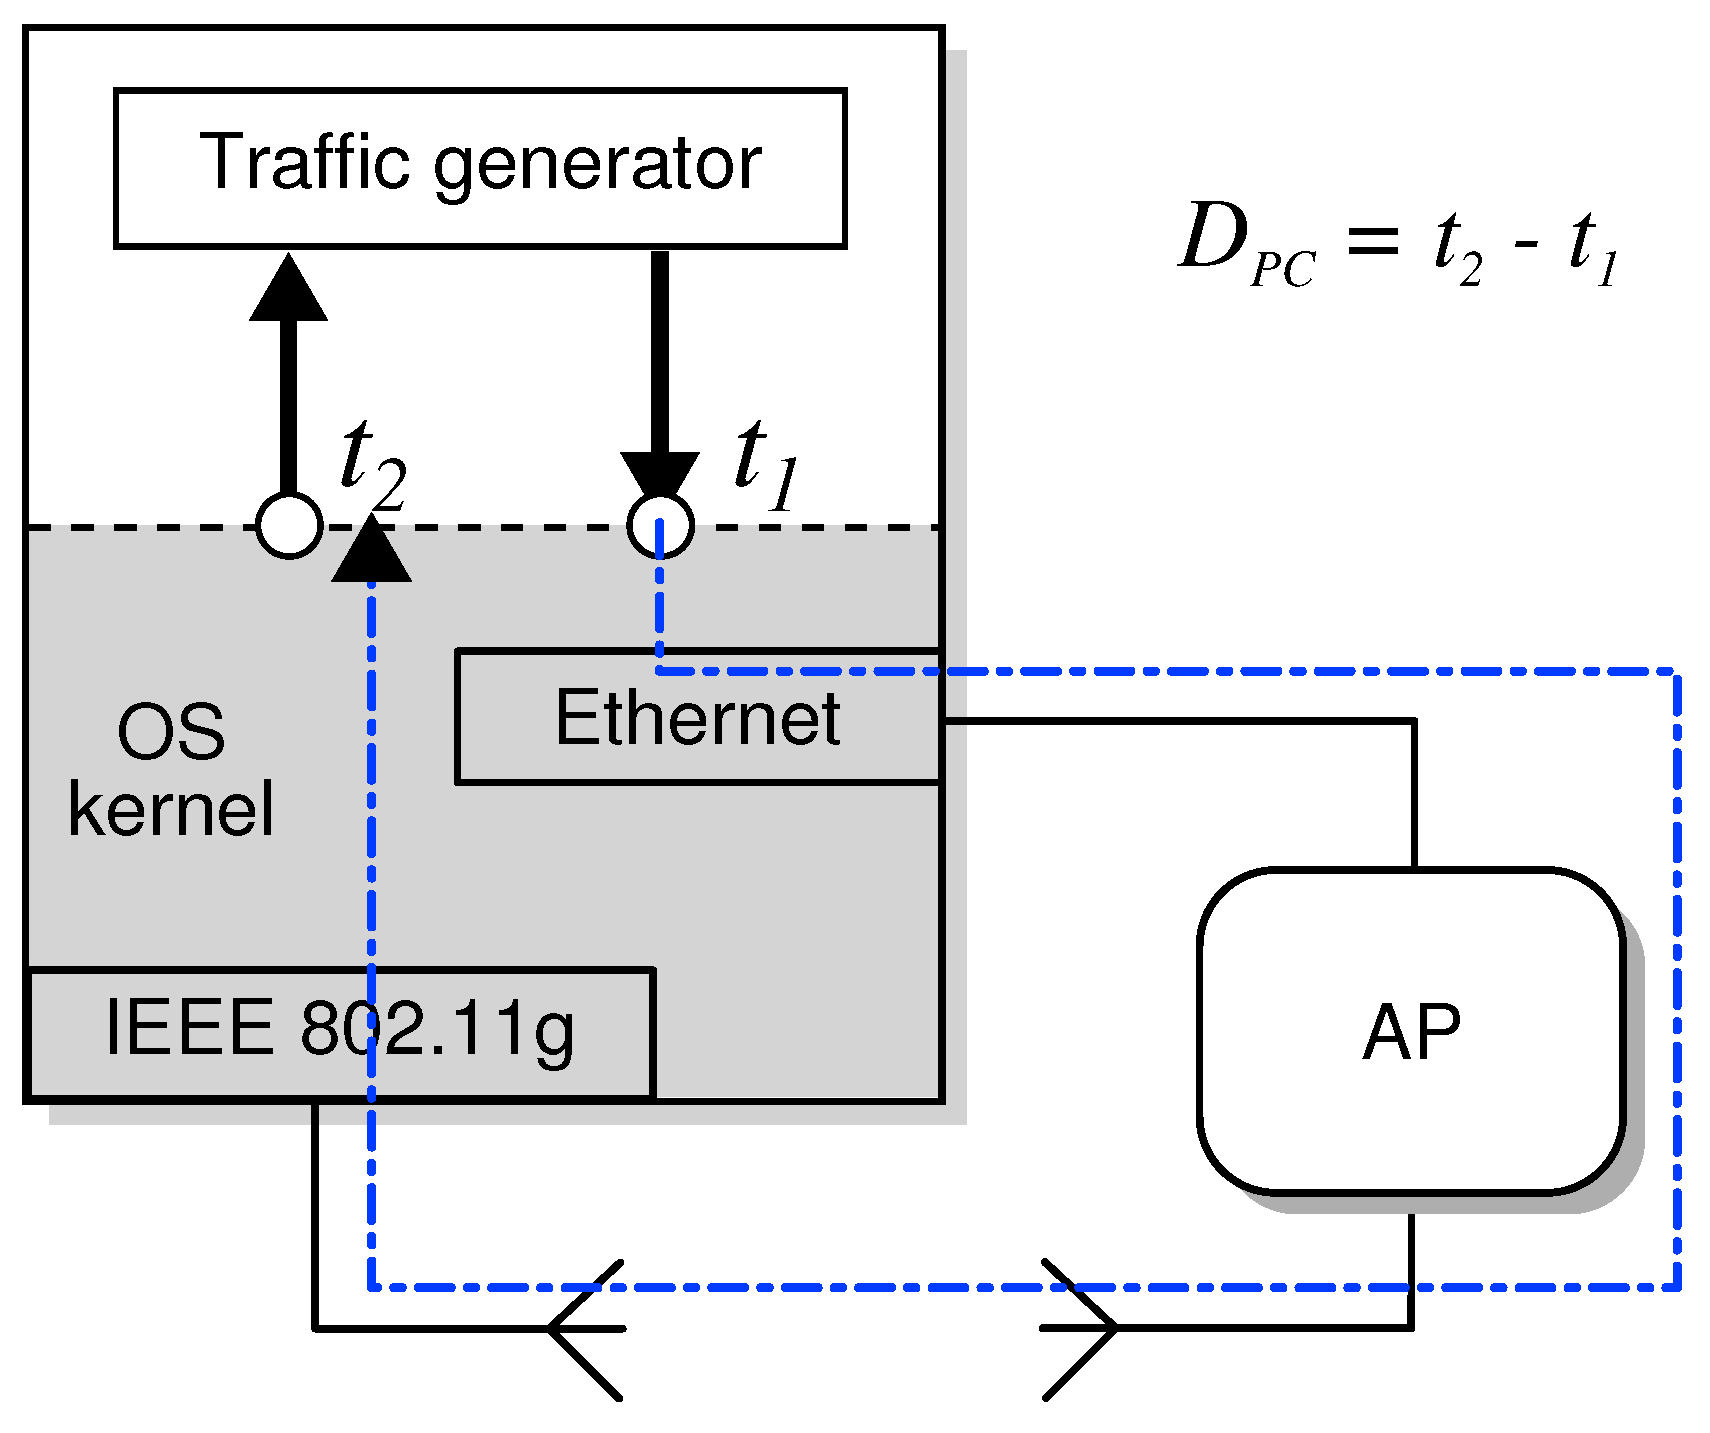
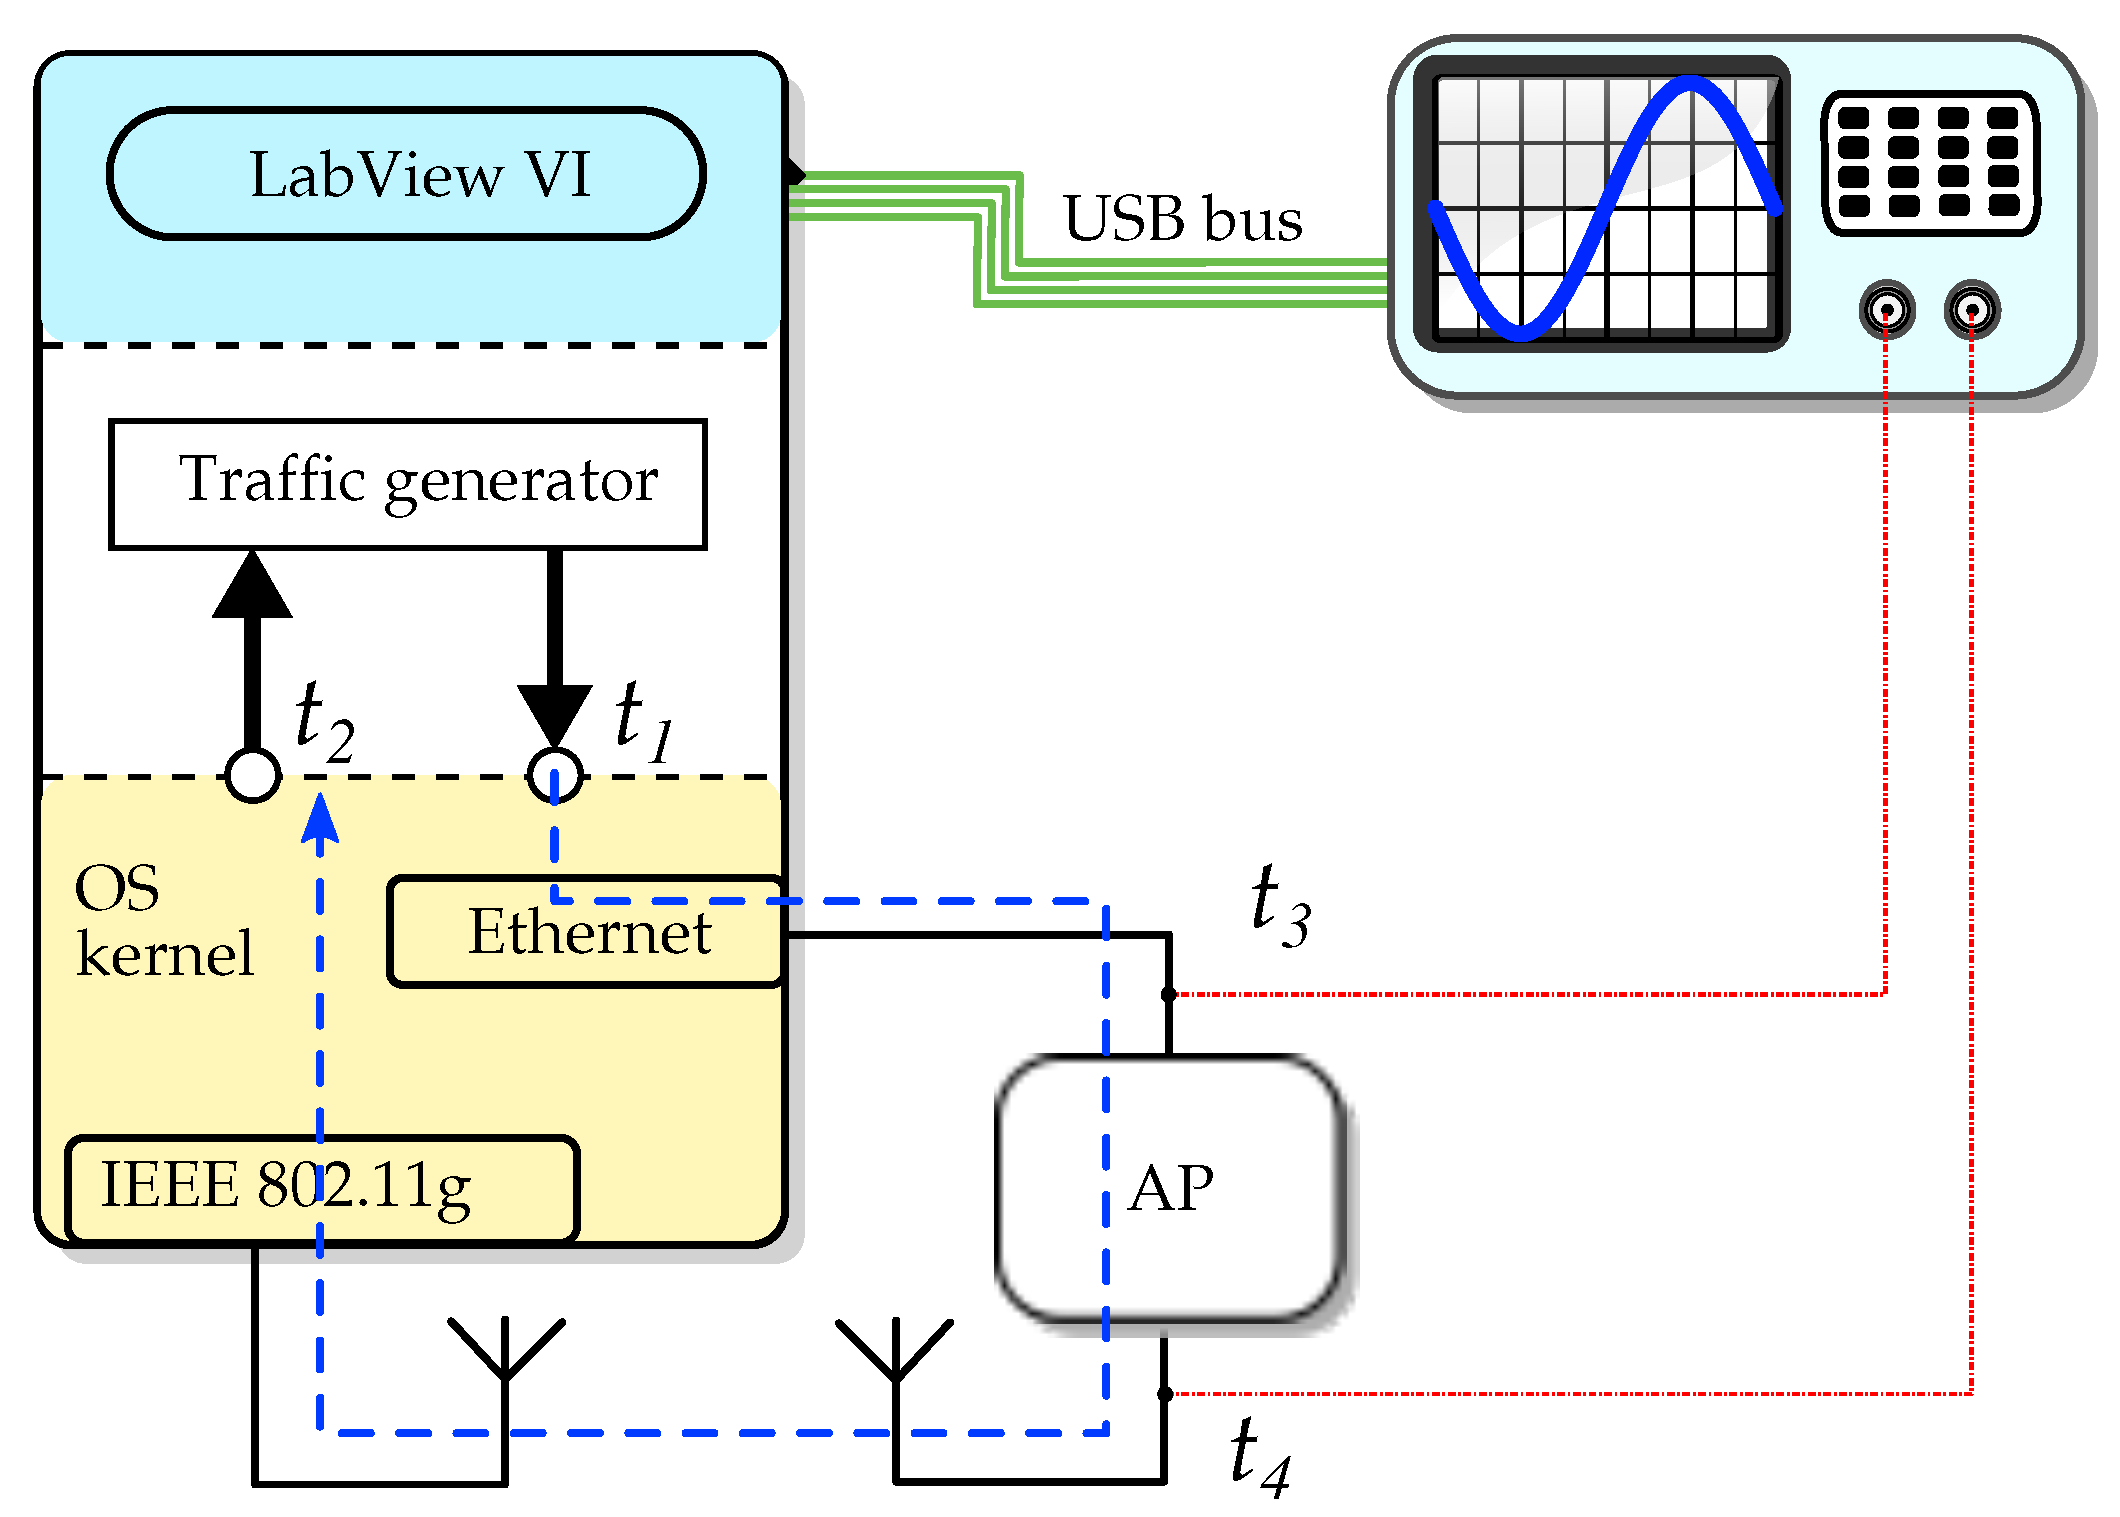
This shortcoming provided the motivation for development of the test-set presented in this paper. The loop-back scheme shown in
Figure 2 is the simplest AP measurement test-set that can reproduce the hybrid network effects of a factory automation system. It can be implemented through the use of a general purpose personal computer (PC) equipped with two communication interfaces, namely an Ethernet card and a wireless LAN adapter.
The device under test is connected to the two interfaces, being stimulated by the traffic patterns generated by the PC and forwarding packets within the communication loop. Packet timestamps taken by the hardware Time Stamp Counter (TSC) of the PC microprocessor allow the characterization of AP time specifications.
In principle, a simple measurement of the one-way delay experienced by a packet through the hybrid link, e.g., outgoing from the controller (Ethernet interface) to its attached wireless slave (IEEE 802.11 interface), is obtained by comparing the send and receive timestamps taken at the respective interfaces. With the aim of reducing measurement uncertainty, a significant option is to perform hardware timestamping. To accomplish this goal, we rely on the TSC, which has been long recognised as a reliable timing source. Moreover, since all generated timestamps are then employed within the same PC, the use of TSC is possibly the simplest solution and, in our opinion, a very practical way to measure latencies with adequate time resolution. As a further consideration, it is worth observing that the adoption of more structured solutions, such as the IEEE 1588 standard, even though they may provide intrinsic traceability to a calibrated time source, appears to be rather overkill for the purpose of designing a simple test set, given also the intrinsic synchronization of the proposed measurement setup. Providing accurate hardware timestamping is still by no means trivial and a more detailed discussion of its implementation by TSC in this work is necessary.
2.1. Timestamping
Packet timestamping is a well-known problem in network measurement, where an acceptable tradeoff between accuracy and implementation complexity has to be defined. In fact, the time when a packet physically leaves a network interface can be determined precisely, but this typically requires dedicated measurement hardware. On the other hand, monitoring a communication interface at a higher-level protocol layer is often easier, but timestamp uncertainty may be larger, since timing jitter with respect to a low-level hardware timestamp tends to be introduced as the packet progresses through the lower protocol layers.
Measuring network interface boards providing hardware timestamping have been developed for a number of research and commercial projects, such as the well-known Endace DAG Cards (Data Acquisition and Generation packet capture cards [
24]). In general, these boards provide high-resolution counters and a stable internal clock, which can be synchronized to an external reference such as a GPS signal for distributed network measurements or for synchronization purposes.
For the application considered in this work, the level of cost and complexity associated with such hardware appears to be unjustified. However, as the test-set is aimed at the characterization of a single device, hardware timestamps can be obtained from a common time reference within the PC that manages the test. This results in a simpler measurement set-up, where any possible synchronization issue between the clocks of different hardware measuring interfaces is avoided. Measurements can prove equally reliable, provided suitable calibration steps are introduced so that measurement uncertainty can be mostly attributed to residual short-term clock instabilities.
It is worth observing that different possible time reference sources actually exist within a computing system and have been used for time related functions in operating systems, such as Real-Time Clocks (RTCs) or, more recently, the High Precision Event Timer (HPET). These are basically provided by an uncompensated quartz crystal oscillator, typically providing a frequency of about 14.318 MHz, and, while they may result in being adequate for interrupt generation and for triggering scheduling events, they are far from acceptable in code profiling and in time measurement applications, on account of both the comparatively poor resolution they provide and their intrinsic instability.
Conversely, in this paper, our choice has been to adopt a superior high-resolution and low-overhead source for gathering CPU time measurements, that is, the internal microprocessor TSC found in nearly all CPUs of the x86 family [
25] that are commonly adopted in PCs and notebooks. This register counts CPU clock cycles, that is it gets incremented internally by the CPU at every single clock cycle from the last CPU power up or reset. A significant observation is that it provides a deterministic way of measuring the flow of processors’ operations, rather than time, which can be theoretically obtained considering the measured CPU frequency. By “deterministic” we mean that TSC values are incremented deterministically and that there is no (easy) way to interfere with the counting process: clearly, reading the TSC value may instead be subjected to non-deterministic latencies.
The specific microprocessor instruction to read the TSC microprocessor register is RDTSC, which returns the 64-bit value stored in the TSC counter as two 32-bit values within the two CPU registers EDX:EAX (general registers of the x86 processor family). A basic snippet of code that allows reading the TSC value within a program written in C language is given in Listing 1. Intuitively, the overhead that is incurred in reading the TSC is basically due to the execution time of this instruction and to the need for transferring the content of these two registers in the main process stack memory.
![Information 09 00122 i001]() |
| Listing 1: C–language snippet to read the Time Stamp Counter register |
It must be emphasized that the introduction of several features to increase modern processors performance, such as power saving, frequency scaling, out-of-order and speculative execution, requires great care in the adoption of the TSC for direct time measurement. Nonetheless, if used cleverly, for current architectures the TSC can provide very high-resolution timestamps (resolutions around 10 ns), and, for this reason, it has already been considered in network monitoring projects (e.g., [
26,
27,
28]).
A trivial feature that affects the accuracy of time stamps taken through the TSC is the frequency scaling, which characterizes almost all modern CPUs, to allow for better power consumption and thermal dissipation. This feature may cause an inaccurate interpretation of the value read from the TSC, which indeed accounted for CPU cycles, and not directly time. The relationship with current time is through the CPU’s actual frequency , that is, . Additionally, we should consider that modern architectures are typically multi-core. Each CPU core has its own TSC register and one should take into account that there are no guarantees in general that all TSC registers in the system are kept synchronized, nor that their tick rate is equal throughout time.
In our work, we avoided these issues by disabling both power saving features and frequency scaling at the operating system level, imposing for all the CPU cores in our system to work at the nominal maximum frequency. Moreover, we programmed our traffic generator so that the corresponding process would be executed always on the same CPU core, by specifying a suitable CPU affinity mask to the system scheduler.
A further issue is due to the out-of-order execution feature typically found in modern processors, where instructions are not necessarily performed in the same order they are written in the code. Hence, the RDTSC instruction can be shifted before or after its intended location, further decreasing the accuracy of its value. To avoid such an effect, the most effective action is to insert a “serializing” instruction just before the RDTSC one, i.e., an instruction that forces all the other operations to finish before its execution. A typical example of such an operation is the CPUID instruction.
All the aforementioned precautions have been introduced within the traffic generator software purposely designed for this work, with the aim of reducing as much as possible the uncertainty associated with the timestamping procedure. According to the literature [
29], it is indeed possible to state that the short-term stability of a carefully programmed TSC, which is the main concern for the purposes of this work, can be considered good enough and satisfactory for the intended goals. In addition, given that all timestamps are generated and employed within the same PC, hence sharing the same time source, the use of TSC is possibly the simplest solution and, in our opinion, a very practical way to measure latencies with adequate time resolution, without resorting to complex synchronization systems such as IEEE 1588.
As a final note, we highlight that the timestamping procedure discussed here is methodologically general, and as such it may be adopted even if a different processor architecture is chosen. For instance, the ARM processor architecture does not provide a TSC register, but uses instead a Performance Monitor Unit (PMU) to a similar extent.
2.2. System and Traffic Model
In factory automation, several traffic profiles are multiplexed on the same network, which can be mainly categorized into real-time isochronous (i.e., periodic) exchange of small frames, real-time asynchronous frames (i.e., alarms, set points, etc.) and classic general purpose traffic not subjected to real-time constraints. In this framework, the different profiles are also characterized by different average length of the involved frames. As an example, the use of longer packets (several hundreds to thousands of bytes) is typically relevant to background non real-time traffic, such as Internet traffic, management, etc., for which the AP forwarding latency is typically not an issue, as may be also inferred by the fact that in several RTE protocols this traffic class is possibly delayed or queued to prioritize real-time traffic [
30,
31,
32,
33].
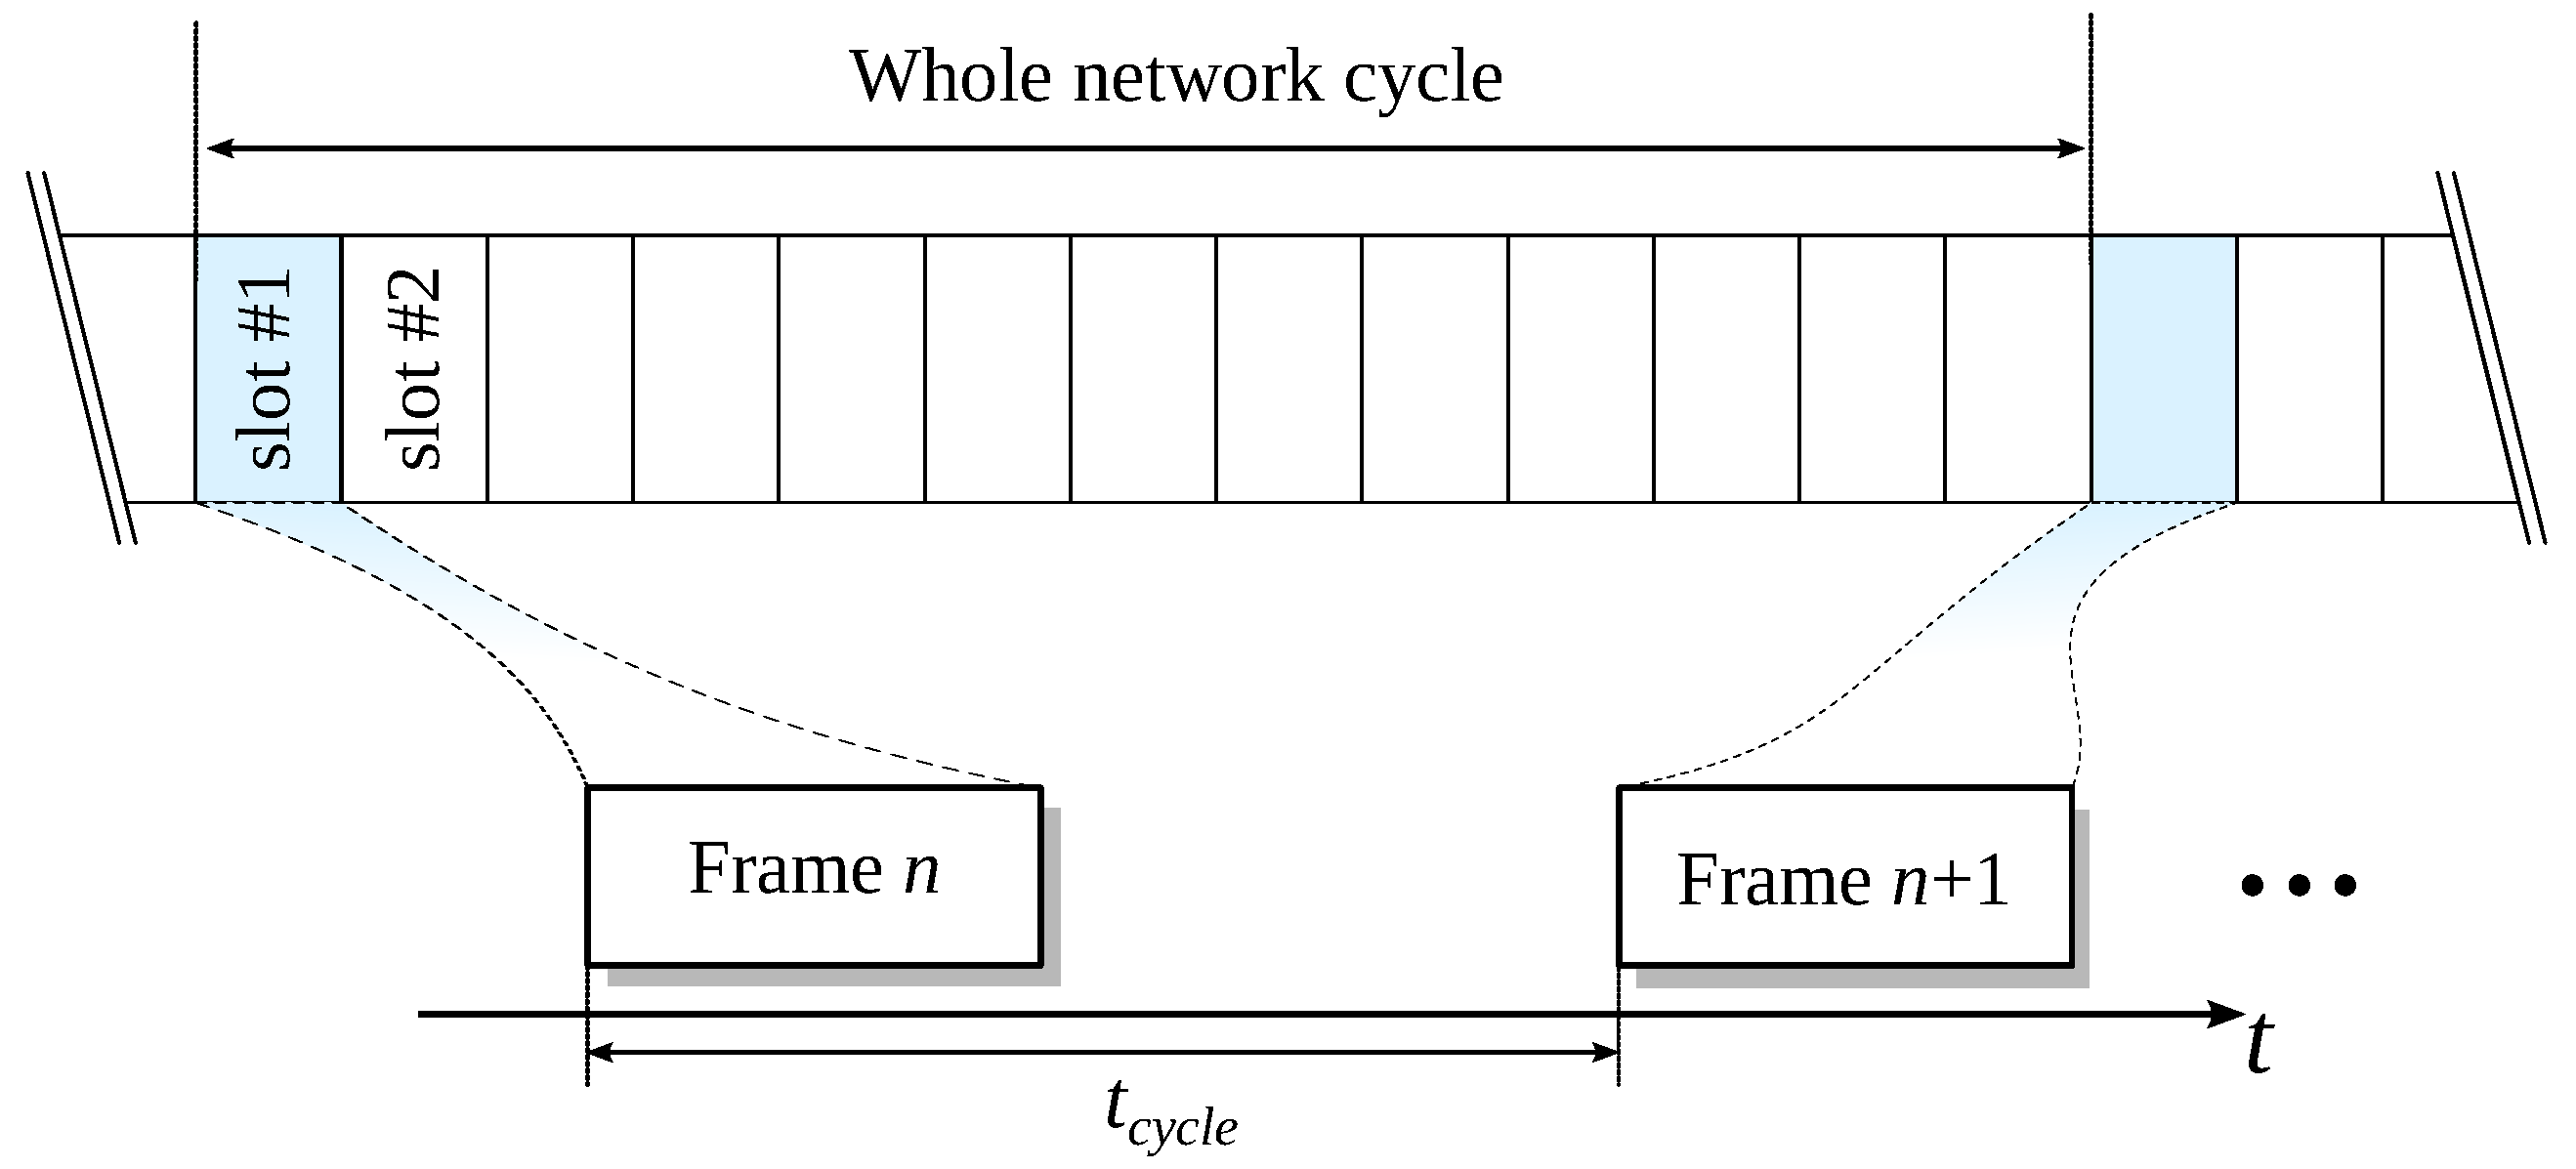
The most important pattern of traffic within a typical automation network is relevant to the transfer of sensor/actuator readings within a periodic cycle, under timeliness constraints and typically based on a simple Time Division Multiple Access (TDMA) scheme (
Figure 3). New packets, typically of small sizes, are sent within cycle slots, and hence the inter-departure times may be either fixed (the most common situation) or variable on a rather discrete basis.
For the sake of this work, the system is designed taking into account this most critical type of traffic, i.e., small, cyclic data transmission, hence subjected to real-time and deterministic constraints. In this traffic model, a new packet is sent on a regular basis every seconds. In addition, the inter-departure time between two consecutive packets can be easily varied dynamically in order to emulate different design solutions of a factory automation system.
To implement such a traffic profile, a suitable traffic generator software has been designed, running within the PC at the application level (refer to
Figure 2). Specifically, it delivers a packet to the specified communication interface (typically the Ethernet port) and waits for the same packet arriving back from the other interface. This software allows the tuning of different communication parameters, such as the length of packets, the inter-departure time, etc.
This has been purposely developed with the goal of reducing the impact of latencies due to OS interrupts, by adopting low-level system calls towards the OS Linux kernel and the processor registers. In addition, carefully programmed “raw” sockets have been used, in order to avoid any protocol overhead both at the networking and the processing levels. Relying on low-level calls helps reducing packet time stamping uncertainty, since the sequence of computations and call is accurately designed and optimized for just the required operations, hence minimizing the intervention of “generic” libraries and foreign uncontrolled pieces of code.
Timestamps are taken by the traffic generator itself, following the guidelines provided in
Section 2.1, at the interfaces with the relevant protocol layers. With reference to
Figure 2, a packet is delivered by the packet generator to the kernel at the timestamped instant
. The time stamp
indicates the instant when the process receives the same packet back through the loop. Adopting the precautions about TSC readings discussed above, and taking into account the microprocessor frequency, this allows to obtain the delay measured at the OS level as the difference
. In the rest of the paper, we will refer to this delay as
, where the prime sign indicates this is the whole delay measured by the traffic generator, and includes both deterministic and random terms, as will be detailed afterwards. It is worth observing, however, that this procedure measures a number of different contributions included in
, within which the delay
introduced by the AP is somehow hidden.
The differences between the above two quantities are now discussed, with an extended view on removing them by means of test-set calibration.
2.3. Considerations about the Wireless Link
The research literature does not converge on a common setup for the use of IEEE 802.11 in factory automation systems, as well as a standard “industrial” implementation is absent. The main reason is the need to find a shared alternative to the Distributed Channel Function (DCF) channel access function, which in turn represents the most significant source of randomness affecting the frame delivery time [
23,
34], and that, if possible, should be avoided in real-time communication setups.
However, the alternatives provided by the same IEEE 802.11 specifications (i.e., Point Coordination Function (PCF) and IEEE 802.11e extensions) that could be profitably exploited in the intended scenarios are seldom (or almost never) implemented in real components, even though their theoretical performance figures would solve several issues in these applications. Particularly, with reference to the IEEE 802.11e amendment, it introduced the new Hybrid Coordination Function (HCF) function, enabling two more channel access functions, namely Enhanced Distributed Channel Access (EDCA) and HCF Controlled channel access (HCCA). The latter, as already said, is almost never implemented in real APs. Conversely, EDCA provides support for different traffic classes through the use of increasing Arbitration inter-frame spacing (AIFS) for decreasing priority traffic classes, and the introduction of Transmit Opportunity (TXOP), to provide a time-limited contention free channel access to stations. From a commercial point of view, this has been called WiFi multimedia (WMM), and almost any recent device is able to support at least a part of these functionalities.
There have also been efforts to design new MAC-layer protocols to support real-time operations in industrial WLAN communications, such as RT-WiFi [
32] and iWLAN [
35] by Siemens (Munich, Germany). The first one is a proposal for a protocol design based on the IEEE 802.11 PHY to enable “real” real-time communications, but at the moment there are no public implementations, despite its high effectiveness. The proprietary system proposed by Siemens in its APs for industrial traffic, namely iWLAN, is based on a variation of the standard PCF not publicly disclosed: scientific works analyzed its performance, but there is no effective way to theoretically model this function and hence to compare its performance with baseline 802.11 systems. In one of our tests, we included a Siemens AP supporting the iWLAN function in order to understand, at an initial stage, to what extent the component behavior differs from that of a simple low-cost commercial one.
In this paper, hence, all devices included in our tests support at least WMM. The adoption of such prioritization functions impacts on two different sides: the transmission time and, eventually, the AP delay. The former reflects in possibly different interframe spaces (IFS) to be accounted for in Equation (
1), even if these terms are deterministic, known and defined by the standard. The latter is more relevant to the use of possibly different queues within the AP: however, if we limit to industrial traffic, then it is a common choice to assign this data flow to a single high-priority traffic class.
A further consideration about the wireless link is also necessary. This paper focuses at first on the system calibration of the measurement process, as discussed in the next Section, for which it is essential to provide a high degree of effectiveness, repeatability and reproducibility. Hence, in this initial phase, we have to face an accurate characterization of the different delay terms (see Equation (
1) for reference). The presence of retransmissions in this phase, due for instance to collisions/interference, would introduce a further contribution due to backoff times and frame transmission times possibly at different rates (whose values may be unknown since very few APs declare what is the rate selection policy they implement). Actually, even assuming the number of involved retransmissions and the respective rates were known exactly, the distribution of backoff times would add a further random term that would make impracticable the characterization of the whole measurement chain. This explains why a controlled, reproducible and well-known configuration is emphasized in the calibration phase discussed below.
3. Test-Set Calibration
An illustrative sketch about the relationship between
and
is represented in
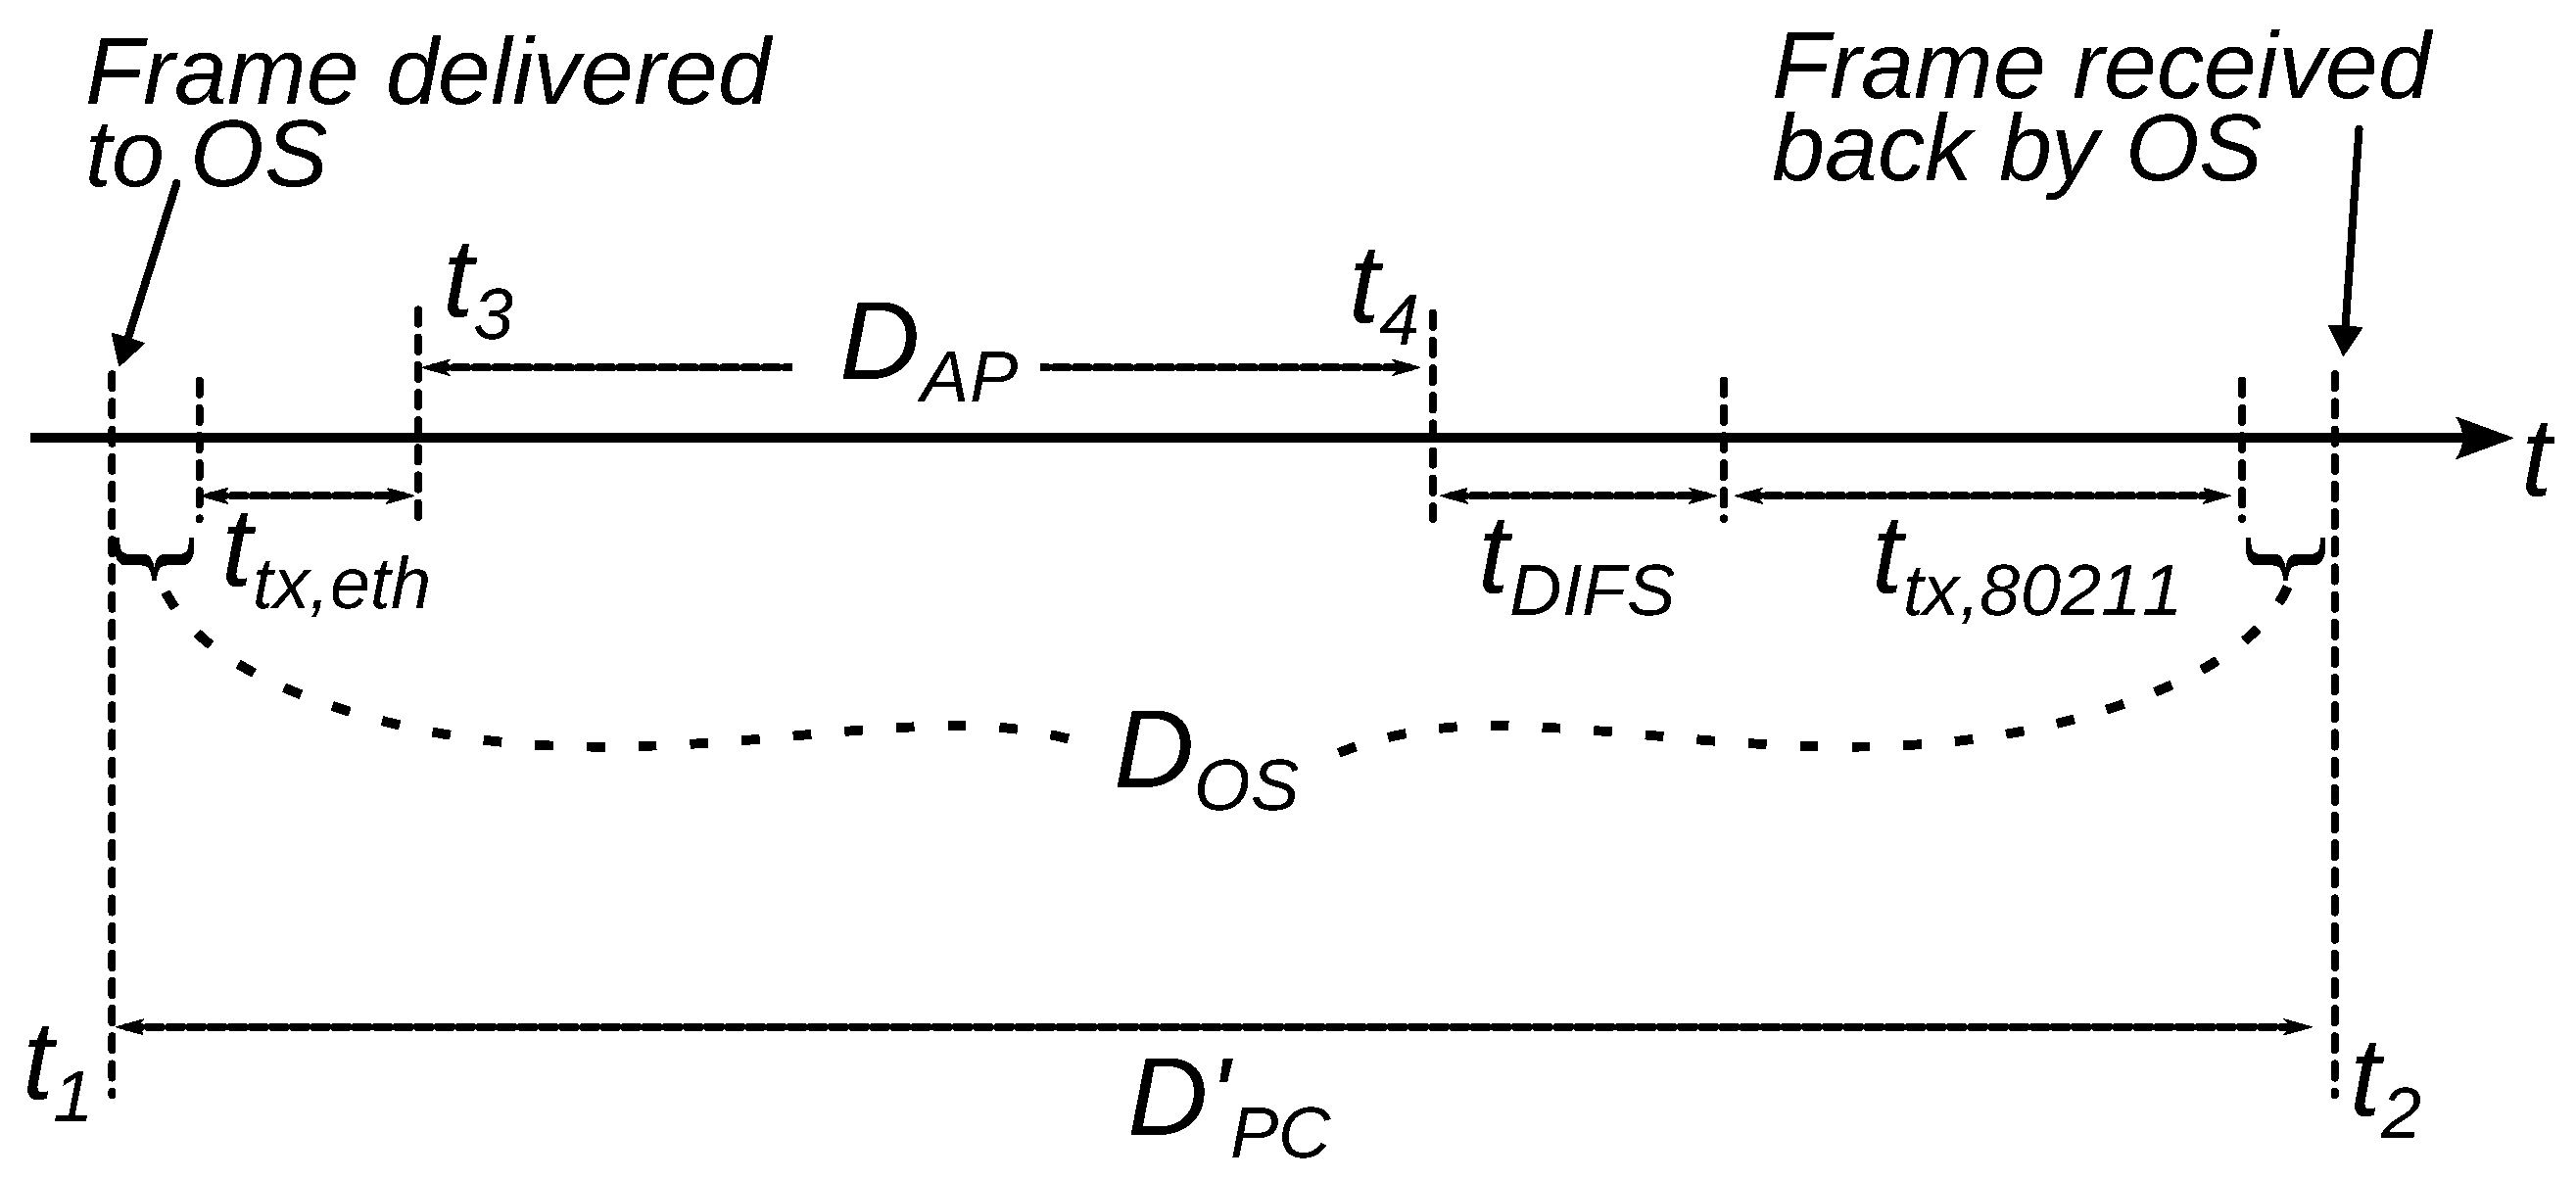
Figure 4. Here, we highlighted the different terms involved in the frame delivery process. In particular, we indicated generically with
the overall latency relevant to the operating system, which includes delay contributions due to the execution of the involved system calls, the processing time required by device driver operations, and latencies within communication interfaces (i.e., Ethernet and wireless card drivers, etc.). A description of the different terms represented in the figure follows.
A data packet is delivered by the traffic generator to the OS kernel at the timestamped instant . Then, it takes some random time (that is part of ) before this packet traverses the system, is processed by the Ethernet Network Interface Card (NIC) device driver, and finally is actually delivered through the Ethernet transceiver.
After a transmission delay
(defined by the standard), the whole frame is decoded at the physical Ethernet transceiver of the AP at time
. The frame is then passed up to the Data Link Layer (DLL), where protocol conversion from the IEEE 802.3 to the IEEE 802.11 format is performed (see
Figure 1). At time instant
, the resulting frame is delivered at the input of the wireless transceiver, where it is used to generate the modulated physical signal to be transmitted. The time interval
is then the delay introduced by the AP and, apart from protocol conversion, it is composed by various contributions such as queue management, coding, logging, etc.
For the sake of mathematical tractability, wireless transmission follows the rules given by the DCF channel access scheme of the IEEE 802.11 standard, found in [
36]. Under the assumptions of an interference free channel and correct transmission at first attempt, which hold for the proposed test-set, the radio chip shall sense the medium for a fixed amount of time (
) and, since it is sensed as idle during this period, the transmission may start, lasting for a specific and easily obtainable transmission time [
37]. Therefore, the time
necessary to receive a frame back on the PC can be decomposed into the following sum of terms:
where the one-way delay is
, while delay due to the AP is
. Calibration of the measurement set-up is required to infer
from the timestamp difference
. The above assumption of an interference free channel, which guarantees a correct transmission at the first attempt, is enforced by two subsequent steps. First, we carried out a preliminary frequency scan through a spectrum analyzer of the whole 2.4 GHz band, and correspondingly selected the WiFi channel for our experiments as the one less affected by other coexistent WLANs. Second, and most important, we carried out a continuous monitoring of each frame transmission through a traffic analyzer (e.g., Wireshark) located on an independent host PC, as well as our traffic generator software collected several statistics about each frame in order to identify eventual retransmission. Given the particular setup of
Figure 2, characterized by a low distance between nodes, a careful selection of channel and a continuous monitoring of the environment, we have verified experimentally that no frames undergo retransmissions during our test.
In Equation (
1), signal propagation times can be neglected on both the wired and the wireless segment, since distances among components are very short in the test-set. The terms
,
and
represent, with very good accuracy, deterministic delay contributions defined in the relevant standard documents [
36,
38], whose parameters and values are reported in
Table 2.
Terms represented by capital letters in Equation (
1) denote random variables. Indeed, the behavior of the delays introduced by the AP and the PC is not known a priori and, in general, is not deterministic. Since deterministic terms in the general model of Equation (
1) can be either calculated or measured, as shown in [
37], then Equation (
1) can be rewritten to account only for the delays introduced by the AP and OS, considering the random component of
:
with
.
Delay introduced by the OS kernel is unknown and, as noted, includes contributions associated with both OS latencies and NICs. Moreover, it also depends on an update of the system software, kernel version, active services, etc. This is in fact the only term that can not be measured, neither directly nor indirectly. Its estimation is indeed the goal of the calibration procedure discussed in this section.
Roughly speaking, to determine the measured AP delay should be subtracted from the corresponding total delay measured at the application level. In practice, however, it is difficult to exactly associate a given measurement of to the specific value of from which it should be subtracted. Consequently, these quantities are more conveniently described in statistical terms by means of their probability mass function (pmf).
Since the
pmf of the sum of two random variables can be calculated through the convolution of their respective
pmfs, the distribution of the random delay through the PC is, from Equation (
2):
where ⊗ denotes the convolution operator, and
,
and
are the
pmfs of the three discrete random variables.
The test setup described in this section allows actual measurements of
and
to be taken. A measurement session can provide sample values for both
and
, which can be conveniently described through normalized histograms, representing the empirical
pmfs
and
(denoted by an overline) of the two discrete random variables. The estimate of the
pmf (denoted by the wide caret symbol
) can be obtained by deconvolution, which is equivalent to computing the cross-correlation of two discrete time signals:
Direct Measurement of
While the timestamping operation by the TSC provides
, to accurately characterize the AP delay
a direct measurement should be preferred. In this perspective, as indicated in
Figure 5, we located on the AP’s internal printed circuit board two test points providing hardware-level signaling of the arrival of a frame on the Ethernet port and of the start of radio transmission, respectively. Therefore, using the same system architecture and traffic profile, we were able to measure the delay between the two positive edges of these control signals, occurring at times
and
, through the use of a high resolution digital sampling oscilloscope (DSO).
The whole measurement setup is sketched in
Figure 6. In particular, it is shown that, on the same PC, two fundamental processes are executed, i.e., the traffic generator software that provides the suitable traffic pattern and collects the needed statistics for the experiments, and the LabView virtual instrument (National Instruments, Austin, TX, USA) purposely designed to directly control the DSO. In this way, each measurement session provides delay readings synchronously collected both through the PC and through the oscilloscope.
5. Experimental Results
The current section presents the outcomes obtained through the adoption of the calibrated test-set described above, by describing a thorough measurement session on real devices.
The reference AP we adopted in our work is a general purpose off-the-shelf available one, namely a 3Com OfficeConnect 3CRWE454G75, which supports a 10/100 BASE-TX Ethernet connection and an IEEE 802.11 g/e compliant infrastructured network, in which we enabled the Wireless Multimedia Extensions (WMM) option, which is a subset of the IEEE 802.11e specifications to support traffic profiles. In the presented experimental campaign, another AP was taken into account as a term of validation of the current procedure. Namely, it is a Siemens Scalance W784-1, which is an industry-grade device particularly designed for use in industrial WLANs, for which it may be expected that a lower forwarding delay is introduced, hence allowing for verifying the validity of the methodology proposed here.
The test beds presented in
Section 2 have been employed to obtain samples of the delays introduced by this reference AP. Particularly, the PC exploited during tests was a Dell Optiplex 960 running an Ubuntu 16.04 LTS operating system, with an Atheros AR9287 IEEE 80211n compliant wireless NIC, and an Intel 82567LM-3 Ethernet NIC. In addition, the high resolution digital sampling oscilloscope was an Agilent DSO 6032A. It is worth observing that, in our experimental setup, we have not resorted to the use of a real-time OS. Actually, this choice has been carried out with a precise intent, i.e., to assess that the method is general and not related with the use of a particular or specific environment. Indeed, the use of a RT OS would have provided a better performance in terms of variance of the
term (not necessarily in its magnitude), but, in this work, that was not the focus. Moreover, it has to be observed that, in a typical RT OS, the system is generally able to behave under real-time constraints if all the involved components, included the device drivers, support that feature (which means that they have been programmed having in mind what are the requirements of a real-time system, hence avoiding unbounded latencies, spin locks, etc.). Unfortunately, most of the device drivers of commercial WiFi cards are seldom able to respect real-time constraints. Hence, in this case, even if the OS is a RT one, the wireless communication section would have been carried out outside the real-time path of execution, leading to unbounded latencies to possibly arise.
The experimental campaign presented in the following is based on the execution of measurement sessions involving at least 10.000 frame exchanges, in order to obtain a good statistical significance of the outcomes. Moreover, for the sake of evaluating the repeatability of the procedure, we performed the same experiments in different days and hour of day, always obtaining consistent results.
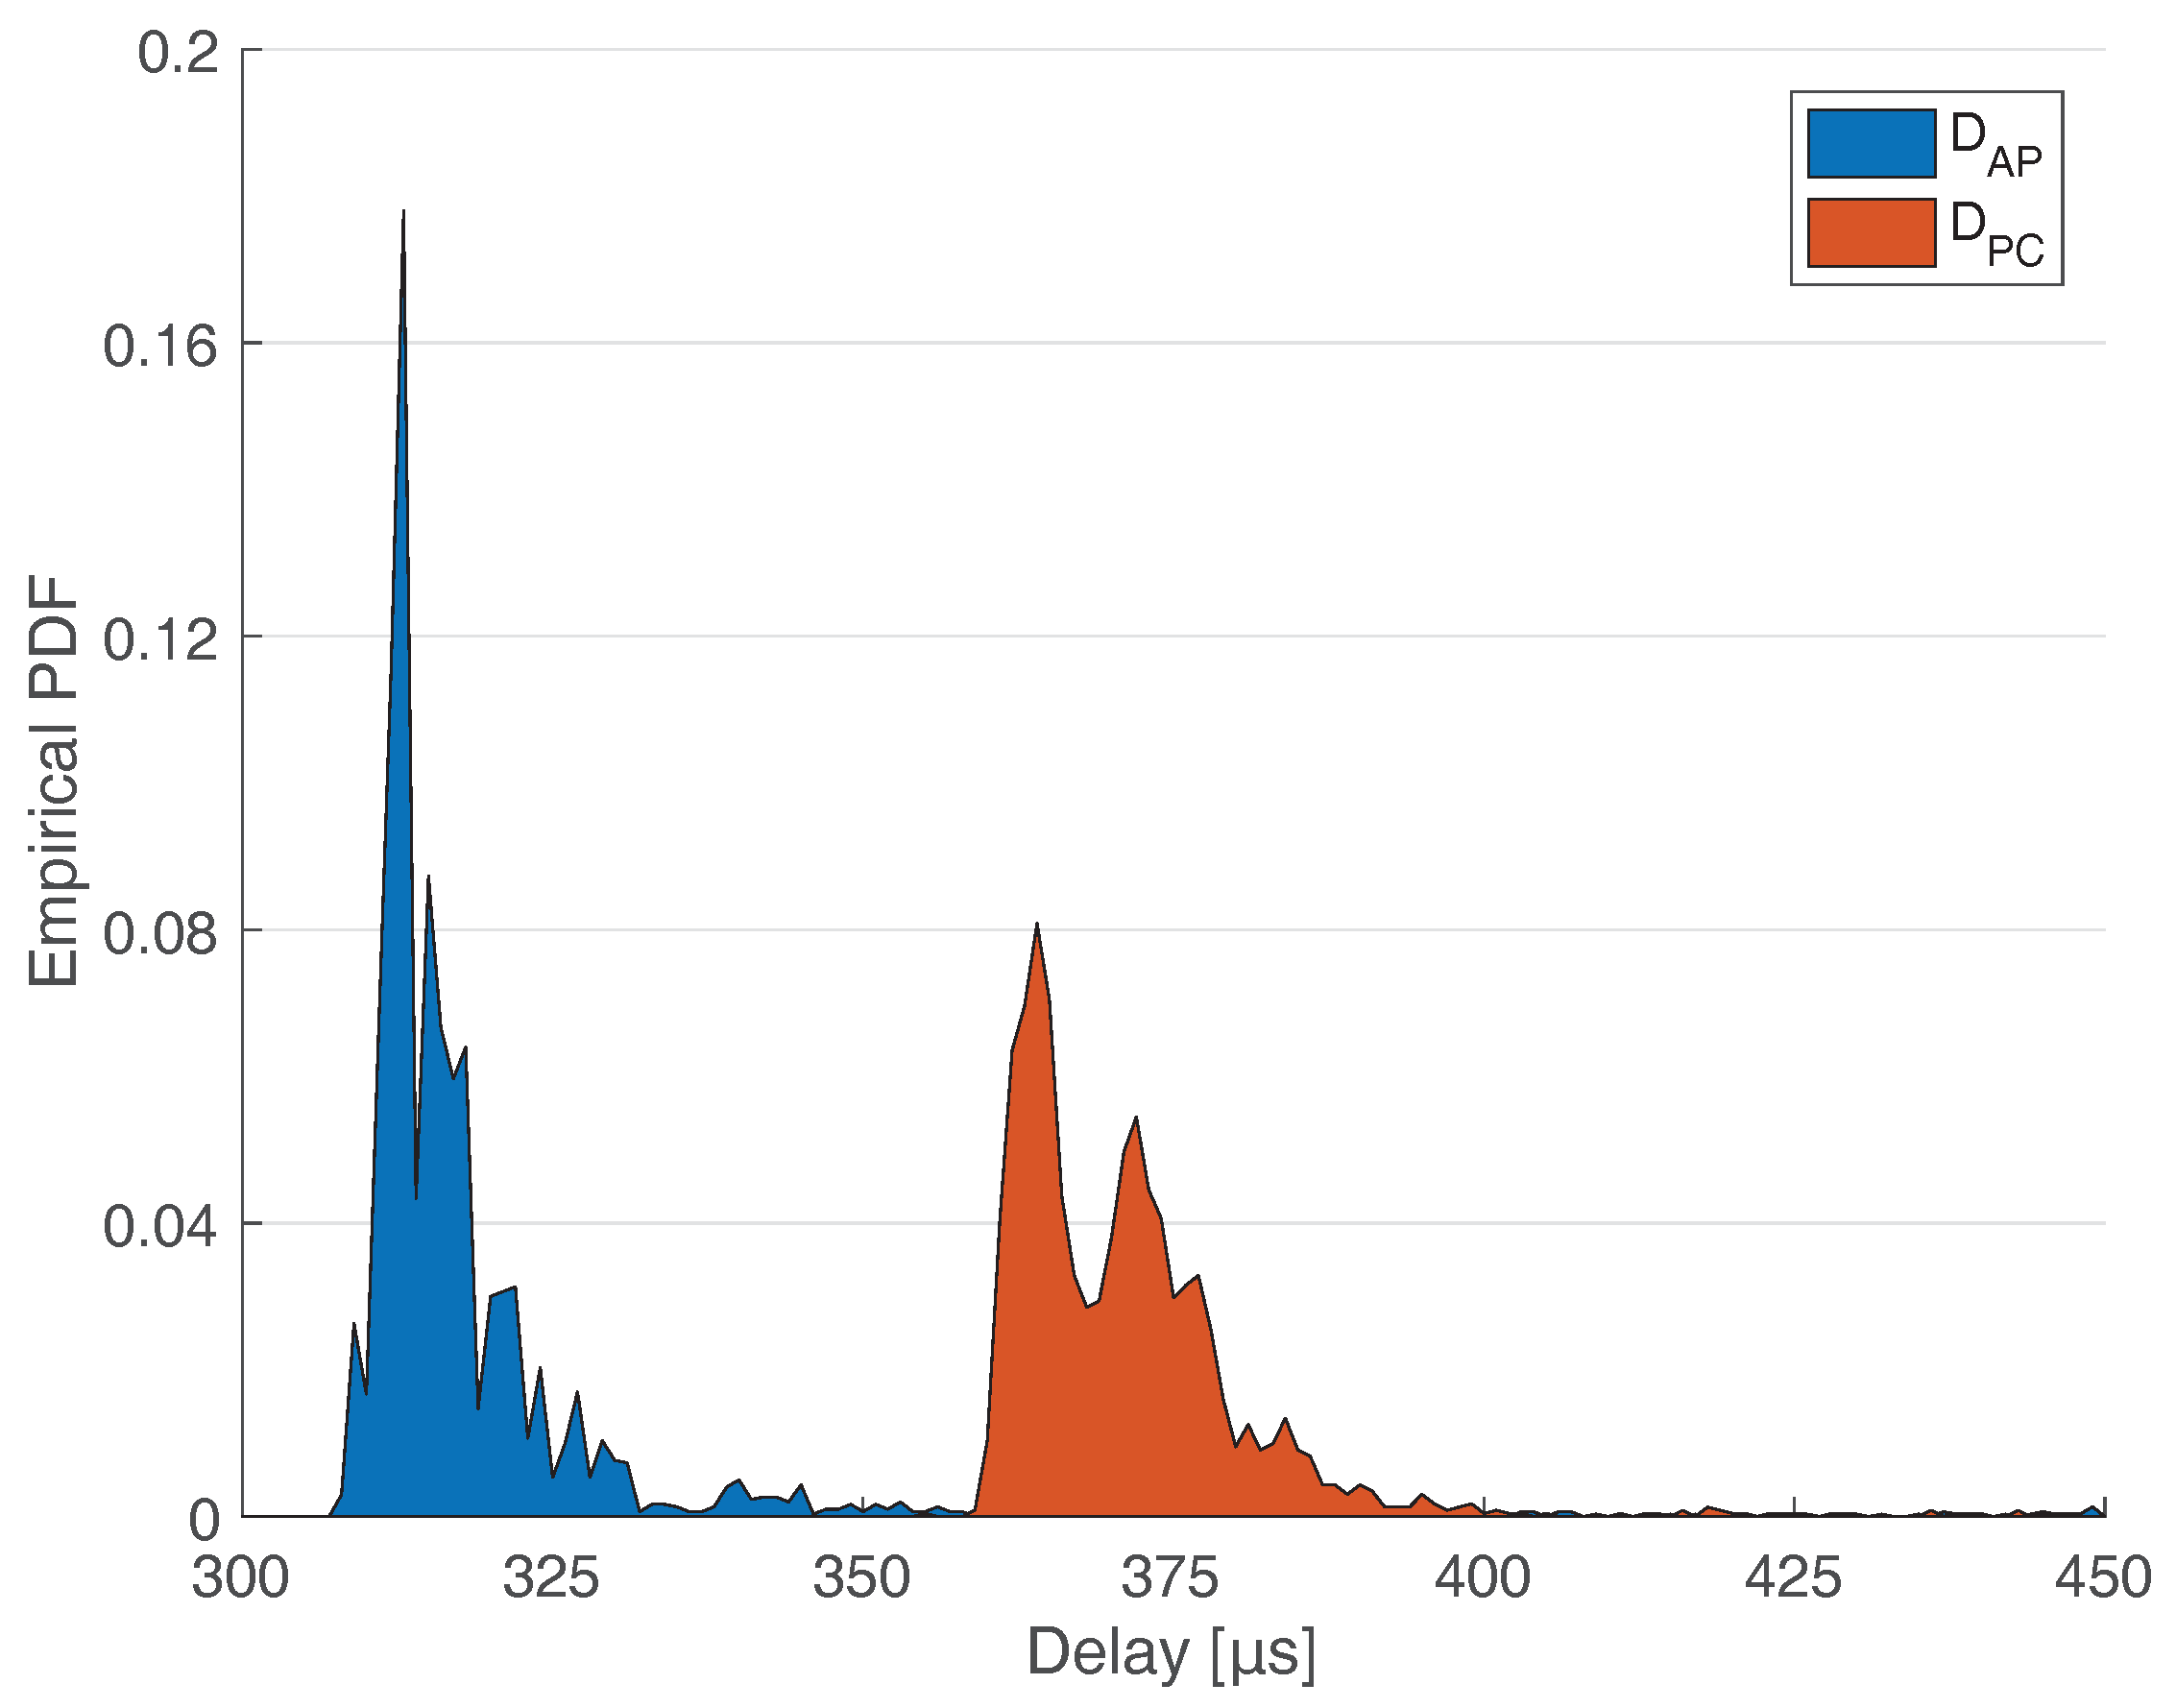
Figure 7 shows the empirical
pmfs for the delays
and
measured with the setups of
Figure 2 and
Figure 5, respectively. The figure is relevant to tests with inter-departure time of packets set to the lowest value of
3 ms. Given the high resolution of both TSC and oscilloscope raw data, in the post–processing phase, we have chosen a histogram bin width of 1
s.
As a matter of fact, we have carried out experiments with different inter-departure times, as indicated by
Table 2. The obtained outcomes are substantially analogous to the ones provided in
Figure 7, and hence the respective figures are not reported here to avoid clutter.
It is also worth highlighting that the choice of the values reported in
Table 2 comes from the consideration that this work focuses on the measurement of the AP latency under non-saturated conditions, i.e., when the AP is not overwhelmed by packets coming from the Ethernet connections, so that the queue is not saturated and/or packets have not to be dropped by the AP. This simplifying assumption, which avoids the need to take into account the model for queue management within the AP in Equation (
1), is actually appropriate for the field of industrial automation, since, although the traffic profiles typical of that scenario are characterized by very stringent constraints on the timeliness, they are also characterized by a very low throughput, often allowing the networking devices (and APs in particular) to work under rather under-loaded conditions.
The rightmost curve is the estimated
pmf of the delays measured through the software
, while the leftmost one,
, is that collected through oscilloscope measurements. Please note that we have already subtracted the deterministic contributions from the measured value
, actually showing
. Looking at
Figure 7, a shift between the two
pmfs of roughly 50
s can be observed, so that it is expected that the latency of the OS will result, from the application of the deconvolution method, in a
pmf centered around that value.
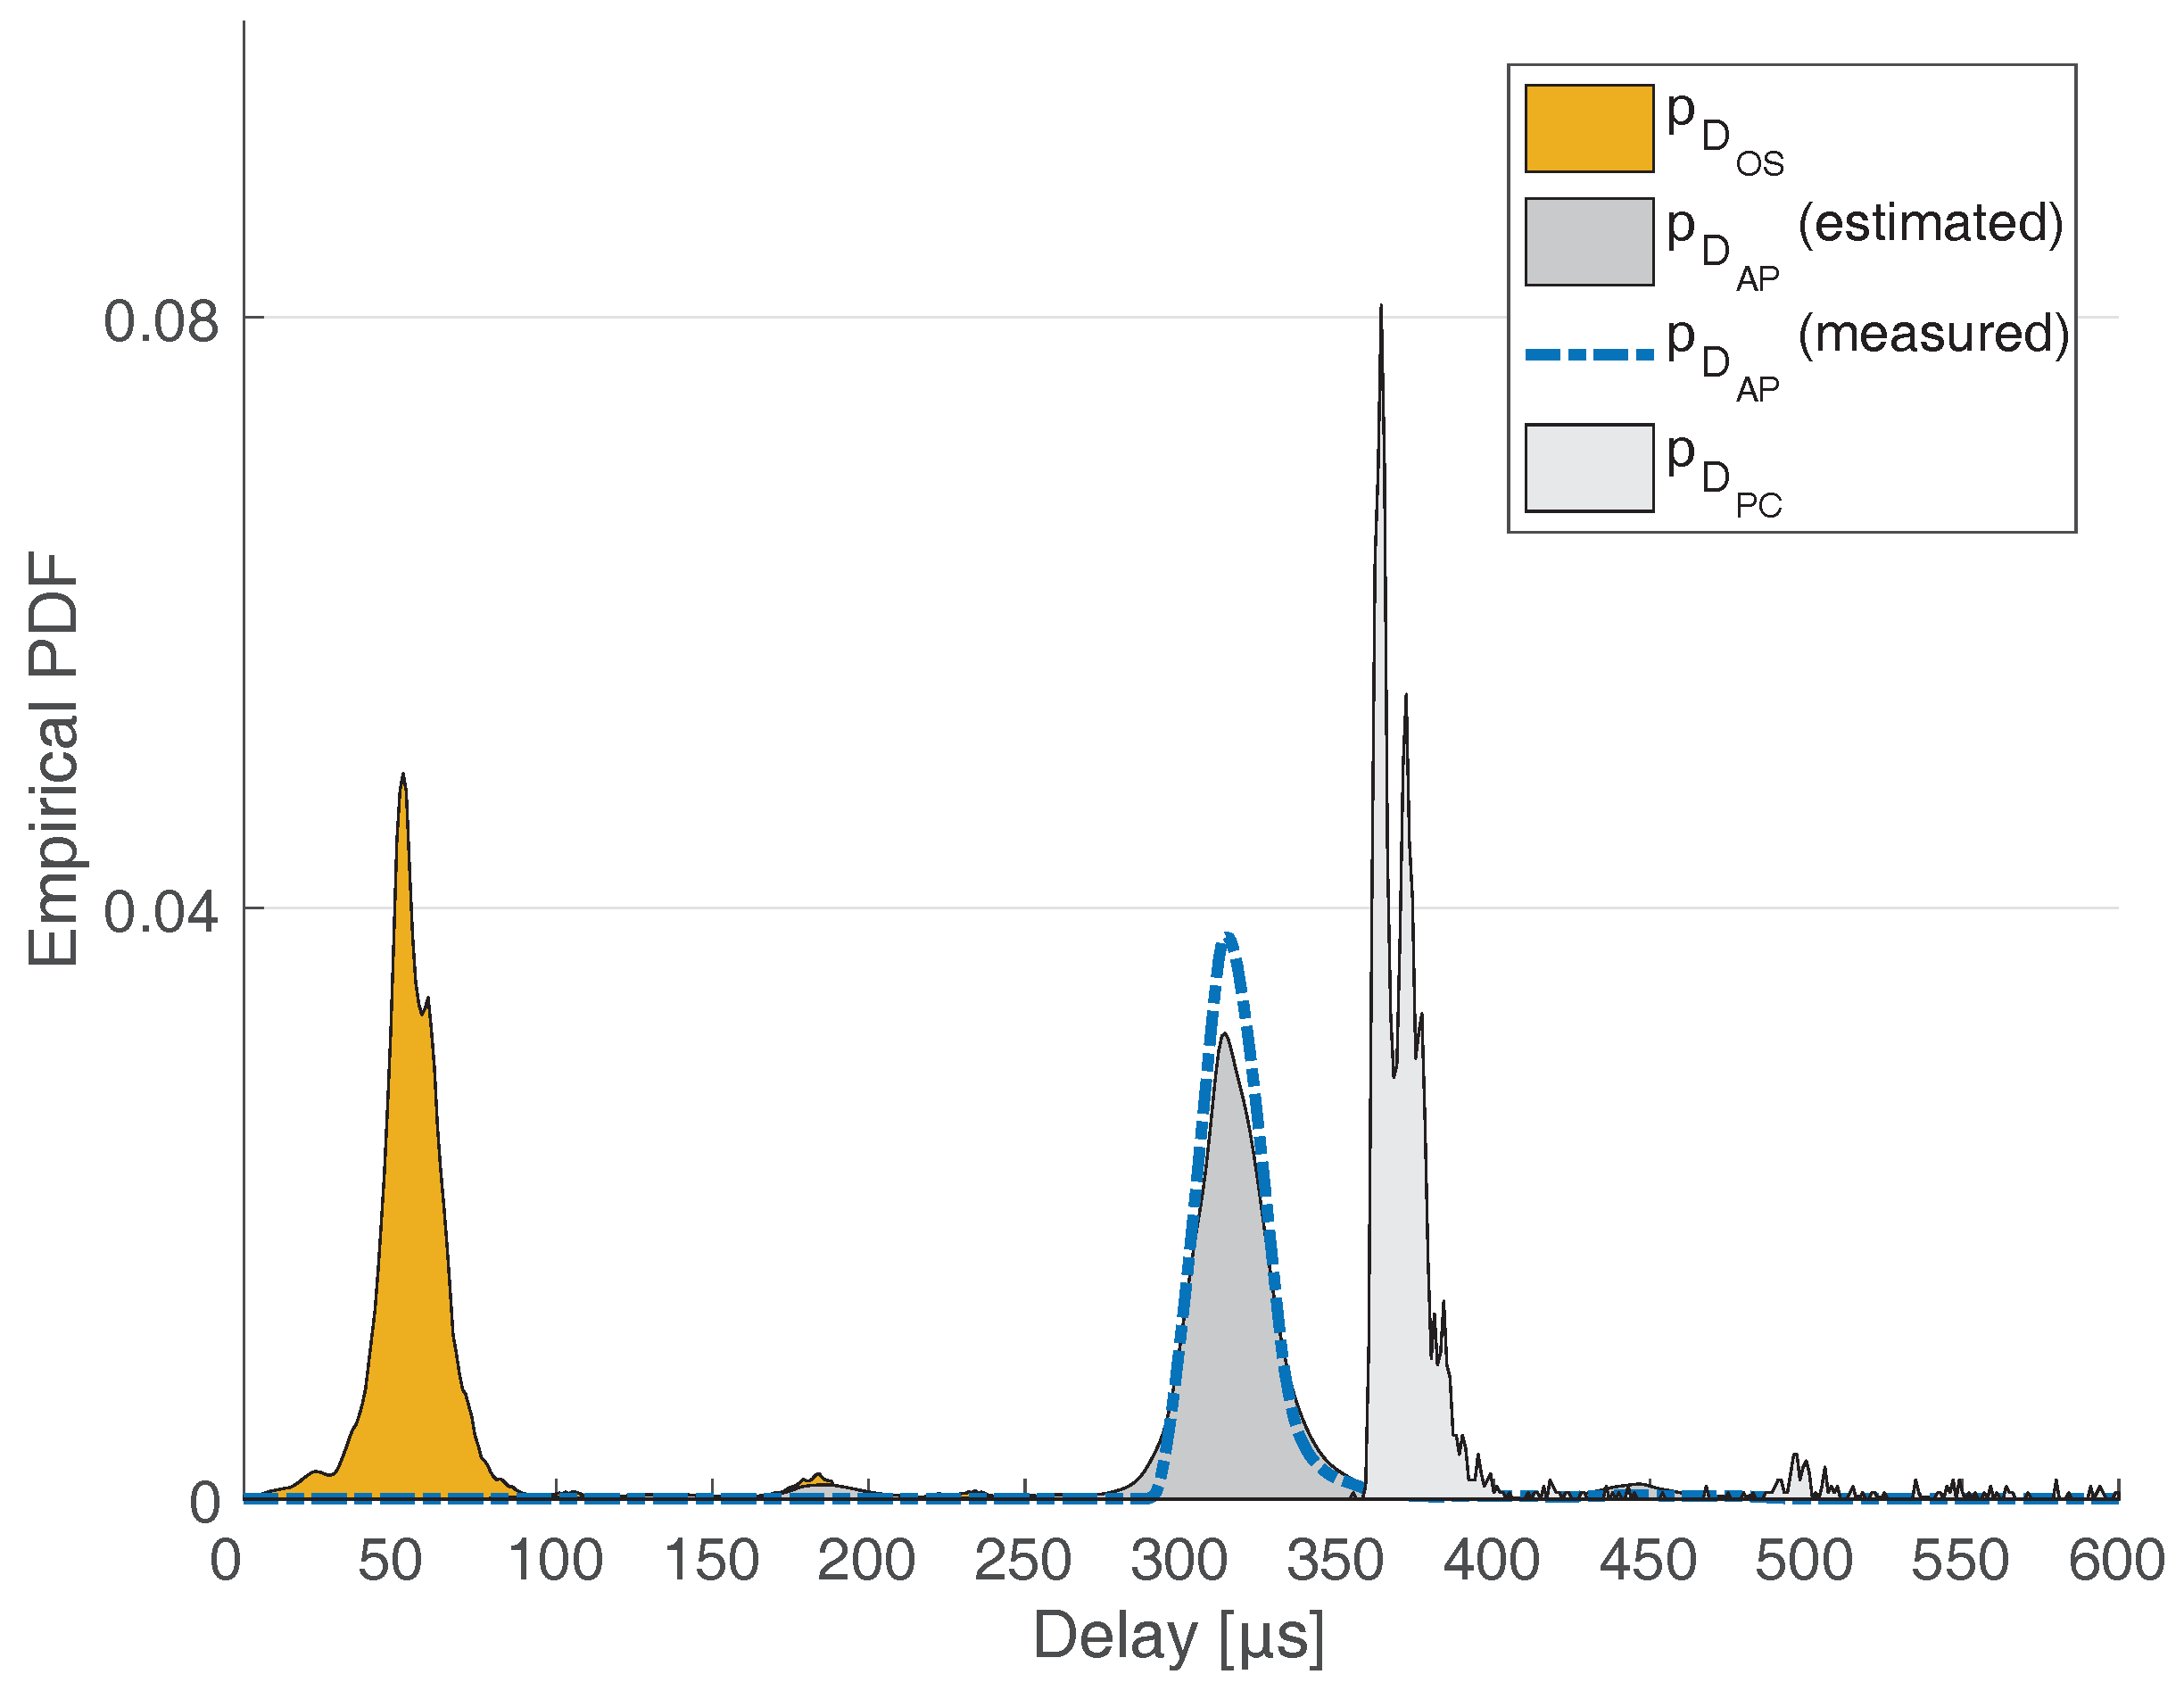
Indeed, we applied the proposed calibration scheme to our data, and the result of Equations (
4) and (
5) is shown in
Figure 8. Particularly, the leftmost PDF is the result of the application of Equation (
4), showing the estimation of
. The expected behavior of
is therefore confirmed by this curve, whose peak is found at 52
s and which highlights that operating system latencies together with those due to the network interfaces on the PC (Ethernet and Wireless boards) constitutes in fact a non negligible fraction of the overall delay measurement obtained at traffic generator level
. Moreover, as it is trivially expected,
changes from machine to machine, or if any of the adopted network cards is replaced, as it has been confirmed by other tests we performed, not shown here for the sake of brevity. Nonetheless, the setup here proposed proved to be able to provide accurate results independently of these changes because of the use of a reference AP with metrologically characterized delay.
To provide an initial assessment that the procedure produced an accurate estimate of
pfm, in
Figure 8, we have also provided a comparison between the estimated and the measured
pmf of the 3Com AP. The measured AP
pmf is represented with the dashed thick blue line, while, for the estimated
pmf, we used a solid gray area.
Nonetheless, it is worth observing that the shape of the
pmf (solid orange area) is smoother than that directly measured through the oscilloscope
and TSC readings
, as can be noticed both in
Figure 7 and in the rightmost pmf in
Figure 8. Indeed, the different probability mass functions are represented through normalized histograms, where a specific and meaningful bin width has to be selected. This hence produces an implicit filtering operation on the acquired samples, so that we have:
where
is the theoretical
pmf of the original acquired data (without filtering) and the filter
is defined as
with
n being the length of the filter. Moreover, the subsequent application of (de)convolution or, similarly, cross-correlation operations, as in Equations (
4) and (
5), to obtain the needed estimates proposed in this work accentuates the effect of this filtering operation.
Therefore, returning to look at
Figure 8, we have to consider that both measurement procedures (oscilloscope and TSC) return data with a granularity in the order of tens of nanoseconds and that we built the
pfms using bins that are 1
s large. Hence, to effectively compare the measured
with the estimated one, we have to apply to the former the same number of filtering operations involved in the estimation of the latter. We actually already carried out this post–processing in
Figure 8, and as such we may definitely state that there is a very strong agreement between the estimated AP forwarding latency and the measured one. Furthermore, it is possible to give a rough estimation of the goodness of fit, adopting the normalized root mean square (RMS) difference between the
pmfs as a performance indicator of the method. To this regard, a value well below
is obtained, providing a raw figure of merit of the whole measurement procedure accuracy.
To further assess the performance of the proposed approach, we have applied the described method to another AP that were previously characterized both according to the proposed black-box estimation method (through the set-up of
Figure 2), and according to the same direct measurement method used to characterize the reference AP, i.e., through direct measurements with a high-resolution digital sampling oscilloscope. Namely, the new access point is a Siemens Scalance W784-1, which is an industry-grade device particularly designed within industrial WLANs, for which it may be expected that a lower forwarding delay is introduced.
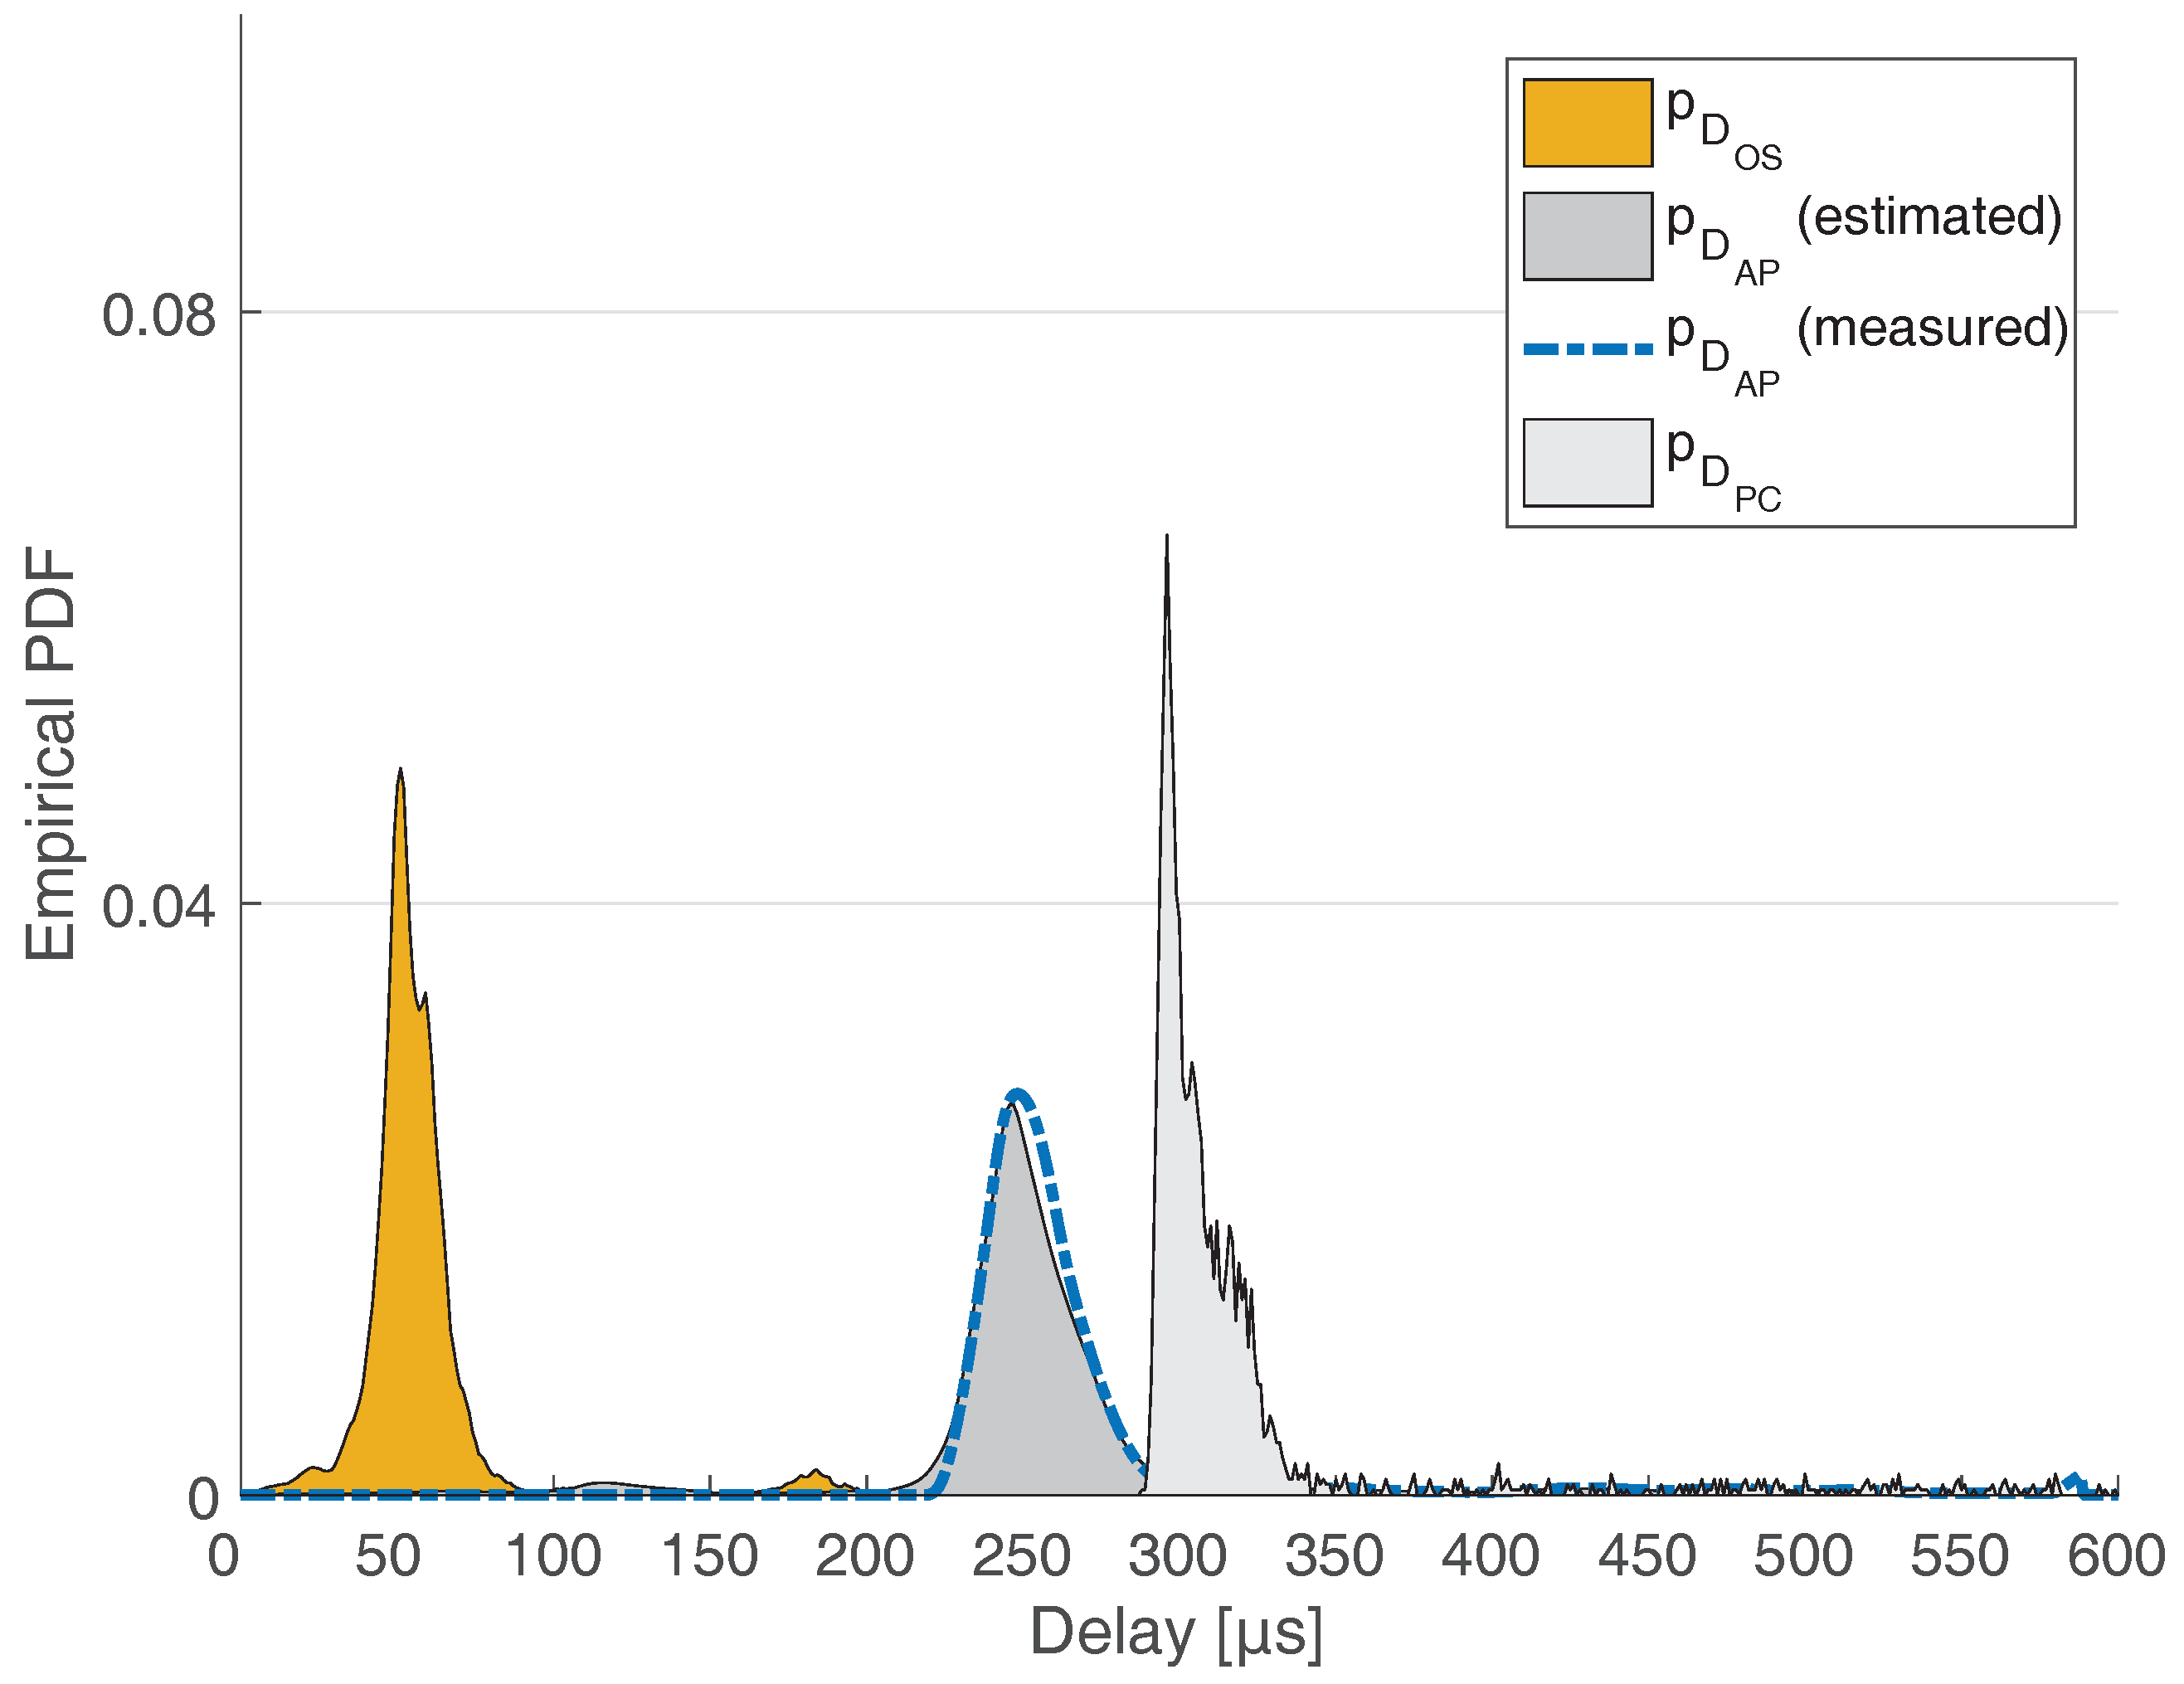
The results of the application of the characterization procedure described in this work to this new AP are summarized in
Figure 9. In the figure, the leftmost solid orange area is the estimated
, determined before as the result of the measurement test-set calibration. The rightmost solid gray area is the
pmf relevant to the delay
, i.e., measured at the OS level with the loopback setup of
Figure 2 and with the new AP as the device under test. The central solid dark gray area is the final result of the estimation of the delay
introduced by the new AP, and the comparison with the measured delay (dashed thick blue line) confirms again the goodness of the estimation procedure.
As a significant observation, we may state that, as expected, this industry-grade AP introduces a nearly 60 s lower forwarding latency than the one introduced by the reference AP, which is a commercial off-the-shelf office device. Nonetheless, we may also observe that, despite the Siemens Scalance W784-1 AP being realized for the management of time-critical industrial traffic, its forwarding latency is nevertheless considerable (about 250 s) and associated with a non-negligible randomness, which has to be taken into account for the deployment of real-time communication tasks in the system. This is a fitting example of the vital information that can be gathered by the test set-up presented in this work.
Nonetheless, it is worth highlighting that, given that the focus of this paper is on the measurement system rather than on the actual delay results, it is beyond our intentions to provide a performance comparison between one AP and another one, also given that the two considered APs belong to very different device classes. Conversely, these final figures and experiments are intended only to demonstrate the validity and accuracy of the measurement method in the given application context.
Finally, it is worth drawing some considerations about the time measurement uncertainty associated with the proposed estimation procedure. Several factors contribute to the overall expanded uncertainty, the most significant being the measurement procedure for the metrological characterization of the reference AP through the oscilloscope, the software time stamping operations, the post-processing of data to obtain the empirical
pmfs. As far as the time stamping is concerned, the TSC has a resolution which is determined by the internal CPU frequency multiplier, typically in the range 10–20. Since the clock frequency on the machine used in these experiments is 2.66 GHz, the resolution may be considered roughly 10 ns. However, considering the different sources of uncertainty cited in
Section 2.1, and some test carried out to assess the overhead involved in TSC reading operation, it may result in being safe to overestimate the accuracy related to the software time stamp and set it to one order of magnitude greater, i.e., around 100 ns.
The time resolution of the oscilloscope is on the order of the 2 ns, but, for the kind of measurement (a time difference) and looking at the instrument data sheet, the uncertainty may be set to about 50 ns.
The histogram bin width in
Figure 7,
Figure 8 and
Figure 9 has been set to 1
s. This means that, considering the aforementioned uncertainties, there is quite a minimal chance that samples at the boundary between two bins are misplaced. Hence, it may be safe to consider that the accuracy involved in the post-processing of data is not significantly degraded during these operations, and can be set to 2
s in the worst case. Filtering effects due to consecutive applications of Equations (
4) and (
5) tend to further decrease this accuracy. However, since the final estimation of the AP forwarding delay
requires actually two steps of (de)convolution, we may assume that the overall uncertainty associated with the proposed estimation procedure is no larger than 5
s.


