A 3-D Model of a Perennial Ryegrass Primary Cell Wall and Its Enzymatic Degradation


Abstract
:
1. Introduction
2. Method
2.1. Assembling the Simulation Environment
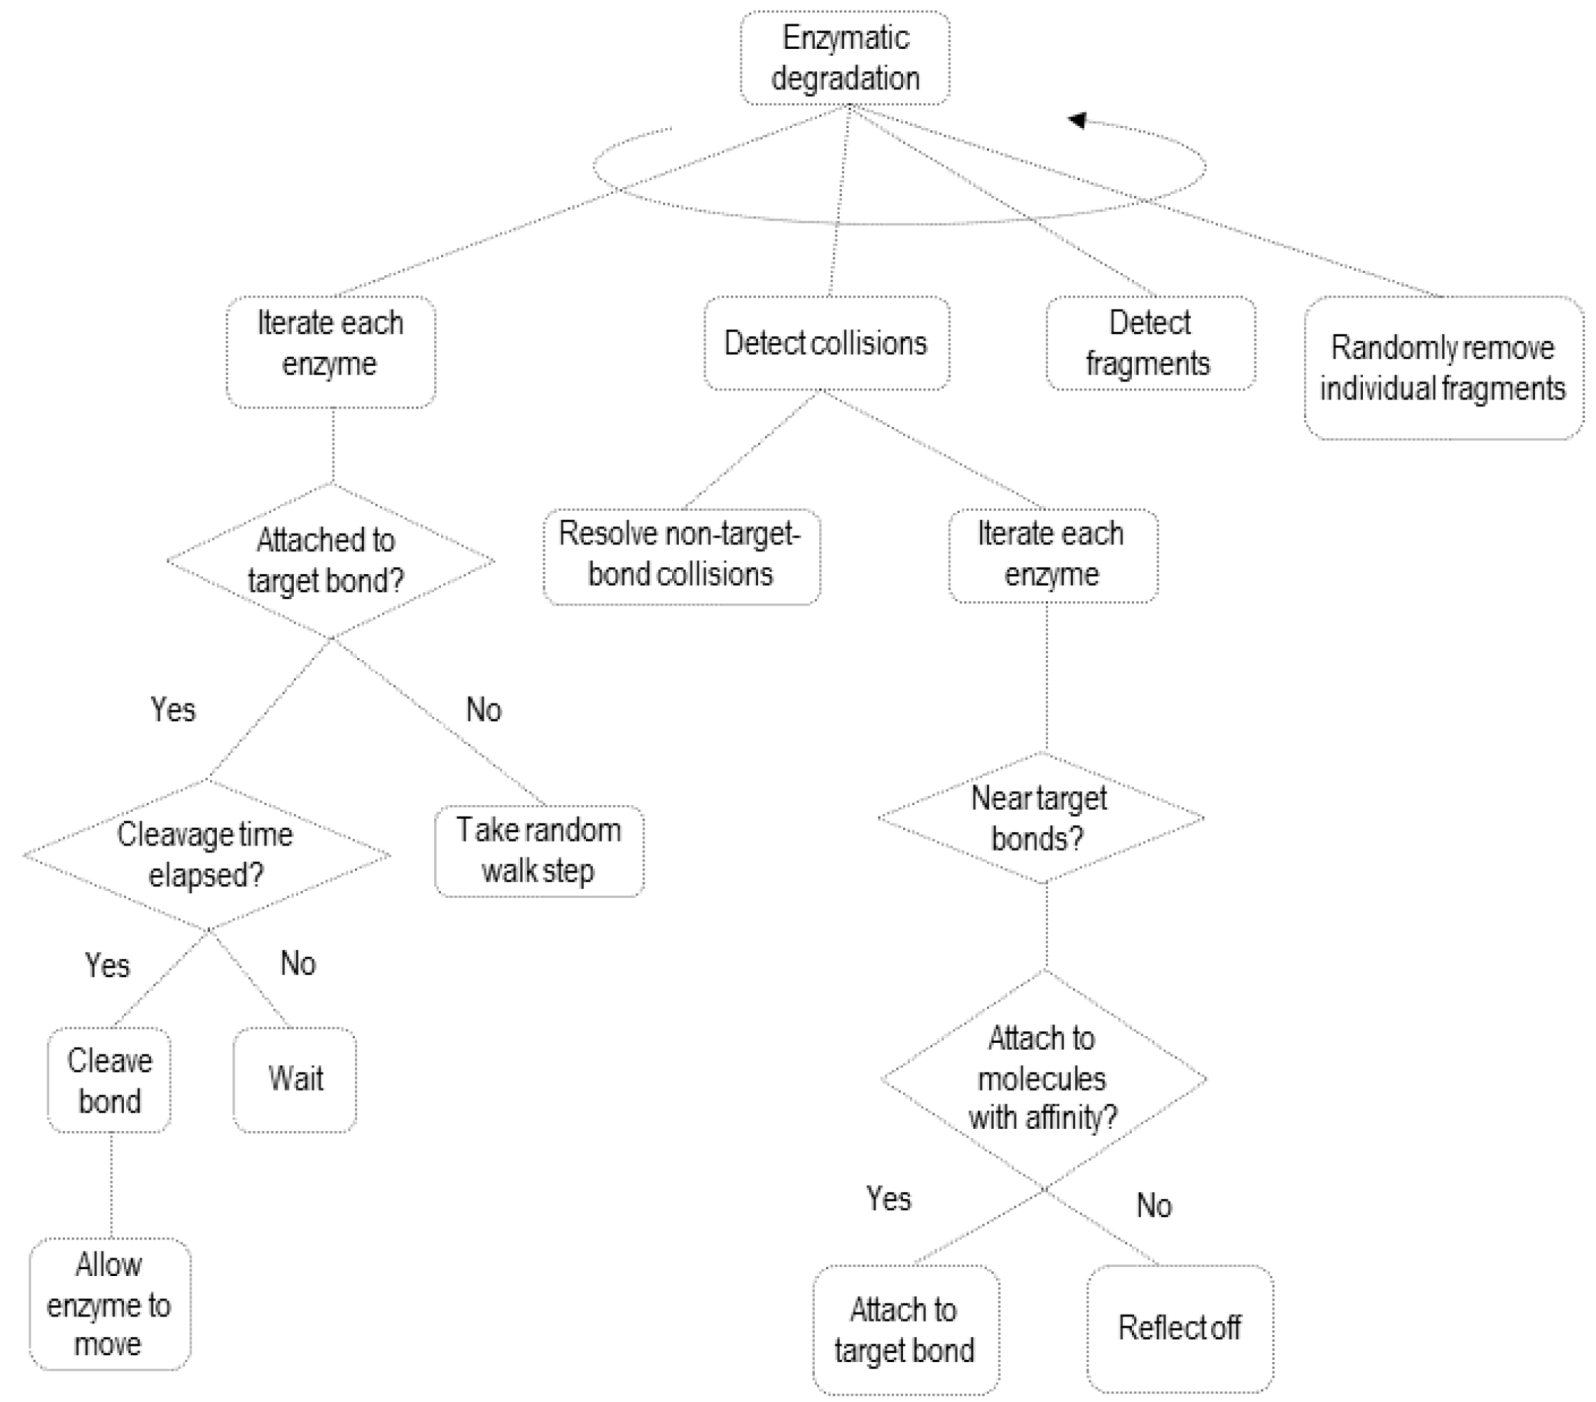
2.2. Simulating Enzymatic Action

3. Results and Discussion
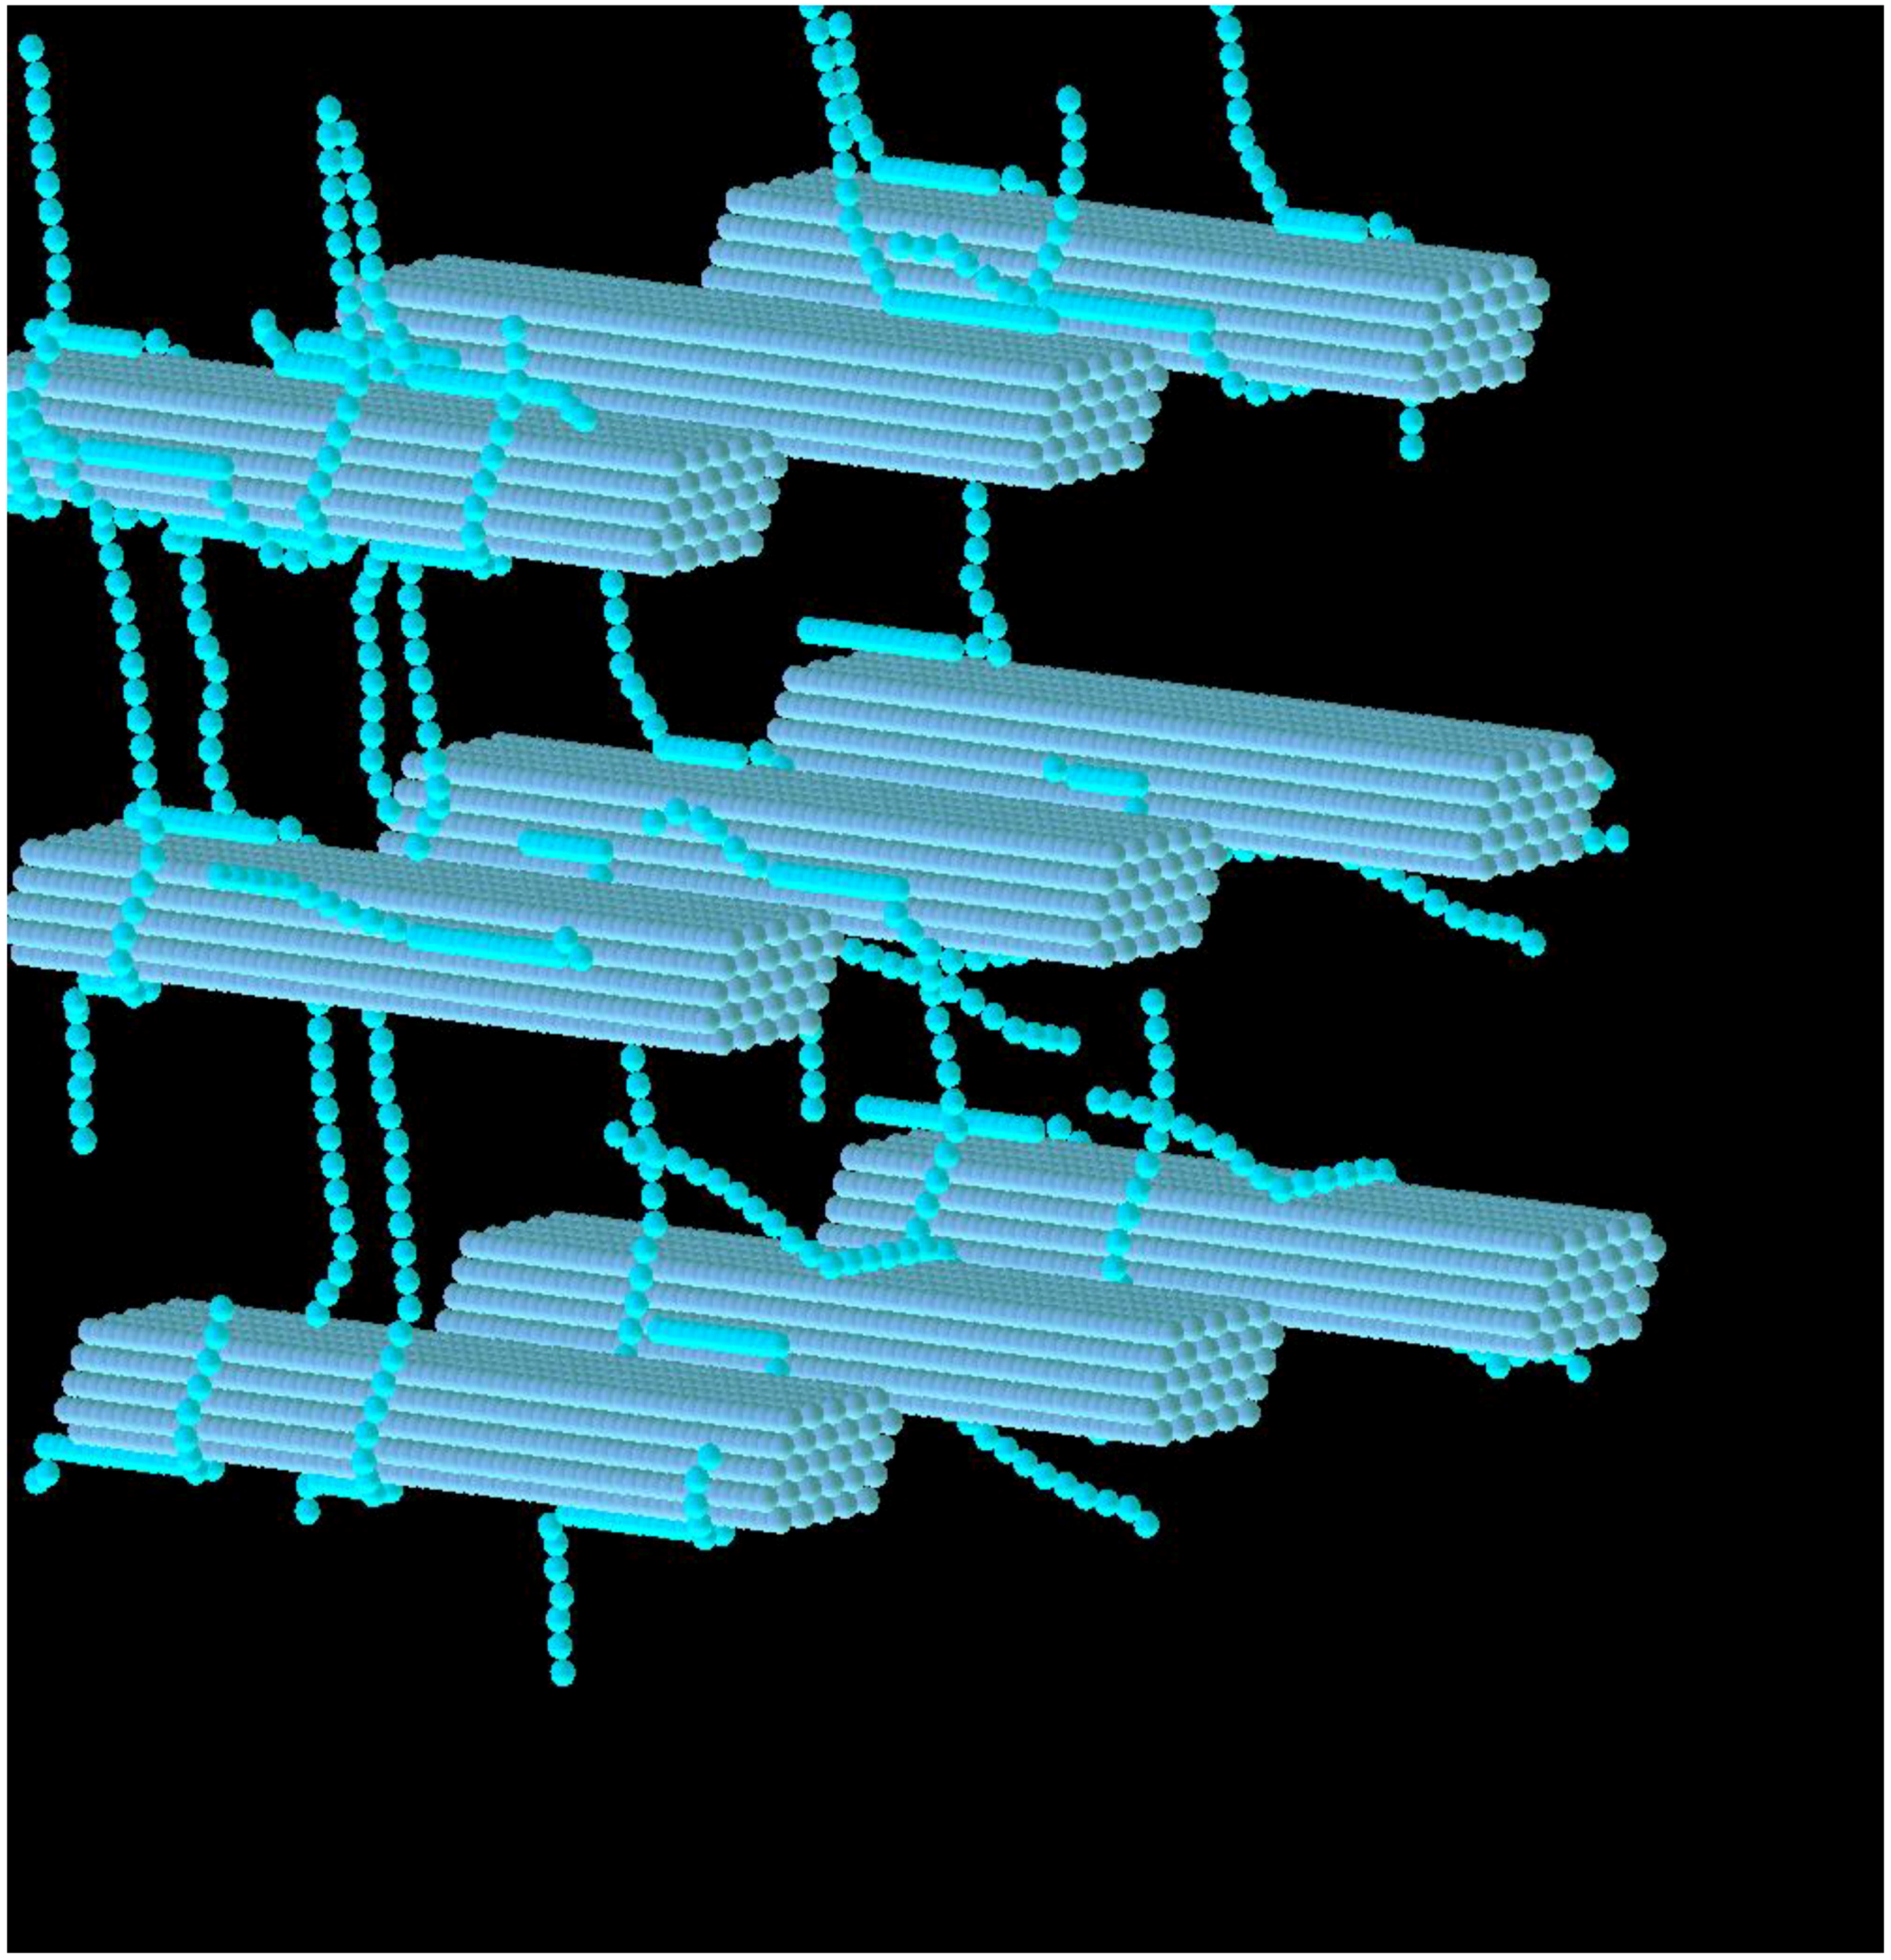
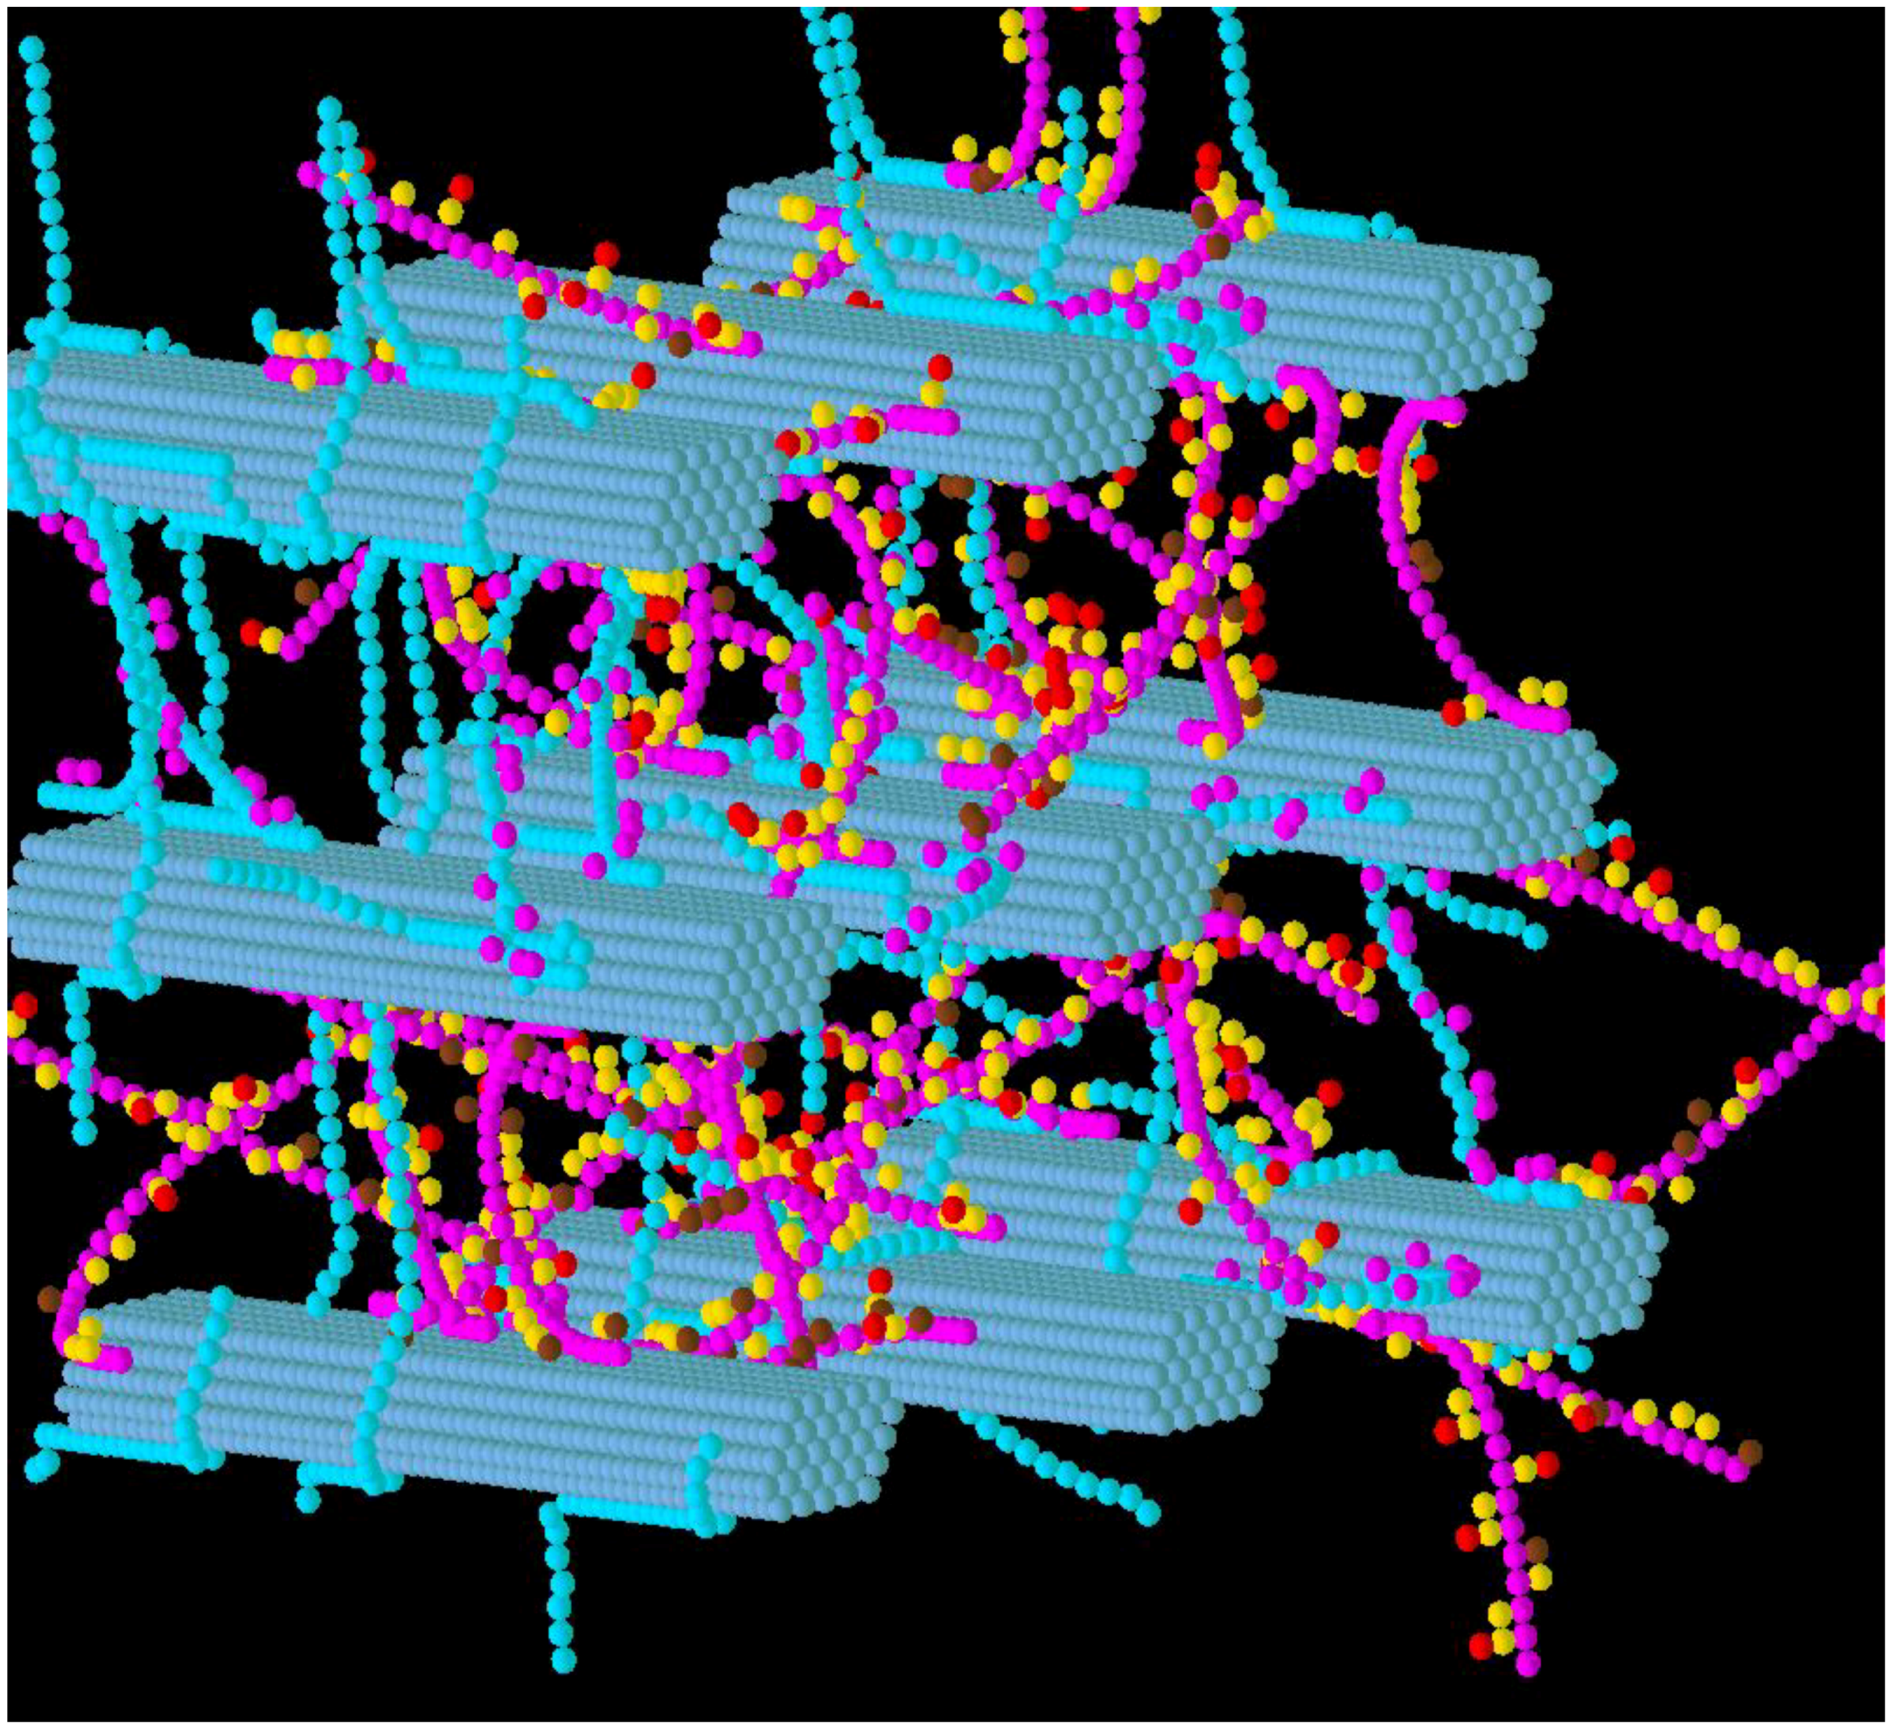
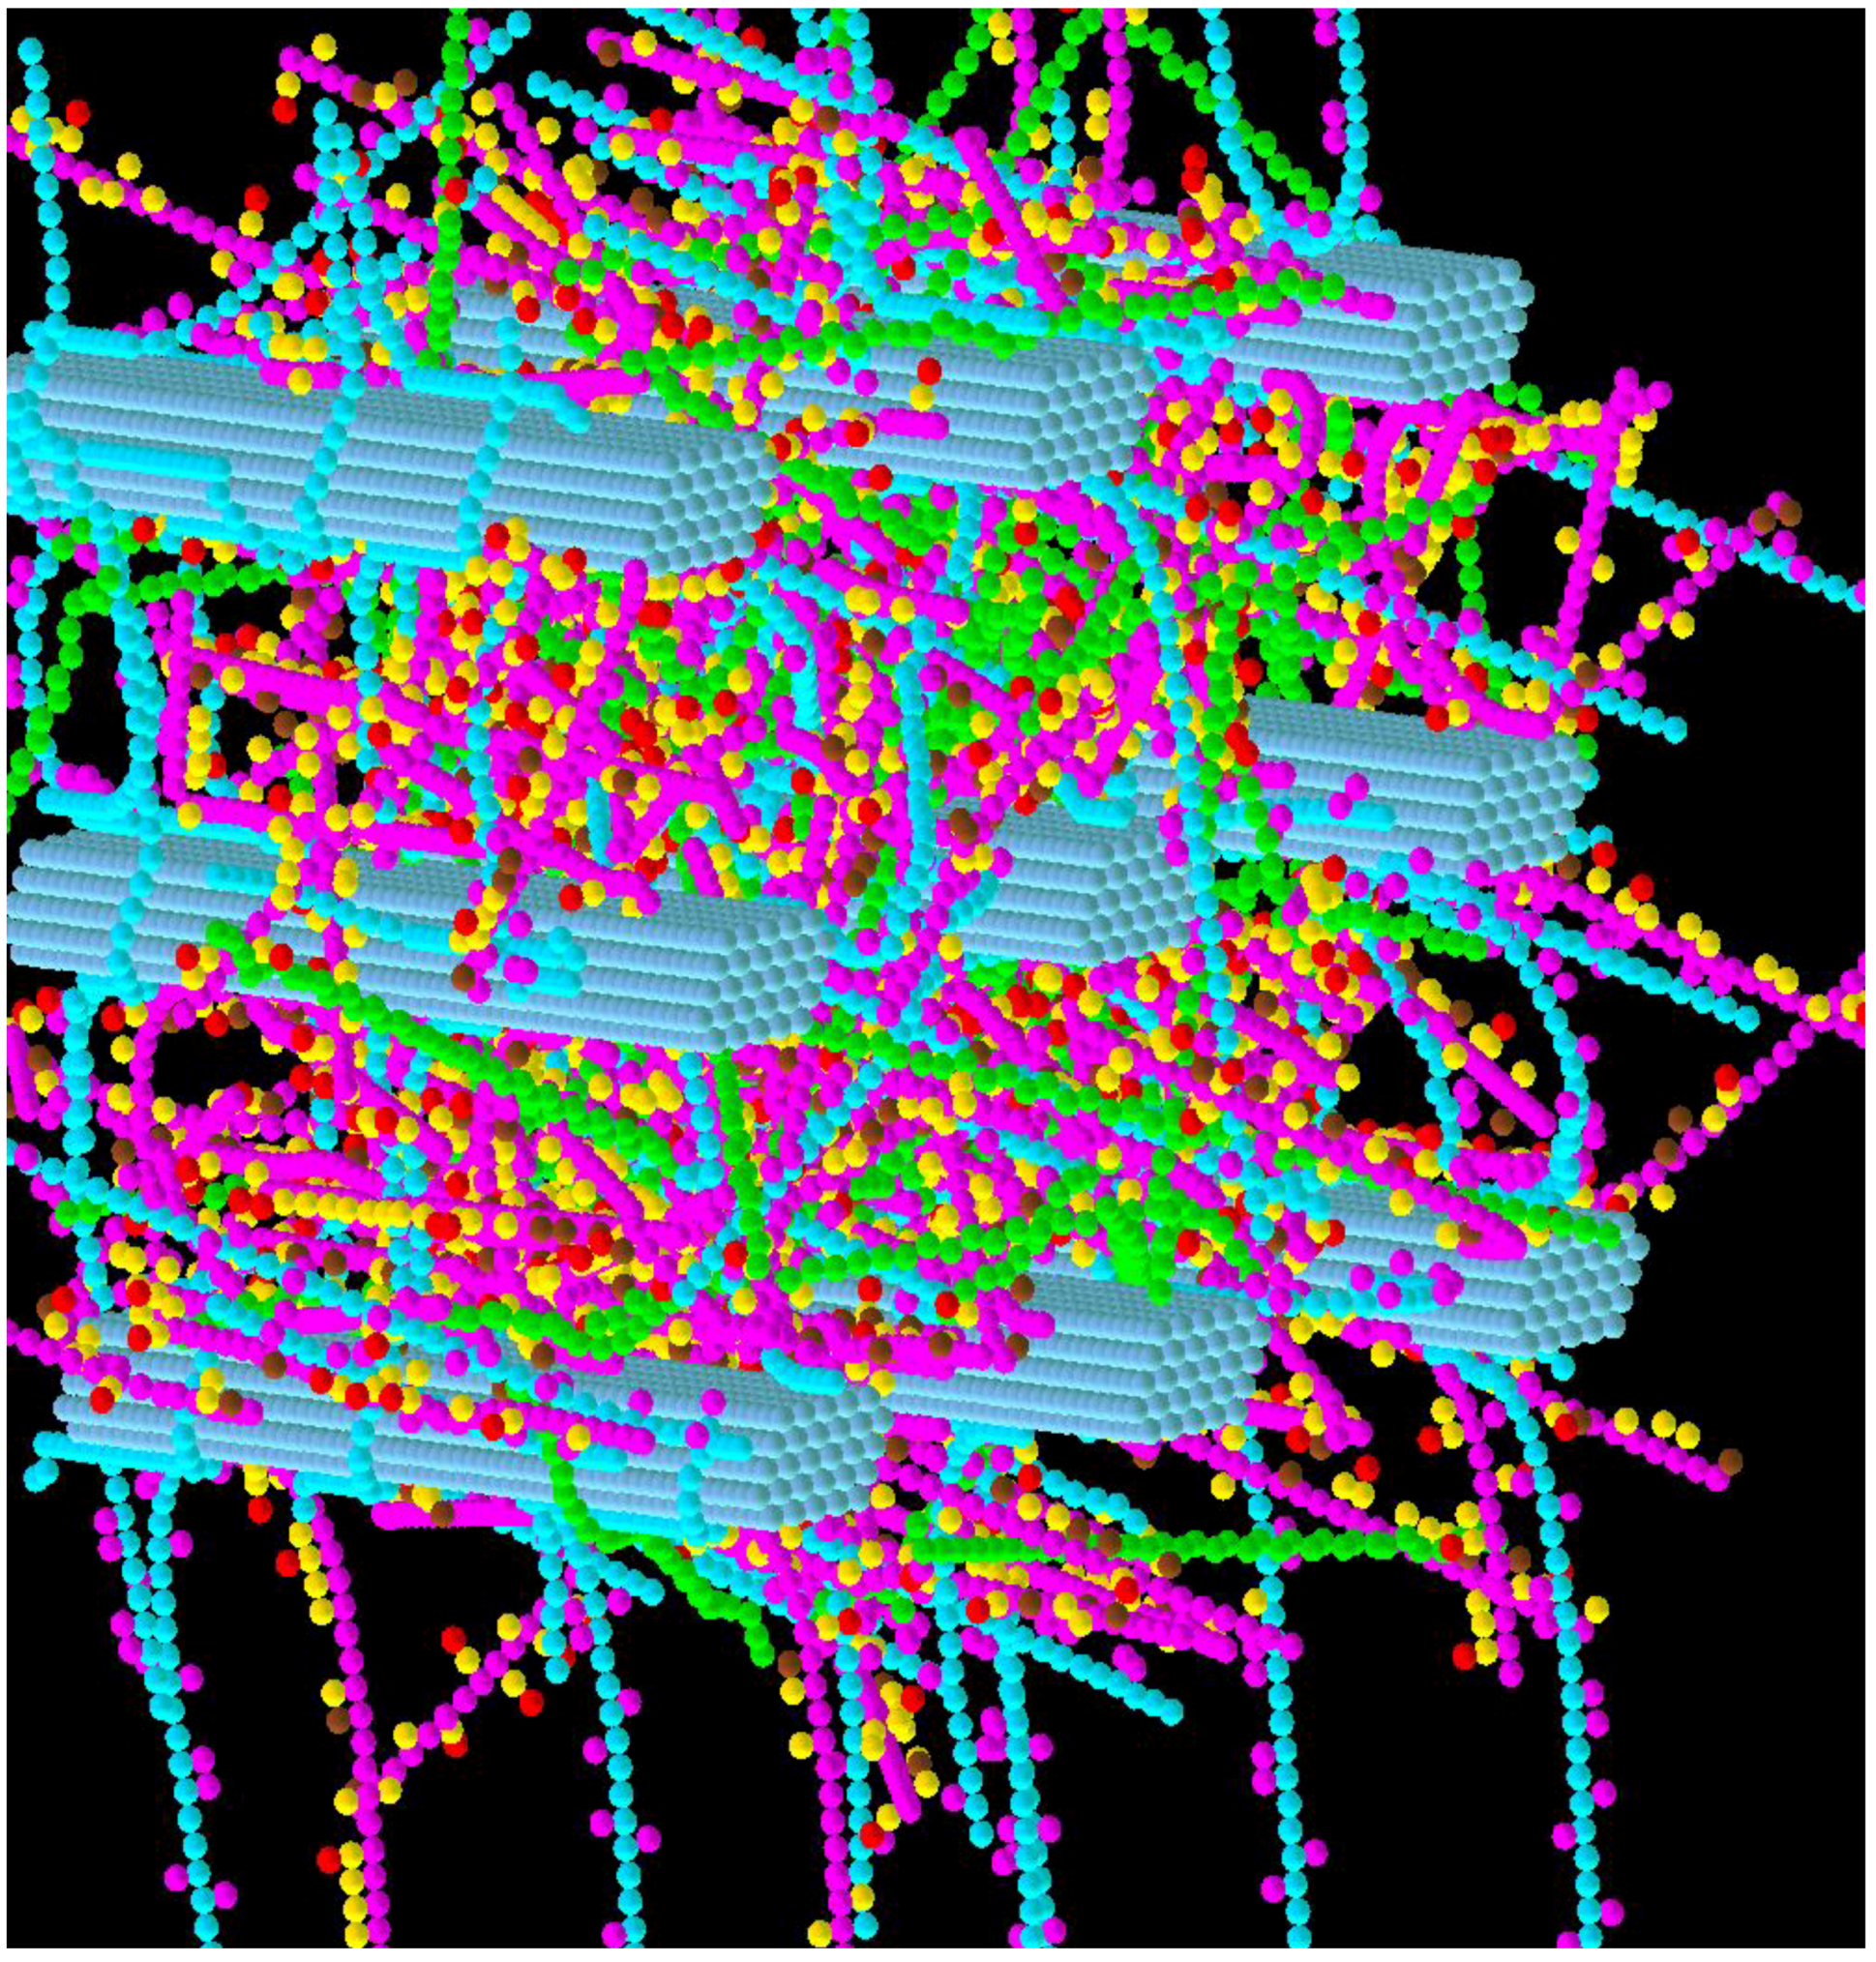
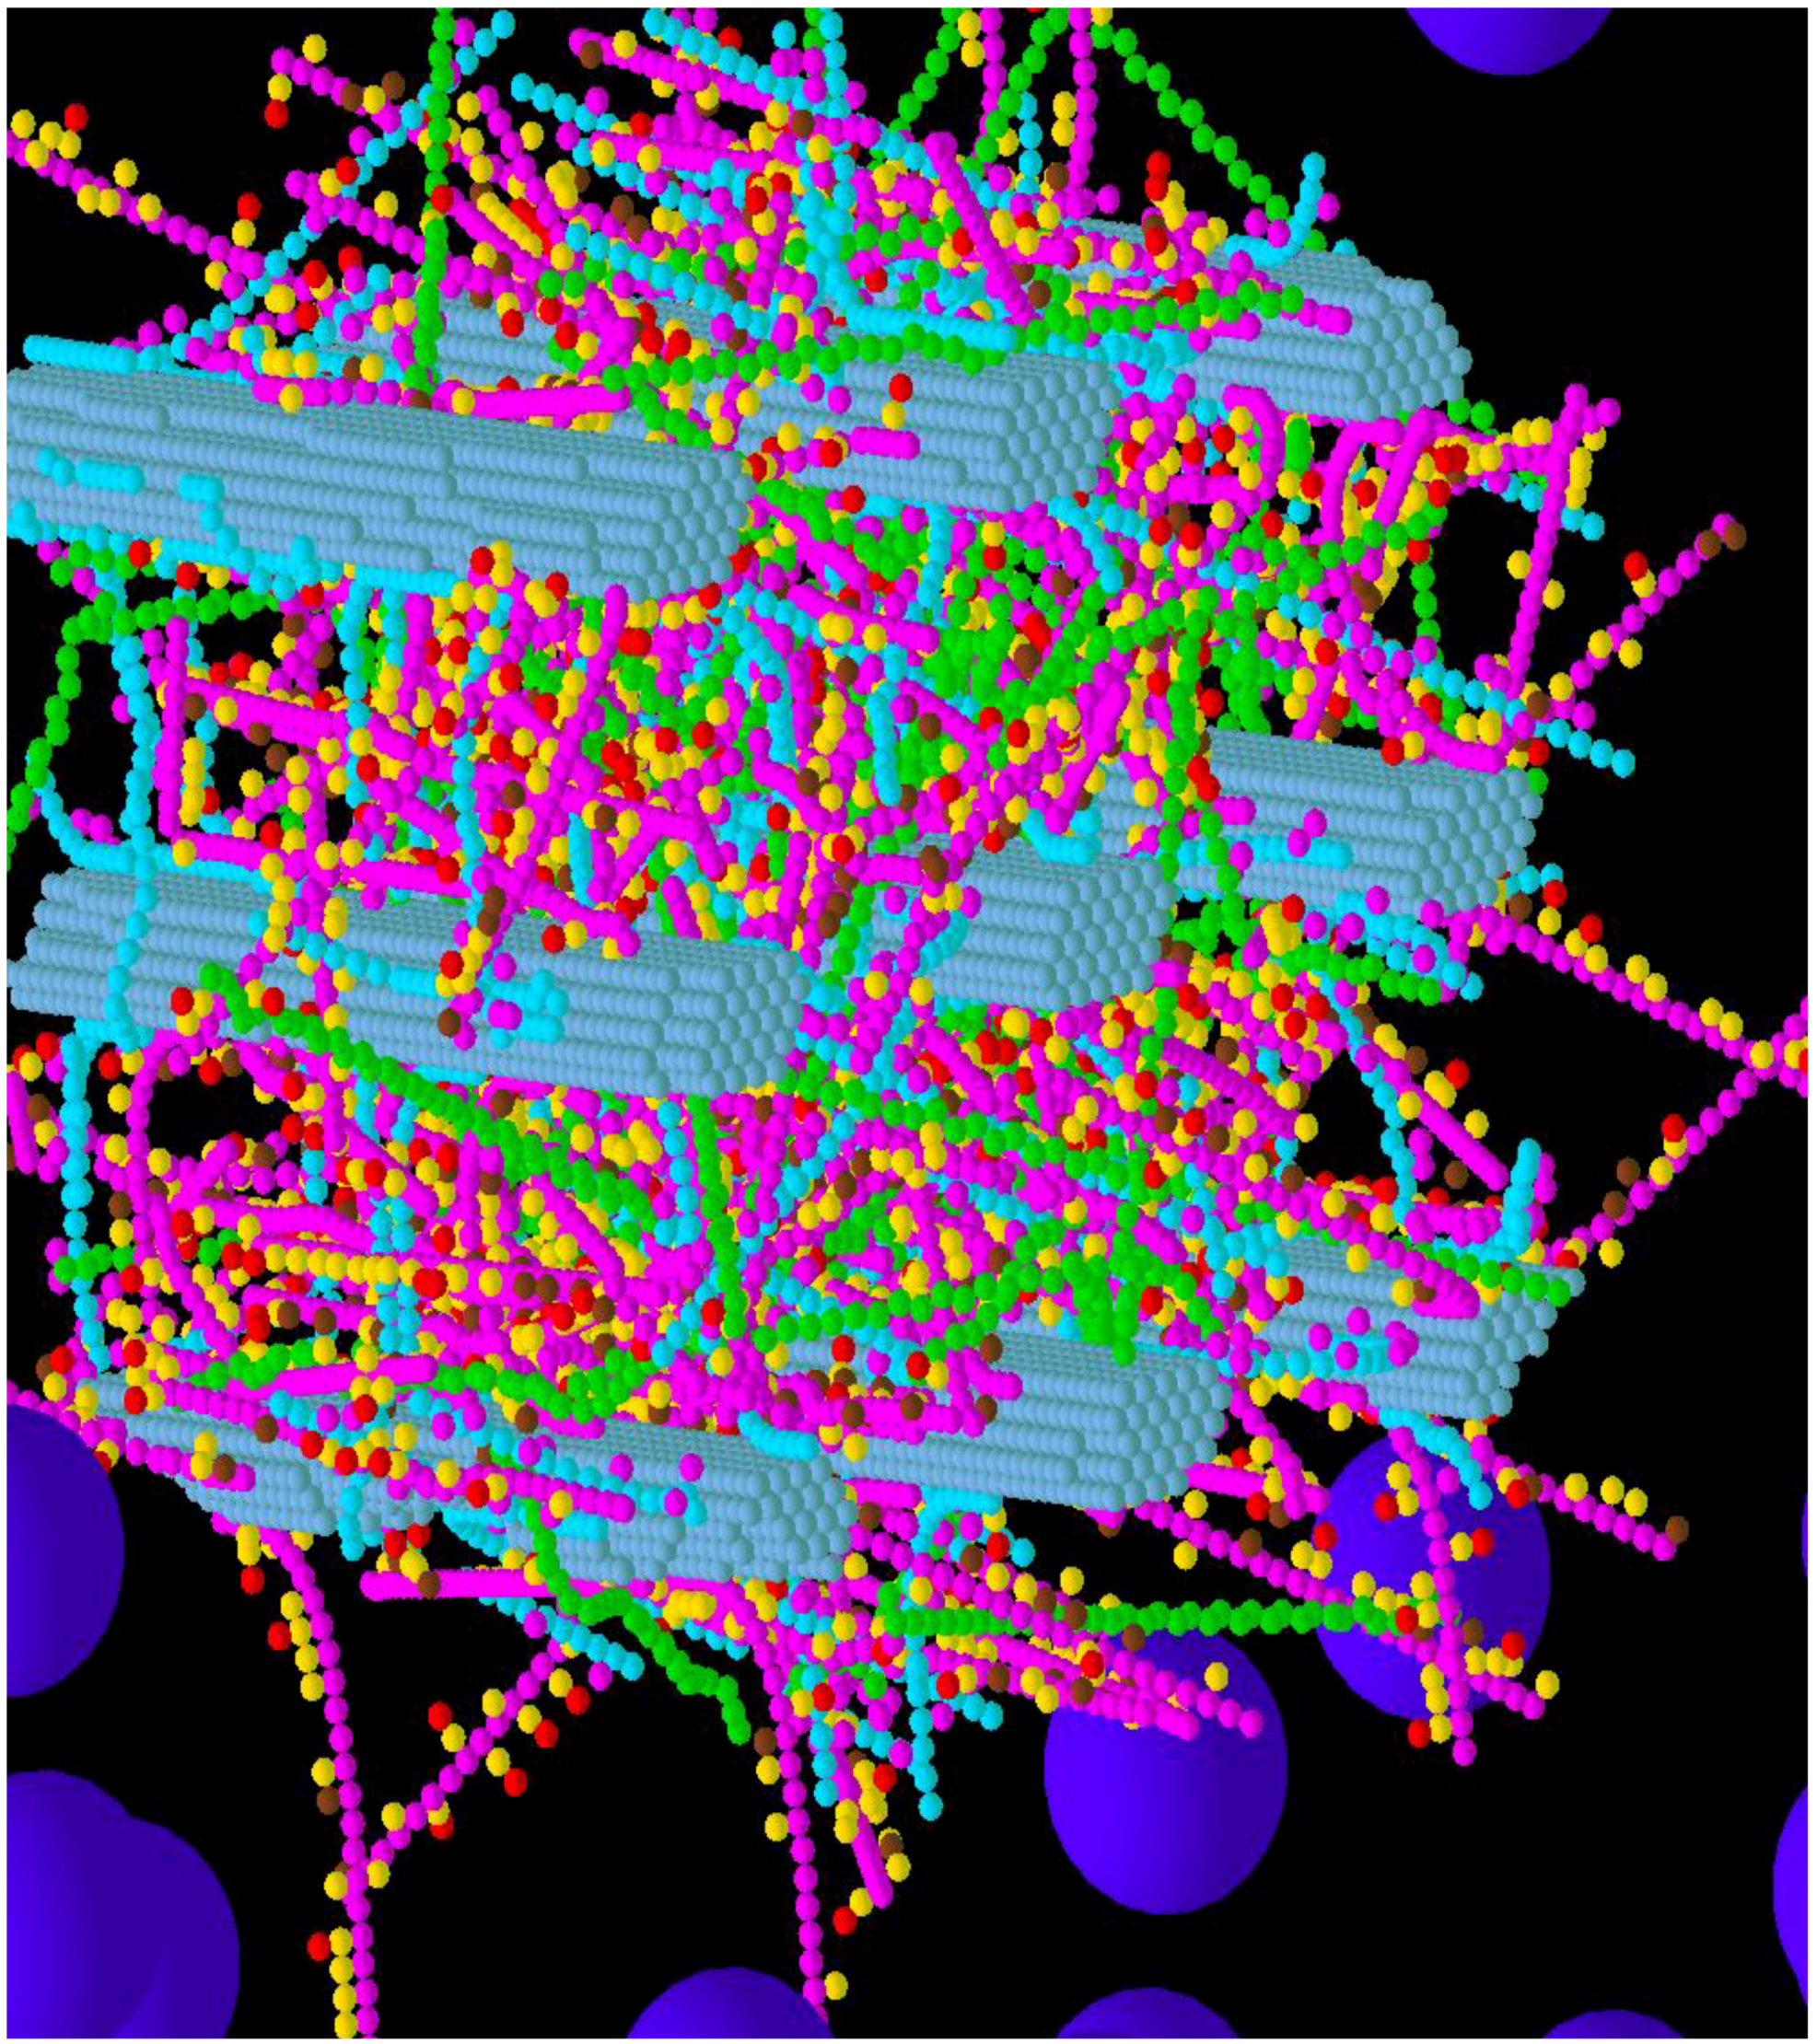
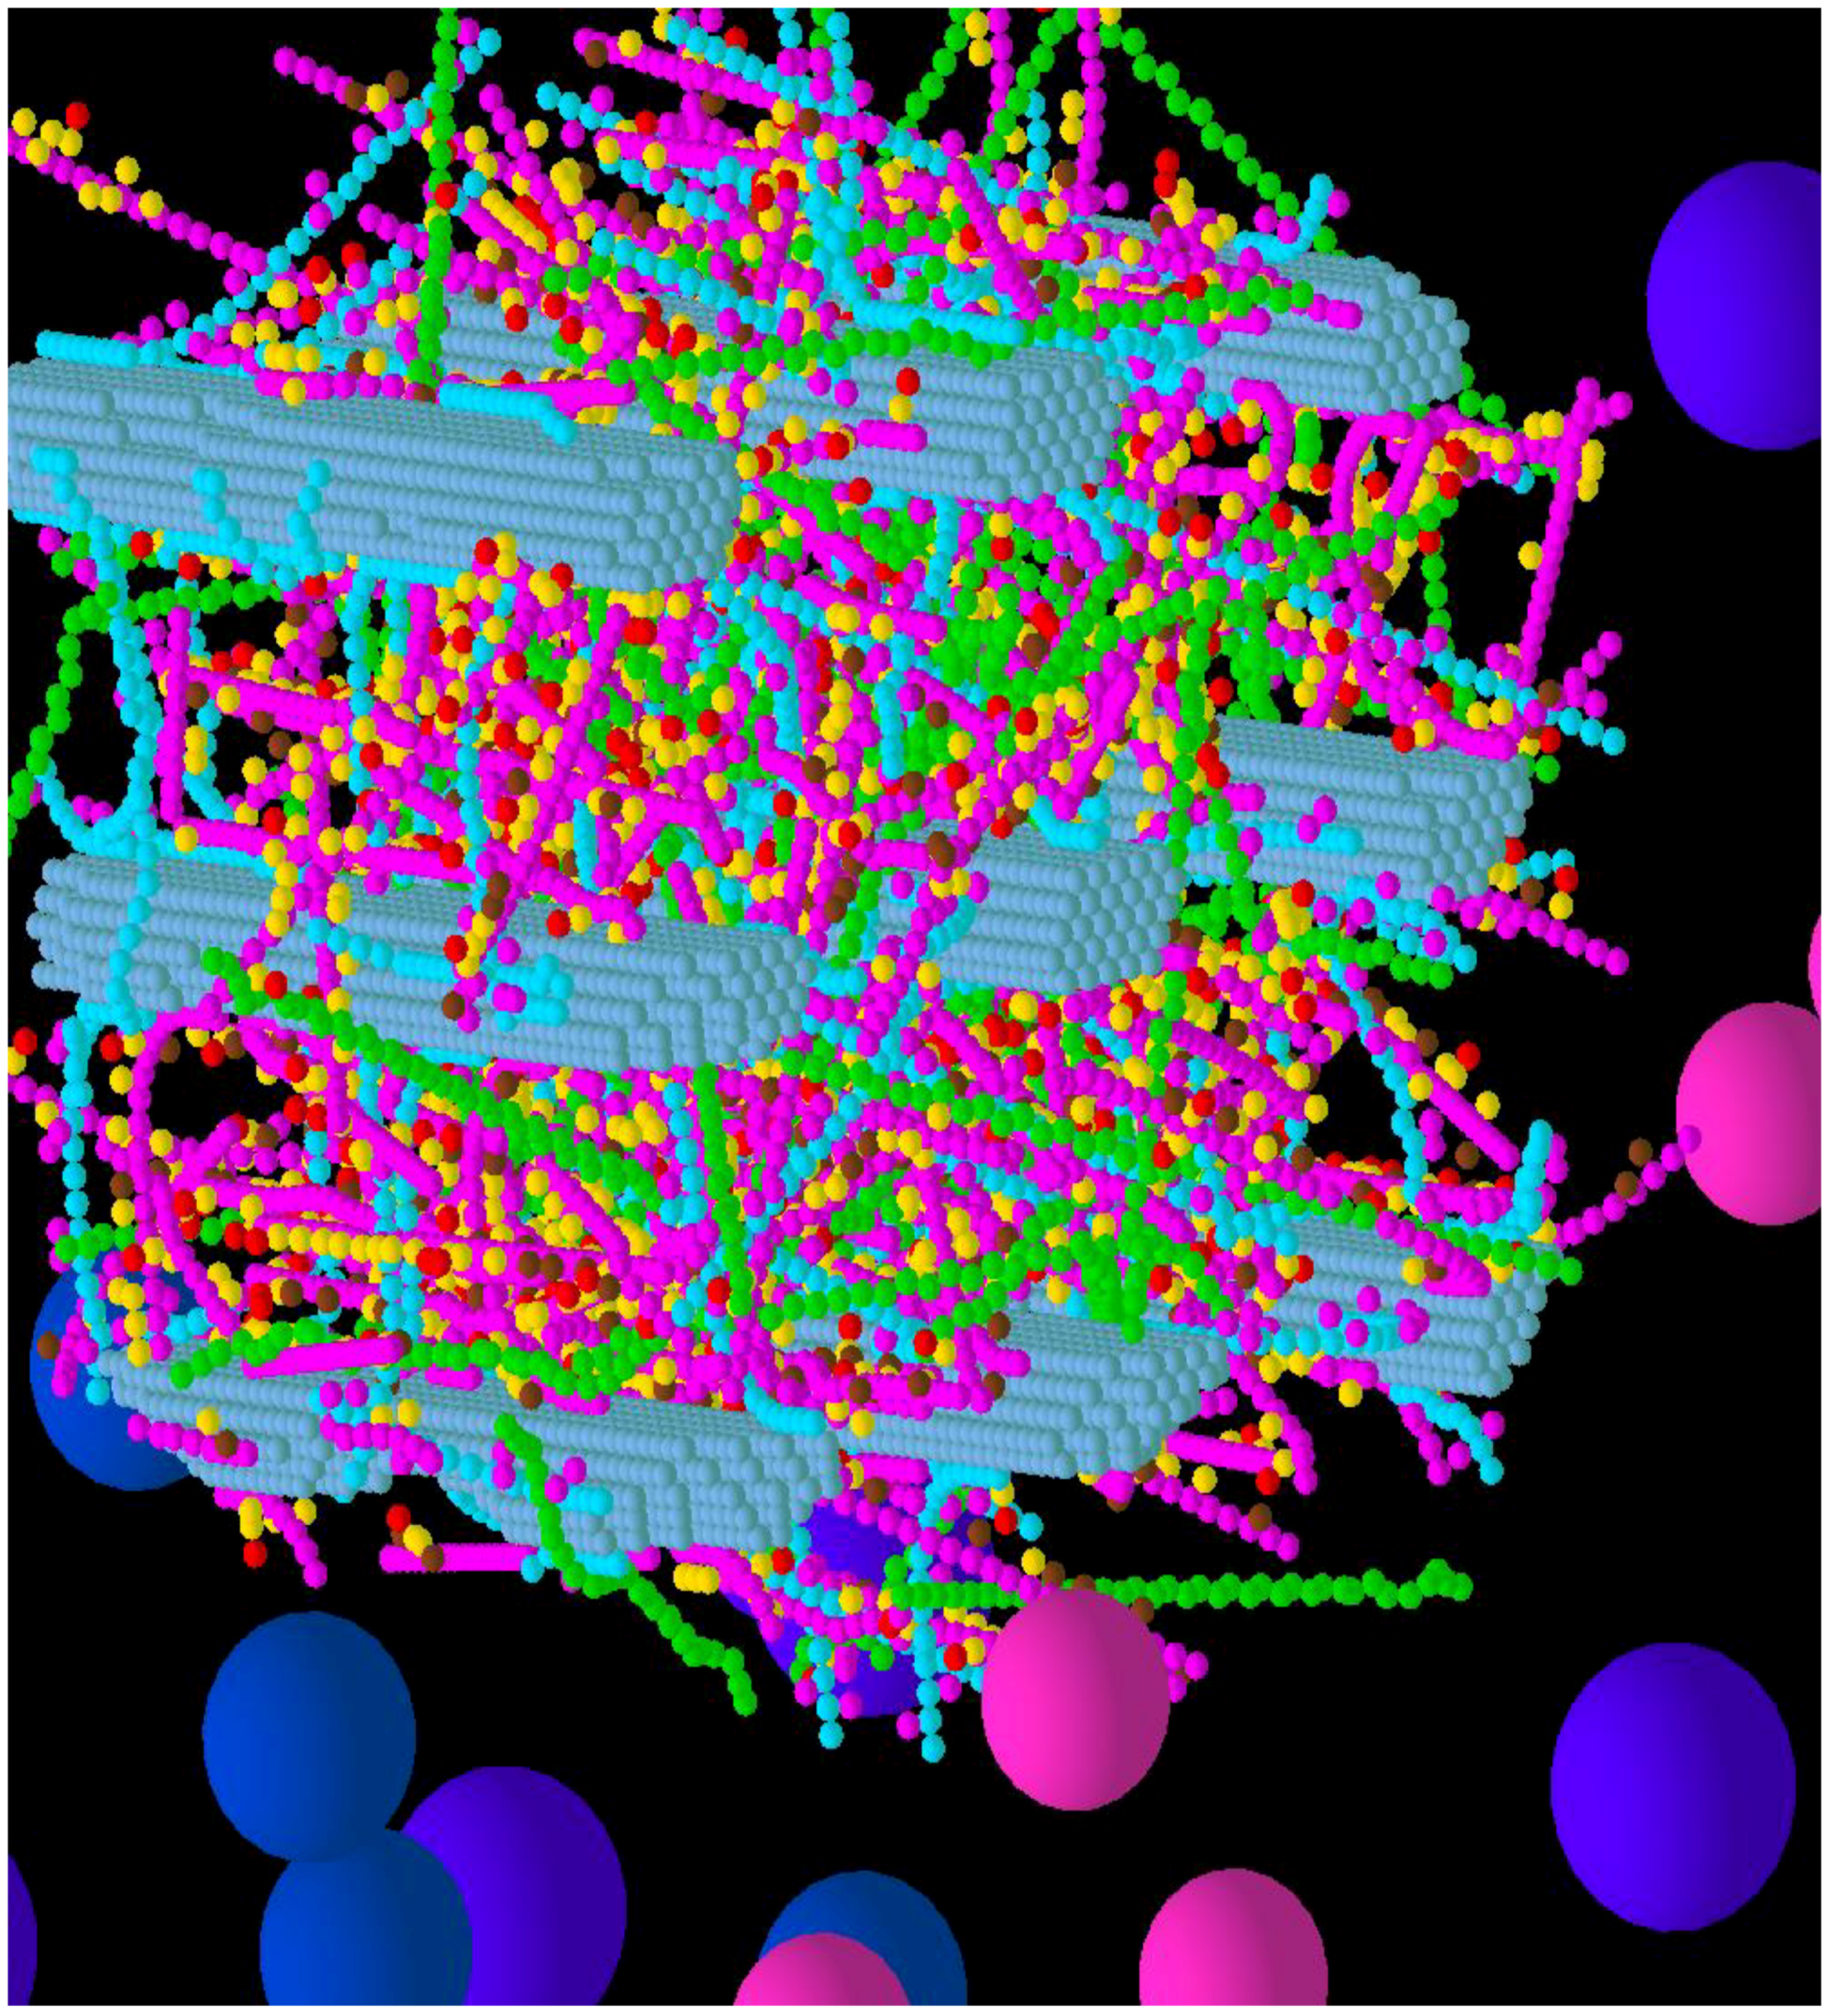
3.1. Construction of the Grass Primary Cell Wall


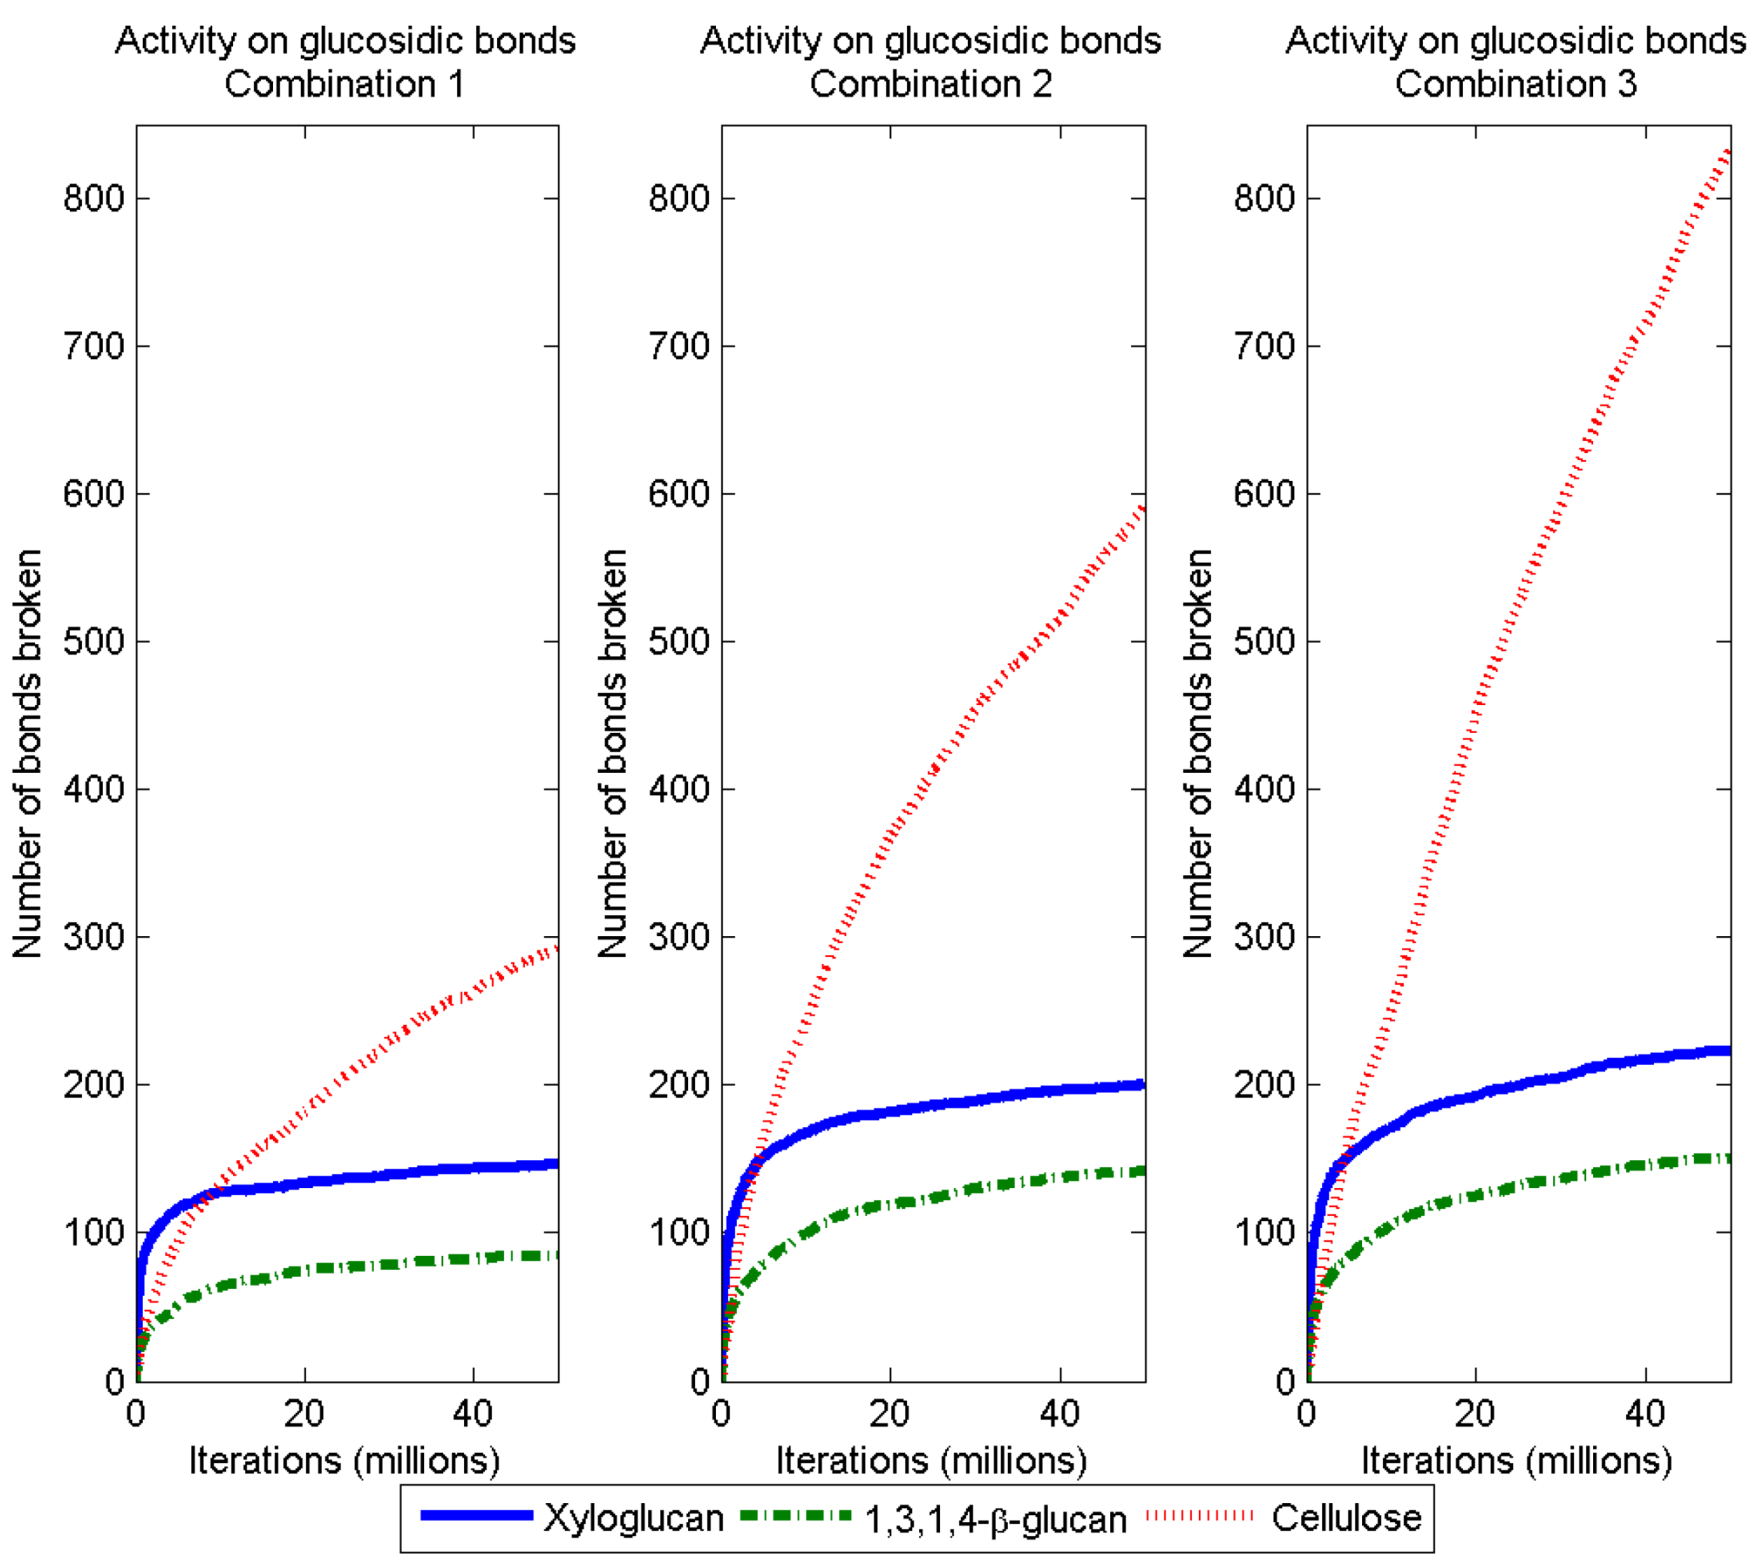
3.2. Simulation of Enzymatic Action


3.3. Considerations

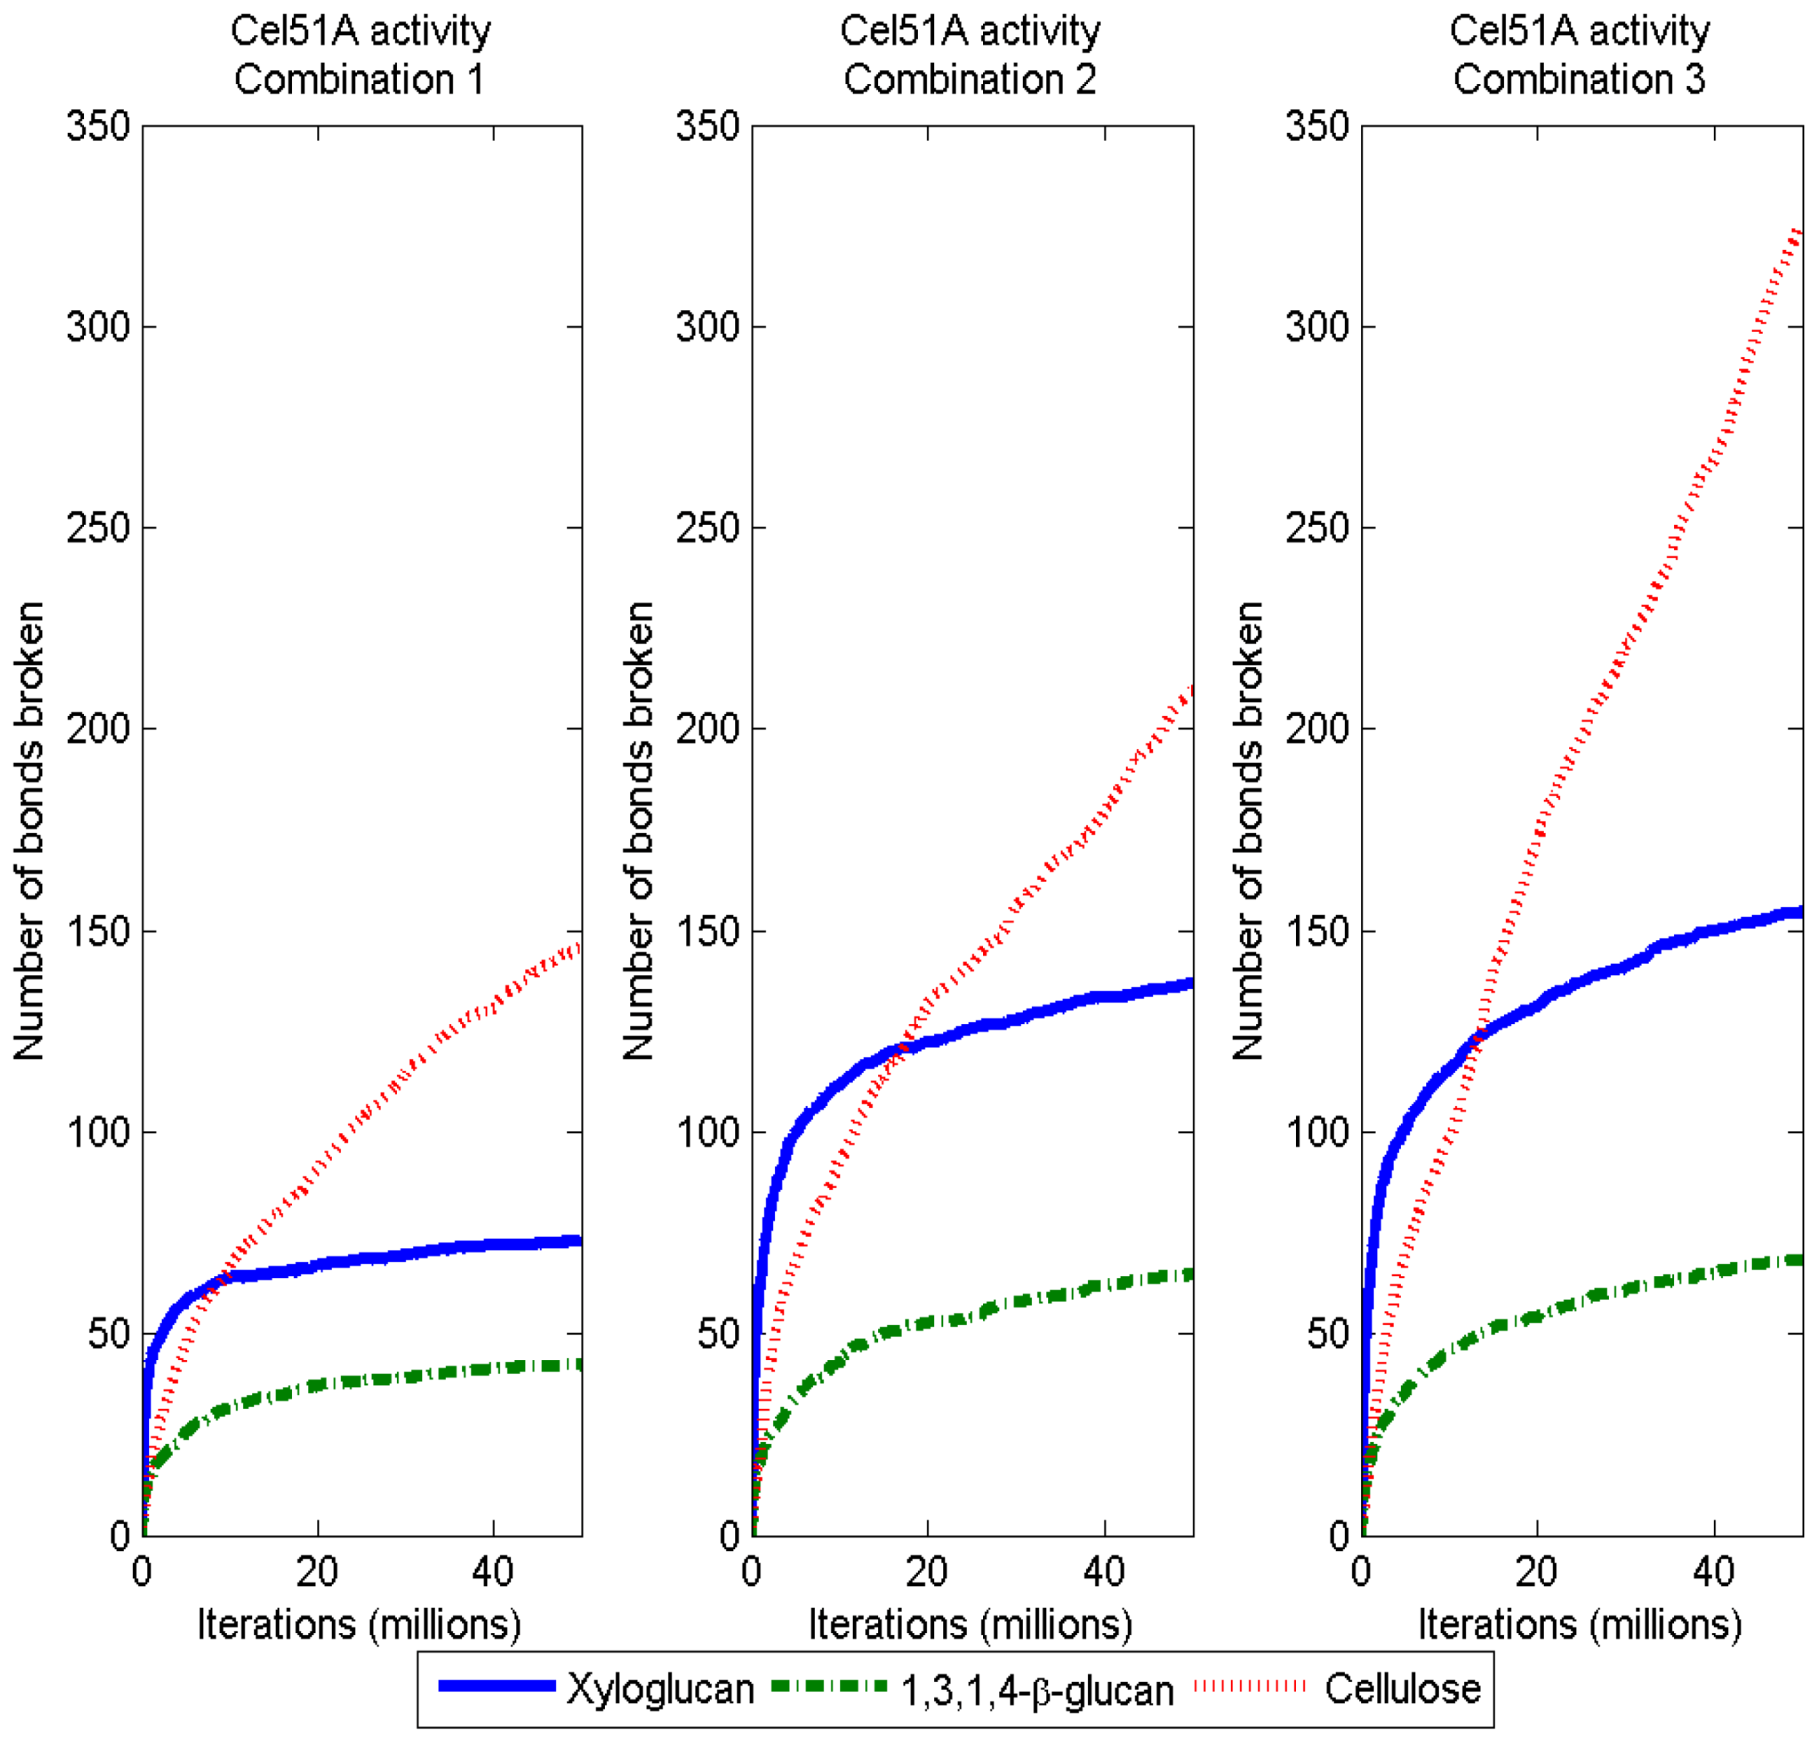
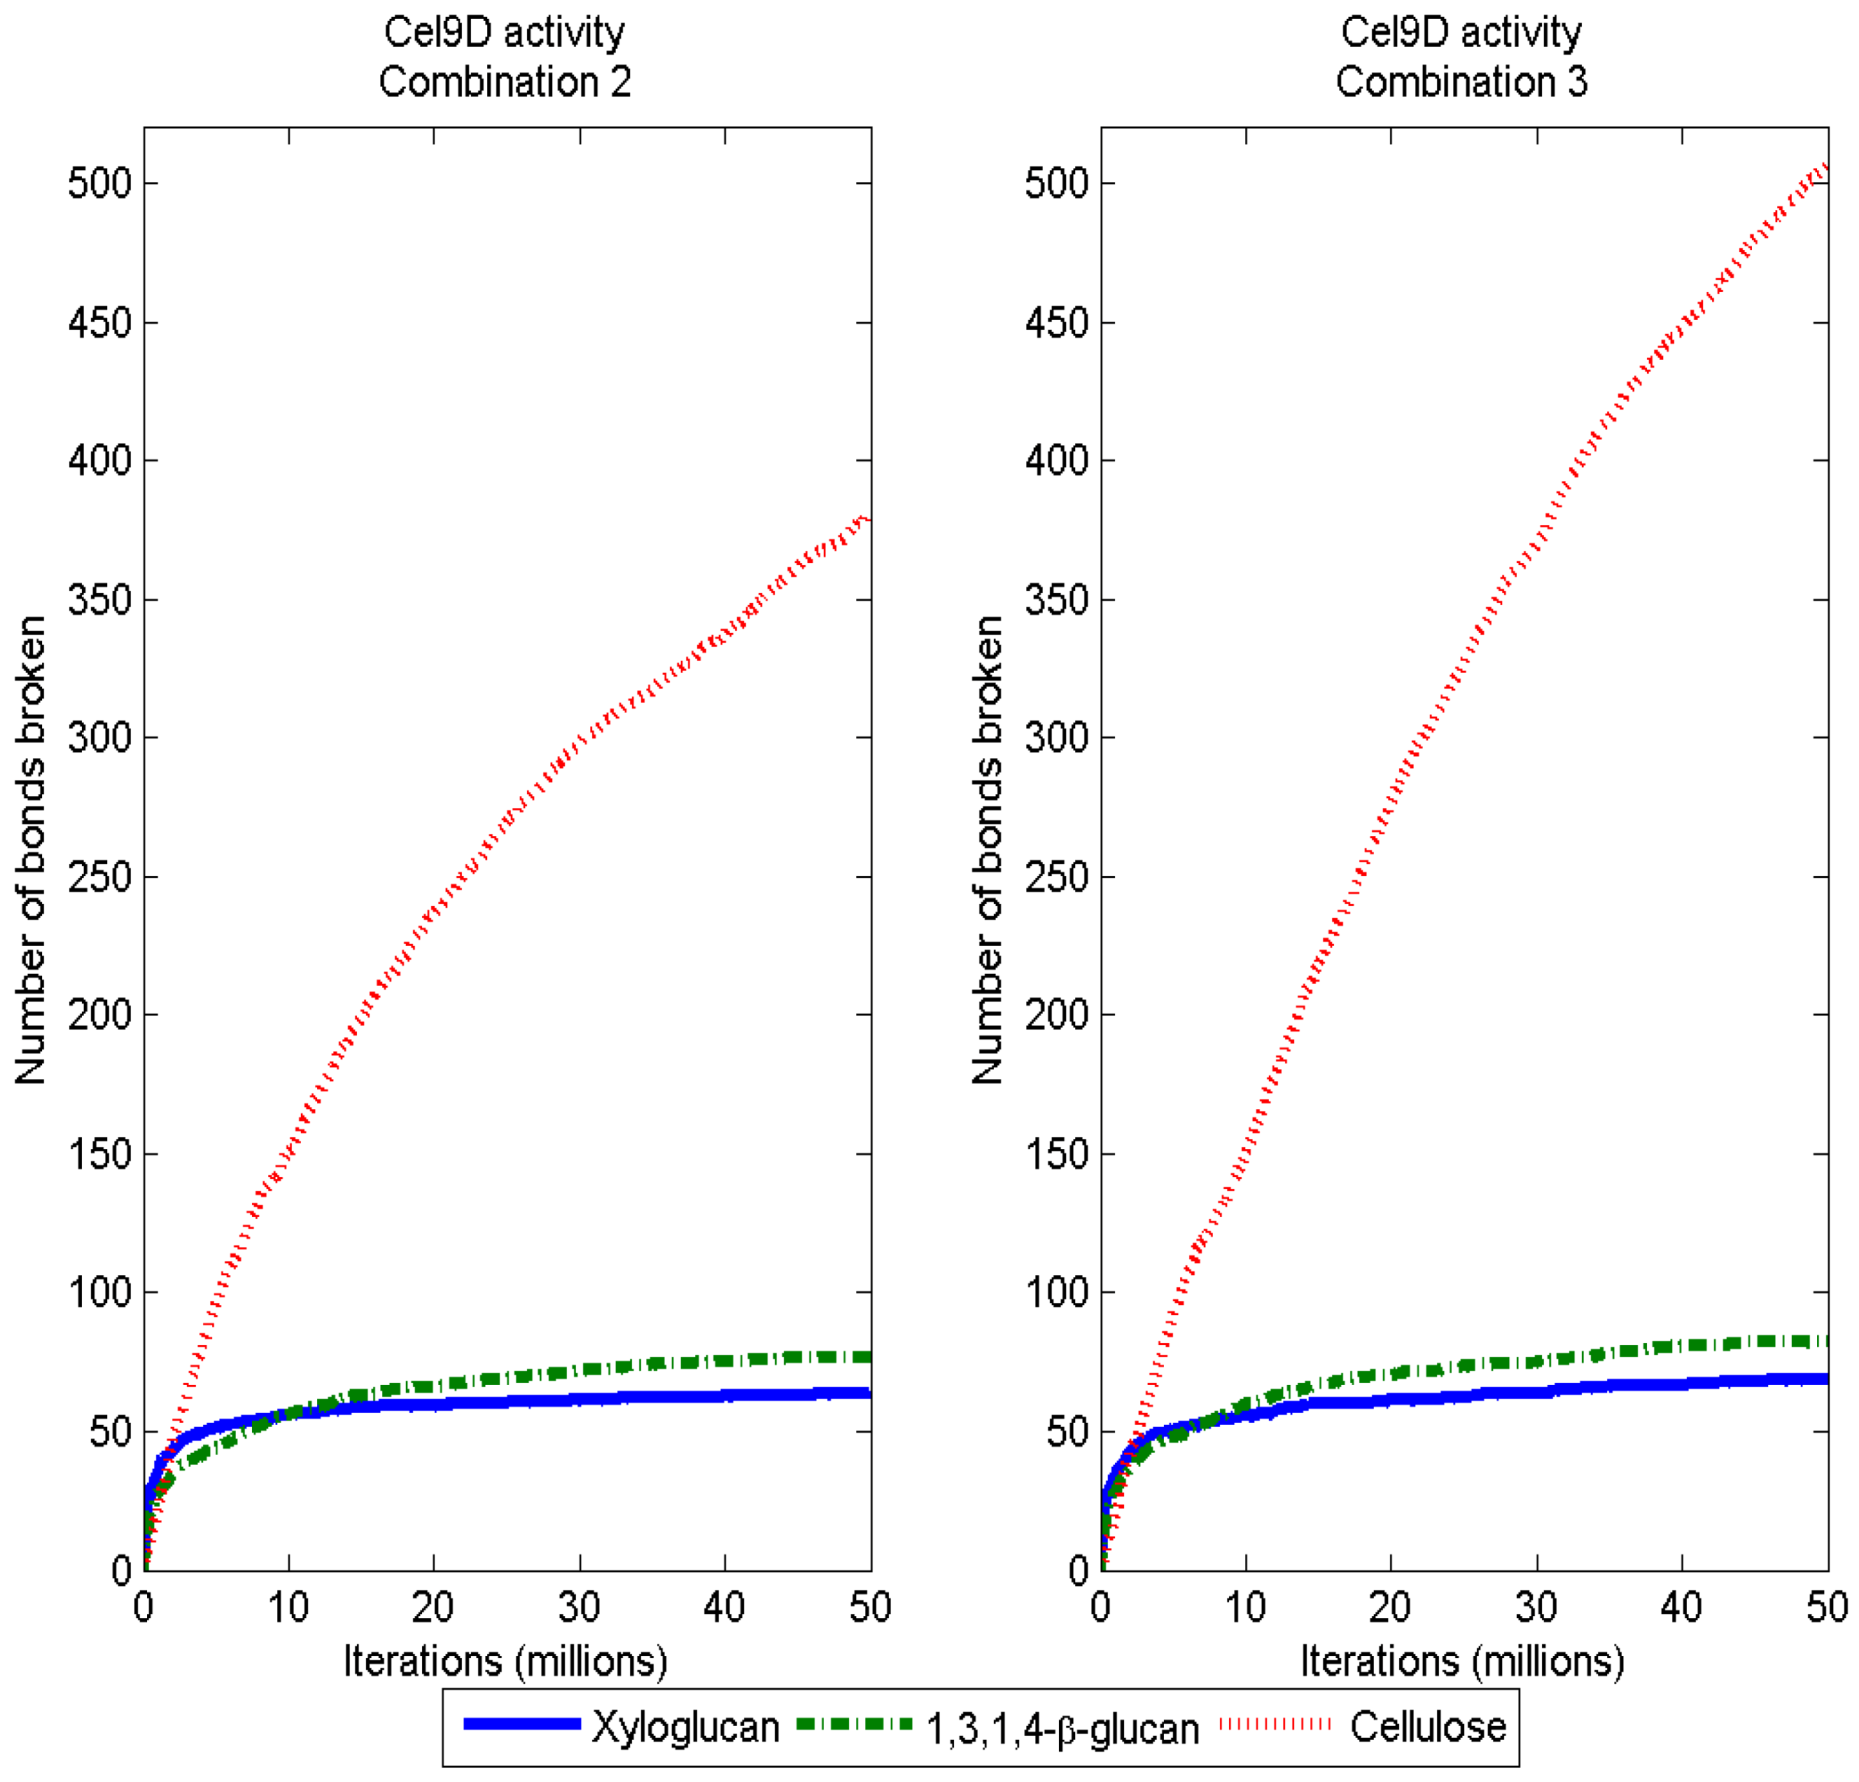
| Source polysaccharide | DP | Combination 1 | Combination 2 | Combination 3 | |||
|---|---|---|---|---|---|---|---|
| (1,3;1,4)-β-Glucan | 1 | 0.0 | (0) a,c | 76.8 | (6.5) a | 82.2 | (9.5) c |
| 2 | 10.3 | (6) | 7.6 | (4) | 9.7 | (4.6) | |
| 3 | 14.6 | (3) a,c | 9.6 | (2.2) a | 9.4 | (2.7) c | |
| 4 | 7.1 | (2.7) | 5.7 | (1.7) | 5.5 | (2.7) | |
| 5 | 5.3 | (2.1) | 3.5 | (2.6) | 3.5 | (2.5) | |
| 6 | 4.4 | (2.7) | 4.9 | (3.5) | 4.6 | (3.5) | |
| Cellulose | 1 | 0.0 | (0) a,c | 381.4 | (43.2) a,b | 506.0 | (43.1) b,c |
| 2 | 83.8 | (11.7) c | 68.0 | (14) b | 118.0 | (23.3) b,c | |
| 3 | 98.2 | (8.7) a | 53.8 | (17.2) a,b | 81.6 | (14.7) b | |
| 4 | 37.4 | (8.7) a | 25.2 | (5.1) a,b | 40.8 | (10.2) b | |
| 5 | 23.0 | (2.8) a | 14.8 | (3.4) a,b | 27.4 | (10.5) b | |
| 6 | 13.6 | (4.3) c | 17.0 | (6.6) | 27.4 | (8.8) c | |
| Xyloglucan | 1 | 0.0 | (0) a,c | 64.0 | (5.9) a | 68.8 | (8.1) c |
| 2 | 11.5 | (4.7) | 8.6 | (4.2) | 11.9 | (4.2) | |
| 3 | 27.2 | (1.5) a,c | 48.6 | (6.8) a | 54.2 | (6.9) c | |
| 4 | 46.6 | (5.8) a,c | 32.8 | (4.4) a | 35.6 | (6.4) c | |
| 5 | 24.2 | (3.7) a | 17.6 | (2.1) a | 20.4 | (2.1) | |
| 6 | 4.8 | (3.5) | 3.2 | (2.2) | 3.8 | (1.6) | |
| Glucosyl residues removed | 1592 | (51) | 1764 | (196) | 2350 | (228) | |
3.4. Refinement of the Model
4. Conclusions
Acknowledgments
Conflicts of Interest
References
- Edwards, J.E.; Huws, S.A.; Kim, E.J.; Lee, M.R.F.; Kingston-Smith, A.H.; Scollan, N.D. Advances in microbial ecosystem concepts and their consequences for ruminant agriculture. Animal 2008, 2, 653–660. [Google Scholar]
- Hungate, R.E. The Rumen and Its Microbes; Academic Press: New York, NY, USA, 1966. [Google Scholar]
- Krause, D.O.; Denman, S.E.; Mackie, R.I.; Morrison, M.; Rae, A.L.; Attwood, G.T.; McSweeney, C.S. Opportunities to improve fiber degradation in the rumen: Microbiology, ecology, and genomics. FEMS Microbiol. Rev. 2003, 27, 663–693. [Google Scholar] [CrossRef]
- Bacic, A.; Harris, P.J.; Stone, B.A. Structure and function of plant cell walls. In The Biochemistry of Plants. A Comprehensive Treatise; Preiss, J., Ed.; Academic Press: New York, NY, USA, 1988; Volume 14, pp. 297–372. [Google Scholar]
- Harris, P.J. Non-cellulosic polysaccharides in plant cell walls: Their diversity, organization and approaches to understanding their functions. In The Hemicelluloses Workshop; The Wood Technology Research Centre, University of Canterbury: Christchurch, New Zealand, 2005; pp. 13–35. [Google Scholar]
- Harris, P.J.; Stone, B.A. Chemistry and molecular organization of plant cell walls. In Biomass Recalcitrance: Deconstructing the Plant Cell Wall for Bioenergy; Himmel, M.E., Ed.; Blackwell Publishing Ltd.: Oxford, UK, 2008; pp. 61–93. [Google Scholar]
- Vanholme, R.; Demedts, B.; Morreel, K.; Ralph, J.; Boerjan, W. Lignin biosynthesis and structure. Plant Physiol. 2010, 153, 895–905. [Google Scholar] [CrossRef]
- Jørgensen, H.; Kristensen, J.B.; Felby, C. Enzymatic conversion of lignocellulose into fermentable sugars: Challenges and opportunities. Biofuels Bioprod. Biorefining 2007, 1, 119–134. [Google Scholar] [CrossRef]
- Carpita, N.C.; Gibeaut, D.M. Structural models of primary cell walls in flowering plants: Consistency of molecular structure with the physical properties of the walls during growth. Plant J. 1993, 3, 1–30. [Google Scholar] [CrossRef]
- Cosgrove, D.J. Growth of the plant cell wall. Nat. Rev. Mol. Cell Biol. 2005, 6, 850–861. [Google Scholar] [CrossRef]
- Ding, S.-Y.; Himmel, M.E. The maize primary cell wall microfibril: A new model derived from direct visualization. J. Agric. Food Chem. 2006, 54, 597–606. [Google Scholar]
- Harris, P.J. Diversity in plant cell walls. In Plant Diversity and Evolution: Genotypic and Phenotypic Variation in Higher Plants; Henry, R.J., Ed.; CAB International Publishing: Wallingford, Oxon, UK, 2005; pp. 201–227. [Google Scholar]
- Fincher, G.B. Exploring the evolution of (1,3;1,4)-β-d-glucans in plant cell walls: Comparative genomics can help! Curr. Opin. Plant Biol. 2009, 12, 140–147. [Google Scholar] [CrossRef]
- Harris, P.J.; Fincher, G.B. Distribution, fine structure and function of (1,3;1,4)-β-glucans in the grasses and other taxa. In Chemistry, Biochemistry, and Biology of (1→3)-β-Glucans and Related Polysaccharides; Bacic, A., Fincher, G.B., Stone, B.A., Eds.; Academic Press: San Diego, CA, USA, 2009; pp. 621–654. [Google Scholar]
- Carpita, N.C.; Defernez, M.; Findlay, K.; Wells, B.; Shoue, D.A.; Catchpole, G.; Wilson, R.H.; McCann, M.C. Cell wall architecture of the elongating maize coleoptile. Plant Physiol. 2001, 127, 551–565. [Google Scholar] [CrossRef]
- Bunzel, M. Chemistry and occurrence of hydroxycinnamate oligomers. Phytochem. Rev. 2010, 9, 47–64. [Google Scholar] [CrossRef]
- Ralph, J.; Bunzel, M.; Marita, J.M.; Hatfield, R.D.; Lu, F.; Kim, H.; Schatz, P.F.; Grabber, J.H.; Steinhart, H. Peroxidase-dependent cross-linking reactions of p-hydroxycinnamates in plant cell walls. Phytochem. Rev. 2004, 3, 79–96. [Google Scholar] [CrossRef]
- Wei, H.; Xu, Q.; Taylor, L.E., II; Baker, J.O.; Tucker, M.P.; Ding, S.-Y. Natural paradigms of plant cell wall degradation. Curr. Opin. Biotechnol. 2009, 20, 330–338. [Google Scholar] [CrossRef]
- Mayorga, O.L.; Huws, S.A.; Kim, E.J.; Kingston-Smith, A.H.; Newbold, C.J.; Theodorou, M.K. The occurrence of biofilm communities in the rumen. In Biofilms: Coming of Age; Gilbert, P., Allison, D., Brading, M., Pratten, J., Spratt, D., Upton, M., Eds.; The Biofilm Club: Manchester, UK, 2007; pp. 119–130. [Google Scholar]
- Chesson, A.; Forsberg, C.W. Polysaccharide degradation by rumen microorganisms. In The Rumen Microbial Ecosystem; Hobson, P.N., Stewart, C.S., Eds.; Chapman and Hall: London, UK, 1997; pp. 329–381. [Google Scholar]
- Flint, H.J.; Bayer, E.A.; Rincon, M.T.; Lamed, R.; White, B.A. Polysaccharide utilization by gut bacteria: Potential for new insights from genomic analysis. Nat. Rev. Microbiol. 2008, 6, 121–131. [Google Scholar] [CrossRef]
- Morrison, M.; Pope, P.B.; Denman, S.E.; McSweeney, C.S. Plant biomass degradation by gut microbiomes: More of the same or something new? Curr. Opin. Biotechnol. 2009, 20, 358–363. [Google Scholar] [CrossRef]
- Selinger, L.B.; Forsberg, C.W.; Cheng, K.J. The rumen: A unique source of enzymes for enhancing livestock production. Anaerobe 1996, 2, 263–284. [Google Scholar] [CrossRef]
- Wilson, D.B. Three microbial strategies for plant cell wall degradation. Ann. N. Y. Acad. Sci. 2008, 1125, 289–297. [Google Scholar] [CrossRef]
- Bannink, A.; de Visser, H.; van Vuuren, A.M. Comparison and evaluation of mechanistic rumen models. Br. J. Nutr. 1997, 78, 563–581. [Google Scholar] [CrossRef]
- Dijkstra, J.; France, J. A comparative evaluation of models of whole rumen function. Ann. Zootech. 1996, 45, 175–192. [Google Scholar] [CrossRef]
- Dijkstra, J.; Kebreab, E.; Mills, J.A.N.; Pellikaan, W.F.; Lopez, S.; Bannink, A.; France, J. Predicting the profile of nutrients available for absorption: From nutrient requirement to animal response and environmental impact. Anim. Feed Sci. Technol. 2007, 1, 99–111. [Google Scholar]
- Offner, A.; Sauvant, D. Comparative evaluation of the Molly, CNCPS and LES rumen models. Anim. Feed Sci. Technol. 2004, 112, 107–130. [Google Scholar] [CrossRef]
- Levine, S.E.; Fox, J.M.; Blanch, H.W.; Clark, D.S. A mechanistic model of the enzymatic hydrolysis of cellulose. Biotechnol. Bioeng. 2010, 107, 37–51. [Google Scholar] [CrossRef]
- Hosseini, S.A.; Shah, N. Modelling enzymatic hydrolysis of cellulose part I: Population balance modelling of hydrolysis by endoglucanase. Biomass Bioenergy 2011, 35, 3841–3848. [Google Scholar] [CrossRef]
- Ye, Z.; Berson, R.E. Kinetic modeling of cellulosehydrolysis with first order inactivation of adsorbed cellulase. Bioresour. Technol. 2011, 102, 11194–11199. [Google Scholar] [CrossRef]
- Khodaverdi, M.; Jeihanipour, A.; Karimi, K.; Taherzadeh, M.J. Kinetic modeling of rapid enzymatic hydrolysis of crystalline cellulose after pretreatment by NMMO. J. Ind. Microbiol. Biotechnol. 2012, 39, 429–438. [Google Scholar] [CrossRef]
- Griggs, A.J.; Stickel, J.J. A mechanistic model for enzymatic saccharification of cellulose using continuous distribution kinetics I: Depolymerization by EGI and CBHI. Biotechnol. Bioeng. 2012, 109, 665–675. [Google Scholar] [CrossRef]
- Griggs, A.J.; Stickel, J.J. A mechanistic model for enzymatic saccharification of cellulose using continuous distribution kinetics II: Cooperative enzyme action, solution kinetics, and product inhibition. Biotechnol. Bioeng. 2012, 109, 676–685. [Google Scholar] [CrossRef]
- Zhang, Y.-H.P.; Lynd, L.R. Towards an aggregated understanding of enzymatic hydrolysis of cellulose: Noncomplexed cellulase systems. Biotechnol. Bioeng. 2004, 88, 797–824. [Google Scholar] [CrossRef]
- Andronico, A.; Randall, A.; Benz, R.W.; Baldi, P. Data-driven high-throughput prediction of the 3-D structure of small molecules: Review and progress. J. Chem. Inf. Model. 2011, 51, 760–776. [Google Scholar] [CrossRef]
- Klepeis, J.L.; Lindorff-Larsen, K.; Dror, R.O.; Shaw, D.E. Long-timescale molecular dynamics simulations of protein structure and function. Curr. Opin. Struct. Biol. 2009, 19, 120–127. [Google Scholar] [CrossRef]
- Scheraga, H.A.; Khalili, M.; Liwo, A. Overview of molecular simulation techniques. Annu. Rev. Phys. Chem. 2007, 58, 57–83. [Google Scholar] [CrossRef]
- Stansfeld, P.J.; Sansom, M.S.P. Molecular simulation approaches to membrane proteins. Structure 2011, 19, 1562–1572. [Google Scholar] [CrossRef]
- Woodley, S.M.; Catlow, R. Crystal structure prediction from first principles. Nat. Mater. 2008, 7, 937–946. [Google Scholar] [CrossRef]
- Sangha, A.K.; Petridis, L.; Smith, J.C.; Ziebell, A.; Parks, J.M. Molecular simulation as a tool for studying lignin. Environ. Prog. Sustain. Energy 2012, 31, 47–54. [Google Scholar] [CrossRef]
- Baird, M.S.; O’Sullivan, A.C.; Banks, W.B. A native cellulose microfibril model. Cellulose 1998, 5, 89–111. [Google Scholar]
- Baird, M.S.; Hamlin, J.D.; O’Sullivan, A.; Whiting, A. An insight into the mechanism of the cellulose dyeing process: Molecular modelling and simulations of cellulose and its interactions with water, urea, aromatic azo-dyes and aryl ammonium compounds. Dyes Pigments 2008, 76, 406–416. [Google Scholar] [CrossRef]
- Bellesia, G.; Asztalos, A.; Shen, T.; Langan, P.; Redondo, A.; Gnanakaran, S. In silico studies of crystalline cellulose and its degradation by enzymes. Acta Crystallogr. 2010, D66, 1184–1188. [Google Scholar]
- Beckham, G.T.; Bomble, Y.J.; Bayer, E.A.; Himmel, M.E.; Crowley, M.F. Applications of computational science for understanding enzymatic deconstruction of cellulose. Curr. Opin. Biotechnol. 2011, 22, 231–238. [Google Scholar] [CrossRef]
- Warden, A.C.; Little, B.A.; Haritos, V.S. A cellular automaton model of crystalline cellulose hydrolysis by cellulases. Biotechnol. Biofuels 2011, 4, 39. [Google Scholar] [CrossRef]
- Asztalos, A.; Daniels, M.; Sethi, A.; Shen, T.; Langan, P.; Redondo, A.; Gnanakaran, S. A coarse-grained model for synergistic action of multiple enzymes on cellulose. Biotechnol. Biofuels 2012, 5, 55. [Google Scholar]
- Kha, H.; Tuble, S.C.; Kalyanasundaram, S.; Williamson, R.E. Wallgen, software to construct layered cellulose-hemicellulose networks and predict their small deformation mechanics. Plant Physiol. 2012, 152, 774–786. [Google Scholar]
- Yi, H.; Puri, V.M. Architecture-based multiscale computational modeling of plant cell wall mechanics to examine the hydrogen-bonding hypothesis of the cell wall network structure model. Plant Physiol. 2012, 160, 1281–1292. [Google Scholar] [CrossRef]
- Macall, C.M.; North, M.J. Tutorial on agent-based modelling and simulation. J. Simul. 2010, 4, 151–162. [Google Scholar] [CrossRef]
- Niazi, M.; Hussain, A. Agent-based computing from multi-agent systems to agent-based models: A visual survey. Scientometrics 2011, 89, 479–499. [Google Scholar] [CrossRef]
- Hellweger, F.L.; Bucci, V. A bunch of tiny individuals—Individual-based modeling for microbes. Ecol. Model. 2009, 220, 8–22. [Google Scholar] [CrossRef]
- Xavier, J.B.; Picioreanu, C.; van Loosdrecht, M.C.M. A framework for multidimensional modelling of activity and structure of multispecies biofilms. Environ. Microbiol. 2005, 7, 1085–1103. [Google Scholar] [CrossRef]
- Baldazzi, V.; Castiglione, F.; Bernaschi, M. An enhanced agent based model of the immune system response. Cell. Immunol. 2006, 244, 77–79. [Google Scholar] [CrossRef]
- Davies, R. Documentation for Newmat11, a Matrix Library in C++; Statistics Research Associates Limited: Wellington, New Zealand, 2008. [Google Scholar]
- FreeGLUT. The free opengl utility toolkit. Available online: http://freeglut.sourceforge.net/ (accessed on 12 April 2012).
- Teschner, M.; Kimmerle, S.; Heidelberger, B.; Zachmann, G.; Raghupathi, L.; Fuhrmann, A.; Cani, M.-P.; Faure, F.; Magnenat-Thalmann, N.; Strasser, W.; et al. Collision detection for deformable objects. Comput. Graph. Forum 2005, 24, 61–81. [Google Scholar] [CrossRef]
- Lucchesis, B.J. A parallel linear octree collision algorithm. M.Sc. Thesis, University of Nevada, Reno, NV, USA, 2002. [Google Scholar]
- Jacobs, W. Opengl tutorial. Lesson 10: Collision detection. Available online: http://www.videotutorialsrock.com/opengl_tutorial/collision_detection/home.php (accessed on 23 March 2011).
- Chesson, A.; Gordon, A.H.; Lomax, J.A. Methylation analysis of mesophyll, epidermis, and fibre cell-walls isolated from the leaves of perennial and Italian ryegrass. Carbohydr. Res. 1985, 141, 137–147. [Google Scholar] [CrossRef]
- Chesson, A.; Gordon, A.H.; Scobbie, L. Pectic polysaccharides of mesophyll cell walls of perennial ryegrass leaves. Phytochemistry 1995, 38, 579–583. [Google Scholar] [CrossRef]
- Gordon, A.H.; Lomax, J.A.; Dalgarno, K.; Chesson, A. Preparation and composition of mesophyll, epidermis and fibre cell walls from leaves of perennial ryegrass (Lolium perenne) and Italian ryegrass (Lolium multiforum). J. Sci. Food Agric. 1985, 36, 509–519. [Google Scholar] [CrossRef]
- Smith, B.G.; Harris, P.J.; Melton, L.D.; Newman, R.H. Crystalline cellulose in hydrated primary cell walls of three monocotyledons and one dicotyledon. Plant Cell Physiol. 1998, 39, 711–720. [Google Scholar] [CrossRef]
- Newman, R.H.; Hill, S.J.; Harris, P.J. Wide-angle X-ray scattering and solid-state nuclear magnetic resonance data combined to test models for cellulose microfibrils in mung bean cell walls. Plant Physiol. 2013, 163, 1558–1567. [Google Scholar] [CrossRef]
- Xu, P.; Donaldson, L.A.; Gergely, Z.R.; Staehelin, L.A. Dual-axis electron tomography: A new approach for investigating the spatial organization of wood cellulose microfibrils. Wood Sci. Technol. 2007, 41, 101–116. [Google Scholar] [CrossRef]
- Paavilainen, S.; Róg, T.; Vattulainen, I. Analysis of twisting of cellulose nanofibrils in atomistic molecular dynamics simulations. J. Phys. Chem. B 2011, 115, 3747–3755. [Google Scholar] [CrossRef]
- Ciesielski, P.N.; Matthews, J.F.; Tucker, M.P.; Beckham, G.T.; Crowley, M.F.; Himmel, M.E.; Donohoe, B.S. 3D electron tomography of pretreated biomass informs atomic modeling of cellulose microfibrils. ACS Nano 2013, 7, 8011–8019. [Google Scholar] [CrossRef]
- French, A.D.; Johnson, G.P. Cellulose and the twofold screw axis: Modeling and experimental arguments. Cellulose 2009, 16, 959–973. [Google Scholar] [CrossRef]
- Qi, M.; Jun, H.S.; Forsberg, C.W. Cel9d, an atypical 1,4-β-d-glucan glucohydrolase from Fibrobacter succinogenes: Characteristics, catalytic residues, and synergistic interactions with other cellulases. J. Bacteriol. 2008, 190, 1976–1984. [Google Scholar] [CrossRef]
- Qi, M.; Jun, H.S.; Forsberg, C.W. Characterization and synergistic interactions of Fibrobacter succinogenes glycoside hydrolases. Appl. Environ. Microbiol. 2007, 73, 6098–6105. [Google Scholar] [CrossRef]
- Matte, A.; Forsberg, C.W. Purification, characterization, and mode of action of endoxylanases 1 and 2 from Fibrobacter succinogenes S85. Appl. Environ. Microbiol. 1992, 58, 157–168. [Google Scholar]
- Forano, E.; Delort, A.-M.; Matulova, M. Carbohydrate metabolism in Fibrobacter succinogenes: What NMR tells us. Microb. Ecol. Health Dis. 2008, 20, 94–102. [Google Scholar] [CrossRef]
- Hespell, R.B.; Wolf, R.; Bothast, R.J. Fermentation of xylans by Butyrivibrio fibrisolvens and other ruminal bacteria. Appl. Environ. Microbiol. 1987, 53, 2849–2853. [Google Scholar]
- Kelly, W.J.; Leahy, S.C.; Altermann, E.; Yeoman, C.J.; Dunne, J.C.; Kong, Z.; Pacheco, D.M.; Li, D.; Noel, S.J.; Moon, C.D.; et al. The glycobiome of the rumen bacterium Butyrivibrio proteoclasticus B316T highlights adaptation to a polysaccharide-rich environment. PLoS One 2010, 5, e11942. [Google Scholar] [CrossRef]
- Brummell, D.A. Cell wall disassembly in ripening fruit. Funct. Plant Biol. 2006, 33, 103–119. [Google Scholar] [CrossRef]
- Johnston, J.W.; Gunaseelan, K.; Pidakala, P.; Wang, M.; Schaffer, R.J. Co-ordination of early and late ripening events in apples is regulated through differential sensitivities to ethylene. J. Exp. Bot. 2009, 60, 2689–2699. [Google Scholar] [CrossRef]
- Tacken, E.; Ireland, H.; Gunaseelan, K.; Karunairetnam, S.; Wang, D.; Schultz, K.; Bowen, J.; Atkinson, R.G.; Johnston, J.W.; Putterill, J.; et al. The role of ethylene and cold temperature in the regulation of the apple polygalacturonase1 gene and fruit softening. Plant Physiol. 2010, 153, 294–305. [Google Scholar] [CrossRef]
© 2014 by the authors; licensee MDPI, Basel, Switzerland. This article is an open access article distributed under the terms and conditions of the Creative Commons Attribution license (http://creativecommons.org/licenses/by/3.0/).
Share and Cite
Vetharaniam, I.; Kelly, W.J.; Attwood, G.T.; Harris, P.J. A 3-D Model of a Perennial Ryegrass Primary Cell Wall and Its Enzymatic Degradation. Computation 2014, 2, 23-46. https://doi.org/10.3390/computation2020023
Vetharaniam I, Kelly WJ, Attwood GT, Harris PJ. A 3-D Model of a Perennial Ryegrass Primary Cell Wall and Its Enzymatic Degradation. Computation. 2014; 2(2):23-46. https://doi.org/10.3390/computation2020023
Chicago/Turabian StyleVetharaniam, Indrakumar, William J. Kelly, Graeme T. Attwood, and Philip J. Harris. 2014. "A 3-D Model of a Perennial Ryegrass Primary Cell Wall and Its Enzymatic Degradation" Computation 2, no. 2: 23-46. https://doi.org/10.3390/computation2020023