Multiscale Modeling of the Early CD8 T-Cell Immune Response in Lymph Nodes: An Integrative Study

Abstract
:1. Introduction

2. Experimental Section
3. Multiscale Model
3.1. Subcellular Level


| Description | Reference | |
|---|---|---|
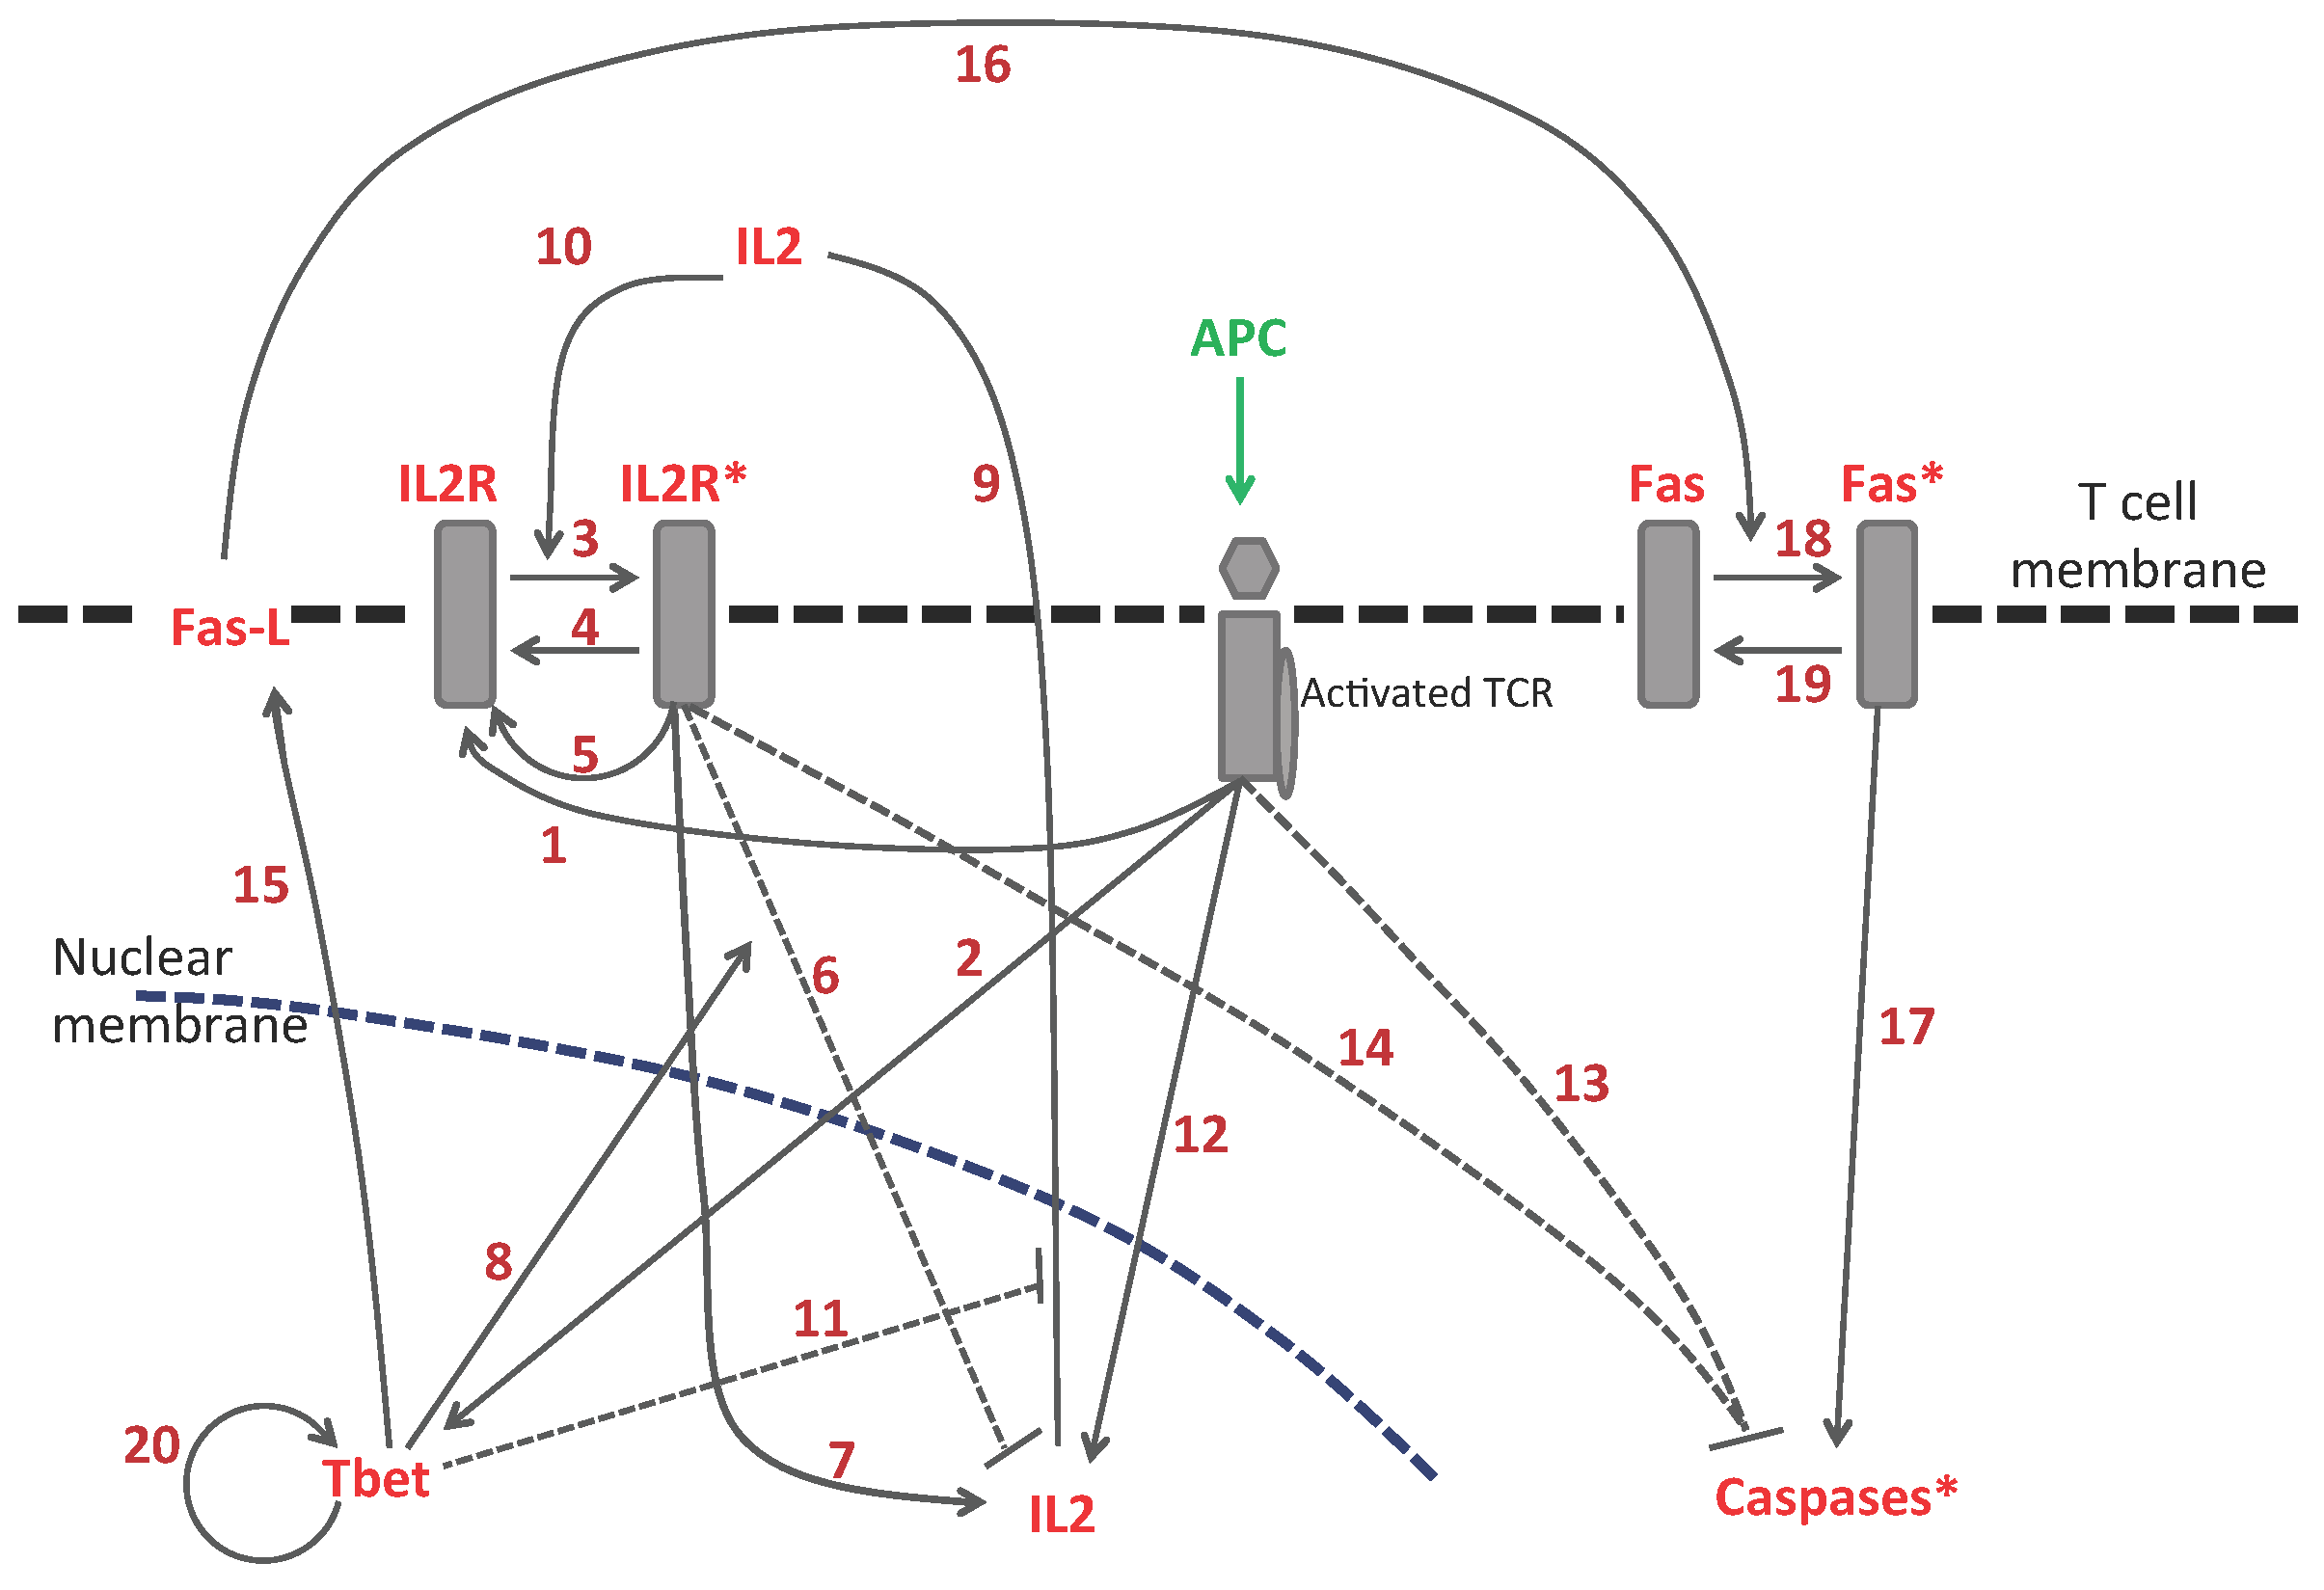
| 1. | Activated TCR increases the amount of non-activated IL2R | [20] |
| 2. | Activated TCR activates Tbet | [21] |
| 3. | Transition: from low to activated IL2R | [19] |
| 4. | Transition: from high to non-activated IL2R | [19] |
| 5. | Activated IL2R increases the amount of non-activated IL2R | [20] |
| 6. | Activated IL2R inhibits the expression of IL2 gene (via Blimp1) | [22] |
| 7. | Activated IL2R induces the expression of IL2 gene | [20] |
| 8. | Tbet promotes the inhibition of IL2 gene expression (via Blimp1) | [23] |
| 9. | Internal IL2 gets secreted and gives rise to the external IL2 | [19] |
| 10. | External IL2 enhances the transition from non-activated to activated IL2R | [20] |
| 11. | Tbet inhibits the secretion of IL2 | [24,25] |
| 12. | IL2 gene activation from TCR (via Erk) | [20] |
| 13. | TCR inhibits caspase (via Erk and Bim/Bax/Bcl2) | [26] |
| 14. | Activated IL2R inhibits caspase (via Stat5, Bcl2, and BAX) | [27] |
| 15. | Tbet induces the expression of FasL | [28] |
| 16. | FasL activates Fas through cell contact | [29] |
| 17. | activated Fas (Fas) induces caspase activation | [29] |
| 18. | Transition: from non-activated to activated form of Fas | [29] |
| 19. | Transition: from activated to non-activated form of Fas | [29] |
| 20. | Tbet maintenance | [30,31] |

3.2. Cellular Level: Cellular Potts Model
| Cell type ∖ Behavior | Random motility | Division | Apoptosis | IL2 secretion |
|---|---|---|---|---|
| APC | ✓ | ✓ | ||
| naïve | ✓ | |||
| preactivated | ✓ | ✓ | ✓ | |
| activated | ✓ | ✓ | ✓ | ✓ |
| effector | ✓ | ✓ | ✓ | ✓ |
3.3. Extracellular Level
| Parameter | Description | Value | Reference |
|---|---|---|---|
| Cell features: | |||
| A | T cell target area | 100 | [35] |
| A | APC target area | 1000 | [35] |
| T | cell-membrane fluctuations | 10 | / |
| resistance to changes in size/area | 10 | / | |
| Adhesion: | |||
| T cell-medium contact energy | 30 | / | |
| APC-medium contact energy | 30 | / | |
| APC-APC contact energy | 100 | / | |
| APC-naïve cell contact energy | 50 | / | |
| APC-preactivated cell contact energy | 50 | / | |
| APC-activated cell contact energy | 500 | / | |
| APC-effector cell contact energy | 500 | / | |
| T cell-T cell contact energy | 100 | / |
| Parameter | Value | Units | Reference |
|---|---|---|---|
| Decay rates: | |||
| 0.0029 | min | [45,46] | |
| 0.0029 | min | [45] | |
| 0.0035 | min | [46] | |
| 0.0047 | min | [47] | |
| 0.0047 | min | [47] | |
| 0.0038 | min | [47] | |
| Strengths of feedbacks: | |||
| 0.0158 | M min | Derived | |
| 0.001 | min | Derived | |
| 0.01 | M min | Derived | |
| 0.004 | min | [46] | |
| 0.01 | M | / | |
| 0.01 | M min | / | |
| 100 | M | / | |
| 0.01 | / | / | |
| 0.004 | min | / | |
| Association/Dissociation rates: | |||
| Mmin | [46,48] | ||
| 0.006 | min | [19] | |
| Mmin | Derived | ||
| 0.006 | min | [19] | |
| Other: | |||
| M min | [46] |
| Parameter | Value | Units | Reference |
|---|---|---|---|
| Equation for IL2: | |||
| 0.0 | M min | / | |
| 0.0 | M | / | |
| 0.0 | M | / | |
| M min | [18] | ||
| Thresholds: | |||
| IL2R | 7 | M | Derived |
| Tbet | 40 | M | Derived |
| Caspase | 2.63 | M | Derived |
4. Results and Discussion
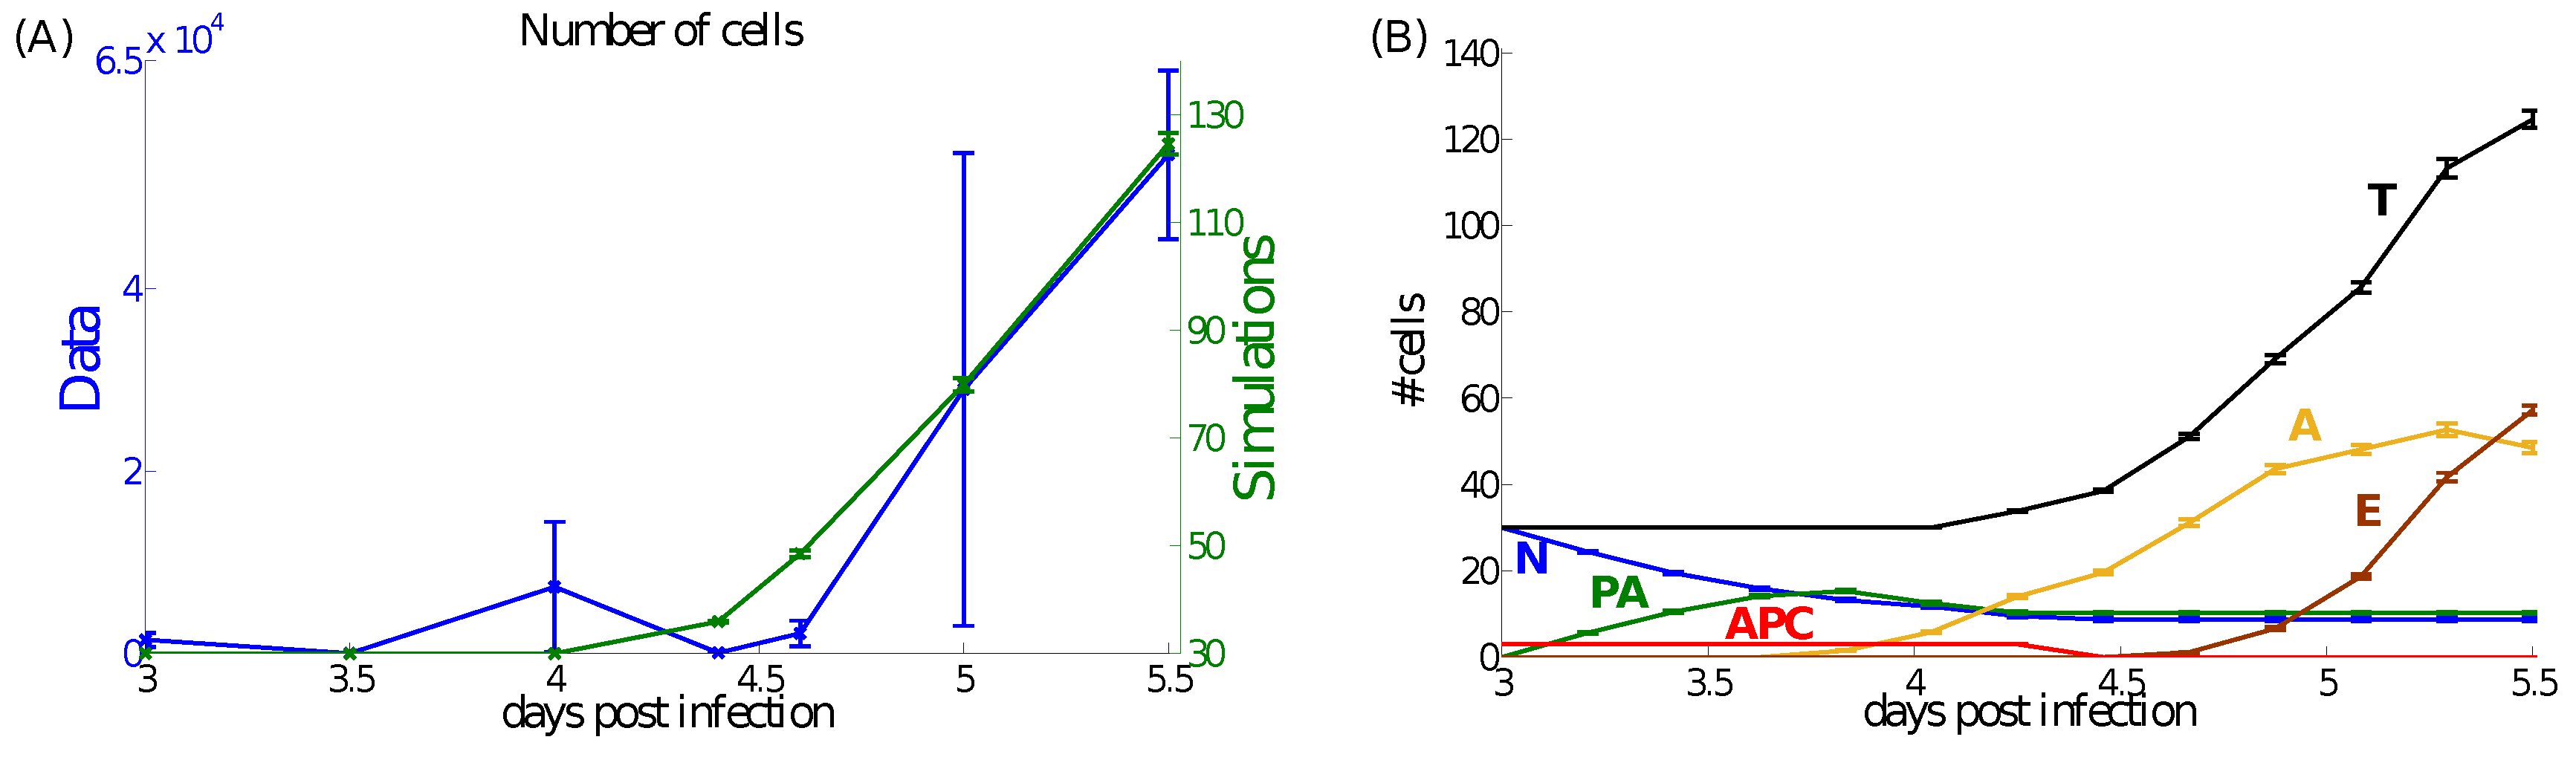
4.1. Dynamics at the Population Level


4.2. Dynamics at the Single Cell Level: Single APC and T Cell Interaction

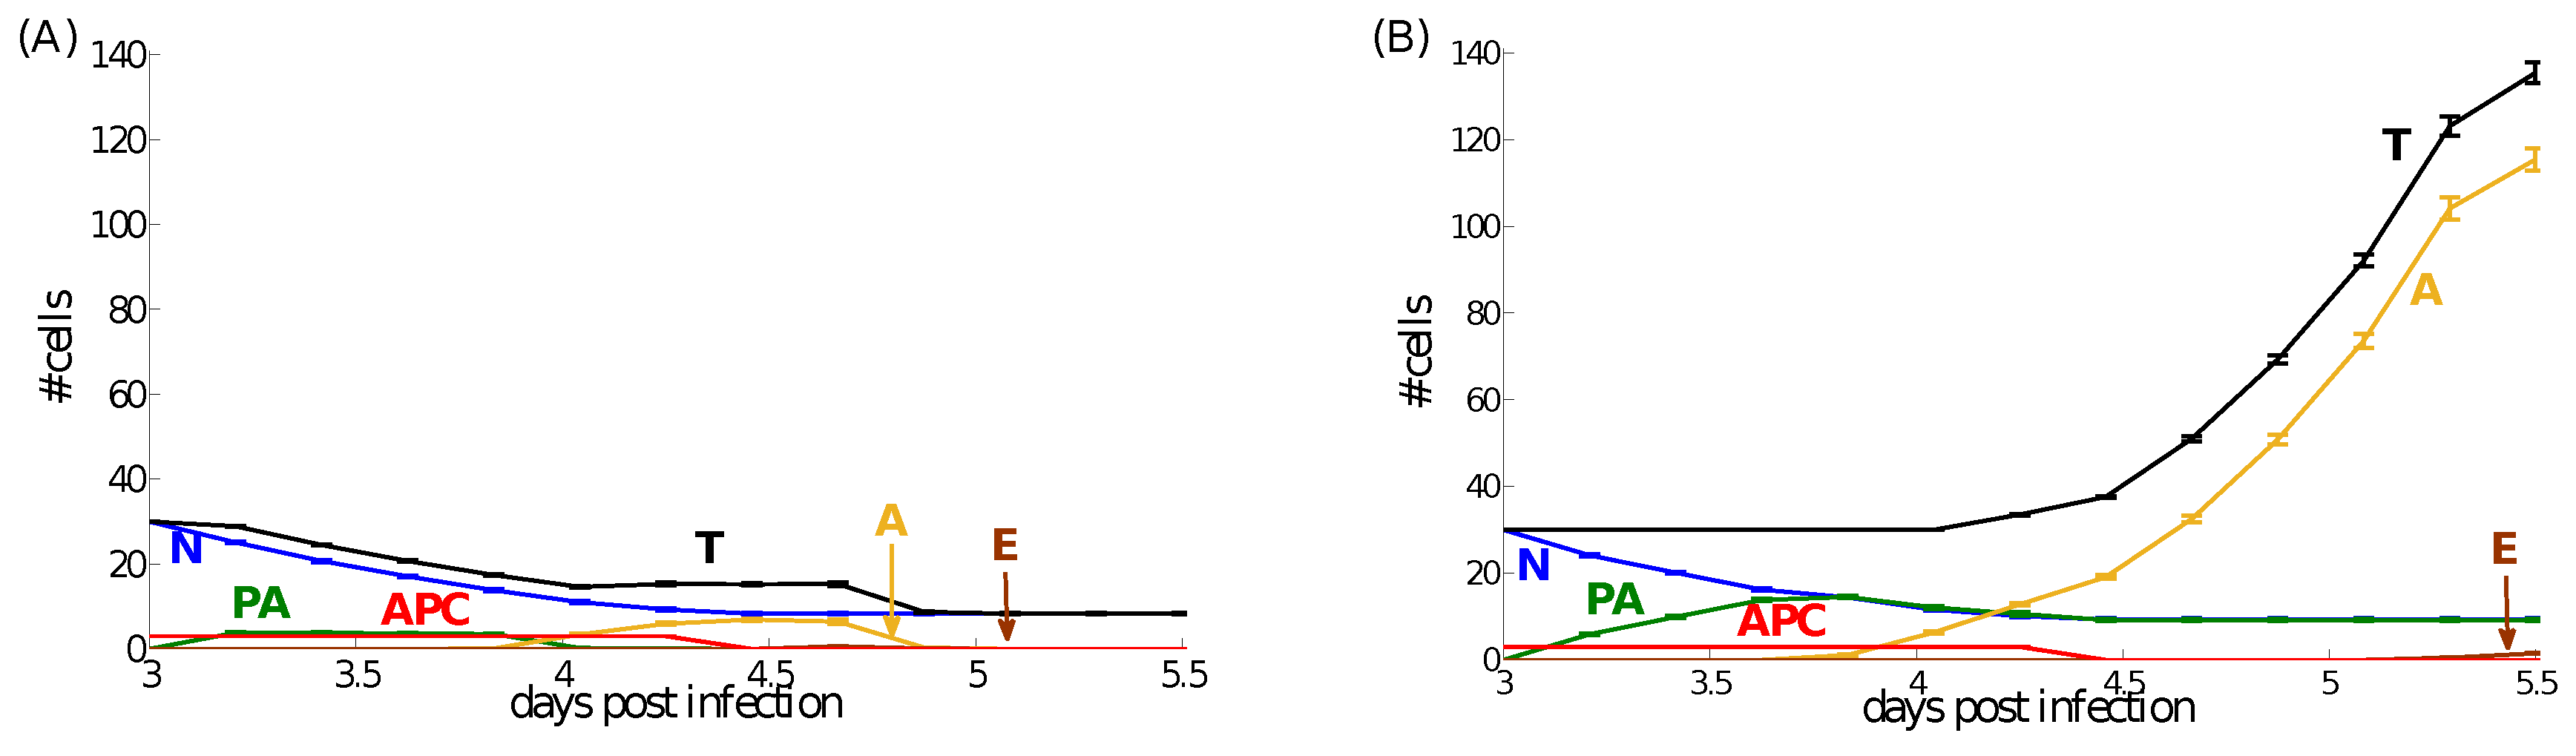
4.3. A Preliminary Assessment of the Sensitivity of Parameter Values

5. Conclusions
6. Supplementary Information
6.1. Parameter Values
6.1.1. Cell-Cell Adhesion: Contact Energies (J)
6.1.2. Parameter Derivation
- : chosen to be M min, so that ∼20 h [18] are needed for a preactivated cell to become activated, pM.
- : it affects the activated IL2R threshold for T-cell activation (from preactivated to activated phenotype), which takes ∼20 h to reach and increases approximately 7-fold [49].
- : it is a rate chosen to be within the same order as rates and .
- : it affects the Tbet threshold for effector T-cells, which takes ∼48 h to reach and increases approximately 40-fold [50].
- : we assume that this is equal to or at least of the same order as [19].
- Caspase threshold: we evaluated the caspase threshold to be the value at which the lifespan of the effector T cells is ∼60 h (Supplementary Information of [38]).
- : both and represent production rates, and therefore, we choose .
- : due to the lack of any reference values, we assume in order to be dimensionally consistent: .
- : due to the lack of any reference values, we assume in order to be dimensionally consistent: min.
- : an important biological question based on which we tried to find a reasonable value to start with for , is whether and when an activated T cell can evolve to an effector phenotype (with positive and non-zero Tbet). From Equation (3), we can get an upper bound for ; that is, . By using the value of Tbet at the time when a preactivated T cell becomes activated, that gives (an upper bound for ).
Acknowledgments
Author Contributions
Conflicts of Interest
References
- Matheu, M.; Teijaro, J.; Walsh, K.; Greenberg, M.; Marsolais, D.; Parker, I.; Rosen, H.; Oldstone, M.; Cahalan, M. Three phases of CD8 T cell response in the lung following H1N1 influenza infection and sphingosine 1 phosphate agonist therapy. PLoS One 2013, 8, e58033. [Google Scholar] [CrossRef] [PubMed]
- Bousso, P. T-cell activation by dendritic cells in the lymph node: Lessons from the movies. Nat. Rev. Immunol. 2008, 8, 675–684. [Google Scholar] [CrossRef] [PubMed]
- Cui, W.; Kaech, S. Generation of effector CD8+ T cells and their conversion to memory T cells. Immunol. Rev. 2010, 236, 151–166. [Google Scholar] [CrossRef] [PubMed]
- Williams, M.; Bevan, M. Effector and memory CTL differentiation. Annu. Rev. Immunol. 2007, 25, 171–192. [Google Scholar] [CrossRef] [PubMed]
- Li, Q.; Skinner, P.; Ha, S.; Duan, L.; Mattila, T.; Hage, A.; White, C.; Barber, D.; O’Mara, L.; Southern, P.; et al. Visualizing antigen-specific and infected cells in situ predicts outcomes in early viral infection. Science 2009, 323, 1726–1729. [Google Scholar]
- Mueller, S.; Germain, R. Stromal cell contributions to the homeostasis and functionality of the immune system. Nat. Rev. Immunol. 2009, 9, 618–629. [Google Scholar] [CrossRef] [PubMed]
- Bajenoff, M.; Egen, J.; Koo, L.; Laugier, J.; Brau, F.; Glaichenhaus, N.; Germain, R. Stromal Cell Networks Regulate Lymphocyte Entry, Migration, and Territoriality in Lymph Nodes. Immunity 2006, 25, 989–1001. [Google Scholar] [CrossRef] [PubMed]
- Buchholz, V.; Graf, P.; Busch, D. The smallest unit: effector and memory CD8(+) T cell differentiation on the single cell level. Front Immunol. 2013, 4. [Google Scholar] [CrossRef] [PubMed]
- Antia, R.; Bergstrom, C.; Pilyugin, S.; Kaech, S.; Ahmed, R. Models of CD8+ responses: 1. What is the antigen-independent proliferation program. J. Theor. Biol. 2003, 221, 585–598. [Google Scholar]
- Terry, E.; Marvel, J.; Arpin, C.; Gandrillon, O.; Crauste, F. Mathematical model of the primary CD8 T cell immune response: stability analysis of a nonlinear age-structured system. J. Math. Biol. 2012, 65, 263–291. [Google Scholar] [CrossRef] [PubMed]
- Beltman, J.; Maree, A.; de Boer, R. Spatial modelling of brief and long interactions between T cells and dendritic cells. Immunol. Cell Biol. 2007, 85, 306–314. [Google Scholar] [CrossRef] [PubMed]
- Glazier, J.; Graner, F. Simulation of the differential adhesion driven rearrangement of biological cells. Phys. Rev. E 1993, 47, 2128–2154. [Google Scholar] [CrossRef]
- Gong, C.; Mattila, J.; Miller, M.; Flynn, J.; Linderman, J.; Kirschner, D. Predicting lymph node output efficiency using systems biology. J. Theor. Biol. 2013, 335, 169–184. [Google Scholar] [CrossRef] [PubMed]
- Riggs, T.; Walts, A.; Perry, N.; Bickle, L.; Lynch, J.; Myers, A.; Flynn, J.; Linderman, J.; Miller, M.; Kirschner, D. A comparison of random vs. chemotaxis driven contacts of T cells with dendritic cells during repertoire scanning. J. Theor. Biol. 2008, 250, 732–751. [Google Scholar]
- Webster, B.; Ekland, E.; Agle, L.; Chyou, S.; Ruggieri, R.; Lu, T. Regulation of lymph node vascular growth by dendritic cells. J. Exp. Med. 2006, 203, 1903–1913. [Google Scholar] [CrossRef] [PubMed]
- Bogle, G.; Dunbar, P. Agent-based simulation of T-cell activation and proliferation within a lymph node. Immunol. Cell Biol. 2010, 88, 172–179. [Google Scholar] [CrossRef] [PubMed]
- Baldazzi, V.; Paci, P.; Bernaschi, M.; Castiglione, F. Modeling lymphocytes homing and encounters in lymph nodes. BMC Bioinforma. 2009, 10. [Google Scholar] [CrossRef] [PubMed]
- Hofer, T.; Krichevsky, O.; Altan-Bonnet, G. Competition for IL-2 between Regulatory and Effector T Cells to Chisel Immune Responses. Front Immunol. 2012, 3, 268. [Google Scholar] [CrossRef] [PubMed]
- Feinerman, O.; Jentsch, G.; Tkach, K.; Coward, J.; Hathorn, M.; Sneddon, M.; Emonet, T.; Smith, K.; Altan-Bonnet, G. Single-cell quantification of IL-2 response by effector and regulatory T cells reveals critical plasticity in immune response. Mol. Syst. Biol. 2010, 6. [Google Scholar] [CrossRef] [PubMed]
- Hoyer, K.; Dooms, H.; Barron, L.; Abbas, A. Interleukin-2 in the development and control of inflammatory disease. Immunol. Rev. 2008, 226, 19–28. [Google Scholar] [CrossRef] [PubMed]
- McLane, L.; Banerjee, P.; Cosma, G.; Makedonas, G.; Wherry, E.; Orange, J.; Betts, M. Differential localization of T-bet and Eomes in CD8 T cell memory populations. J. Immunol. 2013, 7, 3207–3215. [Google Scholar] [CrossRef] [PubMed]
- Martins, G.; Calame, K. Regulation and functions of Blimp-1 in T and B lymphocytes. Annu. Rev. Immunol. 2008, 26, 133–169. [Google Scholar] [CrossRef] [PubMed]
- Yeo, C.; Fearon, D. T-bet-mediated differentiation of the activated CD8+ T cell. Eur. J. Immunol. 2011, 41, 60–66. [Google Scholar] [CrossRef] [PubMed]
- Szabo, S.; Kim, S.; Costa, G.; Zhang, X.; Fathman, C.; Glimcher, L. A novel transcription factor, T-bet, directs Th1 lineage commitment. Cell 2000, 100, 655–669. [Google Scholar] [CrossRef]
- Hwang, E.; Hong, J.; Glimcher, L. IL-2 production in developing Th1 cells is regulated by heterodimerization of RelA and T-bet and requires T-bet serine residue 508. J. Exp. Med. 2005, 202, 1289–1300. [Google Scholar] [CrossRef] [PubMed]
- Ewings, K.; Wiggins, C.; Cook, S. Bim and the pro-survival Bcl-2 proteins: Opposites attract, ERK repels. Cell Cycle 2007, 6, 2236–2240. [Google Scholar] [CrossRef]
- Kelly, J.; Spolski, R.; Imada, K.; Bollenbacher, J.; Lee, S.; Leonard, W. A role for Stat5 in CD8+ T cell homeostasis. J. Immunol. 2003, 170, 210–217. [Google Scholar] [CrossRef]
- Sullivan, B.; Juedes, A.; Szabo, S.; von Herrath, M.; Glimcher, L. Antigen-driven effector CD8 T cell function regulated by T-bet. Proc. Natl. Acad. Sci. USA 2003, 100, 15818–15823. [Google Scholar] [CrossRef] [PubMed]
- Bouillet, P.; O’Reilly, L. CD95, BIM and T cell homeostasis. Nat. Rev. Immunol. 2009, 9, 514–519. [Google Scholar] [CrossRef] [PubMed]
- Kanhere, A.; Hertweck, A.; Bhatia, U.; Gökmen, M.; Perucha, E.; Jackson, I.; Lord, G.; Jenner, R. T-bet and GATA3 orchestrate Th1 and Th2 differentiation through lineage-specific targeting of distal regulatory elements. Nat. Commun. 2012, 3. [Google Scholar] [CrossRef] [PubMed]
- Shin, H.; Lee, J.; Park, S.; Chang, J.; Lee, C.W. T-bet expression is regulated by EGR1-mediated signaling in activated T cells. Clin. Immunol. 2009, 131, 385–394. [Google Scholar] [CrossRef] [PubMed]
- Andersen, M.; Schrama, D.; Thor Straten, P.; Becker, J. Cytotoxic T cells. J. Invest. Dermatol. 2006, 126, 32–41. [Google Scholar] [CrossRef] [PubMed]
- Liao, W.; Lin, J.; Leonard, W. Interleukin-2 at the crossroads of effector responses, tolerance, and immunotherapy. Immunity 2013, 38, 13–25. [Google Scholar] [CrossRef] [PubMed]
- Swat, M.; Thomas, G.; Belmonte, J.; Shirinifard, A.; Hmeljak, D.; Glazier, J. Multi-Scale Modeling of Tissues Using CompuCell3D. Comput. Methods Cell Biol. Methods Cell Biol. 2012, 110, 325–366. [Google Scholar]
- Miller, M.; Hejazi, A.; Wei, S.; Cahalan, M.; Parker, I. T cell repertoire scanning is promoted by dynamic dendritic cell behavior and random T cell motility in the lymph node. Proc. Natl. Acad. Sci. USA 2004, 101, 998–1003. [Google Scholar] [CrossRef] [PubMed]
- Bauer, A.; Jackson, T.; Jiang, Y. A cell-based model exhibiting branching and anastomosis during tumor-induced angiogenesis. Biophys. J. 2007, 92, 3105–3121. [Google Scholar] [CrossRef] [PubMed]
- Bousso, P.; Robey, E. Dynamics of CD8+ T cell priming by dendritic cells in intact lymph nodes. Nat. Immunol. 2003, 4, 579–585. [Google Scholar] [CrossRef] [PubMed]
- Linderman, J.; Riggs, T.; Pande, M.; Miller, M.; Marino, S.; Kirschner, D. Characterizing the dynamics of CD4+ T cell priming within a lymph node. J. Immunol. 2010, 184. [Google Scholar] [CrossRef] [PubMed]
- Wu, J.; Tzanakakis, E. Contribution of stochastic partitioning at human embryonic stem cell division to NANOG heterogeneity. PLoS One 2012, 7, e50715. [Google Scholar] [CrossRef] [PubMed]
- Buchholz, V.; Flossdorf, M.; Hensel, I.; Kretschmer, L.; Weissbrich, B.; Graf, P.; Verschoor, A.; Schiemann, M.; Hofer, T.; Busch, D. Disparate individual fates compose robust CD8+ T cell immunity. Science 2013, 340, 630–635. [Google Scholar] [CrossRef] [PubMed]
- Gerlach, C.; Rohr, J.; Perie, L.; van Rooij, N.; van Heijst, J.; Velds, A.; Urbanus, J.; Naik, S.; Jacobs, H.; Beltman, J.; et al. Heterogeneous differentiation patterns of individual CD8+ T cells. Science 2013, 340, 635–639. [Google Scholar]
- Huh, D.; Paulsson, J. Non-genetic heterogeneity from stochastic partitioning at cell division. Nat. Genet. 2011, 43, 95–100. [Google Scholar] [CrossRef] [PubMed]
- Lanzavecchia, A.; Sallusto, F. Lead and follow: The dance of the dendritic cell and T cell. Nat. Immunol. 2004, 5, 1201–1202. [Google Scholar] [CrossRef] [PubMed]
- Lindquist, R.; Shakhar, G.; Dudziak, D.; Wardemann, H.; Eisenreich, T.; Dustin, M.; Nussenzweig, M. Visualizing dendritic cell networks in vivo. Nat. Immunol. 2004, 5, 1243–1250. [Google Scholar] [CrossRef] [PubMed]
- Sayar, D.; Ketzinel, M.; Gerez, L.; Silberberg, C.; Reshef, A.; Kaempfer, R. Expression of the human IL-2 receptor on lymphocytes involves rapid turnover of its p55 alpha-subunit. J. Immunol. 1990, 145, 2946–2949. [Google Scholar]
- Yates, A.; Callard, R.; Stark, J. Combining cytokine signalling with T-bet and GATA-3 regulation in Th1 and Th2 differentiation: a model for cellular decision-making. J. Theor. Biol. 2004, 231, 181–196. [Google Scholar] [CrossRef] [PubMed]
- Larsson, E.; Sander, C.; Marks, D. mRNA turnover rate limits siRNA and microRNA efficacy. Mol. Syst. Biol. 2010, 6. [Google Scholar] [CrossRef]
- Smith, K. The structure of IL2 bound to the three chains of the IL2 receptor and how signaling occurs. Med. Immunol. 2006, 5. [Google Scholar] [CrossRef]
- Mempel, T.; Henrickson, S.; von Andrian, U. T cell priming by dendritic cells in lymph nodes occurs in three distinct phases. Nature 2004, 427, 154–159. [Google Scholar] [CrossRef] [PubMed]
- Cruz-Guilloty, F.; Pipkin, M.; Djuretic, I.; Levanon, D.; Lotem, J.; Lichtenheld, M.; Groner, Y.; Rao, A. Runx3 and T-box proteins cooperate to establish the transcriptional program of effector CTLs. J. Exp. Med. 2009, 206, 51–59. [Google Scholar] [CrossRef] [PubMed]
- Rapin, N.; Lund, O.; Bernaschi, M.; Castiglione, F. Computational Immunology Meets Bioinformatics: The Use of Prediction Tools for Molecular Binding in the Simulation of the Immune System. PLoS One 2010, 5, e9862. [Google Scholar] [CrossRef] [PubMed]
- Angermann, B.; Klauschen, F.; Garcia, A.; Prustel, T.; Zhang, F.; Germain, R.; Meier-Schellersheim, M. Computational modeling of cellular signaling processes embedded into dynamic spatial contexts. Nat. Meth. 2012, 9, 283–289. [Google Scholar] [CrossRef] [PubMed]
- Starling, G.; Bajorath, J.; Emswiler, J.; Ledbetter, J.; Aruffo, A.; Kiener, P. Identification of amino acid residues important for ligand binding to Fas. J. Exp. Med. 1997, 185, 1487–1492. [Google Scholar] [CrossRef]
© 2014 by the authors; licensee MDPI, Basel, Switzerland. This article is an open access article distributed under the terms and conditions of the Creative Commons Attribution license (http://creativecommons.org/licenses/by/4.0/).
Share and Cite
Prokopiou, S.A.; Barbarroux, L.; Bernard, S.; Mafille, J.; Leverrier, Y.; Arpin, C.; Marvel, J.; Gandrillon, O.; Crauste, F. Multiscale Modeling of the Early CD8 T-Cell Immune Response in Lymph Nodes: An Integrative Study. Computation 2014, 2, 159-181. https://doi.org/10.3390/computation2040159
Prokopiou SA, Barbarroux L, Bernard S, Mafille J, Leverrier Y, Arpin C, Marvel J, Gandrillon O, Crauste F. Multiscale Modeling of the Early CD8 T-Cell Immune Response in Lymph Nodes: An Integrative Study. Computation. 2014; 2(4):159-181. https://doi.org/10.3390/computation2040159
Chicago/Turabian StyleProkopiou, Sotiris A., Loic Barbarroux, Samuel Bernard, Julien Mafille, Yann Leverrier, Christophe Arpin, Jacqueline Marvel, Olivier Gandrillon, and Fabien Crauste. 2014. "Multiscale Modeling of the Early CD8 T-Cell Immune Response in Lymph Nodes: An Integrative Study" Computation 2, no. 4: 159-181. https://doi.org/10.3390/computation2040159
APA StyleProkopiou, S. A., Barbarroux, L., Bernard, S., Mafille, J., Leverrier, Y., Arpin, C., Marvel, J., Gandrillon, O., & Crauste, F. (2014). Multiscale Modeling of the Early CD8 T-Cell Immune Response in Lymph Nodes: An Integrative Study. Computation, 2(4), 159-181. https://doi.org/10.3390/computation2040159