The Structure of Cognitive Abilities and Associations with Problem Behaviors in Early Adolescence: An Analysis of Baseline Data from the Adolescent Brain Cognitive Development Study


Abstract
:1. Introduction
1.1. ABCD Study
1.2. Factor Structure of Cognitive Abilities
1.3. Internalizing and Externalizing Problems in Adolescent Development
1.4. Present Study
- (a)
- Use a psychometrically-sound data reduction technique (i.e., factor analysis) to explore the latent factor structure of cognitive abilities as measured in the ABCD Study;
- (b)
- Examine the relationship between these cognitive abilities and behavioral outcomes (i.e., internalizing, externalizing, and stress) as measured by the CBCL.
2. Method
2.1. ABCD Study Design and Sample
2.2. Measures
2.2.1. Toolbox-CB
Picture Vocabulary Test (Picture Vocab)
Flanker Inhibitory Control and Attention Task (Flanker)
List Sorting Working Memory Test (List Sort)
Dimensional Change Card Sort (Card Sort)
Pattern Comparison Processing Speed Test (Pattern Comparison)
Picture Sequence Memory Test (Picture Sequence)
Oral Reading Recognition Task (Oral Reading)
2.2.2. RAVLT
2.2.3. WISC-V Matrix Reasoning
2.2.4. LMT
2.2.5. CBCL
2.3. Statistical Approach
3. Results
3.1. Descriptive Statistics
3.2. Split-Sample Exploratory Factor Analysis (n = 4938)
3.3. Split-Sample Confirmatory Factor Analysis (n = 4937)
3.4. Associations between Factor Scores and CBCL Measures
3.5. Association with CBCL Problem Behaviors Adjusting for Demographic Variables
4. Discussion
5. Conclusions
Author Contributions
Funding
Institutional Review Board Statement
Informed Consent Statement
Data Availability Statement
Acknowledgments
Conflicts of Interest
References
- Achenbach, Thomas M. 1991. Manual for the Child Behavior Checklist/4-18 and 1991 Profile. Burlington: Department of Psychiatry, University of Vermont. [Google Scholar]
- Achenbach, Thomas M., and Thomas M. Ruffle. 2000. The Child Behavior Checklist and related forms for assessing behavioral/emotional problems and competencies. Pediatrics in Review 21: 265–71. [Google Scholar] [CrossRef] [PubMed]
- Acker, William L., and Clare Acker. 1982. Bexley Maudsley Automated Processing Screening and Bexley Maudsley Category Sorting Test: Manual. Windsor: NFER-Nelson. [Google Scholar]
- Adolescent Brain Cognitive Development Study (ABCD). 2021. Available online: https://abcdstudy.org/ (accessed on 15 January 2021).
- Akshoomoff, Natacha, Timothy T. Brown, Roger Bakeman, Donald J. Hagler Jr., and on behalf of the Pediatric Imaging, Neurocognition, and Genetics Study. 2018. Developmental differentiation of executive functions on the NIH Toolbox Cognition Battery. Neuropsychology 32: 777–83. [Google Scholar] [CrossRef] [PubMed]
- Baddeley, Alan. 2000. The episodic buffer: A new component of working memory? Trends in Cognitive Sciences 4: 417–23. [Google Scholar] [CrossRef] [PubMed]
- Barch, Deanna M., Matthew D. Albaugh, Shelli Avenevoli, Linda Chang, Duncan B. Clark, Meyer D. Glantz, James J. Hudziak, Terry L. Jernigan, Susan F. Tapert, Debbie Yurgelun-Todd, and et al. 2018. Demographic, physical and mental health assessments in the Adolescent Brain and Cognitive Development Study: Rationale and description. Developmental Cognitive Neuroscience 32: 55–66. [Google Scholar] [CrossRef]
- Bauer, Patricia J., and Philip David Zelazo. 2014. The National Institutes of Health Toolbox for the assessment of neurological and behavioral function: A tool for developmental science. Child Development Perspectives 8: 119–24. [Google Scholar] [CrossRef]
- Beukers, Andre O., Timothy J. Buschman, Jonathan D. Cohen, and Kenneth A. Norman. 2021. Is activity silent working memory simply episodic memory? Trends in Cognitive Sciences 25: 284–93. [Google Scholar] [CrossRef]
- Brislin, Sarah J., Meghan E. Martz, Sonalee Joshi, Elizabeth R. Duval, Arianna Gard, D. Angus Clark, Luke W. Hyde, Brian M. Hicks, Aman Taxali, Mike Angstadt, and et al. 2021. Differentiated nomological networks of internalizing, externalizing, and the general factor of psychopathology (‘p factor’) in emerging adolescence in the ABCD Study. Psychological Medicine 52: 3051–61. [Google Scholar] [CrossRef]
- Brizio, Adelina, Ilaria Gabbatore, Maurizio Tirassa, and Francesca M. Bosco. 2015. “No more a child, not yet an adult”: Studying social cognition in adolescence. Frontiers in Psychology 6: 1011. [Google Scholar] [CrossRef]
- Brydges, Christopher R., Allison M. Fox, Corinne L. Reid, and Mike Anderson. 2014. The differentiation of executive functions in middle and late childhood: A longitudinal latent-variable analysis. Intelligence 47: 34–43. [Google Scholar] [CrossRef]
- Casaletto, Kaitlin B., Anya Umlauf, Jennifer Beaumont, Richard Gershon, Jerry Slotkin, Natacha Akshoomoff, and Robert K. Heaton. 2015. Demographically corrected normative standards for the English version of the NIH Toolbox Cognition Battery. Journal of the International Neuropsychological Society 21: 378–91. [Google Scholar] [CrossRef]
- Conway, Andrew R. A., and Kristof Kovacs. 2013. Individual differences in intelligence and working memory: A review of latent variable models. In The Psychology of Learning and Motivation. Edited by Brian H. Ross. San Diego: Elsevier Academic Press, vol. 58, pp. 233–70. [Google Scholar]
- Cronbach, Lee J. 1957. The two disciplines of scientific psychology. American Psychologist 12: 671–84. [Google Scholar] [CrossRef]
- Diamond, Adele. 2013. Executive functions. Annual Review of Psychology 64: 135–68. [Google Scholar] [CrossRef] [PubMed]
- Eisenberg, Nancy, Carlos Valiente, Tracy L. Spinrad, Jeffrey Liew, Qing Zhou, Sandra H. Losoya, Mark Reiser, and Amanda Cumberland. 2009. Longitudinal relations of children’s effortful control, impulsivity, and negative emotionality to their externalizing, internalizing, and co-occurring behavior problems. Developmental Psychology 45: 988–1008. [Google Scholar] [CrossRef] [PubMed]
- Engle, Randall W., Stephen W. Tuholski, James E. Laughlin, and Andrew R. A. Conway. 1999. Working memory, short-term memory, and general fluid intelligence: A latent-variable approach. Journal of Experimental Psychology: General 128: 309–31. [Google Scholar] [CrossRef] [PubMed]
- Friedman, Naomi P., and Akira Miyake. 2017. Unity and diversity of executive functions: Individual differences as a window on cognitive structure. Cortex 86: 186–204. [Google Scholar] [CrossRef] [PubMed]
- Frischkorn, Gidon T., Anna-Lena Schubert, and Dirk Hagemann. 2019. Processing speed, working memory, and executive functions: Independent or inter-related predictors of general intelligence. Intelligence 75: 95–110. [Google Scholar] [CrossRef]
- Gold, James M., Constance Carpenter, Christopher Randolph, Terry E. Goldberg, and Daniel R. Weinberger. 1997. Auditory working memory and Wisconsin Card Sorting Test performance in schizophrenia. Archives of General Psychiatry 54: 159–65. [Google Scholar] [CrossRef]
- Hatoum, Alexander S., Soo Hyun Rhee, Robin P. Corley, John K. Hewitt, and Naomi P. Friedman. 2018. Do executive functions explain the covariance between internalizing and externalizing behaviors? Development and Psychopathology 30: 1371–87. [Google Scholar] [CrossRef]
- HealthMeasures (Northwestern University). 2021. Cognition Measures: NIH Toolbox Cognition Batteries. Available online: https://www.healthmeasures.net/explore-measurement-systems/nih-toolbox/intro-to-nih-toolbox/cognition (accessed on 15 January 2021).
- Heaton, Robert K., Natacha Akshoomoff, David Tulsky, Dan Mungas, Sandra Weintraub, Sureyya Dikmen, Jennifer Beaumont, Kaitlin B. Casaletto, Kevin Conway, Jerry Slotkin, and et al. 2014. Reliability and validity of composite scores from the NIH Toolbox Cognition Battery in adults. Journal of the International Neuropsychological Society 20: 588–98. [Google Scholar] [CrossRef]
- Ivanova, Masha Y., Thomas M. Achenbach, Levent Dumenci, Leslie A. Rescorla, Fredrik Almqvist, Sheila Weintraub, Niels Bilenberg, Hector Bird, Wei J. Chen, Anca Dobrean, and et al. 2007. Testing the 8-syndrome structure of the Child Behavior Checklist in 30 societies. Journal of Clinical Child and Adolescent Psychology 36: 405–17. [Google Scholar] [CrossRef]
- Jernigan, Terry L., Sandra A. Brown, and ABCD Consortium Coordinators. 2018. Introduction. Developmental Cognitive Neuroscience 32: 1–3. [Google Scholar] [CrossRef] [PubMed]
- Justice, Laura M., Hui Jiang, Jessica A. Logan, and Mary Beth Schmitt. 2017. Predictors of language gains among school-age children with language impairment in the public schools. Journal of Speech, Language, and Hearing Research 60: 1590–605. [Google Scholar] [CrossRef] [PubMed]
- Karasinski, Courtney. 2015. Language ability, executive functioning and behaviour in school-age children. International Journal of Language & Communication Disorders 50: 144–50. [Google Scholar] [CrossRef]
- Karpinski, Ruth I., Audrey M. Kinase Kolb, Nicole A. Tetreault, and Thomas B. Borowski. 2018. High intelligence: A risk factor for psychological and physiological overexcitabilities. Intelligence 66: 8–23. [Google Scholar] [CrossRef]
- Keyes, Katherine M., Jonathan Platt, Alan S. Kaufman, and Katie A. McLaughlin. 2017. Fluid intelligence and psychiatric disorders in a population representative sample of US adolescents. JAMA Psychiatry 74: 179–88. [Google Scholar] [CrossRef] [PubMed]
- Knekta, Eva, Christopher Runyon, and Sarah Eddy. 2019. One size doesn’t fit all: Using factor analysis to gather validity evidence when using surveys in your research. CBE Life Sciences Education 18: 1–17. [Google Scholar] [CrossRef] [PubMed]
- Kovacs, Kristof, and Andrew R. A. Conway. 2016. Process overlap theory: A unified account of the general factor of intelligence. Psychological Inquiry 27: 151–77. [Google Scholar] [CrossRef]
- Liu, Yan, and Gavriel Salvendy. 2009. Effects of measurement errors on psychometric measurements in ergonomics studies: Implications for correlations, ANOVA, linear regression, factor analysis, and linear discriminant analysis. Ergonomics 52: 499–511. [Google Scholar] [CrossRef]
- Luciana, Monica, James M. Bjork, Bonnie J. Nagel, Deanna M. Barch, Raul Gonzalez, Sara Jo Nixon, and Marie T. Banich. 2018. Adolescent neurocognitive development and impacts of substance use: Overview of the Adolescent Brain Cognitive Development (ABCD) baseline neurocognition battery. Developmental Cognitive Neuroscience 32: 67–79. [Google Scholar] [CrossRef]
- Mazefsky, Carla A., Ranita Anderson, Caitlin M. Conner, and Nancy Minshew. 2011. Child Behavior Checklist scores for school-aged children with autism: Preliminary evidence of patterns suggesting the need for referral. Journal of Psychopathology and Behavioral Assessment 33: 31–37. [Google Scholar] [CrossRef]
- Miller, Adam Bryant, Margaret A. Sheridan, Jamie L. Hanson, Katie A. McLaughlin, John E. Bates, Jennifer E. Lansford, Gregory S. Pettit, and Kenneth A. Dodge. 2018. Dimensions of deprivation and threat, psychopathology, and potential mediators: A multi-year longitudinal analysis. Journal of Abnormal Psychology 127: 160–70. [Google Scholar] [CrossRef] [PubMed]
- Mills, Kathryn L., Anne-Lise Goddings, and Sarah-Jayne Blakemore. 2014. Drama in the teenage brain. Frontiers for Young Minds: Neuroscience 2: 1–5. [Google Scholar] [CrossRef]
- Miyake, Akira, and Naomi P. Friedman. 2012. The nature and organization of individual differences in executive functions: Four general conclusions. Current Directions in Psychological Science 21: 8–14. [Google Scholar] [CrossRef] [PubMed]
- Miyake, Akira, Naomi P. Friedman, Michael J. Emerson, Alexander H. Witzki, Amy Howerter, and Tor D. Wager. 2000. The unity and diversity of executive functions and their contributions to complex ‘frontal lobe’ tasks: A latent variable analysis. Cognitive Psychology 41: 49–100. [Google Scholar] [CrossRef]
- Moore, Dawn Michele. 2023. Open Science Framework. Available online: https://osf.io/nam56/ (accessed on 8 May 2023).
- Mungas, Dan, Keith Widaman, Philip David Zelazo, David Tulsky, Robert K. Heaton, Jerry Slotkin, David L. Blitz, and Richard C. Gershon. 2013. VII. NIH Toolbox Cognition Battery (CB): Factor structure for 3 to 15 year olds. Monographs of the Society for Research in Child Development 78: 103–18. [Google Scholar] [CrossRef]
- Mungas, Dan, Robert Heaton, David Tulsky, Philip David Zelazo, Jerry Slotkin, David Blitz, Jin-Shei Lai, and Richard Gershon. 2014. Factor structure, convergent validity, and discriminant validity of the NIH Toolbox Cognitive Health Battery (NIHTB-CHB) in adults. Journal of the International Neuropsychological Society 20: 579–87. [Google Scholar] [CrossRef]
- National Institutes of Health (NIH), and Northwestern University. 2021. NIH Toolbox Scoring and Interpretation Guide for the iPad. Available online: https://nihtoolbox.my.salesforce.com/sfc/p/#2E000001H4ee/a/2E000000UZ7R/L8Da2nlj_FBx1LyO25ABnlyCy9HNYWMtG.uBNIbgLF0 (accessed on 15 January 2021).
- Nelson, J. Ron, Gregory J. Benner, and Douglas Cheney. 2005. An investigation of the language skills of students with emotional disturbance served in public school settings. The Journal of Special Education 39: 97–105. [Google Scholar] [CrossRef]
- Nelson, Timothy D., Katherine M. Kidwell, Jennifer Mize Nelson, Cara C. Tomaso, Maren Hankey, and Kimberly Andrews Espy. 2018. Preschool executive control and internalizing symptoms in elementary school. Journal of Abnormal Child Psychology 46: 1509–20. [Google Scholar] [CrossRef]
- Neumann, Denise, Elizabeth R. Peterson, Lisa Underwood, Susan M. B. Morton, and Karen E. Waldie. 2021. Exploring the factor structure of the NIH Toolbox Cognition Battery in a large sample of 8-year-old children in Aotearoa New Zealand. Journal of the International Neuropsychological Society 27: 825–34. [Google Scholar] [CrossRef]
- Nixon, Sara Jo. 1995. Assessing cognitive impairment. Alcohol Health and Research World 19: 97–103. [Google Scholar]
- Osborne, Jason W. 2015. What is rotating in exploratory factor analysis? Practical Assessment, Research & Evaluation 20: 1–7. [Google Scholar] [CrossRef]
- Patwardhan, Irina, Timothy D. Nelson, Megan M. McClelland, and W. Alex Mason. 2021. Childhood cognitive flexibility and externalizing and internalizing behavior problems: Examination of prospective bidirectional associations. Research on Child and Adolescent Psychopathology 49: 413–27. [Google Scholar] [CrossRef] [PubMed]
- Peter-Hagene, Liana C., Kelly C. Burke, Bette L. Bottoms, Kari Nysse Carris, and Andrew R. A. Conway. 2019. Children’s eyewitness lineup accuracy one year later: The role of social support and working memory capacity. International Journal on Child Maltreatment: Research, Policy and Practice 2: 255–85. [Google Scholar] [CrossRef]
- Rey-Mermet, Alodie, Miriam Gade, Alessandra S. Souza, Claudia C. von Bastian, and Klaus Oberauer. 2019. Is executive control related to working memory capacity and fluid intelligence? Journal of Experimental Psychology: General 148: 1335–72. [Google Scholar] [CrossRef]
- Salthouse, Timothy A., Renée L. Babcock, and Raymond J. Shaw. 1991. Effects of adult age on structural and operational capacities in working memory. Psychology and Aging 6: 118–27. [Google Scholar]
- Schmidt, Frank L., and John E. Hunter. 1996. Measurement error in psychological research: Lessons from 26 research scenarios. Psychological Methods 1: 199–223. [Google Scholar] [CrossRef]
- Schneider, W. Joel, and Kevin S. McGrew. 2012. The Cattell-Horn-Carroll Model of Intelligence. In Contemporary Intellectual Assessment: Theories, Tests, and Issues, 3rd ed. Edited by Dawn P. Flanagan and Erin M. McDonough. New York: The Guilford Press, pp. 553–81. [Google Scholar]
- Schoemaker, Kim, Hanna Mulder, Maja Deković, and Walter Matthys. 2013. Executive functions in preschool children with externalizing behavior problems: A meta-analysis. Journal of Abnormal Child Psychology 41: 457–71. [Google Scholar] [CrossRef] [PubMed]
- Schreiber, James B., Amaury Nora, Frances K. Stage, Elizabeth A. Barlow, and Jamie King. 2006. Reporting structural equation modeling and confirmatory factor analysis results: A review. The Journal of Educational Research 99: 323–38. [Google Scholar] [CrossRef]
- Spearman, Charles E. 1904. ‘General intelligence,’ objectively determined and measured. The American Journal of Psychology 15: 201–93. [Google Scholar] [CrossRef]
- Strauss, Esther, Elisabeth M. S. Sherman, and Otfried Spreen. 2006. A Compendium of Neuropsychological Tests: Administration, Norms, and Commentary, 3rd ed. New York: Oxford University Press. [Google Scholar]
- Thompson, Wesley K., Deanna M. Barch, James M. Bjork, Raul Gonzalez, Bonnie J. Nagel, Sara Jo Nixon, and Monica Luciana. 2019. The structure of cognition in 9 and 10 year-old children and associations with problem behaviors: Findings from the ABCD Study’s baseline neurocognitive battery. Developmental Cognitive Neuroscience 36: 1–11. [Google Scholar] [CrossRef]
- Tuholski, Stephen W., Randall W. Engle, and Gordon C. Baylis. 2001. Individual differences in working memory capacity and enumeration. Memory & Cognition 29: 484–92. [Google Scholar] [CrossRef]
- Unsworth, Nash, and Randall W. Engle. 2007. The nature of individual differences in working memory capacity: Active maintenance in primary memory and controlled search from secondary memory. Psychological Review 114: 104–32. [Google Scholar] [CrossRef] [PubMed]
- Wang, Yiji, and Xiaohui Zhou. 2019. Longitudinal relations between executive function and internalizing problems in grade school: The role of peer difficulty and academic performance. Developmental Psychology 55: 2147–58. [Google Scholar] [CrossRef] [PubMed]
- Wiebe, Sandra A., Tiffany Sheffield, Jennifer Mize Nelson, Caron A. C. Clark, Nicolas Chevalier, and Kimberly Andrews Espy. 2011. The structure of executive function in 3-year-olds. Journal of Experimental Child Psychology 108: 436–52. [Google Scholar] [CrossRef] [PubMed]
- Woltering, Steven, Victoria Lishak, Nick Hodgson, Isabela Granic, and Philip David Zelazo. 2016. Executive function in children with externalizing and comorbid internalizing behavior problems. Journal of Child Psychology and Psychiatry 57: 30–38. [Google Scholar] [CrossRef]
- Zelazo, Philip David. 2006. The Dimensional Change Card Sort (DCCS): A method of assessing executive function in children. Nature Protocols 1: 297–301. [Google Scholar] [CrossRef]
- Zelazo, Philip David. 2015. Executive function: Reflection, iterative reprocessing, complexity, and the developing brain. Developmental Review 38: 55–68. [Google Scholar] [CrossRef]


| Baseline Characteristics Category 1 | Baseline Characteristics Subcategory | n | % |
|---|---|---|---|
| Sex | Female | 4744 | 48.0 |
| Male 2 | 5131 | 52.0 | |
| Race/ethnicity | White | 5422 | 54.9 |
| Black | 1352 | 13.7 | |
| Hispanic 2 | 1873 | 18.9 | |
| Asian | 203 | 2.1 | |
| Other | 1025 | 10.4 | |
| Highest parental education | <HS diploma 2 | 505 | 5.1 |
| HS diploma/GED | 944 | 9.6 | |
| Some college | 2897 | 29.3 | |
| Bachelor | 2894 | 29.3 | |
| Post-graduate degree | 2635 | 26.7 | |
| Parent marital status | Married | 6886 | 69.7 |
| Not married 2 | 2619 | 26.5 | |
| Separated | 370 | 3.8 | |
| Household income 3 | <50 K 2 | 2856 | 28.9 |
| ≥50 K and <100 K | 2811 | 28.5 | |
| ≥100 K | 4208 | 42.6 | |
| Sibling status (family) | Single 2 | 6728 | 68.1 |
| Sibling | 1313 | 13.3 | |
| Twin | 1807 | 18.3 | |
| Triplet | 27 | 0.3 | |
| Site | Site01 | 275 | 2.8 |
| Site02 | 489 | 5.0 | |
| Site03 | 486 | 4.9 | |
| Site04 | 605 | 6.1 | |
| Site05 | 314 | 3.2 | |
| Site06 | 510 | 5.2 | |
| Site07 | 276 | 2.8 | |
| Site08 | 303 | 3.1 | |
| Site09 | 319 | 3.2 | |
| Site10 | 579 | 5.9 | |
| Site11 | 395 | 4.0 | |
| Site12 | 501 | 5.1 | |
| Site13 | 645 | 6.5 | |
| Site14 | 565 | 5.7 | |
| Site15 | 338 | 3.4 | |
| Site16 | 934 | 9.4 | |
| Site17 | 491 | 5.0 | |
| Site18 | 343 | 3.5 | |
| Site19 | 436 | 4.4 | |
| Site20 | 606 | 6.1 | |
| Site21 | 438 | 4.4 | |
| Site22 | 27 | 0.3 |
| Assessments/Behaviors 1 | M | SD | Range | Skew | Kurtosis |
|---|---|---|---|---|---|
| Picture Vocab | 84.8 | 8.0 | 29–119 | 0.15 | 0.65 |
| Flanker | 94.3 | 8.9 | 54–116 | −1.00 | 1.57 |
| List Sort | 97.1 | 11.9 | 36–136 | −0.55 | 0.91 |
| Card Sort | 92.8 | 9.4 | 50–120 | −0.82 | 2.21 |
| Pattern Comparison | 88.2 | 14.5 | 30–140 | −0.20 | −0.09 |
| Picture Sequence | 103.0 | 12.0 | 76–136 | 0.25 | −0.40 |
| Oral Reading | 91.1 | 6.8 | 63–119 | 0.09 | 1.48 |
| RAVLT | 9.3 | 3.2 | 0–15 | −0.41 | −0.11 |
| Matrix Reasoning | 10.0 | 3.0 | 1–19 | 0.04 | 0.20 |
| LMT | 0.6 | 0.2 | 0–1 | 0.22 | −0.40 |
| INT | 5.0 | 5.5 | 0–51 | 1.93 | 5.02 |
| EXT | 4.4 | 5.8 | 0–49 | 2.34 | 7.24 |
| Stress | 2.9 | 3.3 | 0–24 | 1.79 | 3.77 |
| Assessments 2 | 1 | 2 | 3 | 4 | 5 | 6 | 7 | 8 | 9 | 10 |
|---|---|---|---|---|---|---|---|---|---|---|
| Picture Vocab | - | |||||||||
| Flanker | 0.25 | - | ||||||||
| List Sort | 0.41 | 0.29 | - | |||||||
| Card Sort | 0.29 | 0.44 | 0.32 | - | ||||||
| Pattern Comparison | 0.19 | 0.38 | 0.21 | 0.42 | - | |||||
| Picture Sequence | 0.24 | 0.20 | 0.34 | 0.27 | 0.20 | - | ||||
| Oral Reading | 0.53 | 0.27 | 0.40 | 0.28 | 0.19 | 0.23 | - | |||
| RAVLT | 0.30 | 0.21 | 0.34 | 0.27 | 0.17 | 0.41 | 0.31 | - | ||
| Matrix Reasoning | 0.35 | 0.22 | 0.36 | 0.26 | 0.12 | 0.27 | 0.35 | 0.29 | - | |
| LMT | 0.27 | 0.24 | 0.28 | 0.26 | 0.23 | 0.22 | 0.34 | 0.23 | 0.27 | - |
| Factor Loadings 3 | |||||
|---|---|---|---|---|---|
| Factors 2 | Neurocognitive Tasks 2 | 1 | 2 | 3 | Communality |
| Factor 1: VA | Oral Reading | 0.76 | 0.56 | ||
| Picture Vocab | 0.69 | 0.50 | |||
| Matrix Reasoning | 0.37 | 0.25 | 0.30 | ||
| List Sort | 0.37 | 0.28 | 0.39 | ||
| LMT | 0.25 | 0.23 | |||
| Factor 2: EF/PS | Pattern Comparison | 0.67 | 0.39 | ||
| Card Sort | 0.65 | 0.48 | |||
| Flanker | 0.58 | 0.38 | |||
| Factor 3: WM/EM | Picture Sequence | 0.71 | 0.48 | ||
| RAVLT | 0.52 | 0.39 | |||
| Eigenvalue | 1.65 | 1.35 | 1.11 | ||
| Percent of total variance | 16% | 14% | 11% | ||
| Total variance | 41% | ||||
| Factors 1 | 1 | 2 | 3 |
|---|---|---|---|
| VA (Factor 1) | – | ||
| EP/PS (Factor 2) | 0.51 | – | |
| WM/EM (Factor 3) | 0.52 | 0.49 | – |
| Loadings 3 | ||||
|---|---|---|---|---|
| Components 2 | Neurocognitive Tasks 2 | 1 | 2 | 3 |
| Component 1: | Oral Reading | 0.82 | ||
| General Ability | Picture Vocab | 0.75 | ||
| LMT | 0.50 | |||
| List Sort | 0.47 | 0.49 | ||
| Component 2: | Pattern Comparison | 0.81 | ||
| Executive Function | Card Sort | 0.71 | ||
| Flanker | 0.71 | |||
| Component 3: | Picture Sequence | 0.87 | ||
| Learning/Memory | RAVLT | 0.71 | ||
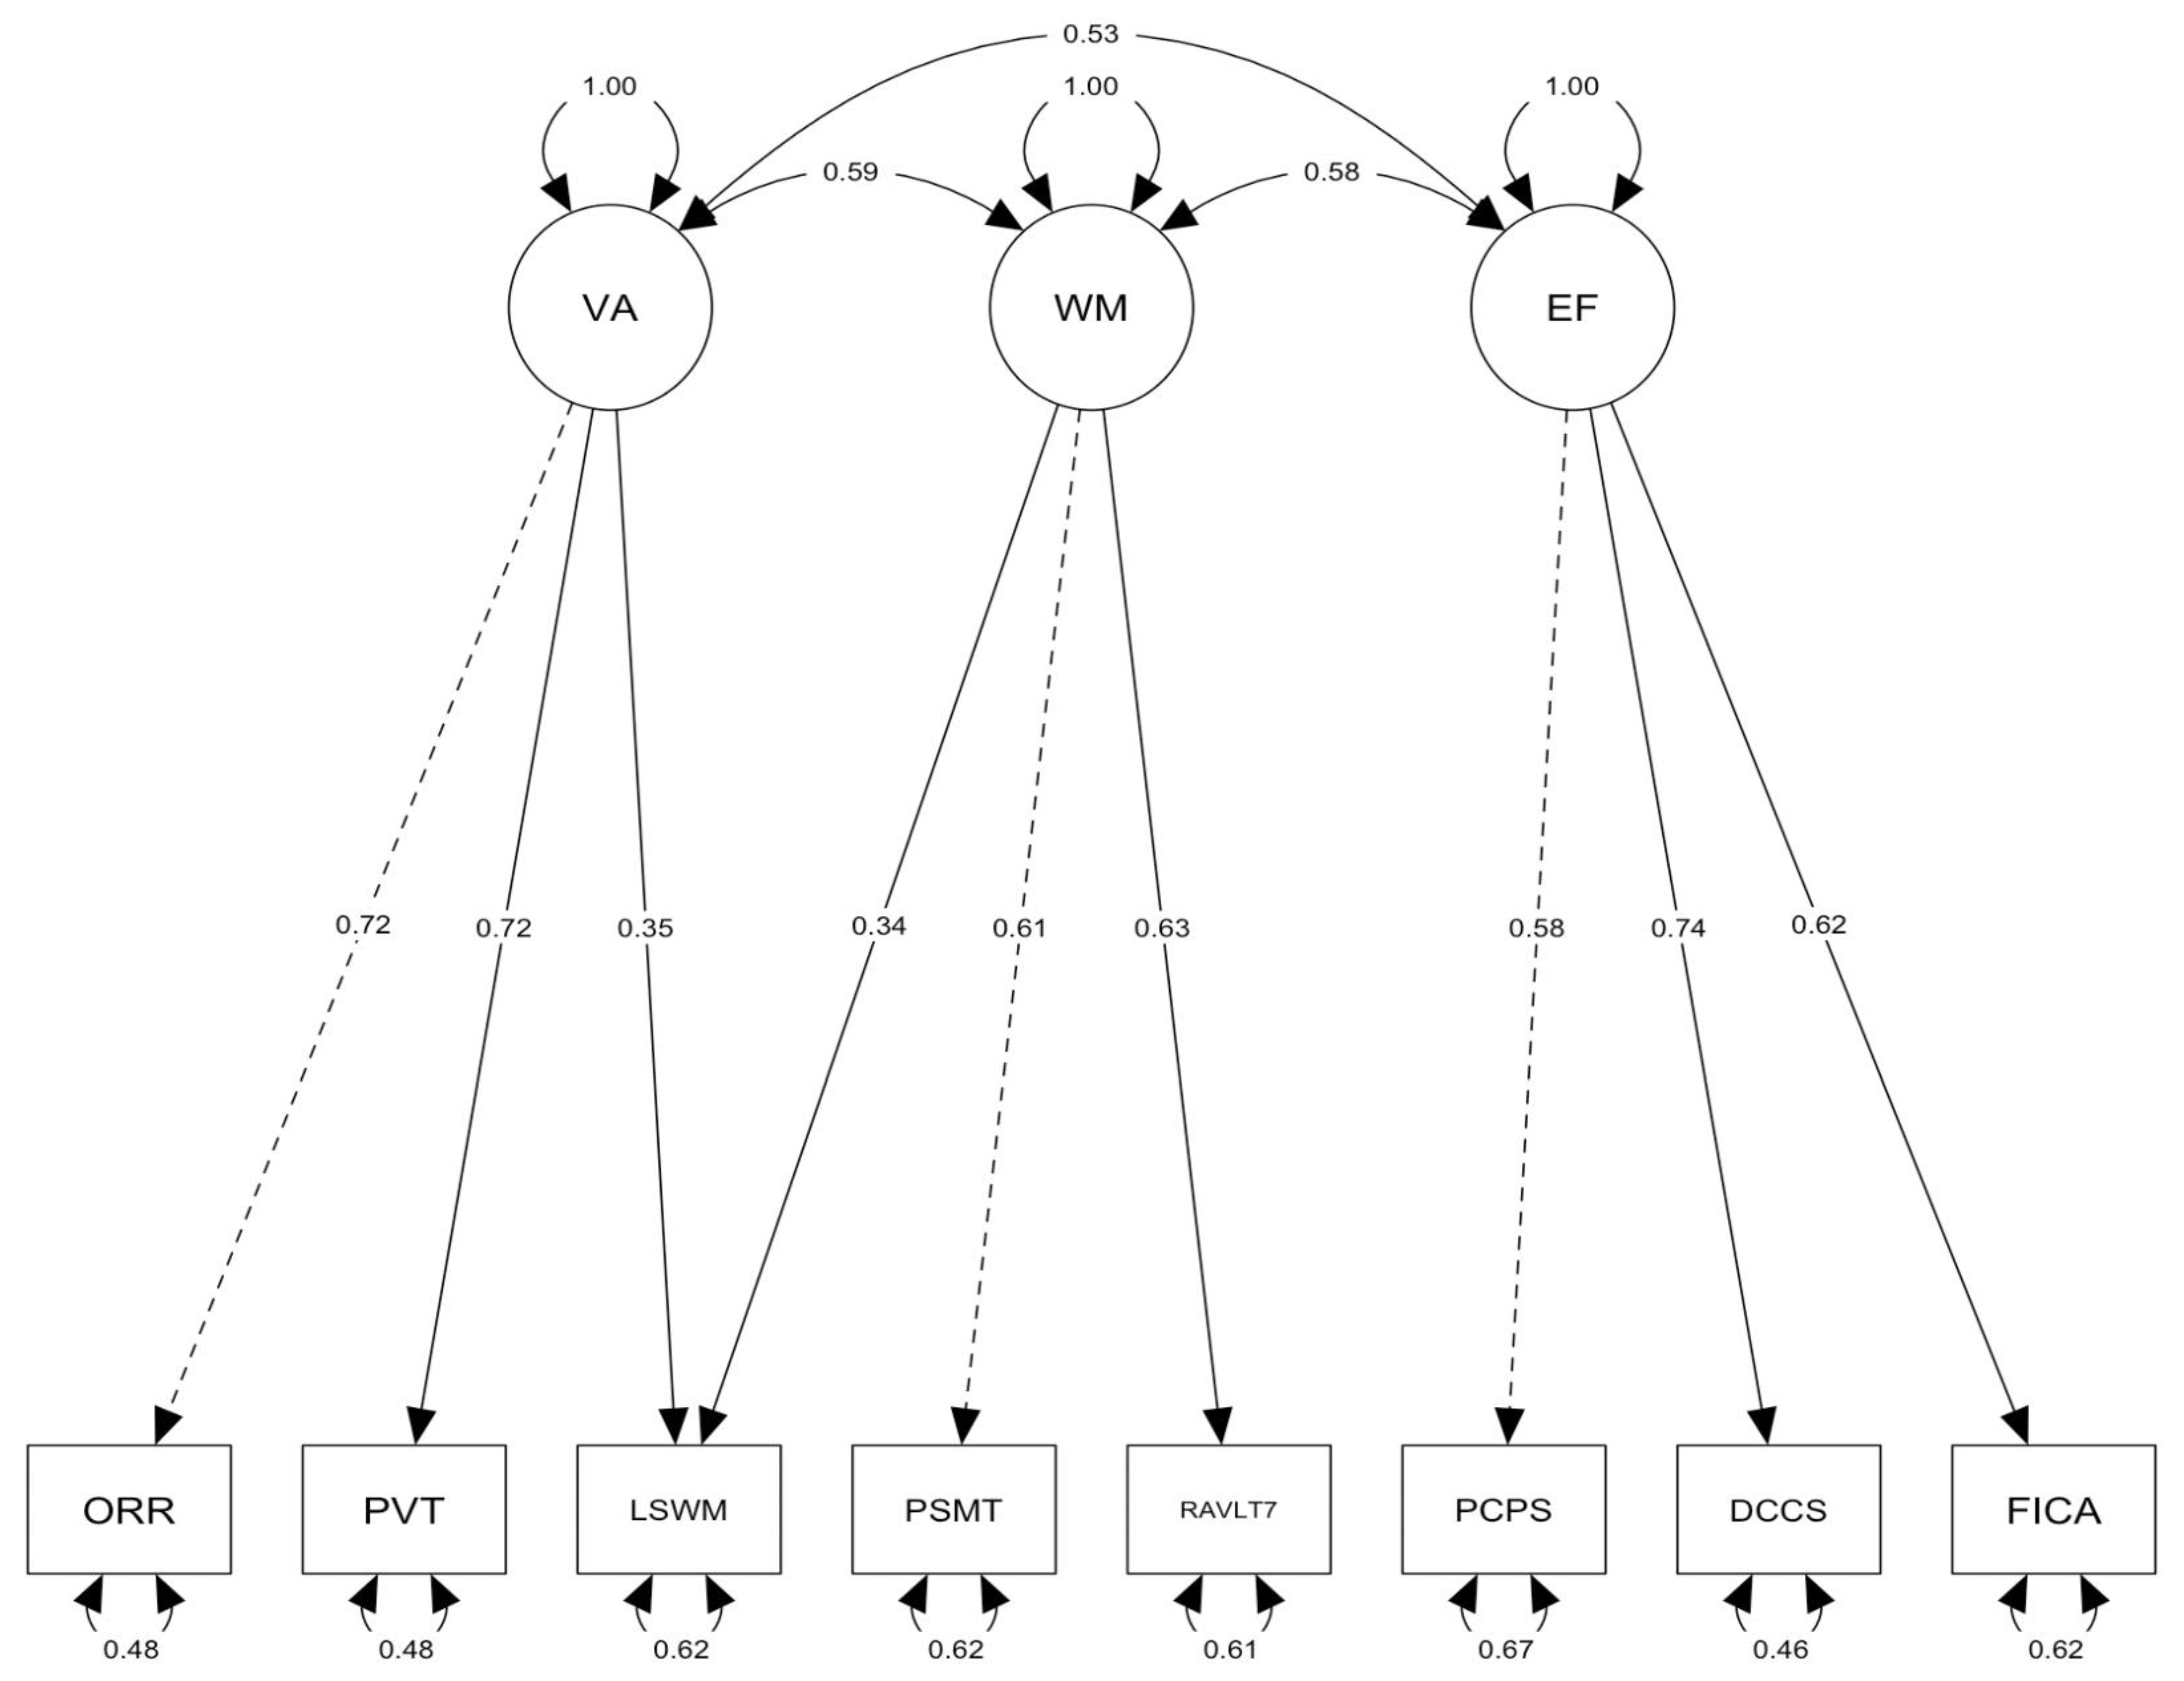
| Latent Variable 2 | Standardized Estimate | Coefficient | Standard Error | z-Value | p-Value |
|---|---|---|---|---|---|
| VA | |||||
| Oral Reading | 0.724 | 1.000 | |||
| Picture Vocab | 0.719 | 1.165 | 0.035 | 33.167 | .000 |
| List Sort 3 | 0.351 | 0.858 | 0.059 | 14.452 | .000 |
| EF/PS | |||||
| Pattern Comparison | 0.576 | 1.000 | |||
| Card Sort | 0.738 | 0.827 | 0.028 | 30.068 | .000 |
| Flanker | 0.618 | 0.668 | 0.023 | 28.976 | .000 |
| WM/EM | |||||
| Picture Sequence | 0.613 | 1.000 | |||
| RAVLT | 0.628 | 0.274 | 0.010 | 26.106 | .000 |
| List Sort 3 | 0.338 | 0.565 | 0.044 | 12.836 | .000 |
| Assessments 1 | Method | 1 | 2 | 3 | 4 | 5 | 6 |
|---|---|---|---|---|---|---|---|
| VA (Factor 1) | Spearman’s rho | - | |||||
| Pearson’s r | - | ||||||
| EF/PS (Factor 2) | Spearman’s rho | 0.68 | - | ||||
| Pearson’s r | 0.70 | - | |||||
| WM/EM (Factor 3) | Spearman’s rho | 0.75 | 0.70 | - | |||
| Pearson’s r | 0.78 | 0.73 | - | ||||
| EXT | Spearman’s rho | −0.12 | −0.12 | −0.14 | - | ||
| Pearson’s r | −0.15 | −0.14 | −0.16 | - | |||
| INT | Spearman’s rho | −0.00 | −0.03 | −0.03 | 0.53 | - | |
| Pearson’s r | −0.02 | −0.05 | −0.05 | 0.55 | - | ||
| Stress | Spearman’s rho | −0.10 | −0.11 | −0.12 | 0.73 | 0.75 | - |
| Pearson’s r | −0.11 | −0.12 | −0.13 | 0.73 | 0.83 | - |
| Variable 2 | Internalizing | Externalizing | Stress Problems | |||
|---|---|---|---|---|---|---|
| Estimate | SE | Estimate | SE | Estimate | SE | |
| VA (Factor 1) | 0.079 *** | 0.023 | −0.043 | 0.022 | 0.030 | 0.023 |
| EF/PS (Factor 2) | −0.058 ** | 0.022 | −0.050 * | 0.021 | −0.079 *** | 0.021 |
| WM/EM (Factor 3) | −0.064 * | 0.025 | −0.096 *** | 0.025 | −0.105 *** | 0.025 |
| R2 | 0.005 | 0.030 | 0.022 | |||
| Externalizing | Internalizing | Stress Problems | |||||||
|---|---|---|---|---|---|---|---|---|---|
| Variable 2,3 | Coef | SE | p-Value | Coef | SE | p-Value | Coef | SE | p-Value |
| Intercept | 0.543 | 0.07 | .000 *** | 0.515 | 0.07 | .000 *** | 0.501 | 0.07 | .000 *** |
| VA (Factor 1) | −0.026 | 0.02 | .251 | 0.089 | 0.02 | .000 *** | 0.035 | 0.02 | .131 |
| EF/PS (Factor 2) | −0.049 | 0.02 | .020 * | −0.059 | 0.02 | .006 ** | −0.078 | 0.02 | .000 *** |
| WM/EM (Factor 3) | −0.085 | 0.02 | .001 *** | −0.054 | 0.03 | .030 * | −0.095 | 0.02 | .000 *** |
| Age | 0.007 | 0.01 | .593 | 0.005 | 0.01 | .750 | −0.001 | 0.01 | .968 |
| Female | −0.015 | 0.03 | .595 | 0.019 | 0.03 | .504 | 0.019 | 0.03 | .504 |
| White | 0.038 | 0.04 | .361 | 0.052 | 0.04 | .216 | 0.049 | 0.04 | .232 |
| Black | −0.039 | 0.05 | .452 | −0.059 | 0.05 | .256 | −0.094 | 0.05 | .067 |
| Asian | 0.033 | 0.11 | .756 | 0.235 | 0.11 | .029 * | 0.168 | 0.11 | .117 |
| Other | −0.067 | 0.06 | .240 | −0.003 | 0.06 | .965 | 0.023 | 0.06 | .688 |
| HS Diploma/GED | −0.475 | 0.09 | .000 *** | −0.465 | 0.09 | .000 *** | −0.481 | 0.09 | .000 *** |
| Some College | −0.461 | 0.08 | .000 *** | −0.491 | 0.08 | .000 *** | −0.481 | 0.08 | .000 *** |
| Bachelor | −0.569 | 0.08 | .000 *** | −0.529 | 0.08 | .000 *** | −0.496 | 0.08 | .000 *** |
| Post-Graduate | −0.457 | 0.08 | .000 *** | −0.501 | 0.08 | .000 *** | −0.471 | 0.08 | .000 *** |
| Married | −0.022 | 0.04 | .542 | 0.001 | 0.04 | .979 | −0.004 | 0.04 | .909 |
| Separated | 0.025 | 0.08 | .752 | −0.042 | 0.08 | .597 | −0.008 | 0.08 | .917 |
| ≥50 K and <100 K | −0.181 | 0.04 | .000 *** | −0.178 | 0.04 | .000 *** | −0.170 | 0.04 | .000 *** |
| ≥100 K | −0.024 | 0.04 | .544 | −0.049 | 0.04 | .231 | −0.050 | 0.04 | .216 |
Disclaimer/Publisher’s Note: The statements, opinions and data contained in all publications are solely those of the individual author(s) and contributor(s) and not of MDPI and/or the editor(s). MDPI and/or the editor(s) disclaim responsibility for any injury to people or property resulting from any ideas, methods, instructions or products referred to in the content. |
© 2023 by the authors. Licensee MDPI, Basel, Switzerland. This article is an open access article distributed under the terms and conditions of the Creative Commons Attribution (CC BY) license (https://creativecommons.org/licenses/by/4.0/).
Share and Cite
Moore, D.M.; Conway, A.R.A. The Structure of Cognitive Abilities and Associations with Problem Behaviors in Early Adolescence: An Analysis of Baseline Data from the Adolescent Brain Cognitive Development Study. J. Intell. 2023, 11, 90. https://doi.org/10.3390/jintelligence11050090
Moore DM, Conway ARA. The Structure of Cognitive Abilities and Associations with Problem Behaviors in Early Adolescence: An Analysis of Baseline Data from the Adolescent Brain Cognitive Development Study. Journal of Intelligence. 2023; 11(5):90. https://doi.org/10.3390/jintelligence11050090
Chicago/Turabian StyleMoore, Dawn Michele, and Andrew R. A. Conway. 2023. "The Structure of Cognitive Abilities and Associations with Problem Behaviors in Early Adolescence: An Analysis of Baseline Data from the Adolescent Brain Cognitive Development Study" Journal of Intelligence 11, no. 5: 90. https://doi.org/10.3390/jintelligence11050090