Article

Can GE-Covariance Originating in Phenotype to Environment Transmission Account for the Flynn Effect?

by
Janneke M. De Kort
1,*,
Conor V. Dolan
1,
Kees-Jan Kan
1,2,
Catharina E. M. Van Beijsterveldt
1,3,
Meike Bartels
1,3,4 and
Dorret I. Boomsma
1,3,4
1
Department of Biological Psychology, VU University, van der Boechorststraat 1, 1081 BT Amsterdam, The Netherlands
2
Department of Methods, VU University, van der Boechorststraat 1, 1081 BT Amsterdam, The Netherlands
3
EMGO+ Institute for Health and Care, van der Boechorststraat 7, 1081 BT Amsterdam, The Netherlands
4
Neuroscience Campus Amsterdam (NCA), de Boelelaan 1085, 1081 HV Amsterdam, The Netherlands
*
Author to whom correspondence should be addressed.
J. Intell. 2014, 2(3), 82-105; https://doi.org/10.3390/jintelligence2030082
Submission received: 10 February 2014 / Revised: 20 August 2014 / Accepted: 21 August 2014 / Published: 1 September 2014
(This article belongs to the Special Issue Methodological Advances in Understanding the Flynn Effect)

Abstract

:
The Dickens and Flynn model of the Flynn effect (generational increases in mean IQ) assigns an important role to genotype-environment covariance (GE-cov). We quantify GE-cov in a longitudinal simplex model by modeling it as phenotype to environment (Ph->E) transmission in twin data. The model fits as well as the standard genetic simplex model, which assumes uncorrelated genetic and environmental influences. We use the results to explore numerically the possible role of GE-cov in amplifying increases in environmental means. Given the estimated Ph->E transmission parameters, GE-cov resulted in an amplification (in std units) of a factor 1.57 (full scale IQ) to 1.7 (performance IQ). The results lend credence to the role of GE-cov in the Flynn effect.

1. Introduction

Dickens and Flynn [1] proposed an elaborate model to account for the Flynn (a.k.a., Lynn–Flynn) effect, i.e., increases in average of psychometric measures of cognitive ability in the order of 2/3 of one standard deviation per 30 years (10 points given a standard deviation of 15) [2,3]. Their model combines changes in environmental means within a developmental process, which gives rise to genotype-environment covariance (GE-cov). Such covariance is consistent with theoretical notions concerning the interplay of genotype and environment in cognitive development [4,5,6,7]. These include the matching of genetic and environmental influences due to passive GE-cov (the child’s environment being a function of the parental intelligence), and active GE-cov(the developing child creating or choosing environments matching his or her intelligence). While in theory, GE-cov is considered to be relevant to cognitive development, in the actual modeling of intelligence in genetically informative samples (e.g., twins), the analyses are usually based on the assumption of uncorrelated genetic and environmental effects. This is notably the case in longitudinal and multivariate modeling within the classical twin design, although the estimation of GE-cov has been considered in extended family and twin designs [8,9,10,11].
Given the relevance of GE-cov to the Dickens and Flynn (D&F) model, and to cognitive development in general, the aim of the present paper is to model GE-cov in intelligence by means of phenotype to environment (Ph->E) transmission in longitudinal twin data. Ph->E transmission implies that the phenotype (cognitive ability) at time t (Pht) is predictive of environmental (relevant to the phenotype) influences at time t + 1, Et+1. The direct regression of Et+1 on Pht is compatible with active and passive GE-cov. Ph->E transmission gives rise to the correlation of genetic influences at time t with the environmental influences at time t + 1, through the mediation of the phenotype at time t. Dickens and Flynn considered the influence of GE-cov in four different effects: Matching, averaging, and multiplication either within the individual, or within the social context [1]. The former three pertain to the individual environment, whereas the latter pertains to the social environment. The longitudinal twin model presented below includes the effects of matching, averaging and multiplication, but does not include the social multiplier. However the proposed model does have the virtue of being operational, i.e., it can be applied to longitudinal twin data. Fitting the model provides empirical estimates of GE-cov representative of Dutch children born between 1985 and 1996, and so shines some light on the plausibility of the essential role of GE-cov within the Dickens and Flynn model. Furthermore, using the results obtained, we can assess the degree to which hypothetical changes in environmental (latent) means and Ph->E transmission parameters account for the Flynn effect. Specifically, we determine the degree to which increases in the latent environmental means in combination with changes in Ph->E transmission parameters give rise to changes in phenotypic means. The changes in environmental means are supposed to be due to environmental improvements relevant to the development of cognitive abilities (these may in principle include social multiplier effects).
The outline of this paper is as follows. We first present two competing models, the standard ACE simplex, comprising additive genetic (A), common or shared (by twins) environmental effects (C), and unshared environmental effects (E) and the extended AE simplex which includes Ph->E transmission. Here, we explain how our conceptualization of Ph->E transmission is in line with the concept of matching as proposed by Dickens and Flynn [1]. Second, we present the results of fitting these competing models to full scale IQ (FSIQ) and performance IQ (perfIQ) data observed at four repeated occasions in monozygotic (MZ) and dizygotic (DZ) twins. We fit a standard genetic simplex model to the data [12,13,14], to assess the goodness of fit of this model. We call this the standard model as, like most applications of genetic covariance structure modeling to intelligence data, it does not include GE-cov. The phenotypic covariance structure is subjected to an orthogonal decomposition into uncorrelated additive genetic and shared and unshared environmental components. Subsequently, we fit the alternative model, based on the simplex model, but including Ph->E transmission. This model includes additive genetic and environmental effects. Ph->E transmission results in GE-cov and correlated environment, which differs from the correlated environment due to shared environmental influences. We assess the goodness of fit of the alternative model in the light of the standard model, as it is important to establish that our alternative model fits adequately, relative to this standard model. Thirdly, we extend the AE model to include environmental means. We explain how the relation between the environmental means in combination with Ph->E transmission is in line with Dickens and Flynn’s notion of the multiplier [1]. To explore the degree to which changes in environmental means, in combination with changes in Ph->E transmission parameters, can contribute to the Flynn effect, we use the parameters of the AE model, as plausible values. We conclude the paper with a discussion.

2. Longitudinal Genetic Modeling

2.1. The Standard ACE Simplex Model Applied to Twin Data

Genetic covariance structure modeling (GCSM) involves the decomposition of the phenotypic covariance matrix into genetic and environmental covariance matrices, which are simultaneously subject to covariance structure modeling [9,15]. In most applications of GCSM within the classical twin design (involving MZ and DZ twins), the decomposition is orthogonal in the sense that the genetic and environmental sources of phenotypic differences are uncorrelated. This model is depicted in Figure 1. To ease model specification into a time specific part and the longitudinal model, let yit denote the FSIQ or perfIQ test score of twin member i (i = 1, 2) at time t (t = 1, ..., T; indexed by age, see below), where the phenotype yit is decomposed into a part, y*it, that is subject to the longitudinal model, and the time specific part, zit, which may include zero mean occasion specific influences
yit = β0t + y*it + zit,
where β0t is the phenotypic mean at time t. The score zit is a zero mean time specific residual, which is subject to its own decomposition:
zit = ait + cit + eit,
where ait, cit and eit are time specific effect, i.e., uncorrelated over time. The term eit includes measurement error. The score y*it is decomposed into additive genetic (A), shared environmental (C), and unshared environmental (E) scores
y*it =Ait + Cit + Eit
where Ait, Cit, and Eit are the zero mean additive genetic, shared environmental and unshared environmental scores at time t, respectively. Each latent source of individual differences is subject to the following longitudinal model (see Figure 1):
Ait = βAt,t-1 Ait-1 + ζAit
Cit = βCt,t-1 Cit-1 + ζCit
Eit = βEt,t-1 Eit-1 + ζEit
Figure 1. The standard additive genetic, common (shared) and unshared environment (ACE) simplex model depicted for both twins, where y*’s represent the series of observed phenotypes, A’s represent the underlying additive genetic series, C’s represent the underlying shared environment series, and E’s represent the underlying unique environment series. Within each series, ζ represents innovation and β represents stability. Conform biometric theory, the covariance between the A’s at each time point is set equal to the var(At) (for MZ) or 0.5 var(At) (for DZ twins). For clarity reasons, time specific effects (i.e., a, c, and e) and phenotypic means are omitted. Note that the scaling and parameter labels are used throughout the series.
Jintelligence 02 00082 g001
At t = 1, we set Ai1 = ζAi1, Ci1 = ζCi1, and Ei1 = ζEi1. Note that the latent variables A, C, and E at time t are regressed on the variables at time t-1. The variables ζAit, ζCit, and ζEit are uncorrelated with each other, but correlated over time (Equations (4)–(6)). As such, this model provides a decomposition into uncorrelated genetic and environmental components of phenotypic variance at each time point (Equation (2)), and of phenotypic stability (covariance) between time points (Equations (3)–(6)). The phenotypic stability is a function of the genotypic and environmental stabilities, which are quantified as explained variances of the latent regressions (Equations (4)–(6)). These depend both on the magnitude of the regression coefficients (βAt,t-1, βCt,t-1, βEt,t-1) and the (innovation) residual variances (var(ζAit), var(ζCit), var(ζEit)).
The model is identified by constraining cor(ζA1t ζA2t) = cor(a1t a2t) = 0.5 in DZ twins, and cor (ζA1t ζA2t) = cor(a1t a2t) = 1 in MZ twins, and by constraining cor(ζC1t ζC2t) = cor(c1t c2t) = 1 (note that cor(ζE1t ζE2t) = cor(e1t e2t) = 0, by definition of these environmental influences being unshared). Note that at t = 1 and t = T, the time specific variances are not identified [16]. These variances are identified by imposing the over-identifying constraint that the variance components are equal over time (i.e., var(at) = var(a), var(ct) = var(c), var(et) = var(e), t = 1...4).
The path diagram associated with this model is depicted in Figure 1. This model is quite flexible as it includes other models as special cases. For example, if the residual variance within a latent source of variance (e.g., var(ζAit) (t = 2, ..., T)) tends to zero in the presence of non-zero autoregression, this part of the model tends to a common factor model. We presented the ACE model here, as it counts as a standard model for repeated measures in GCSM of twin data and can therefore serve as a reference model. In the next section, we present our alternative AE* model, which includes Ph->E transmission.

2.2. The AE* Simplex Model with Ph->E Transmission Applied to Twin Data

The alternative model is depicted in Figure 2. Given zero Ph->E transmission, the AE* model is a special case of the standard ACE model. To transform the standard ACE model into alternative AE* model, we first discard the series of shared environmental effects (Cit). We introduce the environmental variables E*it, where we add an asterisk to emphasize that E*it differs from the variable Eit in the standard model. Within the alternative model, E*it represents the total environmental influence, which is partially due to shared environmental factors (hence, the correlation between ζE*1t and ζE*2t), and partially due to unique environmental variance in ζE*it. The ACE model collapses into the AE* model by imposing the constraint: βCt,t-1 = βEt,t-1 (i.e., the values of the autoregression series for the shared and unshared environmental series are set to be equal). As we explain below, we adopt this alternative treatment of environmental effects (E vs. E*) for reasons of (empirical) identification.
As shown in Figure 2, the model also allows Ph->E transmission, via regression of the environmental variables at t, E*1t and E*2t on the twins’ phenotypes at the preceding time y1t-1 and y2t-1 (the relevant parameters are denoted αt and γt). As above, the phenotype at each time point is related to the intercept β0t (the phenotypic mean at time t) the time specific residual (zit), and the zero mean additive genetic (Ait) and environmental variables (E*it):
yit = β0t + yit* + zit,
yit* = Ait + E*it,
Also, the additive genetic variables are subject to the first order autoregression:
Ait = βAt,t-1 Ait-1 + ζAit
However, the environmental variables in twin members 1 and 2 are not only regressed on the preceding environmental variables but also on the preceding phenotypes:
E*1t = βEt,t-1 E*1t-1 + αt y*1t-1 + γt y*2t-1 + ζE*1t
E*2t = βEt,t-1 E*2t-1 + γt y*1t-1 + αt y*2t-1 + ζE*2t ,
where the Ph->E transmission parameters are αt (transmission within a twin member, e.g., αt y*1t-1) and γt (transmission across twin members, e.g., γt y*2t-1). Again at t = 1, we set Ai1 = ζAi1 and E*i1 = ζE*i1. By including the αt parameter, we recognize that the phenotype of each twin member may contribute directly to his or her own environment (i.e., niche picking, [4,5]). By including the γt parameter, we recognize that the phenotype of one twin member may also contribute to the environment of the other twin member (i.e., sibling effects) [14,17,18]. Both niche picking and sibling effects are concepts which match the phenotype to the environment, which plays an important role in D&F model [1]. By substituting y*it in Equations (10a) and (11a) for y*it given in Equations (8), we have:
E*1t = βEt,t-1 E*1t-1 + αt (A1 t-1 + E*1 t-1)+ γt (A2 t-1 + E*2 t-1)+ ζE*1t
E*2t = βEt,t-1 E*2t-1 + γt (A1 t-1 + E*1 t-1)+ αt (A2 t-1 + E*2 t-1)+ ζE*2t
Given to this substitution, it is clear that a part of the environment is under genetic control. This genetic control, due to matching, is expressed in the terms αt(Ai t-1) and γt(Ai t-1). Additionally, when writing out the equation for consecutive time points, it will become evident that due to the interplay between the phenotype and environment, a higher IQ leads to a better environment, which, in turn, leads to a higher IQ. This interplay thus functions as the multiplier.
Note that the rational to introduce Ph->E transmission in the alternative AE model and not in the ACE model is based on statistical considerations. De Kort et al. and Dolan et al. studied the issues of parameter identification and power when allowing Ph->E transmission in both the ACE model and the AE* [19,20]. They showed that the resolution of the Ph->E transmission parameters (αt and γt) is extremely poor in the presence of an independent C simplex (i.e., Equation (5)). This is because Ph->E transmission itself gives rise to correlated environmental variables (see below; Table 4 and Table 5). Within the AE* model, the resolution of the Ph->E transmission parameters improves considerably. In presence of Ph->E transmission, the correlations between ζE*1t and ζE*2t are due to shared environmental influences in addition to the correlated environment originating in the Ph->E transmission [19]. Dolan et al. established that, given four time points, the parameters αt and γt are identified subject to equality constraints (e.g., α2 = α3 and γ2 = γ3) [20]. Here, we impose the over-identifying constraint αt = αt-1 and γt = γt-1, t = 2, 3, 4, and therefore drop the time subscript (i.e., the parameters are denoted α and γ). As above, remaining identification issues are resolved by cor(ζA1t ζA2t) = cor(a1t a2t) = 0.5 in DZ twins, cor(ζA1t ζA2t) = cor(a1t a2t) = 1 in MZ twins, and cor(c1t c2t) = 1. As depicted in Figure 2 and discussed above, at t = 1, we assume that GE-cov is zero. This is a strong assumption, to which we return below.
Figure 2. The AE* simplex model with Ph->E transmission, where parameters α can be interpreted as within twin Ph->E transmission and γ as between twin Ph->E transmission, and where y’s are the series of observed variables, A’s are the underlying additive genetic series, E’s are the underlying unique environment series and * denotes the time point specific environmental covariance (indicative of C). Conform biometric theory, the covariance between the A’s at each time point is set equal to the var(At) (for MZ) or 0.5 var(At) (for DZ twins). For clarity reasons, time specific effects and phenotypic means are omitted. Note that the scaling and parameter labels are used throughout the series.
Jintelligence 02 00082 g002

3. Method

We applied the ACE simplex and the AE* simplex with Ph->E transmission to full scale IQ (i.e., FSIQ) and performance IQ (i.e., perfIQ). The data are obtained from the Netherlands Twin Register (NTR) [21,22], which includes the Young NTR (YNTR) [23]. This register has collected IQ test score using different instruments at consecutive population-based surveys in the Netherlands. The twins were measured at mean (SD) ages of 5.5 years (0.30), 6.8 years (0.19), 9.7 years (0.43), and 12.2 years (0.24) and were born between 1984 and 1996. The IQ scores were obtained using the Revised Amsterdam Children Intelligence Test (RAKIT) [24] at ages 5.5 years, 6.8 years, 9.7 years, and two Dutch versions of the Wechsler Intelligence Scale for Children (WISC-R and WISC-R III) [25,26] at age 9.7 years and 12.2 years. Of the RAKIT, three sub-tests were used to measure performance IQ (exclusion, discs, and hidden figures) and three sub-tests were used to measure verbal IQ (learning names, verbal meaning, and idea production). Of the WISC, either all 12 sub-tests were used to measure performance and verbal IQ, or two sub-tests were used to measure performance IQ (block design, and object assembly) and four sub-tests were used to measure verbal IQ (similarities, vocabulary, arithmetic, digit span). The test scores were subjected to age appropriate scaling, and standardized following the guidelines in the tests’ manuals [24,25,26]. For each age, the combination of nonverbal and verbal IQ was used as a measure of full scale IQ. Note that the use of different tests is due to the different surveys in which the data was gathered and age of the participants. Standardized IQ scores based on the subset of WISC-R scales correlate 0.94 with standardized IQ scores based on all subtests of the WISC-R [27,28]. Additionally, the concurrent validity between the RAKIT and the WISC-R is 0.86 [29].
The total sample size varied as a function of missingness. The FSIQ data comprised 261 MZ and 301 DZ twin pairs. The proportions of observed FSIQ data at t = 1,…,4 are 0.812, 0.295, 0.490, 0.828 (MZ twin 1 and MZ twin 2), 0.774, 0.379, 0.598, 0.797 (DZ twin 1 and DZ twin 2). The perfIQ data comprised 291 MZ and 337 DZ twin pairs. The proportions of observed perfIQ data at t = 1,…,4 are 0.376, 0.333, 0.551, 0.927 (MZ twin 1 and MZ twin 2), 0.438, 0.432, 0.682, 0.909 (DZ twin1 and DZ twin 2).
Given the missingness, the models were fitted using full information maximum likelihood (FIML) estimation in the Mplus 6.11 program [30], assuming multivariate normality (Mplus input files are available from JMdeK, the corresponding author). We evaluated model fit in terms of the χ2 goodness of fit index, incremental fit index TLI (>0.95 acceptable, >0.97 good), the BIC and the sample size adjusted Bayesian Information criterion (adjBIC; the smaller the better), and the RMSEA, with 95% confidence intervals (<0.08 acceptable; <0.05 good). The criteria given in parentheses are based on Schermelleh-Engel, Moosbrugger, and Müller [31]. The FIML estimates of the means, standard deviations, and correlation matrices are given in the appendix. We tested for sex differences in both FSIQ and perfIQ. At none of the time points, sex differences were found to be significant (given α = 0.05/4). As such, we excluded sex from the analyses.
Note that our main objective is to introduce a model that can aid in understanding the Flynn effect. We do not analyze the data thoroughly, but we merely use the data for illustrative purposes. Therefore, we assume that the pattern of missingness does not pose a problem in our analyses as the effect of non-sampling on the means is usually much greater than the effect on the covariance structure. Within our analyses, we focus on the latter. The first analysis in which we fit the standard ACE model merely serves as a reference to evaluate the credibility of our extended AE* model, and the second analysis merely serves as a tool to find credible parameter estimates. Results presented here should be interpreted in this light.

4. Results

4.1. Standard Model: ACE Simplex

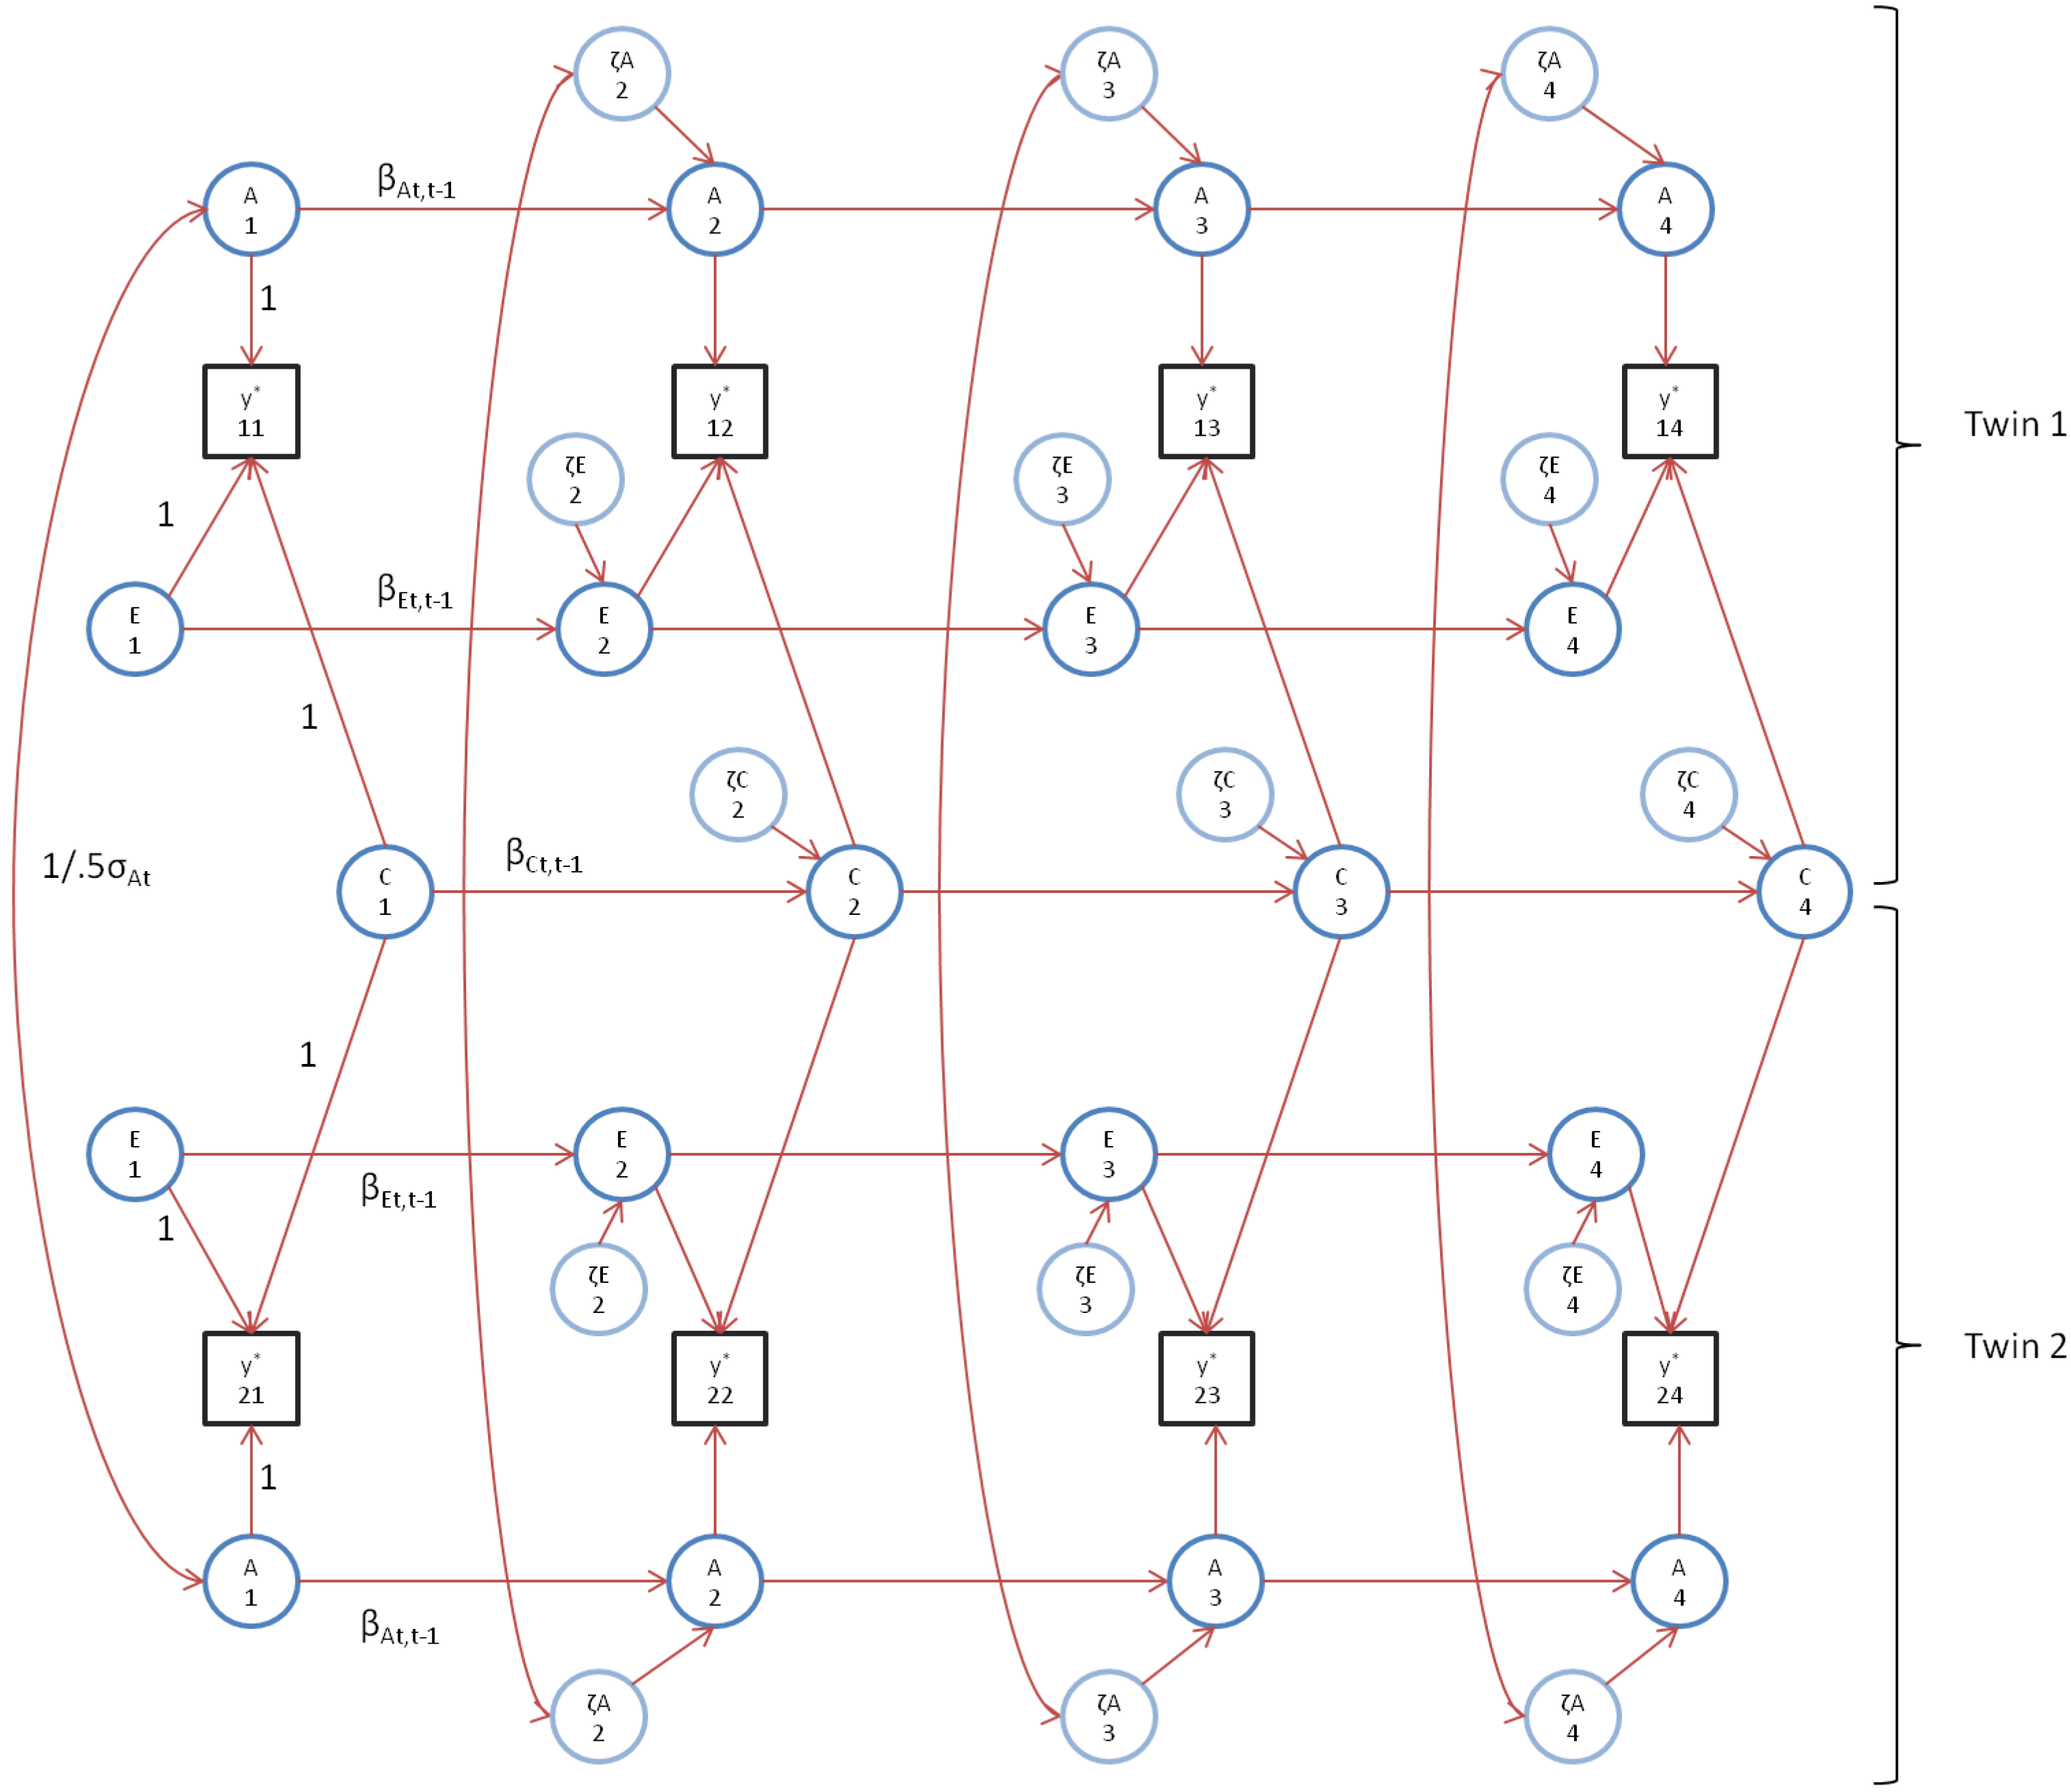
We first fitted the standard genetic simplex model, as depicted in Figure 1 (note that, to avoid clutter, Figure 1 does not include occasion specific effects). As mentioned above, we constrained the occasion specific genetic and environmental variances to be equal over time (var(at) = var(a), var(ct) = var(c), var(et) = var(e), t=1,...,4). For FSIQ, the standard simplex model fitted the data well (χ2(60) = 76.8; TLI = 0.99; adjBIC = 21,470; BIC = 21,559; RMSEA = 0.032 (CI95: 0.0–0.051)). The time-specific genetic variance (denoted var(a) above) (1 parameter) and the variances var(ζA3) and var(ζA4) (two parameters) were estimated at zero. They were therefore fixed to zero, and the model refitted: χ2(63) = 76.8; TLI = 0.99; adjBIC = 21,460; BIC = 21,540; RMSEA = 0.028 (CI95: 0.0–0.048). The fact that the χ2 is unchanged is consistent with the fact that the fixed variances were estimated as zero. Although some parameters were not significant (at α = 0.01, say) in this model, we made no effort to further prune the model. In the analysis of perfIQ, we obtained similar results. The standard simplex model fitted the data well (χ2(60) = 56.9; TLI > 0.99; adjBIC = 18,496; BIC = 18,585; RMSEA = 0.0 (CI95: 0.0–0.035)). The time-specific genetic variance was zero (one parameter), as were var(ζA2), var(ζA3) (two parameters), and var(ζC2), var(ζC3), var(ζC4), and var(ζE3) (four parameters). We refitted the model with these parameters fixed to zero, and obtained χ2(67) = 56.9, TLI>0.99, adjBIC = 18,475, BIC = 18,541, and RMSEA = 0.0 (CI95: 0.0–0.025).
Based on the parameter estimates, we calculated genetic and environmental covariance matrices, and the standardized variance components (Table 1). These results are quite consistent with the literature [32,33,34,35,36]. For instance, the relative contribution of additive genetic influences to the phenotypic (co-) variance increases (FSIQ: 0.27–0.54; perfIQ: 0.29–0.53), and that of shared environmental influences decreases (FSIQ: 0.50–0.24 perfIQ: 0.36–0.18). Genetic influences are highly stable (genetic correlations 0.801–1) in contrast to unshared environmental influences (correlations 0.002–0.205). We note that the results obtained with FSIQ and perfIQ are quite similar.
Table 1. Standard ACE simplex model results of full scale IQ (FISQ) and performance IQ (perfIQ): Correlations among A, E, and C, standard deviations, variances and standardized variance. Note in this model A, C, and E are uncorrelated.
FSIQperfIQ
Age in years:5.56.89.712.25.56.89.712.2
AA
Correlations1.0001.000
0.8011.0001.0001.000
0.8011.0001.0001.0001.0001.000
0.8011.0001.0001.0000.9590.9590.9591.000
Standard deviation7.6910.2111.8410.527.5811.6712.3812.37
Variance59.1104.3140.1110.857.4136.2153.3152.9
Standardized variance0.270.480.600.540.290.500.600.53
EE
Correlations1.0001.000
0.1121.0000.0771.000
0.0560.2121.0000.0480.2051.000
0.0300.1150.1191.0000.0020.0080.0051.000
Standard deviation7.027.936.806.788.359.418.289.18
Variance49.362.946.246.069.688.568.584.2
Standardized variance0.230.290.200.220.350.320.270.29
CC
Correlations1.0001.000
0.7561.0000.7601.000
0.4570.4781.0000.6970.6581.000
0.4000.4180.6751.0000.7680.7240.6651.000
Standard deviation10.397.086.787.058.396.965.887.16
Variance107.850.146.049.870.548.534.651.3
Standardized variance0.500.230.200.240.360.180.140.18

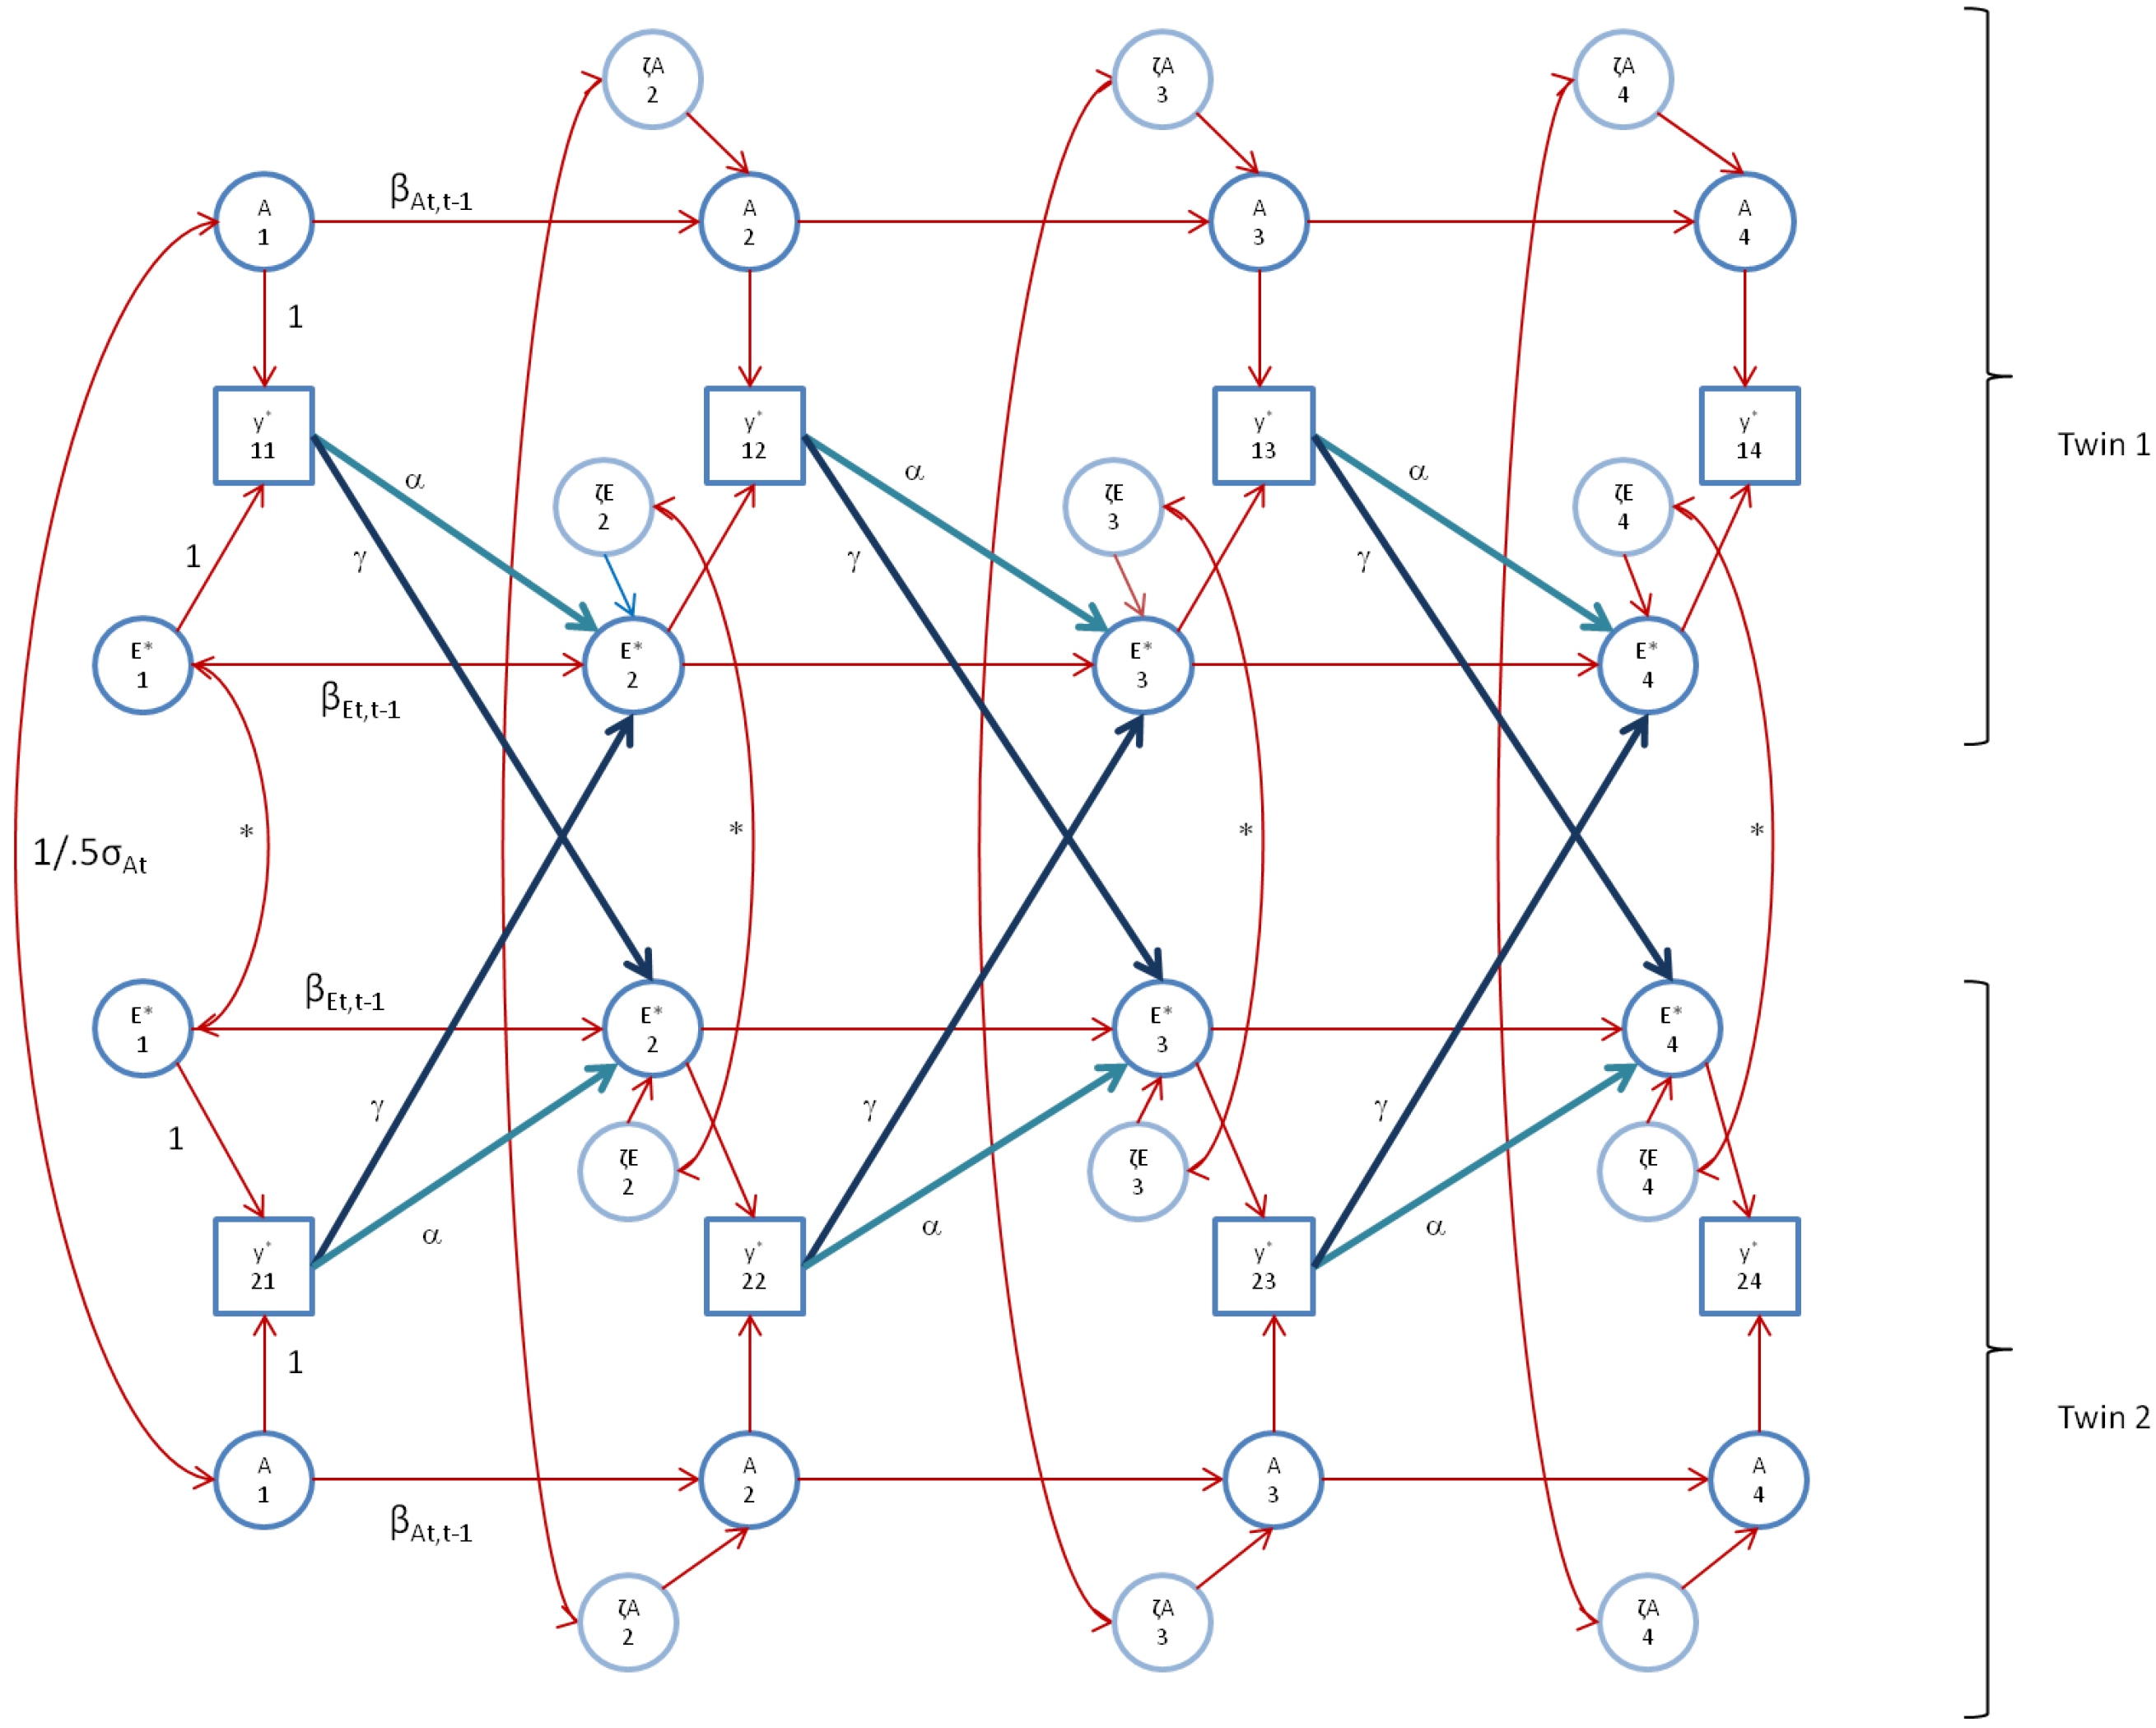
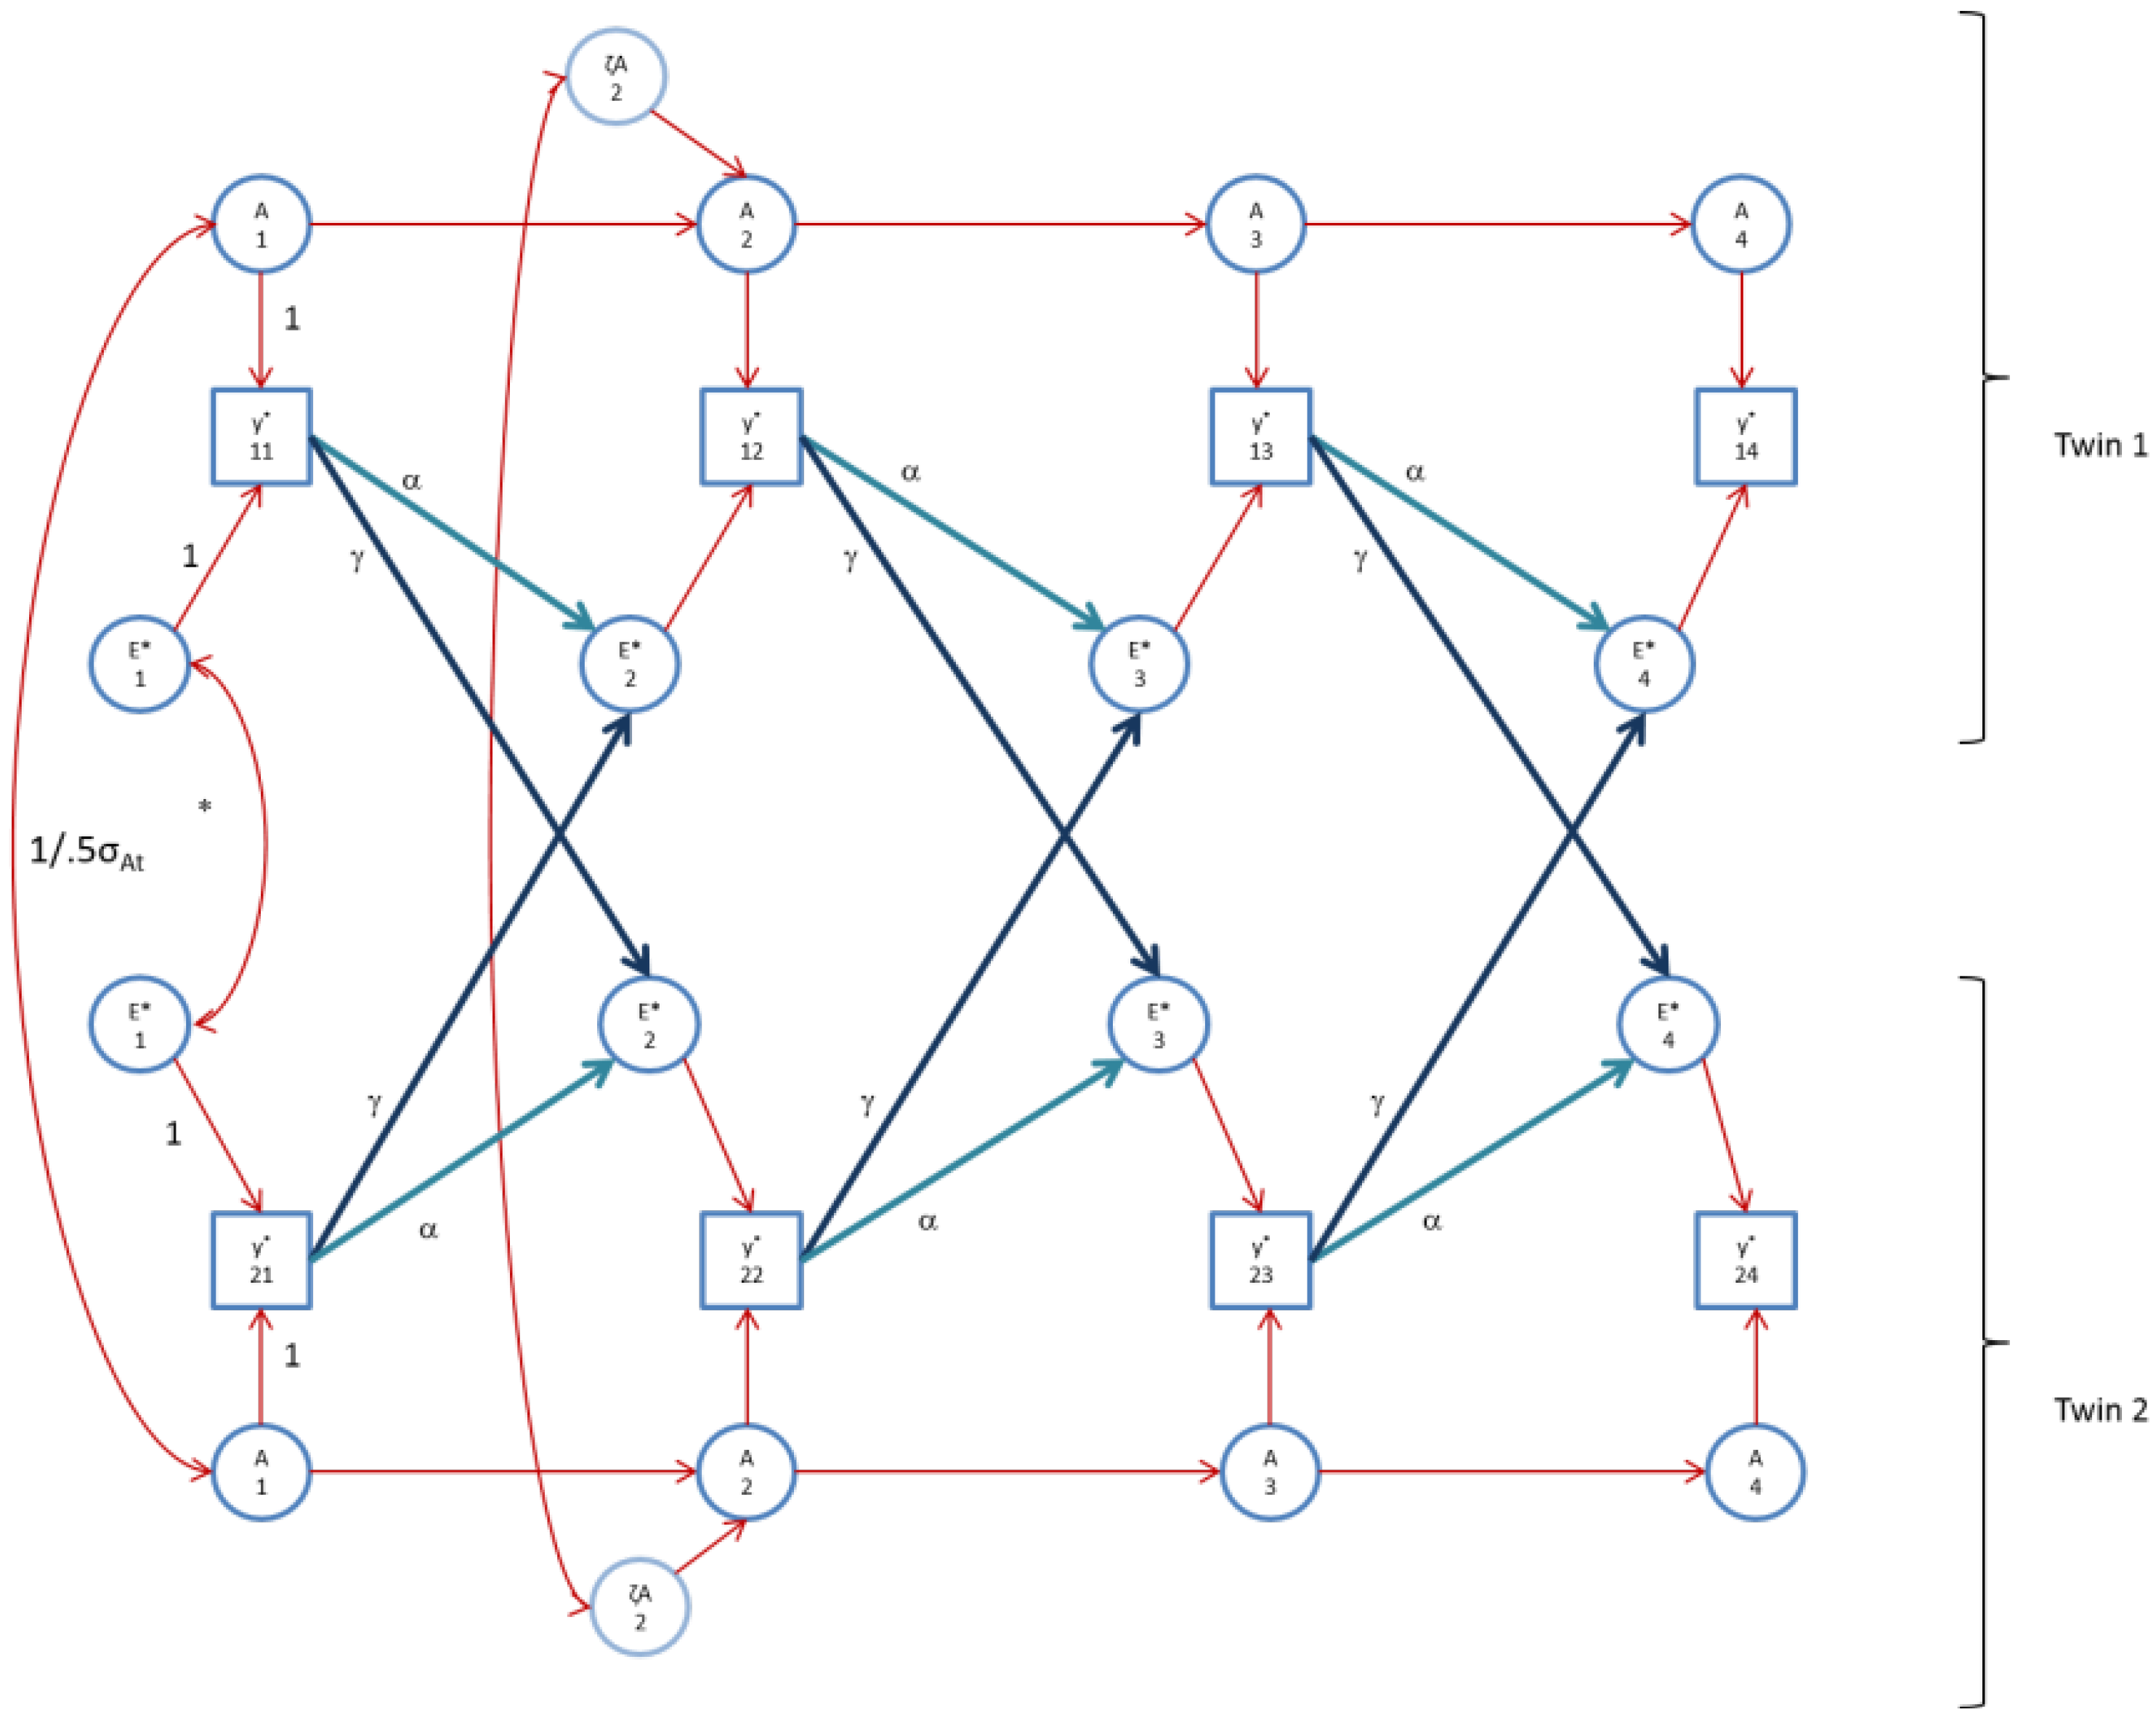
4.2. Alternative Model: AE* Simplex with Ph->E Transmission

We fitted the alternative model, the AE* simplex model with Ph->E transmission, as depicted in Figure 2 (Figure 2 does not display the occasion specific effects). As above, we constrained the occasion specific genetic and environmental variances to be equal over time. The alternative simplex model fitted the FSIQ data well (χ2(61) = 73.3; TLI>0.99; adjBIC = 21,463; BIC = 21,549; RMSEA = 0.027 (CI95: 0.0–0.047)). However, in this model, some variances were estimated at zero. We reduced the model in the following way. First, as in the standard model, the variance var(a), and the variances var(ζA3) and var(ζA4) were estimated at zero, so we fixed these to zero, (three parameters). In addition, the unshared environmental auto-regression coefficients (βEt,t-1) were near (one time) zero or (two times) negative (i.e., hard to interpret), and none were significant, so we fixed these to zero (three parameters). Finally, the correlations between ζE*1t and ζE*2t at t = 2, 3, 4 were not significant, so we fixed these to zero (three parameters). The goodness of fit indices of the resulting model are χ2(70) = 74.9, LI>0.99, adjBIC = 21,463, BIC = 21,494, and RMSEA = 0.016 (CI95: 0.0–0.039). The small increase in χ2(9) =1.6) underlines the non-significance of the dropped parameters. The genetic autoregressive coefficients equaled 0.761 (s.e. 0.276), 1.062 (s.e. 0.133), and 0.772 (s.e. 0.124). We constrained these to be equal merely to facilitate subsequent calculations (see below). This resulted in χ2(72) = 77.379, TLI>0.99, adjBIC = 21,432, BIC = 21,483, and RMSEA = 0.016 (CI95: 0–0.039), and a test for the equality constraints of χ2(2) = 2.48 (p = 0.29), which suggests that the equality constraint is tenable. Table 2 contains the parameter estimates of this model, Table 3 contains the standardized variance components, and Table 4 contains the covariance matrices of A and E*, based on the estimates in Table 2. Figure 3 shows the model as fitted. This final model gives rise to an AE* correlation equaling 0 (t = 1), 0.32 (t = 2), 0.56 (t = 3) and 0.66 (t = 4). As formulated, at time point 1, we assume GE-cov = 0. However, within the final model, the within twin member correlation between Ai1 and E*i1 is identified. To evaluate whether our initial assumption is correct, we refitted the model to estimate cor(A1,E*1). Based on the Wald test, this parameter showed not to be significant (cor(A1,E*1) = −0.018, s.e. 0.032).
Table 2. FIML parameters and standard errors (s.e.) of the AE* model with Ph->E transmission as fitted to FSIQ and perfIQ. 0* indicates that the parameter value was fixed to zero.
ParameterFSIQ ML Estimate (s.e.)perfIQ ML Estimate (s.e.)
α1 = α2 = α30.385 (0.13)0.482 (0.147)
γ1 = γ2 = γ30.070 (0.03)0.037 (0.028)
var(ζE*1)0.5 = var(E*1)0.510.18 (0.74)5.68 (1.301)
var(ζE*2)0.55.644 (1.39)5.46 (1.010)
var(ζE*3)0.54.197 (2.00)0*
var(ζE*4)0.53.857 (2.00)4.819 (0.974)
cor(E*11 E*21)0.804 (0.12)0.765 (0.249)
var(ζA1)0.5 = var(A1)0.57.964 (0.80)9.041 (0.813)
var(ζA2)0.54.185 (1.10)0*
var(ζA3)0.50*0*
var(ζA4)0.50*4.482 (1.471)
βAt,t-1 (t = 2,3,4)0.895 (0.06)0.877 (0.095)
var(e)0.55.350 (1.32)7.763 (0.340)
var(c)0.54.277 (0.35)3.620 (0.620)
Table 3. Decomposition of phenotypic variance into A, E*, AE*-cov and C components. The standardized components are given in parentheses. Note that here var(E*) includes both var(ζE) and var(e) and C is limited to time specific effects (var(c)). Additive genetic time specific effects are absent.
Agevar(FSIQ)var(A)var(E*)var(C) (Time Specific)2cov(AE*)2cov(AE*) + var(A)
5.5 years214.163.43 (0.30)132.40 (0.62)18.29 (0.09)0 (0)63.43 (0.30)
6.8 years226.568.3 (0.30)92.29 (0.41)18.29 (0.08)47.6 (0.21)115.9 (0.51)
7.9 years221.354.7 (0.25)78.63 (0.36)18.29 (0.08)69.6 (0.31)124.3 (0.56)
12.2 years205.543.8 (0.21)75.39 (0.37)18.29 (0.09)67.8 (0.33)111.6 (0.54)
Agevar(perfIQ)var(A)var(E*)var(C) (Time Specific)2cov(AE*)2cov(AE*) + var(A)
5.5 years187.481.7 (0.44)92.6 (0.49)13.1 (0.07)0 (0)81.7 (0.44)
6.8 years266.862.8 (0.24)119.1 (0.45)13.1 (0.05)71.7 (0.27)134.5 (0.51)
7.9 years256.948.3 (0.19)108.7 (0.42)13.1 (0.05)86.8 (0.34)135.1 (0.53)
12.2 years281.157.3 (0.20)130.0 (0.46)13.1 (0.05)80.7 (0.29)138.0 (0.49)
In the analysis of perfIQ, we fitted the model with the time-specific genetic variances (one parameter), and var(ζA2), var(ζA3) (two parameters), and the correlations between ζE*1t and ζE*2t at t = 2,3,4 fixed to zero. The model fitted well (χ2(67) = 59.7; TLI > 0.99; adjBIC = 18,477; BIC = 18,544;RMSEA = 0.0 (CI95: 0.0–0.029)). However, as in FSIQ, the unshared environmental auto-regression coefficients (βEt,t-1) were not significant, and var(ζE3) was zero. We dropped these parameters to arrive at χ2(71) = 60.43, TLI > 0.99, adjBIC = 18,466, BIC = 18,520, and RMSEA = 0.0 (CI95: 0.0–0.024). The genetic autoregressive coefficients equaled 0.791 (s.e. 0.189), 0.787 (s.e. 0.194), and 0.977 (s.e. 0.178). As above, we constrained these to be equal to facilitate subsequent calculations (see below). This resulted in χ2(73) = 61.1, TLI>0.99, adjBIC = 18,460, BIC = 18,508, and RMSEA = 0.0 (CI95: 0–0.022), and a test for the equality constraints of χ2(2) = 0.75 (p = 0.69). The results are given in Table 2, Table 3, and Table 5. Figure 4 depicts the model as fitted. This final model gives rise to an AE* correlation equaling 0 (t = 1), 0.41 (t = 2), 0.60 (t = 3) and 0.47 (t = 4). We estimated cor(A1, E*1), and found this correlation to be zero (cor(A1, E*1) = −0.002, s.e. 0.078).
Figure 3. The AE* simplex model with Ph->E transmission as fitted to FSIQ. Time specific effects are not shown. Note that in FSIQ, time specific effects were found to be environmental (time specific genetic variance was zero).
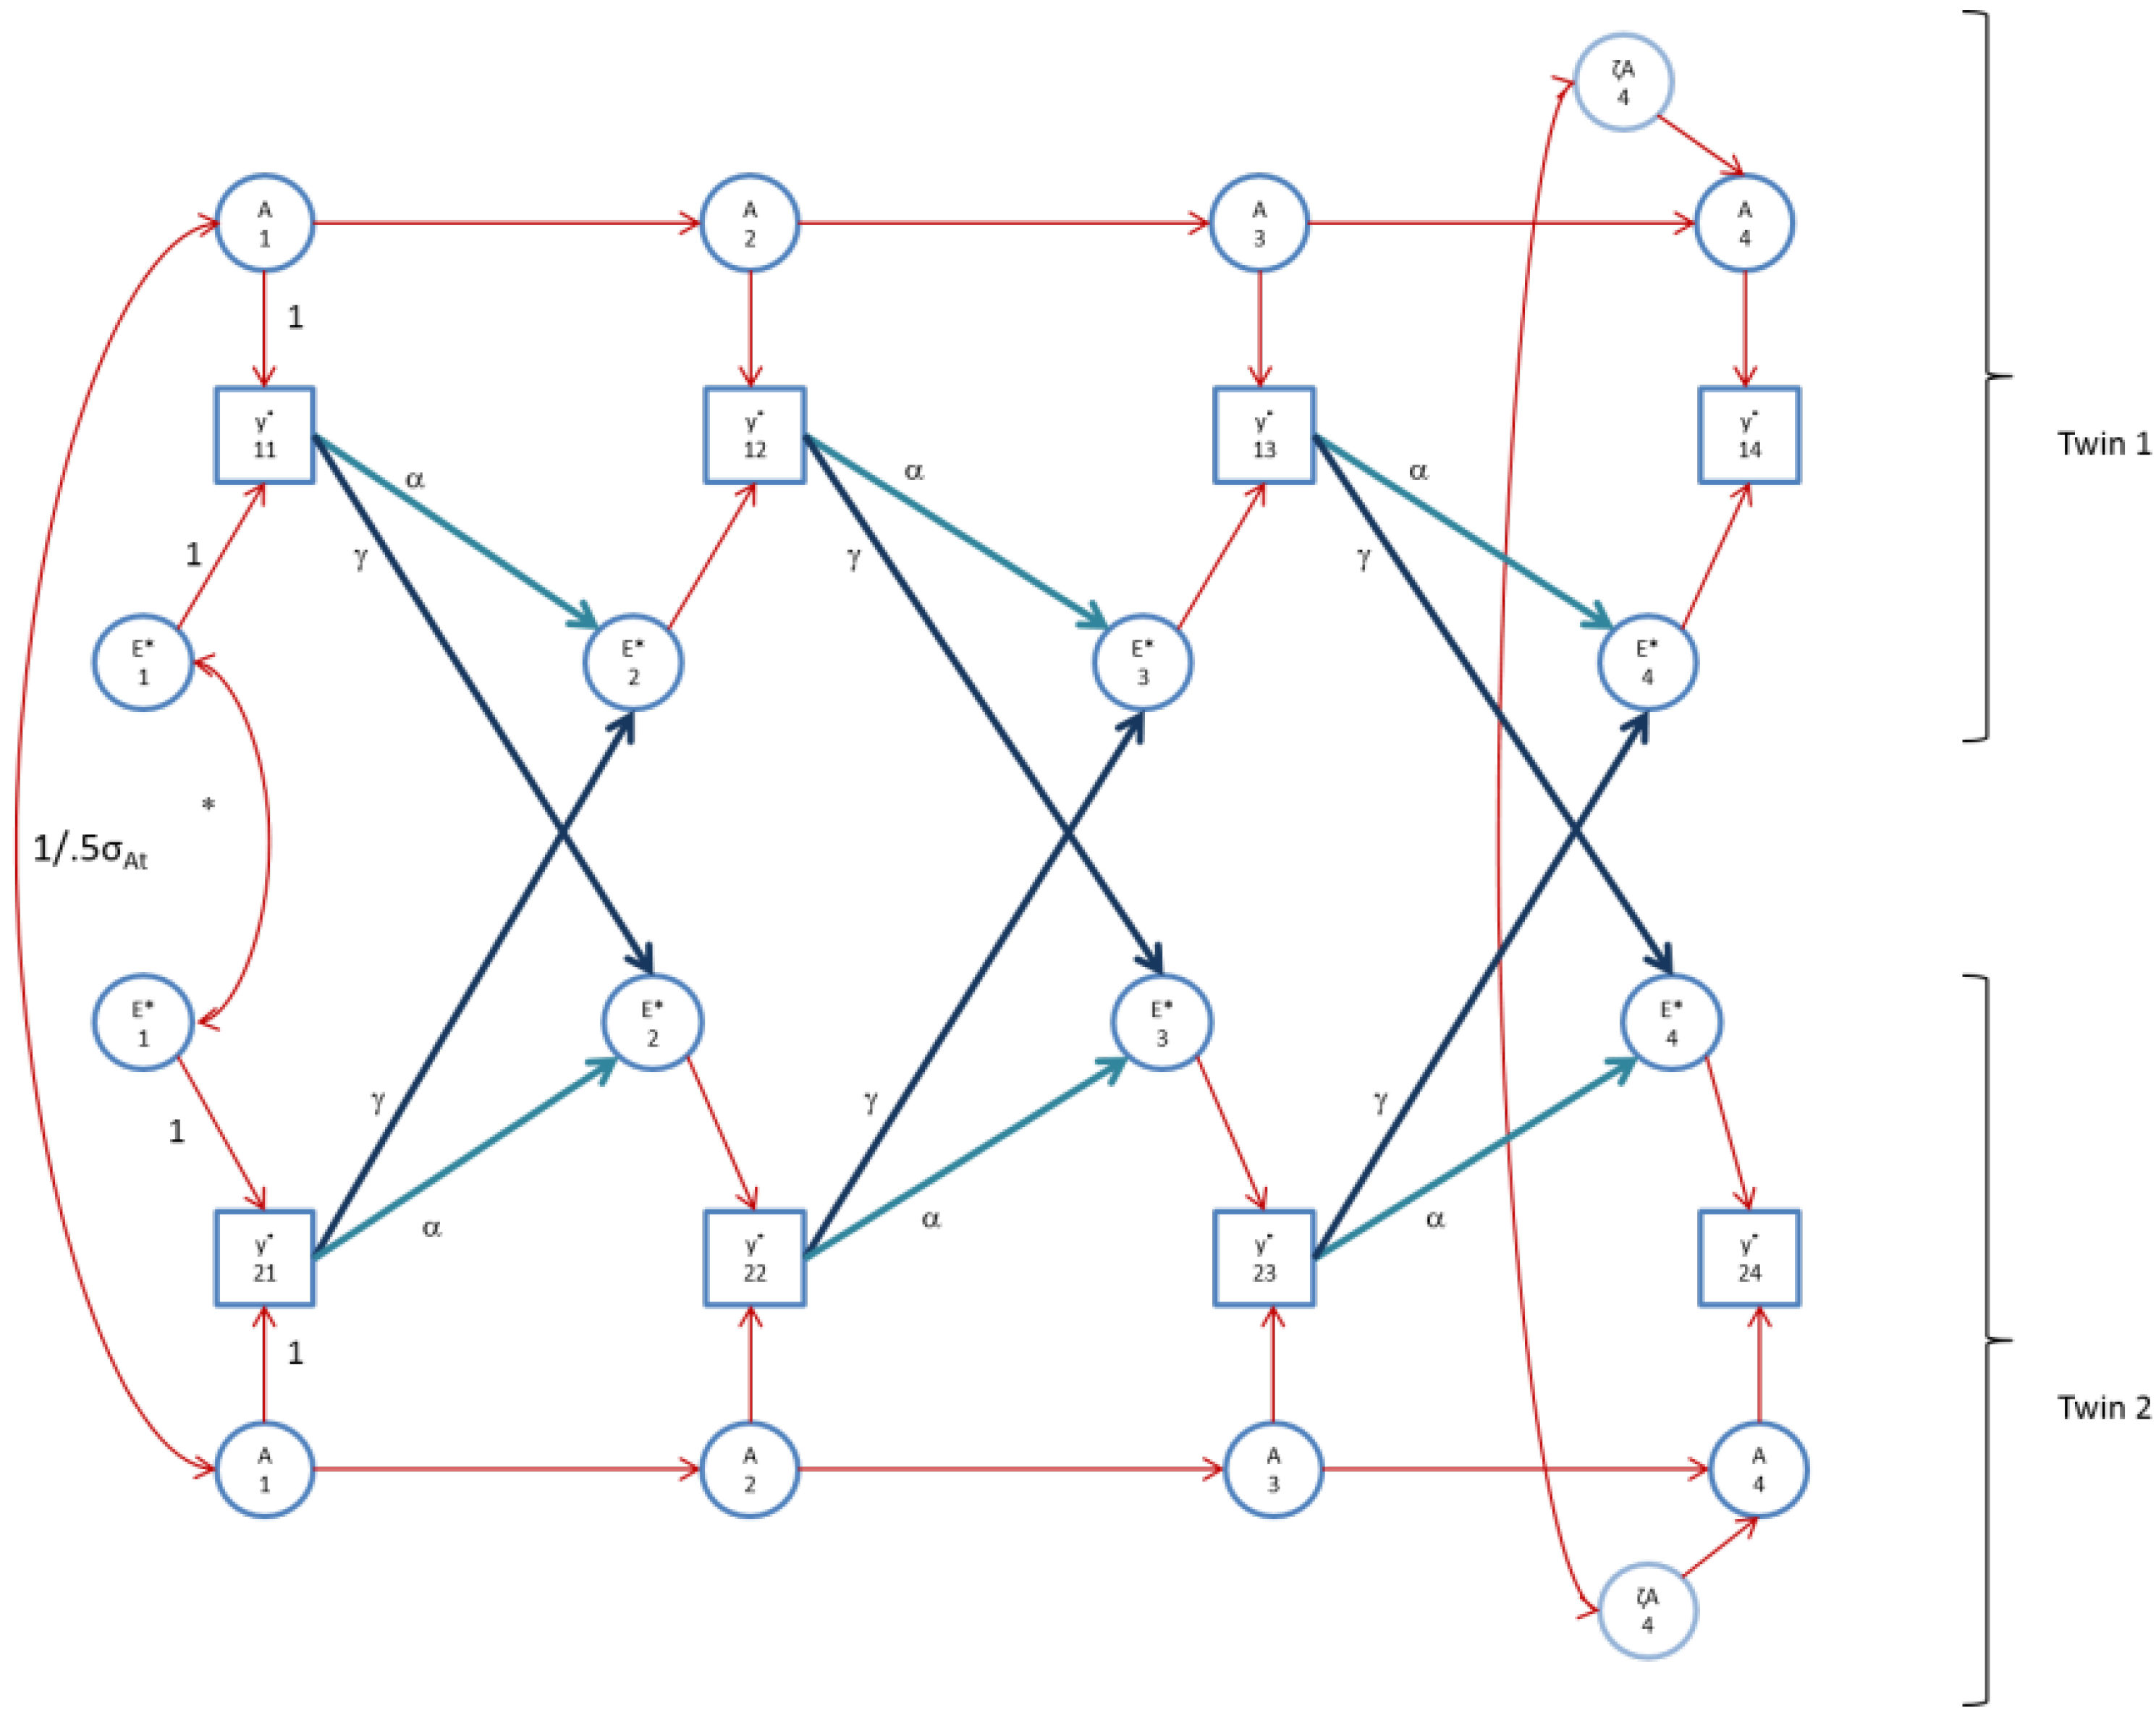
Jintelligence 02 00082 g003
Figure 4. The AE* simplex model with Ph->E transmission as fitted to perfIQ. Time specific effects are not shown. Note that in perfIQ, time specific effects were found to be environmental (time specific genetic variance was zero).
Jintelligence 02 00082 g004
The standard ACE simplex model and the AE* simplex with Ph->E transmission both fitted well judging by the fit indices. The information criteria BIC and adjBIC favored the alternative model, although the differences are not large, and the models are not nested (FSIQ: adjBIC: 21,460 vs. 21,432 and 21,540 vs. 21,483; perfIQ: 18,475 vs. 18,460 and 18,541 vs. 18,508). Based on the similarity between the fit indices, we conclude that the extended AE* model fits the data adequately relative to the standard ACE model, and therefore is compatible with the standard ACE model.
Comparison of the standardized variance components as given in Table 1 and Table 3 shows that the two models also decompose the phenotypic variance in a similar fashion. Consider the decomposition of FSIQ at age 12.2 years. In the standard model, the standardized components are 0.54 (A), 0.22 (E), and 0.24 (C). In the alternative model, the standard components are 0.21 (A), 0.37 (E*), 0.09 (C; occasion specific), and 0.33 (2∙cov(AE*)). While the models differ in the details of the decomposition, they are identical in terms of the total environmental variance and total genetic variance. The total environmental variance in the standard model equals 0.22 (E) + 0.24 (C) = 0.46 whereas in the alternative model the total environmental variance equals 0.37 (E*) + 0.09 (C occasion specific) = 0.46. Similarly, the total genetic variance within standard model equals 0.54 (A), whereas in the alternative model this variance equals 0.21 (A) + 0.33 (2∙cov(AE*)) = 0.54, if we treat 2∙cov(AE*) as genetic variance [37].
Additionally, we see that the correlation between the environments of the twins shows a similar pattern as the standardized variance component C. For example, consider the correlations in E* for FSIQ which are 0.63 (5.5 years), 0.29 (6.8 years), 0.30 (9.7 years) and 0.32 (12.2 years), whereas the standardized C components in the standard model 0.50 (5.5 years), 0.23 (6.8 years), 0.20 (9.7 years) and 0.24 (12.2 years). It should be noted that in the alternative model, after 5.5 years the correlation in E* is influenced by the initial correlation in environment at time point 1 plus the influence of Ph->E transmission over time. The influence this transmission (i.e., the AE correlation in FSIQ) becomes more prominent over time: 0 (5.5 years), 0.30 (6.8 years), 0.53 (9.7 years), and 0.57 (12.2 years). These observations show that traditional heritability estimates can be decomposed in direct and indirect genetic effects. As such, it raises the question of which decomposition (the standard ACE or the AE* with Ph->E transmission) leads to greater insight in the developmental process. Here, we provisionally accept the alternative model, as we can utilize the results to answer the hypothetical question: What increases in phenotypic mean at age 12.2 years can we expect from changes in environmental means in combination with changes in Ph->E transmission?
Table 4. MZ covariance matrix of A and E* in the AE* model of FSIQ with Ph->E transmission. These include the AE* covariance and AE* correlation within twins (bold) and between twins (bold italics) and the covariance and correlations among the twin environments (italics). Age is given in years.
CorrelationCovariance
A Twin 1E* Twin 1A Twin 2E* Twin 2
Age in years5.56.89.712.25.56.89.712.25.56.89.712.25.56.89.712.2
A twin 11 31.71
0.861 28.3834.16
0.861.001 25.4030.5727.36
0.861.001.001 22.7427.3624.4921.92
E twin 10.000.000.000.001 0.000.000.000.0083.44
0.350.300.300.300.411 16.6514.9013.3411.9439.3926.64
0.500.530.530.530.200.431 23.1825.3422.6820.3018.3722.1223.56
0.530.590.590.590.090.300.47124.7328.5325.5322.858.5017.7123.7424.14
A twin 20.50 63.43
0.430.50 56.7768.32
0.430.500.50 50.8161.1554.73
0.430.500.500.50 45.4754.7348.9843.84
E twin 20.000.000.000.000.630.000.000.000.00132.40
0.220.190.190.190.360.2926.6423.8421.3419.1045.7992.29
0.330.350.350.350.180.260.3035.2638.9234.8331.1720.3936.6078.63
0.360.400.400.400.090.210.310.3236.5442.4437.9833.999.1424.7935.9075.39
Table 5. DZ covariance matrix of A and E* in the AE* model of perfIQ with Ph->E transmission. These include the AE* covariance and AE* correlation within twins (bold italics) and between twins (bold italics) and the covariance and correlations among the twin environments (italics), which mimics the presence of shared variance. Age is given in years.
CorrelationCovariance
A Twin 1E* Twin 1A Twin 2E* Twin 2
Age in years5.56.89.712.25.56.89.712.25.56.89.712.25.56.89.712.2
A twin 11.00 40.87
1.001.00 35.8431.43
1.001.001.00 31.4327.5724.18
0.810.810.811.00 27.5724.1821.2028.64
E twin 10.000.000.000.001.00 0.000.000.000.0024.74
0.410.410.410.330.161.00 22.7219.9317.4815.3313.1219.40
0.600.600.600.480.080.411.00 32.4028.4124.9221.856.9422.4628.10
0.580.580.580.470.040.320.391.0035.1830.8527.0623.733.6622.1628.9530.41
A twin 20.50 81.74
0.500.50 71.6962.87
0.500.500.50 62.8755.1448.35
0.400.400.400.50 55.1448.3542.4157.28
E twin 20.000.000.000.000.270.000.000.000.0092.61
0.230.230.230.190.120.1640.9135.8831.4727.6016.50119.1
0.340.340.340.280.070.200.2656.4449.5043.4138.078.4447.12108.7
0.340.340.340.270.030.180.240.2359.8752.5046.0540.384.3239.3646.24130.0

4. Can Ph->E Transmission and Changes in Environmental Means Account for the Flynn Effect?

It has been argued that a shift in environmental means over generations might potentially explain the observed Flynn effect [1]. Note that Dickens and Flynn do not pinpoint any particular environmental influence [1]. We assume that many environmental variables (e.g., nutrition, education, internet access) in combination contribute to the increase in mean IQ. These environmental influences are thought to be novel and uncorrelated with the genotype and IQ.
Traditionally, within the simplex model the mean of the environment (ζE*it) is assumed to be zero. To incorporate the influence of environmental means in the extended AE* model with Ph->E transmission, we include structured environmental means [38]. We can do this by assigning to the means of the environmental variables E*1 and ζE*t non-zero values. We retain zero mean genetic variables, but will return to this assumption in the discussion. Given yit* = Ait + E*it, the mean of yt* is m(yt*) = m(E*t). The means are modeled in the MZs and DZs as follows:
m(E*1t) = βEt,t-1 m(E*1t-1) + αt m(y*1t-1) + γt m(y*2t-1) + m(ζE*1t)
m(E*2t) = βEt,t-1 m(E*2t-1) + γt m(y*1t-1) + αt m(y*2t-1) + m(ζE*2t),
At time point 1, the mean of IQ will equal the mean of the environment (i.e., m(y*it) = m(E*i1) = m(ζE*i1)). However, due to the impact of IQ on the environment, as defined by via the terms αt m(y*1t-1) and γt m(y*1t-1), the impact of IQ on the environment (Ph->E transmission) will enhance the environmental effect, via multiplication of the environmental mean. Using Equations (12) and (13), we can evaluate how a shift in environmental means leads to a shift in phenotypic means.
By introducing the environmental means, we can explore numerically the effects on the phenotypic means of changes in environmental means in combination with changes in the Ph->E transmission parameters. Using the parameter estimates as obtained in the previous analyses (Table 3), we know βEt,t-1 = 0. Therefore, within the following simulation, the environmental means are defined to be
m(E*1t) = αt m(y*1t-1) + γt m(y*2t-1) + m(ζE*1t)
m(E*2t) = γt m(y*1t-1) + αt m(y*2t-1) + m(ζE*2t).
where we assume m(ζE*1t) = m(ζE*2t) (t = 1…4), and m(ζE*it) = m(ζE*it+1) (t = 1...3).
In evaluating the degree to which these changes can account for the Flynn effect, we assume that in the 1990s, say, the average of environmental influences relevant to the development of cognitive abilities were more conducive to cognitive development than those in the 1960s. This is consistent with possible improvements in nutrition [39,40], educational practices, parental involvement, and the advantages of increased material wealth [41,42].
In addition, we consider the possibility that positive Ph->E transmission was greater in the 1990s than in the 1960s, i.e., the 1990s society is fairer in that it better facilitates matching of child’s phenotypic intelligence to the environment relevant to intelligence. We ask: To what degree do changes in these parameters account for the Flynn effect? To this end, we assume (arbitrarily) that the Ph->E transmission parameters α and γ in the 1960s are wαγ = 1/4, wαγ = 2/4, wαγ = 3/4, or wαγ = 4/4 of their 1990s values, where we take the 1990s value to be those observed in the present analysis of FSIQ (α = 0.385 and γ = 0.07) and perfIQ (α = 0.482 and γ = 0.037). We chose values of the mean m(E*1) equal to 1/4, 2/4, or 3/4 of the average phenotypic standard deviation as observed in the analysis of FSIQ (14.7) and perfIQ (15.7), and choose the means m(ζE*t) such that the phenotypic mean at age 12.2 years equals to the chosen m(E*1), given wαγ = 1/4. The values chosen serve only to obtain an indication of the effect on the phenotypic mean given a relatively large variation in the environmental means and wαβ.
The results are shown in Table 6 (FSIQ) and Table 7 (perfIQ). In the first row of Table 6, we start by setting all means equal to zero (in that case, the value of wαγ is immaterial). We then set the mean of m(E*1) to equal 14.7/4 = 3.675, one fourth of the observed phenotypic standard deviation, and choose the mean m(ζE*t) to equal 3.26, so that the phenotypic mean at t = 4 (age 12) equals 14.7/4. So, given α = 0.386/4 and β = 0.07/4, changing the environmental means from m(E*1) = 0 and m(ζE*t) = 0 to m(E*1) = 14.7/4 and m(ζE*t) = 3.675, results in an increase in phenotypic mean from 0 to 3.67 (1/4 of 14.7 std) at age 12.2 y. We then ask: Given the values of m(E*1) = 3.675 and m(ζE*t) = 3.675, what is the effect of increasing the parameters α and γ (increasing wαγ from ¼ to 1). The answer to this question is contained in the subsequent rows, where we see that the phenotypic mean increases from 0.25 (as chosen) to 0.39 in standard deviation units (std = 14.7). Note that this increase is due to changes in Ph->E transmission only. So, the combination of increasing the environmental means (from zero to 3.67 and 3.26), and increasing the transmission parameters from 0.096 and 0.017 (wαγ = 1/4) to the observed values of 0.385 and 0.070 (wαγ = 1) increases the phenotypic means by 0.39 standard deviation units. The results in the rest of the table pertain to the greater increases in environmental means (from 1/4 to 2/4 and 3/4). For instance, the last four rows pertaining to the largest changes in environmental mean indicate that the increase in environmental means with increasing Ph->E transmission parameters results in a maximal increase in the phenotypic means of 1.18 standard deviation units. This demonstrates that changes in the environmental means, reflecting improvements in the environment relevant to FSIQ are boosted by a factor of about 1.57 by the increase in the Ph->E transmission parameters (wαγ = 1/4 to 1). Table 7 contains similar results pertaining to perfIQ, where the effects are given in average standard deviation units of perfIQ (std = 15.7). Here, the increase in wαγ from ¼–1 boosts the environmental mean effect by a factor 1.7. These results demonstrate the possible role of Ph->E transmission (GE-cov) in the Flynn effect.
Table 6. Raw phenotypic mean changes (std units) of FSIQ as a function of weight given to the Ph->E transmission parameters (wαγ = 0.25, 0.50, 0.75) and different environmental means. Environmental means at t = 1 is defined as a function of standard deviation of FSIQ (sdFSIQ = 14.7, Small = sdFSIQ * 0.25, Medium = sdFSIQ * 0.50 and Large = sdFSIQ * 0.75). Environmental means at t + 1 are calculated according to Equations (14) and (15).
Weight Ph- > E ParametersIncrease Environment
SmallMediumLarge
0.253.68 (0.25)7.36 (0.50)11.04 (0.75)
0.504.22 (0.29)8.43 (0.57)12.65 (0.86)
0.754.90 (0.33)9.80 (0.67)14.70 (1.00)
15.77 (0.39)11.53 (0.78)17.30 (1.18)
Table 7. Raw phenotypic mean changes (std units) as a function of weight given to the Ph->E transmission parameters (wαγ = 0.25, 0.50, 0.75) and different environmental means. Environmental means at t = 1 is defined as a function of standard deviation of perf IQ (sdperfIQ = 15.71, Small = sdperfIQ* 0.25, Medium = sdperfIQ* 0.50 and Large = sdperfIQ* 0.75). Environmental means at t + 1 are calculated according to Equations (14) and (15).
Weight Ph->E ParametersIncrease Environment
SmallMediumLarge
0.253.93 (0.25)7.85 (0.50)11.78 (0.75)
0.504.60 (0.29)9.21 (0.59)13.81 (0.88)
0.755.49 (0.35)11.00 (0.70)16.49 (1.05)
16.66 (0.42)13.32 (0.85)19.98 (1.27)

5. Discussion

The aims of the present paper were to present and apply an longitudinal twin model that includes GE-cov originating in Ph->E transmission [14,18], which is consistent with the model proposed by Dickens and Flynn [1], and to determine how Ph->E transmission can amplify beneficial (to IQ) environmental changes. We found that the AE* model including Ph->E transmission fitted the data as well as the ACE simplex model [12]. The decomposition of variance in terms of total genetic and environmental effects (where GE-cov is counted as genetic variance [37]) is similar in these models, but the details of the decomposition differ appreciably. For instance, in the standard model, total genetic variance is attributed to genetic effects, whereas in the alternative model well over half of the total genetic variance (genetic variance plus GE-cov) is due to the GE-cov(see Table 3). In addition, in the standard model, shared environment is conceptualized as an independent source of phenotypic individual differences, whereas in the alternative model true shared environmental effects are small and occasion specific. The correlations between the environmental effects of the twins originate in the correlation at t = 1 and in Ph->E transmission thereafter. Statistically, the alternative model has the disadvantage of lacking orthogonality of the decomposition of variance, which complicates the interpretation of the variance components. However, it has the advantage of being consistent with theoretical notions concerning the role of GE-cov in cognitive development.
The second aim of this paper was to explore numerically the increases in phenotypic means attributable to changes in environmental means in combination with changes in the Ph->E parameters (denoted α and γ). Basing our exploration on changes in environmental means and Ph->E transmission parameters, we found that the GE-cov boosted the phenotypic increases in means (due to environmental mean increases) by a factor of 1.57 (FSIQ) to 1.7 (perfIQ). We note that this is the largest effect that we obtained, based on the largest change in the transmission parameters (wαγ = 1/4 to wαγ = 1). We are satisfied, based on our results, that GE-cov can contribute to the Flynn effect, but we cannot be sure about the ultimate effect size (our numerical values are arbitrary). In our numerical exploration, we have assumed that measurement invariance (MI) holds with respect to cohort. However, Wicherts et al. demonstrated that common IQ tests do not display measurement invariance [43]. This poses a psychometric problem, if one wishes to interpret cohort or generation related mean differences in terms of latent variables. However, the lack of MI has no bearing on the possible role of GE-cov in the Flynn effect: Increases in latent environmental (and genetic means) in combination with changes in Ph->E transmission parameters may contribute to the Flynn effect, even if the lack of MI complicates the interpretation of increases, over time, in phenotypic means.
We limited our exploration to increases in environmental means. It has been hypothesized that genetic mean increases due to outbreeding (hybrid vigor) is an important contributor to the Flynn effect [44,45]. We consider it plausible that outbreeding has resulted in increases in genetic means. For instance, Abdellaoui et al. recently showed that higher IQ is associated with greater internal migration in the Netherlands [46]. They demonstrated that this is associated with lower proportion of runs of homozygosity among higher IQ individuals due to assortative mating among individual of distant geographical origin. Increases in migration are certainly compatible with the interpretation of Ph->E transmission as active GE-cov. While increases in genetic means seem plausible, the actual effect size is unlikely to be large [45]. We note that genetic mean increases pose no problem in principle, as they readily can be added to the model [38].
We have limited our analyses to FSIQ and perfIQ, as the Flynn effect is supposed to be stronger in performance IQ. We included FSIQ, as this variable remains of interest, as a good part of the Flynn effect literature is based on FSIQ. The differences between FSIQ and perfIQ in the decomposition of variance are too small to conclude that Ph->E transmission is stronger in perfIQ than in FSIQ (see Table 4: Standardized var(A) vs. standardized 2* cov(AE)). This may be due to the fact that FSIQ actually includes perfIQ. The analysis of verbal IQ would be a useful addition [47]. Additionally, we have limited our analyses to age 5–12 years. It would be useful to study cognitive development into late adolescence, to establish the changes, if any, in the Ph->E transmission over development. It is well established that shared environmental effects (C) in the standard orthogonal decomposition vanish to essentially zero as children progress into late adolescence and early adulthood. The decline in C in the standard model predicts a decline in Ph->E transmission, as the latter contributes to correlated environmental effects of the twins (i.e., apparent C; see Table 4 and Table 5).
We conclude that the AE* simplex model with Ph->E transmission provides a useful alternative to the orthogonal decomposition of the standard ACE simplex model. The model is theoretically well justified, given the hypothesized importance of GE-cov in cognitive development. In addition, it is relevant to the model of Dickens and Flynn [1], which assigns to GE-cov an important role in explaining the Flynn effect. Our numerical exploration demonstrates the possible role of Ph->E transmission in amplifying increases in environmental means, as suggested by Dickens and Flynn [1]. Although we have not considered increases in genetic means here, we note that Ph->E transmission will equally boost such increases.

Acknowledgments

The study was supported by Spinozapremie (NWO/SPI 56-464-14192); European Research Council Genetics of Mental Illness (ERC-230374); Twin-family database for behavior genetics and genomics studies (NWO 480-04-004); Longitudinal Survey and Panel Funding Application 2008 (NWO-481-08-011); NARSAD; Brain & Behavior Research Foundation-18633; Genetic and Family influences on Adolescent Psychopathology and Wellness (NWO 463-06-001); A twin-sib study of adolescent wellness (NWO-VENI 451- 04-034); The interplay of genetic and environmental factors in the development of anxious depression in children and adults (NWO-VENI grant 916-76-125); Genetic influences on stability and change in psychopathology from childhood to young adulthood (ZonMW 912-10-020); Do our genes pave our way? Modeling GE-covariance, GxE interaction and moderated GE-covariance in longitudinal twin data (NWO 406-12-124).

Author Contributions

JMdeK, CVD, K-JK, DIB: Conceptualization; CVD, JMdeK, K-JK: Programming, statistical analyses; JMdeK, CVD, K-JK, DIB: Writing and editing; CEMvB, MB, DIB: Data collection and management.

Appendix I. FIML Estimates of Correlations, Standard Deviations, Means

FSIQ MZ
Twin 1Twin 2
Age in years5.56.89.712.25.56.89.7 12.2
Correlations1
0.6611
0.4860.7251
0.4190.6030.7811
0.7700.6690.5840.5521
0.4500.6740.7520.7360.5211
0.4530.6410.8400.7530.5340.7971
0.4530.5770.7590.8020.6120.6650.7601
Standard deviations14.13 15.0317.0615.3514.5615.5917.3715.05
Means109.76104.60104.0698.24108.92101.63104.6899.57
FSIQ DZ
Correlations1
0.6031
0.4770.6621
0.4710.6730.7371
0.6410.2990.2840.2591
0.4210.4820.3660.3330.5051
0.2250.3220.4810.3570.3830.6231
0.2460.3960.4700.5000.3450.6260.7061
Standard deviations14.3714.6613.9214.0315.5414.2714.3413.69
Means108.69104.12105.56100.21108.65104.54105.8999.45
perfIQ MZ
Twin 1Twin 2
Age in years5.56.89.712.25.56.89.7 12.2
Correlations1
0.7231
0.6670.7261
0.6740.6350.6961
0.6970.6430.6250.6031
0.6280.7220.7330.6540.6551
0.6110.6530.7540.6700.5730.7621
0.7220.6490.7090.741 0.6400.690 0.6691
Standard deviations14.3516.9217.8316.7215.6818.3416.5118.65
Means99.52102.72 103.60 98.52 97.88 102.21104.74 99.11
perfIQ DZ
Correlations1
0.5731
0.6160.6611
0.5710.6850.6181
0.4910.2610.2390.3441
0.4350.3860.3740.3200.4921
0.4160.3050.4300.3340.5170.7081
0.3530.3760.3250.3960.4390.5350.6011
Standard deviations13.4015.9714.6616.8013.5515.9215.8616.07
Means 99.36104.88105.26101.0399.45104.89105.10100.58

Conflicts of Interest

The authors declare no conflict of interest.

References

  1. Dickens, W.T.; Flynn, J.R. Heritability estimates versus large environmental effects: The IQ paradox resolved. Psychol. Rev. 2001, 108, 346–369. [Google Scholar] [CrossRef] [PubMed]
  2. Lynn, R.; Hampson, S.L. The rise of national intelligence: Evidence from Britain, Japan and the USA. Personal. Individ. Differ. 1986, 7, 23–32. [Google Scholar] [CrossRef]
  3. Flynn, J.R. Massive IQ gains in 14 nations: What IQ tests really measure. Psychol. Bull. 1987, 101, 171–191. [Google Scholar] [CrossRef]
  4. Scarr, S. Developmental theories for the 1990s: Development and Individual differences. Child Dev. 1992, 63, 1–19. [Google Scholar] [CrossRef] [PubMed]
  5. Scarr, S.; McCartney, K. How people make their own environments: A theory of genotype → environment effects. Child Dev. 1983, 54, 424–435. [Google Scholar] [PubMed]
  6. Plomin, R.; DeFries, J.C.; Loehlin, J.C. Genotype-environment interaction and correlation in the analysis of human behavior. Psychol. Bull. 1977, 84, 309–322. [Google Scholar] [CrossRef] [PubMed]
  7. Jensen, A.R. The G Factor: The Science of Mental Ability; Praeger Publishers: Westport, CT, USA, 1998; p. 179. [Google Scholar]
  8. Eaves, L.J. The effect of cultural transmission on continuous variation. Heredity 1976, 37, 41–57. [Google Scholar] [CrossRef] [PubMed]
  9. Eaves, L.J.; Last, K.; Martin, N.G.; Jinks, J.L. A progressive approach to non-additivity and genotype-environmental covariance in the analysis of human differences. Br. J. Math. Stat. Psychol. 1977, 30, 1–42. [Google Scholar] [CrossRef]
  10. Fulker, D.W.; DeFries, J.C. Genetic and environmental transmission in the Colorado Adoption Project: Path analysis. Br. J. Math. Stat. Psychol. 1983, 36, 175–188. [Google Scholar] [CrossRef] [PubMed]
  11. Loehlin, J.C.; Horn, J.M.; Willerman, L. Heredity, environment, and IQ in the Texas Adoption Project. In Intelligence, Heredity and Environment; Sternberg, R.J., Grigorenko, E., Eds.; Harvard University Press: Cambridge, MA, USA, 1997; pp. 105–125. [Google Scholar]
  12. Boomsma, D.I.; Molenaar, P.C.M. The genetic analysis of repeated measures. I. Simplex models. Behav. Genet. 1987, 17, 111–123. [Google Scholar] [CrossRef]
  13. Hewitt, J.K; Eaves, L.J.; Neale, M.C.; Meyer, J.M. Resolving Causes of Developmental Continuity or “Tracking.” I. Longitudinal Twin Studies During Growth. Behav. Genet. 1988, 18, 133–151. [Google Scholar]
  14. Eaves, L.J.; Long, J.; Heath, A.C. A theory of developmental change in quantitative phenotypes applied to cognitive development. Behav. Genet. 1986, 16, 143–162. [Google Scholar] [CrossRef] [PubMed]
  15. Martin, N.G.; Eaves, L.J. The genetical analysis of covariance structure. Heredity 1977, 38, 79–95. [Google Scholar] [CrossRef] [PubMed]
  16. Jöreskog, K.G. Estimation and testing of simplex models. Br. J. Math. Stat. Psychol. 1970, 23, 121–145. [Google Scholar]
  17. Eaves, L.J. A model for sibling effects in man. Heredity 1976, 36, 205–214. [Google Scholar] [CrossRef] [PubMed]
  18. Carey, G. Sibling imitation and contrast effects. Behav. Genet. 1986, 16, 319–341. [Google Scholar] [CrossRef] [PubMed]
  19. De Kort, J.M.; Dolan, C.V.; Boomsma, D.I. Accommodation of GE-covariance in a longitudinal twin design. Neth. J. Psychol. 2012, 67, 81–90. [Google Scholar]
  20. Dolan, C.V.; de Kort, J.M.; van Beijsterveldt, C.E.M.; Bartels, M.; Boomsma, D.I. GE Covariance through phenotype to environment transmission: An assessment in longitudinal twin data. Behav. Genet. 2014, 44, 240–253. [Google Scholar] [CrossRef] [PubMed]
  21. Boomsma, D.I.; Vink, J.M.; van Beijsterveldt, T.C.; de Geus, E.J.; Beem, A.L.; Mulder, E.J.; Derks, E.M.; Riese, H.; Willemsen, G.A.; Bartels, M.; et al. Netherlands twin register: A focus on longitudinal research. Twin Res. 2002, 5, 401–406. [Google Scholar] [CrossRef] [PubMed]
  22. Boomsma, D.I.; de Geus, E.J.; Vink, J.M.; Stubbe, J.H.; Distel, M.A.; Hottenga, J.J.; Posthuma, D.; van Beijsterveldt, T.C.; Hudziak, J.J.; Bartels, M.; et al. Netherlands Twin Register: From twins to twin families. Twin Res. Hum. Genet. 2006, 9, 849–857. [Google Scholar] [CrossRef] [PubMed]
  23. Van Beijsterveldt, C.E.M.; Groen-Blokhuis, M.; Hottenga, J.J.; Franic, S.; Hudziak, J.J.; Lamb, D.; Huppertz, C.; de Zeeuw, E.; Nivard, M.; Schutte, N.; et al. The Young Netherlands Twin Register (YNTR): Longitudinal Twin and Family Studies in Over 70,000 Children. Twin Res. Hum. Genet. 2013, 16, 252–267. [Google Scholar]
  24. Bleichrodt, N.; Drenth, P.J.D.; Zaal, J.N.; Resing, W.C.M. Revisie Amsterdamse Kinder Intelligentie Test (Revised Amsterdam Child Intelligence Test); Swets and Zeitlinger B.V.: Lisse, The Netherlands, 1984. [Google Scholar]
  25. Van Haasen, P.P.; de Bruyn, E.E.J.; Pijl, Y.J.; Poortinga, Y.H.; Lutje-Spelberg, H.C.; Vander Steene, G.; Coetsier, P.; Spoelders-Claes, R.; Stinissen, J. Wechsler Intelligence Scale for Children-Revised, Dutch Version; Swets & Zetlinger B.V.: Lisse, The Netherlands, 1986. [Google Scholar]
  26. Wechsler, D.; Kort, W.; Compaan, E.L.; Bleichrodt, N.; Resing, W.C.M.; Schittkatte, M. Wechsler Intelligence Scale for Children—Third edition. Dutch version; Swets and Zeitlinger: Lisse, The Netherlands, 2002. [Google Scholar]
  27. Sattler, J.M. Assessment of Children’s Intelligence Andspecial Abilities; Allyn and Bacon, Inc.: Boston, MA, USA, 1982. [Google Scholar]
  28. Sattler, J.M. Assessment of Children: WISC-III and WPPSI-R Supplement; Jerome M Sattler: La Mesa, CA, USA, 1992. [Google Scholar]
  29. Pijl, Y.J.; Hofman, R.H.; Bleichrodt, N.; Resing, W.C.M.; Lutje-Spelberg, H.; Bruijn, E.; de Zaal, J.N. Vergelijkbaarheid van de WISC-R en RAKIT. (Comparability of the WISC-R and RAKIT); Research Instituut voor Onderwijs in het Noorden, Vrije Universiteit: Amsterdam, The Netherlands, 1984. [Google Scholar]
  30. Muthén, L.K.; Muthén, B.O. Mplus User’s Guide., 5th ed.; Muthén & Muthén: Los Angeles, CA, USA, 2007. [Google Scholar]
  31. Schermelleh-Engel, K.; Moosbrugger, H.; Müller, H. Evaluating the fit of structural equation models: Test of significance and descriptive goodness-of-fit measures. Methods Psychol. Res.–Online 2003, 8, 23–74. [Google Scholar]
  32. Haworth, C.M.A.; Wright, M.J.; Luciano, M.; Martin, N.G.; de Geus, E.J.; van Beijsterveldt, C.E.; Bartels, M.; Posthuma, D.; Boomsma, D.I.; Davis, O.S.; et al. The heritability of general cognitive ability increases linearly from childhood to young adulthood. Mol. Psychiatry 2010, 15, 1112–1120. [Google Scholar] [CrossRef] [PubMed]
  33. Hoekstra, R.A.; Bartels, M.; Boomsma, D.I. Longitudinal genetic study of verbal and nonverbal IQ from early childhood to young adulthood. Learn. Individ. Differ. 2007, 17, 97–114. [Google Scholar] [CrossRef]
  34. Petrill, S.A.; Hewitt, J.K.; Cherny, S.S.; Lipton, P.A.; Plomin, R.; Corley, R.; DeFries, J.C. Genetic and environmental contributions to general cognitive ability through the first 16 years of life. Dev. Psychol. 2004, 40, 805–812. [Google Scholar] [CrossRef] [PubMed]
  35. Bartels, M.; Rietveld, M.J.H.; van Baal, G.C.M.; Boomsma, D.I. Genetic and environmental influences on the development of intelligence. Behav. Genet. 2002, 32, 237–249. [Google Scholar] [CrossRef] [PubMed]
  36. Cardon, L.R.; Fulker, D.W.; DeFries, J.C. Continuity and change in general cognitive ability from 1 to 7 years of age. Dev. Psychol. 1992, 28, 64–73. [Google Scholar] [CrossRef]
  37. Falconer, D.S.; Mackay, T.F.C. Introduction to Quantitative Genetics, 4th ed.; Addison Wesley Longman: New York, NY, USA, 1996. [Google Scholar]
  38. Dolan, C.V.; Molenaar, P.C.M.; Boomsma, D.I. Simultaneous genetic analysis of longitudinal means and covariance structure in the simplex model using twin data. Behav. Genet. 1991, 21, 49–65. [Google Scholar] [CrossRef] [PubMed]
  39. Lynn, R. The role of nutrition in secular increases of intelligence. Personal. Individ. Differ. 1990, 11, 273–285. [Google Scholar] [CrossRef]
  40. Lynn, R. What has caused the Flynn effect? Secular increases in the Development Quotients of infants. Intelligence 2009, 37, 16–24. [Google Scholar] [CrossRef]
  41. Williams, W.M. Are we raising smarter children today? School and home-related influences on IQ. In The Rising Curve: Long-Term Gains in IQ and Related Measures; Neisser, U., Ed.; American Psychological Association: Washington, DC, USA, 1998; pp. 125–154. [Google Scholar]
  42. Flynn, J.R. IQ gains over time: Toward finding the causes. In The Rising Curve: Long-Term Gains in IQ and Related Measures; Neisser, U., Ed.; American Psychological Association: Washington, DC, USA, 1998; pp. 25–66. [Google Scholar]
  43. Wicherts, J.M.; Dolan, C.V.; Hessen, D.J.; Oosterveld, P.; van Baal, G.C.M.; Boomsma, D.I.; Span, M.M. Are intelligence tests measurement invariant over time? Investigating the nature of the Flynn effect. Intelligence 2004, 32, 509–537. [Google Scholar] [PubMed]
  44. Mingroni, M.A. Resolving the IQ paradox: Heterosis as a cause of the Flynn effect and other trends. Psychol. Rev. 2007, 114, 806–829. [Google Scholar] [CrossRef] [PubMed]
  45. Woodley, M.A. Heterosis Doesn’t Cause the Flynn Effect: A Critical Examination of Mingroni (2007). Psychol. Rev. 2011, 118, 689–693. [Google Scholar] [CrossRef] [PubMed]
  46. Abdellaoui, A.; Hottenga, J.-J.; Willemsen, G.; Bartels, M.; van Beijsterveldt, T.; Ehli, E.A.; Davies, G.E.; Brooks, A; Sullivan, P.F.; Penninx, B.J.W.H.; et al. Educational Attainment Influences Genetic Variation through Migration and Assortment. submitted for publication.
  47. Kan, K.-J.; Wicherts, J.M.; Dolan, C.V.; van der Maas, H.L.J. On the Nature and Nurture of Intelligence and Specific Cognitive Abilities: The More Heritable, the More Culture Dependent. Psychol. Sci. 2012, 24, 2420–2428. [Google Scholar] [CrossRef]

