1. Introduction
Over the last four decades, the mental speed approach to human intelligence has provided accumulating evidence for a positive relationship between an individual’s general intelligence, also referred to as psychometric
g [
1,
2], and his/her speed of information processing as indexed by reaction time (RT) measures (for reviews see [
3,
4]). Within this conceptual framework, intra-individual variability in RT has also become of major interest, as it appeared that a person’s level of psychometric
g is, usually, slightly more strongly related to the standard deviation of his/her RTs over
n trials (RTSD) than to his/her mean RT (e.g., [
5]). These findings indicate faster and less variable RTs for individuals with high compared to individuals with low general intelligence. Moreover, an almost perfect positive correlation between mean RT and RTSD, in combination with the finding that both these variables are related to psychometric
g, supports the notion of a common process, the
g factor, exercising a controlling influence on RT, RTSD, and psychometric
g [
3,
5].
Although the very nature of this fundamental process or its biological substrate is still unknown, there were several attempts to conceptualize such a process. Biological accounts refer to the rate of neural oscillations [
3,
5,
6,
7], transmission errors [
8,
9,
10], or temporal resolution power of the brain [
11,
12,
13,
14,
15], while cognitive accounts emphasize lapses of attention (e.g., [
16,
17]), lapses in the chaining of working memory processes [
18], or the speed at which information is accumulated [
19]. According to these various accounts, prolonged RT, increased RTSD, and poor psychometric intelligence were assumed a consequence of a lower rate of neural oscillations, lower temporal resolution power or more transmission errors in the brain, a larger number of lapses of attention or in chaining of working memory processes, or slower speed of information accumulation, respectively.
As a general rule, RT distributions are always positively skewed and, at the same time, RTs generated by less intelligent people are more spread out than those for high-intelligent people. The reason underlying these empirical findings is twofold: First, there is a physiological limit to the speed of reaction at around 100 ms at the low end of the RT scale [
20]. At the high end of the RT scale, on the other hand, there is no natural limit on the slowness of reaction. Second, in low-intelligent individuals, trials of a given RT task are more frequently and more strongly negatively affected due to the assumed neurocognitive deficit compared to high-intelligent individuals (
cf. [
6,
16,
21]). These two factors combined not only cause a right-skewed RT distribution but also contribute to the observation that differences in RT between low- and high-intelligent individuals become more evident for longer than for short individual RTs. This phenomenon has been referred to as the
Worst Performance Rule (WPR) by Larson and Alderton [
18]. More precisely, the WPR states that “the worst RT trials reveal more about intelligence than do other portions of the RT distribution” [
18] (p. 310).
The WPR proved to be consistent with older data sets on the RT–IQ relationship in low- and high-intelligent participants (e.g., [
6,
7,
16]). Also several subsequent studies, using quite different RT tasks, provided empirical evidence for the validity of the WPR (e.g., [
17,
22,
23,
24,
25]).
Despite these findings in favor of the WPR, there are also reports challenging the validity of the WPR. In a sample of adults ranging from 18 to 83 years, Salthouse [
21] found a very similar pattern across a set of various RT tasks: fast and slow RTs correlated with intelligence to about the same extent and, thus, did not support the WPR. More recently, a study by Ratcliff, Thapar, and McKoon [
26], comprising RTs for numerosity discrimination, recognition memory, and lexical decision, failed to support the WPR as its basic premise, namely that IQ should be more strongly correlated with slow than fast responses, was not consistently met by the data. Eventually, Madison, Forsman, Blom, Karabanov, and Ullén [
27] showed that variability in isochronous interval production—a simple, automatic timing task—was negatively correlated with intelligence. There was, however, no indication that trials with high variability (
i.e., worst performance trials) were better predictors of intelligence than the trials where the participant performed optimally (
i.e., best performance trials). These latter findings suggest that the validity of the WPR is less universal than might be deduced from the rather large number of positive results.
Proceeding from the common assumption that
g reflects some fundamental biological, yet still unknown, property of the brain that manifests itself to some degree in all mental activities, performance on various cognitive tasks can be understood to reflect
g, though to different degrees [
1]. Typically,
g saturation of a given task is assumed to be positively related to task complexity. More precisely, within the framework of the mental speed approach, the task complexity hypothesis states that RTs obtained with more complex versions of an information processing task correlate more highly with psychometric
g than less complex versions of the same task (e.g., [
28,
29,
30,
31]).
Based on an examination of “virtually the entire literature” (p. 183) on task complexity and the RT-IQ relationship, Jensen [
3] arrived at the
First Law of Individual Differences stating that “individual differences in learning and performance increase monotonically as a function of increasing task complexity” (p. 205). Within the framework of the WPR, this rule implies that enhancing task complexity should result in a much more pronounced increase of the slowest RTs than of the fastest RTs. As a further consequence, enhanced task complexity should also magnify the RT differences between groups that differ in general intelligence. In other words, differences in RT between low- and high-IQ individuals should become more pronounced with increasing RT task complexity as more complex RT tasks have higher
g saturation than less complex RT tasks and, thus, account for a larger portion of variance in psychometric
g [
1,
6].
Nevertheless, empirical studies directly comparing the influence of task complexity on the WPR are extremely scant. First evidence for an effect of task complexity was reported by Jensen [
6]. A trial-by-trial comparison of 46 mildly retarded and 50 bright, normal young adults revealed larger RT differences between the two groups for the slowest than for the fastest trials on a simple RT task. These RT differences, particularly for the slowest RT trials, were substantially magnified when the participants performed a more complex eight-choice RT task. Kranzler [
24] administered his subjects a simple RT task, an eight-choice RT task, and an odd-man-out RT task. Results indicated that the correlations between RT bands (rank-ordered from the trial with the fastest to the trial with the slowest RT for each individual) and psychometric
g varied with task complexity. Although for the least complex simple RT task, no linear increase in correlations with
g across RT bands could be observed, the correlation increased linearly from the fastest to the slowest RT bands for the two more complex tasks. Therefore, Kranzler concluded that the WPR only holds for relatively complex and, thus, highly
g-loaded RT tasks.
More recently, Fernandez
et al. [
23] investigated the influence of task complexity on the WPR in children, young adults, and older adults. For this purpose, a simple RT task, a two-choice RT task, and a color-naming Stroop task were used to experimentally vary the level of task complexity. While in all age groups, and for all tasks, the WPR could be confirmed, an effect of task complexity on WPR was limited to children and older adults. In both these latter groups, worst performance trials of the choice RT task explained more variance in intelligence than worst performance trials of the simple RT task. Similarly, worst performance trials of the incongruent condition of the Stroop task accounted for a larger portion of variance in intelligence than worst performance trials of the choice RT task and the congruent condition of the Stroop task. No such mediating influence of task complexity on WPR could be established for young adults—maybe due to restricted variance of psychometric intelligence in this latter group of participants [
23] (p. 38).
In addition, no effect of task complexity on WPR was found in a study by Diascro and Brody [
22]. These authors endorsed the validity of the WPR for RTs obtained from the detection of straight and slanted lines in the presence of slanted and straight distractor lines. With regard to task complexity, the most intriguing aspect of this study was that detection of a slanted line is based on parallel processing, whereas detection of straight lines requires serial processing [
32]. Hence, detection of a straight line can be considered a more complex task than detection of a slanted line. This prediction was corroborated by faster RTs for the detection of slanted lines than for the detection of straight lines. This difference in task complexity, however, did not affect the RT–IQ correlation; correlations between IQ and worst RTs, for detection of both straight and slanted lines, were virtually identical.
At least two reasons may account for these rather mixed and inconclusive results. First, the RT tasks for indexing mental speed differed considerably across studies. The only exceptions may be the simple and eight-choice RT tasks applied by Jensen [
6] and Kranzler [
24]. Second, in all four studies, different psychometric tests for the assessment of the individual levels of psychometric
g were used. While Kranzler [
24] derived individual
g scores from the Multidimensional Aptitude Battery [
33], Diascro and Brody [
22] and Fernandez
et al. [
23] applied the Culture-Fair IQ Test Scale 3 [
34] and the Raven Standard Progressive Matrices [
35], respectively, as a measure of psychometric
g. No detailed information on the psychometric assessment of
g was provided by Jensen [
6]. The different RT tasks as well as the various psychometric measures of
g, applied in all these studies, were highly likely to differ in
g load. Thus, if a high
g loading is essential for the WPR to become effective, differences in
g saturation, in both the RT tasks and the obtained measures of psychometric
g, may represent a decisive factor contributing to the inconsistent results. Converging evidence for this conclusion can be derived from Larson and Alderton’s [
18] study where the WPR was found to particularly hold for presumably highly
g-loaded psychometric measures of intelligence, such as a composite index of fluid and crystallized intelligence, rather than for an intelligence measure assumed to be low in
g saturation referred to as a clerical speed composite. Unfortunately, Larson and Alderton did not derive their measures of intelligence with different levels of
g saturation from factor analysis of a correlation matrix. Instead, they obtained their composite measures of psychometric intelligence by combining standardized and averaged scores from different scales that may reflect
g to some extent but also reflect first- and second-order factors and specificity [
1,
3]. Thus, the real differences in
g saturation of their various composite measures remained rather unclear and arguable. To the best of our knowledge, there are no other studies that directly addressed the effect of differences in
g saturation of psychometric measure of intelligence on the validity of the WPR. At this point it appears that, based on the available data, the validity of the WPR may depend on high
g saturation of both the cognitive (RT) tasks as well as the psychometric intelligence tests applied. The present study, therefore, was designed to directly assess the influence of task complexity and
g saturation of the psychometric measure of intelligence on the WPR. For this purpose, two levels of psychometric
g and three levels of task complexity of the same type of RT task were utilized. To arrive at a highly
g-loaded psychometric measure of intelligence, psychometric
g was derived from 12 intelligence scales corresponding to Thurstone’s [
36,
37] primary mental abilities. This measure was contrasted with the mental ability with the least
g saturation,
i.e., the aspect of intelligence that showed the smallest factor loading on psychometric
g. For experimental manipulation of task complexity, three different conditions of a Hick RT task were applied.
Thus, based on the above considerations, we aimed at evaluating the following predictions: (1) If the WPR is universally valid, the (negative) correlation between the slowest RTs (i.e., worst performance) and psychometric intelligence should be higher than the correlation between the fastest RTs (i.e., best performance) and psychometric intelligence irrespective of RT task complexity and g saturation of the psychometric measure of intelligence; (2) If, however, the validity of the WPR depends on high g saturation, then a stronger correlational relationship between worst RT performance and psychometric intelligence is expected with increasing complexity of the Hick RT task as well as with higher g saturation of the applied measure of intelligence.
3. Results
Mean and standard deviation of unstandardized scores on the twelve intelligence scales are reported in
Table 2. The full correlation matrix for the intelligence battery can be downloaded from “
Supplementary Files”. In order to obtain an estimate of psychometric
g, all psychometric test scores were subjected to a principal components analysis (PCA). Based on a scree test [
48,
49], PCA yielded only one strong component with an eigenvalue of 4.21 that accounted for more than 35% of total variance. This first unrotated component is commonly considered an estimate of psychometric
g [
1]. As can be seen from
Table 2, all mental tests had substantial positive loadings greater than 0.30 on this component. Apart from the three memory scales, all loadings were greater than 0.59.
Mean and standard deviation of RTs within and across the six RT bands of the three conditions of the Hick RT task are presented in
Table 3. The full correlation matrix for all RT measures can be downloaded from “
Supplementary Files”. As indicated by a one-way analysis of variance with task conditions as three levels of a repeated-measures factor, mean RT across all six bands increased significantly from the 0-bit to the 2-bit condition,
F(2, 488) = 1532.45;
p < 0.001; η
p2 = 0.86. All pairwise comparisons were statistically significant (all
p < 0.001 after Bonferroni adjustment) confirming that the complexity of the Hick RT task increased monotonically from the 0-bit to the 2-bit condition. Furthermore, the polynomial linear contrast yielded statistical significance,
F(1,244) = 2110.09;
p < 0.001, corroborating the linear increase of RT from the 0-bit to the 2-bit condition as postulated by Hick’s law [
45].
Subsequently, for each condition of the Hick RT task, a one-way analysis of variance with the RT bands as six levels of a repeated-measures factor was computed. In all three RT task conditions, there was a statistically significant main effect of band number; 0-bit condition: F(5, 1220) = 1072.37; p < 0.001; ηp2 = 0.82; 1-bit condition: F(5, 1220) = 1668.49; p < 0.001; ηp2 = 0.87; 2-bit condition: F(5, 1220) = 2078.91; p < 0.001; ηp2 = 0.90. Additional pairwise comparisons revealed that in all three conditions, mean RTs increased significantly with increasing band number (all p < 0.001 after Bonferroni adjustment). The polynomial linear contrasts were significant for all three bands; 0-bit condition: F(1, 244) = 1290.83; p < 0.001; ηp2 = 0.84; 1-bit condition: F(1, 244) = 2035.73; p < 0.001; ηp2 = 0.89; 2-bit condition: F(1, 244) = 2564.45; p < 0.001; ηp2 = 0.91.
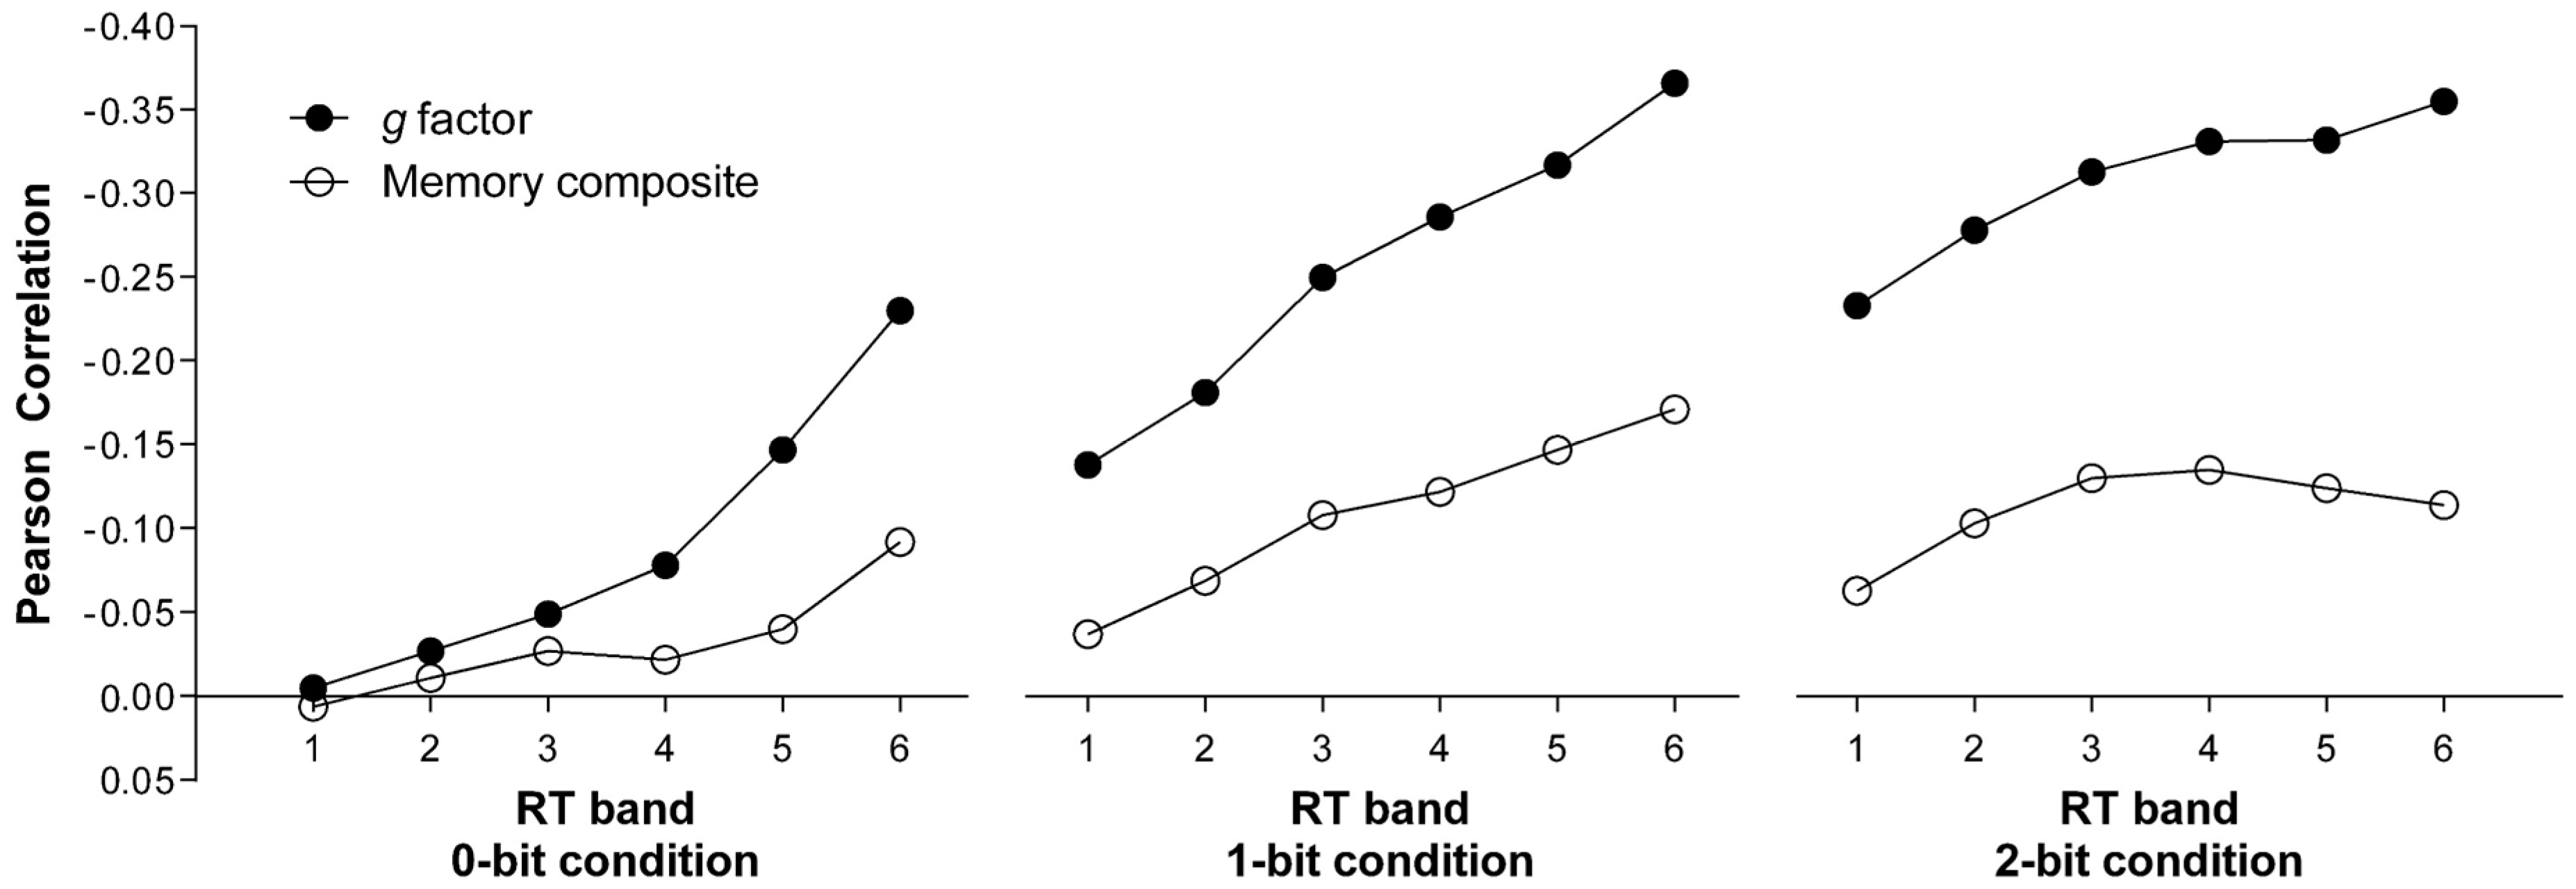
For the assessment of the relationship between RT measures and psychometric
g, a correlational approach was applied. In a first step, Pearson correlations were computed between mean RT of each band and the first unrotated principal component derived from the twelve intelligence scales as the most comprehensive measure of psychometric
g (see
Table 4). As can be seen from the filled circles in
Figure 1, the (negative) correlation coefficients monotonically increased with the rank of the band in all three Hick RT task conditions.
In order to investigate whether the correlation between the worst performance (RT Band 6) and psychometric
g was indeed significantly higher than the correlation between the best performance (RT Band 1) and psychometric
g, we compared these two correlations for each Hick RT task condition as suggested by Steiger [
50] using the statistical software provided by Lee and Preacher [
51]. To avoid alpha inflation, level of statistical significance was adjusted to
p = 0.017.
In all three task conditions, the correlation between psychometric g and the worst performance was significantly higher than between psychometric g and the best performance (0-bit condition: z = 3.54; p < 0.001; 1-bit condition: z = 4.58; p < 0.001; 2-bit condition: z = 3.00; p < 0.01). Furthermore, the correlation between psychometric g and worst performance significantly increased from the 0-bit condition to the 1-bit (z = 2.63; p < 0.01) and to the 2-bit condition (z = 2.17; p < 0.017) but not from the 1-bit to the 2-bit condition (z = −0.23; p = 0.82). The correlation between psychometric g and the best performance increased from the 0-bit to the 1-bit (z = 2.32; p < 0.017) and to the 2-bit condition (z = 3.76; p < 0.001) but not from the 1-bit to the 2-bit condition after Bonferroni correction (z = 1.99; p = 0.02).
To compare this pattern of results with the corresponding pattern for a low
g-saturated measure of intelligence, we extracted the first unrotated principal component from the three memory tests, which had the lowest loadings on the
g factor (see
Table 2). The reason for building a composite score instead of taking the test with the lowest factor loading was to increase the reliability of the low
g-saturated measure, which should be higher for the composite of the three tests than for each test alone. To make sure that the principal component extracted from the three memory tests still had a low
g saturation, a further PCA was computed identical to the initial one, but scores of the three memory tests (BIS OG, BIS ZZ, and BIS WM) were replaced by the factor scores of the principal component extracted from the three memory tests. This composite score loaded on the
g factor with 0.45, while the next higher loading was 0.60 for LPS 7 (Space 1). Thus, it can be safely assumed that the
g saturation of the three memory tests was still considerably lower compared to all the other intelligence scales. Given a
g loading of 0.45, the
g factor and the memory composite score shared only 20.3% of common variance.
Then, in a next step, the composite score of the three memory tests was correlated with the mean RTs of the six RT bands within each condition of the Hick RT task. The resulting correlation coefficients are given in
Table 4. As can be seen in
Figure 1, the correlation between RT Band 6 (worst performance) and the memory composite was significantly lower than the correlation between the same band and psychometric
g in all three task conditions (0-bit condition:
z = 2.16;
p < 0.017; 1-bit condition:
z = 3.25;
p < 0.01; 2-bit condition:
z = 4.00;
p < 0.001). On the other hand, the correlation between the best performance (RT Band 1) and psychometric
g did not differ from the correlation between the best performance and the memory composite for the 0-bit (
z = 0.24;
p = 0.81) and the 1-bit condition (
z = 1.61;
p = 0.11). In the most complex condition though, best performance was more strongly correlated with psychometric
g than with the memory composite (
z = 2.74;
p < 0.01). Only in the 1-bit condition, a strong monotonic increase of the correlation between RT and the memory composite from RT Bands 1 to 6 could be observed resulting in a higher correlation between the memory composite and the worst compared to the best performance (
z = 2.58;
p < 0.01). For the 0-bit condition (
z = 1.63;
p = 0.10) as well as for the 2-bit condition (
z = 1.17;
p = 0.24), the respective correlation coefficients did not differ significantly from each other.
Most importantly, however, task complexity had no influence on the correlation between the memory composite and the worst performance (RT Band 6). A statistically significant difference was obtained neither between the 0-bit and the 1-bit condition (z = 1.38; p = 0.17), the 0-bit and the 2-bit condition (z = 0.28; p = 0.78), nor between the 1-bit and the 2-bit condition (z = −1.14; p = 0.26).
To further address the question of whether the correlational relationship between worst performance trials and the two measures of intelligence increases as a function of task complexity, stepwise multiple regression analyses were performed for the prediction of psychometric
g and the memory composite by successively entering worst performance RTs obtained in the 0-, 1-, and 2-bit condition, respectively (see
Table 5). These analyses showed that worst performance (RT Band 6) in the 0-bit condition accounted for 5.3% of total variance of psychometric
g (
R2 in
Table 5). When combining worst performance of the 0- and 1-bit condition, 13.4% of total variance in psychometric
g could be explained.
This combined effect yielded a statistically significant increase of 8.1% (ΔR2) in explained variance as compared to the portion of 5.3% accounted for by the 0-bit condition alone. Adding the 2-bit condition to the latter two predictor variables resulted in an additional reliable increase in explained variance of 2.3%. Thus, all three levels of task complexity combined accounted for 15.7% of overall variability in psychometric g. In a final step, the unique contributions of the worst performance of the three RT task conditions to the explanation of the variance of psychometric g, were computed. While the unique contribution of worst performance to the prediction of psychometric g in the 0-bit condition was only 0.1%, there were statistically significant unique contributions of 3.3% (p < 0.01) and 2.6% (p < 0.05) for the 1- and 2-bit conditions, respectively.
Unlike in the case of psychometric g, only worst performance of the 0-bit and the 1-bit conditions combined accounted for a statistically significant, although rather small, portion of 2.9% of overall variability in the memory composite score.
4. Discussion
Proceeding from the mental speed approach to intelligence, the present study was designed to systematically assess the influence of
g saturation on the validity of the WPR. For this purpose,
g saturation of both the speed-of-information-processing task and the measure of psychometric intelligence were experimentally varied. As
g saturation of a given RT task is assumed to be positively related to task complexity (e.g., [
28,
29,
30,
31]), a Hick RT task with three levels of task complexity was employed in the present study. In order to obtain a highly
g-loaded psychometric measure of intelligence, a
g factor was derived from 12 intelligence scales. This
g factor was contrasted with a memory composite score that showed the smallest factor loading on
g and shared only a portion of 20.3% of variance with the
g factor.
As predicted by the WPR, the (negative) correlation between worst performance and psychometric g was significantly higher than the correlation between the best performance and psychometric g for all levels of task complexity when the highly g-loaded measure of psychometric intelligence was used. Furthermore, and also consistent with WPR, there was a monotonic increase of the correlations between RT and psychometric g from the slowest to the fastest RT band for all levels of task complexity. In addition, the correlation between worst performance and psychometric g was significantly higher for the more complex 1-bit and 2-bit conditions than for the 0-bit condition of the Hick RT task.
Unlike psychometric g, there was no indication for a general WPR effect when the low g-saturated measure of intelligence was applied. Except for the 1-bit condition, no significant monotonic increase of the correlations between RT and the memory composite score from the slowest to the fastest RT band could be observed. Only in the 1-bit condition, the correlation between worst performance and the memory composite score reached statistical significance and did differ significantly from the correlation between the best performance and the memory composite score. Thus, task complexity had no systematic influence on the correlation between worst performance and psychometric intelligence in the case of a low g-saturated measure of intelligence.
When comparing the relationship between worst performance and intelligence across the two levels of psychometric g saturation, it became evident that, in all three RT task conditions, the correlation between worst performance and the memory composite was significantly lower than the correlation between worst performance and psychometric g. On the other hand, the correlation between best performance and psychometric g did not differ from the correlation between best performance and the memory composite score for the 0-bit and the 1-bit condition. In the most complex condition, however, best performance was more strongly correlated with psychometric g than with the memory composite.
To further evaluate the predictive power of worst performance trials as a function of g saturation of the psychometric measure of intelligence, multiple regression analyses were performed. In addition, these analyses clearly confirmed the crucial role of a highly g-saturated measure of intelligence for the validity of the WPR. When using all three levels of task complexity as predictor variables, worst performance trials explained 15.7% of overall variability in intelligence indexed by the g factor, but accounted for only 3.0% of variance when the low g-saturated memory composite score was used.
Overall, this pattern of results indicates that for the WPR to become effective, a highly
g-saturated measure of psychometric intelligence is a necessary condition. The only previous study that also directly investigated the effect of
g-saturation of the psychometric measure of intelligence on WPR was performed by Larson and Alderton [
18]. These authors also arrived at the conclusion that the validity of the WPR seems to depend on the level of
g-saturation of the intelligence measure applied. It should be noted, however, that Larson and Alderton did not extract a
g factor but compared a composite index of fluid and crystallized intelligence, a working memory composite score, and performance on a clerical speed test that were subjectively rated as high (index of fluid and crystallized intelligence and working memory composite) or low (clerical speed test)
g-saturated measures of intelligence.
Additional converging evidence for the notion that the WPR only applies to highly
g-saturated measures of psychometric intelligence can be derived from the fact that almost all studies confirming the WPR used rather highly
g-loaded measures of intelligence. For example, Baumeister and Kellas [
16] used mean full-scale IQs obtained by the Wechsler Adult Intelligence Scale [
52] and the Wechsler Intelligence Scale for Children [
53], Kranzler [
24] used the Multidimensional Aptitude Battery [
33], Diascro and Brody [
22] used the Culture-Fair IQ Test Scale 3 [
34], while Fernandez
et al. [
23] and Unsworth
et al. [
17] used Raven’s Progressive Matrices [
35].While a highly
g-saturated measure of psychometric intelligence appears to be a conditio sine qua non for the validity of the WPR, the effect of
g saturation of the RT task, as indexed by task complexity, provided a less conclusive pattern of results. Jensen’s [
3]
First Law of Individual Differences implies a much more pronounced increase of the slowest RTs than of the fastest RTs with increasing task complexity. In the present study, however, the observed increase from the 0-bit to the 1-bit condition for the fastest and slowest RTs was virtually identical. Only the transition from the 1-bit to the 2-bit condition showed the predicted much more pronounced increase in RT for the slowest compared to the fastest RT band. Consistent with the prediction derived from the WPR, the (negative) correlation between psychometric
g and the worst performance was significantly higher than between psychometric
g and the best performance for each level of task complexity. At the same time, the correlation between psychometric
g and both best as well as worst performance significantly increased from the 0-bit to the 1-bit condition but remained practically unchanged from the 1-bit to the 2-bit condition. This represents a rather unexpected finding in light of the WPR which suggests a more pronounced correlational relationship between psychometric
g and worst performance with increasing task complexity.
As a possible explanation for this break down of the WPR for rather complex RT tasks, Jensen [
39] introduced the idea of a U-shaped relation between the RT-
g correlation and the level of task complexity (see also [
3,
54]). According to this account, beyond some optimal level, any further increase in task complexity will induce the use of additional auxiliary cognitive strategies. Furthermore, when task complexity exceeds a certain level, response errors are likely to occur (e.g., [
3,
55]). Both these factors may hamper a further increase of the correlation between slowest RT and psychometric
g from the 1-bit to the 2-bit condition.
Supporting evidence for this notion could be derived from some studies that failed to confirm the validity of the WPR for more complex tasks. For example, Salthouse [
21] investigated a sample of adults ranging in age from 18 through 83 years with a set of rather complex RT tasks, such as digit-digit and digit-symbol RT tasks. Fast and slow RTs correlated with intelligence to about the same extent and, thus, did not support the WPR. More recently, Fernandez
et al. [
23] investigated the influence of task complexity on the WPR in children, young adults, and older adults by means of a simple RT task, a two-choice RT task, and a color-naming Stroop task. While for all three age groups and for all tasks, the WPR could be confirmed, no general effect of task complexity on WPR could be revealed. In fact, an effect of task complexity was shown for children and older adults but not for young adults.
To gain some deeper insight and a better understanding of the influence of task complexity on the validity of WPR, the results of our stepwise multiple regression analysis for the prediction of psychometric g may be helpful. The worst performance trials of the least complex Hick RT task (0-bit condition) accounted for a portion of 5.3% of variance in psychometric g. Adding worst performance of the more complex 1-bit condition as a second predictor variable resulted in an additional substantial gain in predicting power of 8.1%. Comparing this substantial gain to the relatively moderate increase in predicting power of only 2.3% obtained when adding worst performance on the most complex 2-bit condition as a third predictor variable suggested that the relative contribution of task complexity to the explanation of variance in psychometric g cannot be considered a simple linear function.
The comparatively large increase in explained variance by entering the 1-bit condition as a second predictor variable in addition to the 0-bit condition into the regression model indicates that the 1-bit condition and psychometric g share common processes not inherent in the less complex 0-bit condition. Compared to the gain in explained variance by adding the 1-bit condition, the contribution of the more complex 2-bit condition as a third predictor variable to account for variability in psychometric g was substantially smaller. These different gains in predictive power obtained by stepwise multiple regression analysis point to the particular importance of the transition from the simple-RT version to the two-response alternative version of the Hick RT task. More precisely, it was this transition from the 0-bit to the 1-bit condition of the Hick RT task where the influence of increasing task complexity became most clearly evident. This means that already a rather moderate increase in task complexity from a simple to a two-choice RT task caused a marked increase in g saturation with the result that a much larger portion of the still unknown brain processes underlying mental speed and psychometric g were captured by the Hick task.
Another highly intriguing finding, also related to Hick RT task complexity, arose when considering the relationship between total and unique variance explained by each task condition. In the least complex 0-bit condition, worst performance RT accounted for a portion of 5.3% of total variance in psychometric g. Only 2.6% of this portion were uniquely explained by worst performance in simple RT. In contrast, the corresponding portions of unique variance amounted to 24.5% and 20.6% for the 1-bit and 2-bit conditions, respectively. This pattern of results clearly indicates that virtually all processes shared by the simple RT task and psychometric g are also covered by the more complex RT tasks with two (1-bit condition) and four (2-bit condition) response alternatives. In addition, however, each of the two more complex RT tasks also shared more than 20% of unique variance with psychometric g.
This outcome is consistent with the idea of a two-process model of mental speed put forward by Schweizer [
56]. In his approach, Schweizer proposed that measures of speed of information processing are composed of both rather basic, sensory-perceptual aspects of speed (such as speed of signal detection) as well as attention-paced aspects. While the basic aspects are considered to be independent of the level of mental activity required to perform the cognitive task, the attention-paced aspects are assumed to vary as a function of the task demands on attentional resources. Both aspects of speed are related to psychometric intelligence but the basic aspects only weakly compared to the attention-paced aspects of speed of information processing [
56]. This notion may provide a tentative theoretical framework to account for our results. Simple RT in the 0-bit condition of the Hick task may be mainly controlled by sensory-perceptual aspects of speed but involves only a low level of attention-based aspects of speed of information processing. Thus, RT in the 0-bit condition was related to psychometric intelligence primarily due to the basic, sensory-perceptual aspects of mental speed. The same sensory-perceptual aspects also become effective in the 1-bit and 2-bit conditions of the Hick RT task. Therefore, there was no significant portion of variance in psychometric intelligence uniquely explained by the 0-bit condition. Most importantly, however, the increasing complexity of the Hick RT task enhanced the required attentional demands so that more unique variance in psychometric intelligence was explained by the more complex task conditions.
Although the biological or even psychological basis of the
g factor has not been identified yet [
57,
58], the
g factor derived from psychometric tests of intelligence can be considered the outcome of a physical brain feature which enhances neural network efficiency (e.g., [
3,
59,
60]). Against this background, the present finding that predictive power of the WPR increases with increasing
g saturation of the psychometric measures of intelligence applied, is consistent with the observed relevance of the
g loading for connecting cognitive performance differences and biological data (e.g., [
61,
62,
63]).
In the present study, we applied a traditional approach based on a RT-binning procedure, as proposed by Larson and Alderton [
18], to investigate the WPR. This procedure enabled us to easily implement various levels of task complexity and, at the same time, to keep the number of trials rather small. It should be noted though that more sophisticated mathematical models, describing RT distributions comprehensively, as well as multidimensional measurement models provide feasible tools to better control for measurement error and to more systematically connect characteristics of RT distributions to theoretical models. In particular, ex-Gaussian distributions (e.g., [
25]), diffusion model approaches (e.g., [
19,
25,
64]), and latent growth curve analysis (e.g., [
65]) open up promising avenues for future research on the WPR. Taken together, the findings of the present study provided first direct evidence that the validity of the WPR depends on the level of
g saturation of the psychometric measure of intelligence applied. While there was no indication for a general WPR effect when a low
g-saturated measure of intelligence was used, the WPR could be confirmed for the highly
g-loaded measure of psychometric intelligence. This outcome clearly supports Jensen’s [
3] notion that the “WPR phenomenon depends mainly on the
g factor rather than on a mixture of abilities including their non-
g components” (p. 180). Likewise consistent with the WPR, the correlation between worst performance and psychometric
g was significantly higher for the more complex 1-bit and 2-bit conditions than for the 0-bit condition of the Hick RT task. As more complex RT tasks have higher
g saturation than less complex versions of the same task and, thus, account for a larger portion of variance in psychometric
g, this finding also endorsed the crucial role of
g saturation for the validity of the WPR in particular and for the mental speed approach to intelligence in general.


