1. Introduction
Properties of carbon nanostructure are useful to obtain nanocomposites, characterized by excellent mechanical, electrical, and thermal properties far above those of base polymers, [
1,
2,
3] and aimed at producing automotive components, medical devices, conducting plastics, lubricating additive, electromagnetic interference shielding/absorbers [
4,
5]. In order to give these outstanding properties, an accurate and engineered preparation method has to be selected. As a matter of fact, an appropriated process can allow obtaining a well disperse composite, avoiding the presence of an agglomerate of fillers that impact negatively the material properties [
6]. Although the optimization of the preparation method may be performed, the nature of the interface between the filler and the matrix still plays an important role, so that the choice of a proper matrix, or the use of a dispersive agent, such as the surfactant, may be needed.
In order to improve the filler matrix interface, a no-covalent functionalization strategy can be used [
7]. In particular, the use of a dispersive agent, e.g., melamine, is useful to avoid filler agglomeration and to create pure chemical bonds between matrix and filler, increasingly enhancing the electrical/mechanical properties. Among the plethora of polymeric matrices useful for composite fabrication, epoxy resin is one of the most studied matrixes. Epoxy resin is a well-known engineered thermosetting polymer with applications in electronics, anticorrosive coatings, marine, aerospace, and automotive systems. It has a better behavior than polyester, phenolic, and melamine resins, because it manifests no volatile loss and little shrinkage during the curing process, good chemical resistance and inertness, as well as versatility in selecting curing agents and conditions [
8]. To make a more specific application example, epoxy resin nanocomposites are one of the most used nanocomposites in aeronautics and aerospace fields, due to the possibility to improve EMI shielding, and mechanical/electrical properties, while maintaining lightness [
9,
10,
11].
For completeness, it is worth mentioning an additional remarkable property of nanocomposite materials, namely their electrochemical behavior, which allows the development of electrochemical sensors and energy storage devices, e.g., biological screening/detection and application to modified electrodes to enhance efficiency. The different carbon–carbon covalent bonds (hybridization) and organization of the carbon atoms into the structure of the nanocarbon allotropes determine different electrochemical properties. Consistently, from an electrochemical reaction kinetics point of view, it is known that the physical, chemical, and electronic properties of carbon electrodes have a dramatic effect on their electrochemical response.
In this contribution, we focus on carbon nanotubes (CNTs) and graphene (GNP) nanocomposites, that have been investigated in different electrode configurations by electroanalysis. As it holds for graphene [
12], their unique and outstanding features, such as electrical conductivity, high aspect ratio, chemical stability, and mechanical strength, are enabling properties for many applications. For example, CNT-based sensors often enable higher sensitivity, lower limits of detection, and faster electron-transfer kinetics for target analytes as compared to traditional sensors based on bulk graphitic carbon electrodes. Nevertheless, a complex and detailed description of an equivalent electrical circuit is missing: To our best knowledge, only Randles circuit [
13] or a parallel resistance–capacitance (RC) combination, and a variable number of RC series in parallel [
14], were used so far to model the electrochemical behavior of nanocomposites.
Usually, carbon nanostructures are mixed with a binder (pasting liquid), so called carbon paste [
15], with an alternative to carbon paste found in nanocomposites based on epoxy resin.
The main aim of this paper is to propose a preparation method involving an ARV-310 vacuum planetary mixer (Thinky Corporation, Tokyo, Japan) in order to produce high quality and highly reproducible nanocomposites, reducing air bubbles, and increasing the homogeneity of the filler dispersion, even at a very high filler concentration. As known from the literature [
16,
17], the planetary centrifugal mixing action can help obtain a well dispersion in a short time and, operating at low pressure, to reduce the presence of air inside the matrix.
More specifically, CNT and GNP as fillers and epoxy resins as the matrix are used according to a good interaction between the filler/matrix interface suggested by the Hansen Solubility Parameters (Epon 828 δ = 20 MPa
1/2 [
18], Graphene δ = 21 MPa
1/2 [
19], CNT δ = 19.5 MPa
1/2 [
20]). Furthermore, CNTs-NH
2 are used to improve the filler/matrix interaction creating a chemical bond between each other. Finally, the above nanocomposites have been characterized both from microscopic and electrochemical points of view and have been successfully applied to obtain a modified screen-printed electrode. In addition, and in parallel to the above activity, we introduced a novel methodology for deriving a lumped electrical circuit element, which is electro-physically equivalent to the chemical process used in the synthesis of nanocomposite materials. With respect to a previous work [
14], we developed a more accurate technique, based on MATLAB software, for the optimal extraction of the set of electrical parameters that best fit the measured impedance (resulting from the cyclic voltammetry analysis) in terms of modulus and phase, as functions of the frequency. In particular, given an assumed topology for the equivalent circuit derived from a chemical/physical understanding of the system, as described later, and that can possibly be composed of a relatively large number of components, each with multiple parameters to be estimated, a parametric model of the circuit was derived. The genetic algorithm implemented in the MATLAB optimization toolbox was then used to explore the large parameter space to find the optimal or near-optimal solution, which can then be further refined by a second-stage simulated annealing optimization.
Specifically, we i) added a contact resistance to simulate the liquid/composite interface, ii) replaced the RC series with a RCL series, for a better simulation of the current flowing in the fillers, and iii) included the hopping conduction mechanism (L) for CNT/epoxy, CNT-NH
2/epoxy, and GNP/epoxy nanocomposites [
21,
22,
23].
2. Materials and Methods
For the preparation of nanocomposite materials, the commercial epoxy resin EPON™ 828, a medium-low density resin marketed by Hexion, was used as a matrix. Tetraethylene pentamine, modified with the addition of formaldehyde thanks to a nucleophilic addition reaction, was used as a curing agent, called A1 [
24,
25].
Commercial CNTs (Heji) and CNT-NH2 (NANOLAB) were used as fillers. The former nanotubes have an external diameter between 8 and 15 nm, the latter have an external diameter of 15 ± 5 nm, and both have a degree of purity greater than 95%.
The graphene nano platelets (GNPs), instead, were prepared in the laboratory starting from the Asbury
® expandable graphite, of 99.1% purity and containing 3.508% sulfur, by means of the microwave-assisted thermal expansion technique [
11,
26].
The graphite is placed in a special ceramic crucible and inserted into a homemade microwave oven, which operates at a power of 800 W. This technique requires that the substances intercalating the graphite decompose quickly, causing their expansion thanks to the thermal shock suffered by the material. During the microwave treatment, the intercalated substances start to decompose at a temperature of about 140 °C (±20 °C). The developing gases modify the dielectric constant of the air to the point that the electric field of the microwaves exceeds the dielectric strength generating a voltaic arc. This causes a sudden temperature increase of over 1000 °C, further decomposing the intercalating substances and self-feeding the process. This rapid thermal shock is necessary to ensure good material expansion. The expansion process ends in about 10 s [
27].
After weighing the appropriate amounts of the two components, the dispersion of the carbonaceous filler in the matrix started with an ultrasonic tip. The mixing of the two phases is continued, to ensure a good homogeneity of the sample, with two programs of the Planetary Vacuum Mixer (ARV-310 Thinky Corporation). These steps were also necessary to eliminate the air bubbles present in the epoxy resin, which would compromise the homogeneity of the nanostructured composite [
10]. Afterwards, the curing agent (22% by weight of the composite) A1 is added and the third and final program of the ARV-310 is started, which is used to mix the hardener with the composite and to complete the elimination of the air bubbles. Finally, the obtained composite is left to rest in the air for more than 20 h. This procedure was used to produce the nanocomposite at 0.25%, 1%, and 2%.
Since at a 10% loading level of nanofillers the composite immediately becomes extremely viscous and sonication with the tip becomes practically impossible. Furthermore, as the viscosity increases, mixing with a planetary mixer improves the efficacy. Therefore, we replace the ultrasounds tip with a supplementary step in ARV-310 to obtain a good homogeneity of mixture, as demonstrated in a previous work [
17]. In fact, the ARV-310 generates a big centrifugal force during the planetary motion that is able to mix and de-aerate at the same time. In addition to this, ARV-310 has a rotary pump to help the removal of the air contained in the mixture. Inside the sample holder, shear stresses are generated, thus permitting to mix and homogenize two different phases. These shear stresses are directly linked with the viscosity of the medium: The higher is the viscosity, the higher are the shear stresses and more efficient the mixing is, and so is the air evacuation. In the case of a high amount of filler, 10%, the ARV-310 works as the most efficient method of mixing.
We chose this range of concentrations because:
- -
The 0.25%, 1%, and 2% concentrations were investigated earlier with different techniques [
9], they are close to the percolation threshold;
- -
In the nanocomposite fields, it is quite hard to obtain good dispersed samples at a high concentration. By means of ARV-310, we could overcome this limitation and probe the high filler content composite properties.
Even so, it is too difficult to go above 10% due to excessive viscosity of the matrix, which does not allow for the realization of homogeneous dispersion of the filler.
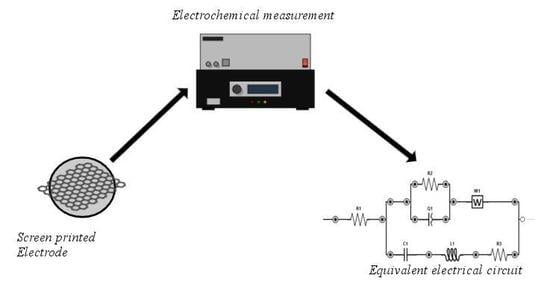
Finally, we modified a screen-printed electrode (SPE) DRP-110 (available from Dropsens) with a drop of each nanocomposite to obtain a new SPE in which it should be possible to measure the electrochemical properties of each nanocomposite.
In order to study the electrochemical behavior of the modified SPE versus the loading of filler, cyclic voltammetry (CV) characterization was performed. K3[Fe(CN)6] was used as detectable electrochemical species, at a concentration of 5 mM in KCl 0.01 M. The CV were carried out in the range of −0.1–0.6 V, with a scan rate of 100 mV/s.
2.1. Theory and Calculation
Equivalent Electrical Circuits
From the experimental data obtained by electrochemical impedance spectroscopy, the parameters of an electrical model can be determined. To this end, an equivalent electrical circuit can be used, which is a refinement of that proposed in [
14], as previously stated. In this refinement, we introduce the “constant phase elements”, which have a frequency-dependent admittance given by Y(ω) = ω
0 C(j ω⁄ω
0)
N where C and N are parameters. C is the equivalent capacitance at an arbitrary frequency ω = ω
0, and N, with 0 < N < 1, determines the phase shift. The modulus of the admittance increases with frequency at a fixed rate of 20 N dB per decade, while the displacement is -N π⁄2 at all frequencies, hence the element name. The particular cases N = 0 and N = 1 correspond to a standard resistor and capacitor, respectively, while the case N = 1⁄2 is known as the
Warburg element, useful to model the diffusion of a liquid inside a matrix. In
Figure 1, we denote the “constant phase element” by Q1 = ω
0 C2(j ω⁄ω
0)
N2, whereas the remaining “constant phase element” W1 is obtained from Q2 = ω
0 C3(j ω⁄ω
0)
N3 in the particular case N3 = 1/2.
To perform the fitting of the parameters, it is necessary to define a distance function that describes how much the circuit response is (dis)similar to the measured data. The standard Euclidean distance was deemed inappropriate given the fact that measured data span multiple orders of magnitude. Hence, we used the distance:
where
is the ratio of measured impedance
Z(ω) to modeled impedance
Ze(ω), and
w(ω) is a weighting factor to balance amplitude matching versus phase matching
w(ω) was empirically set to a starting value of 10 at low frequencies and then decreased to 1 for frequencies greater than 2 kHz, to account for less accurate phase measurements at these higher frequencies.
3. Results
As previously demonstrated [
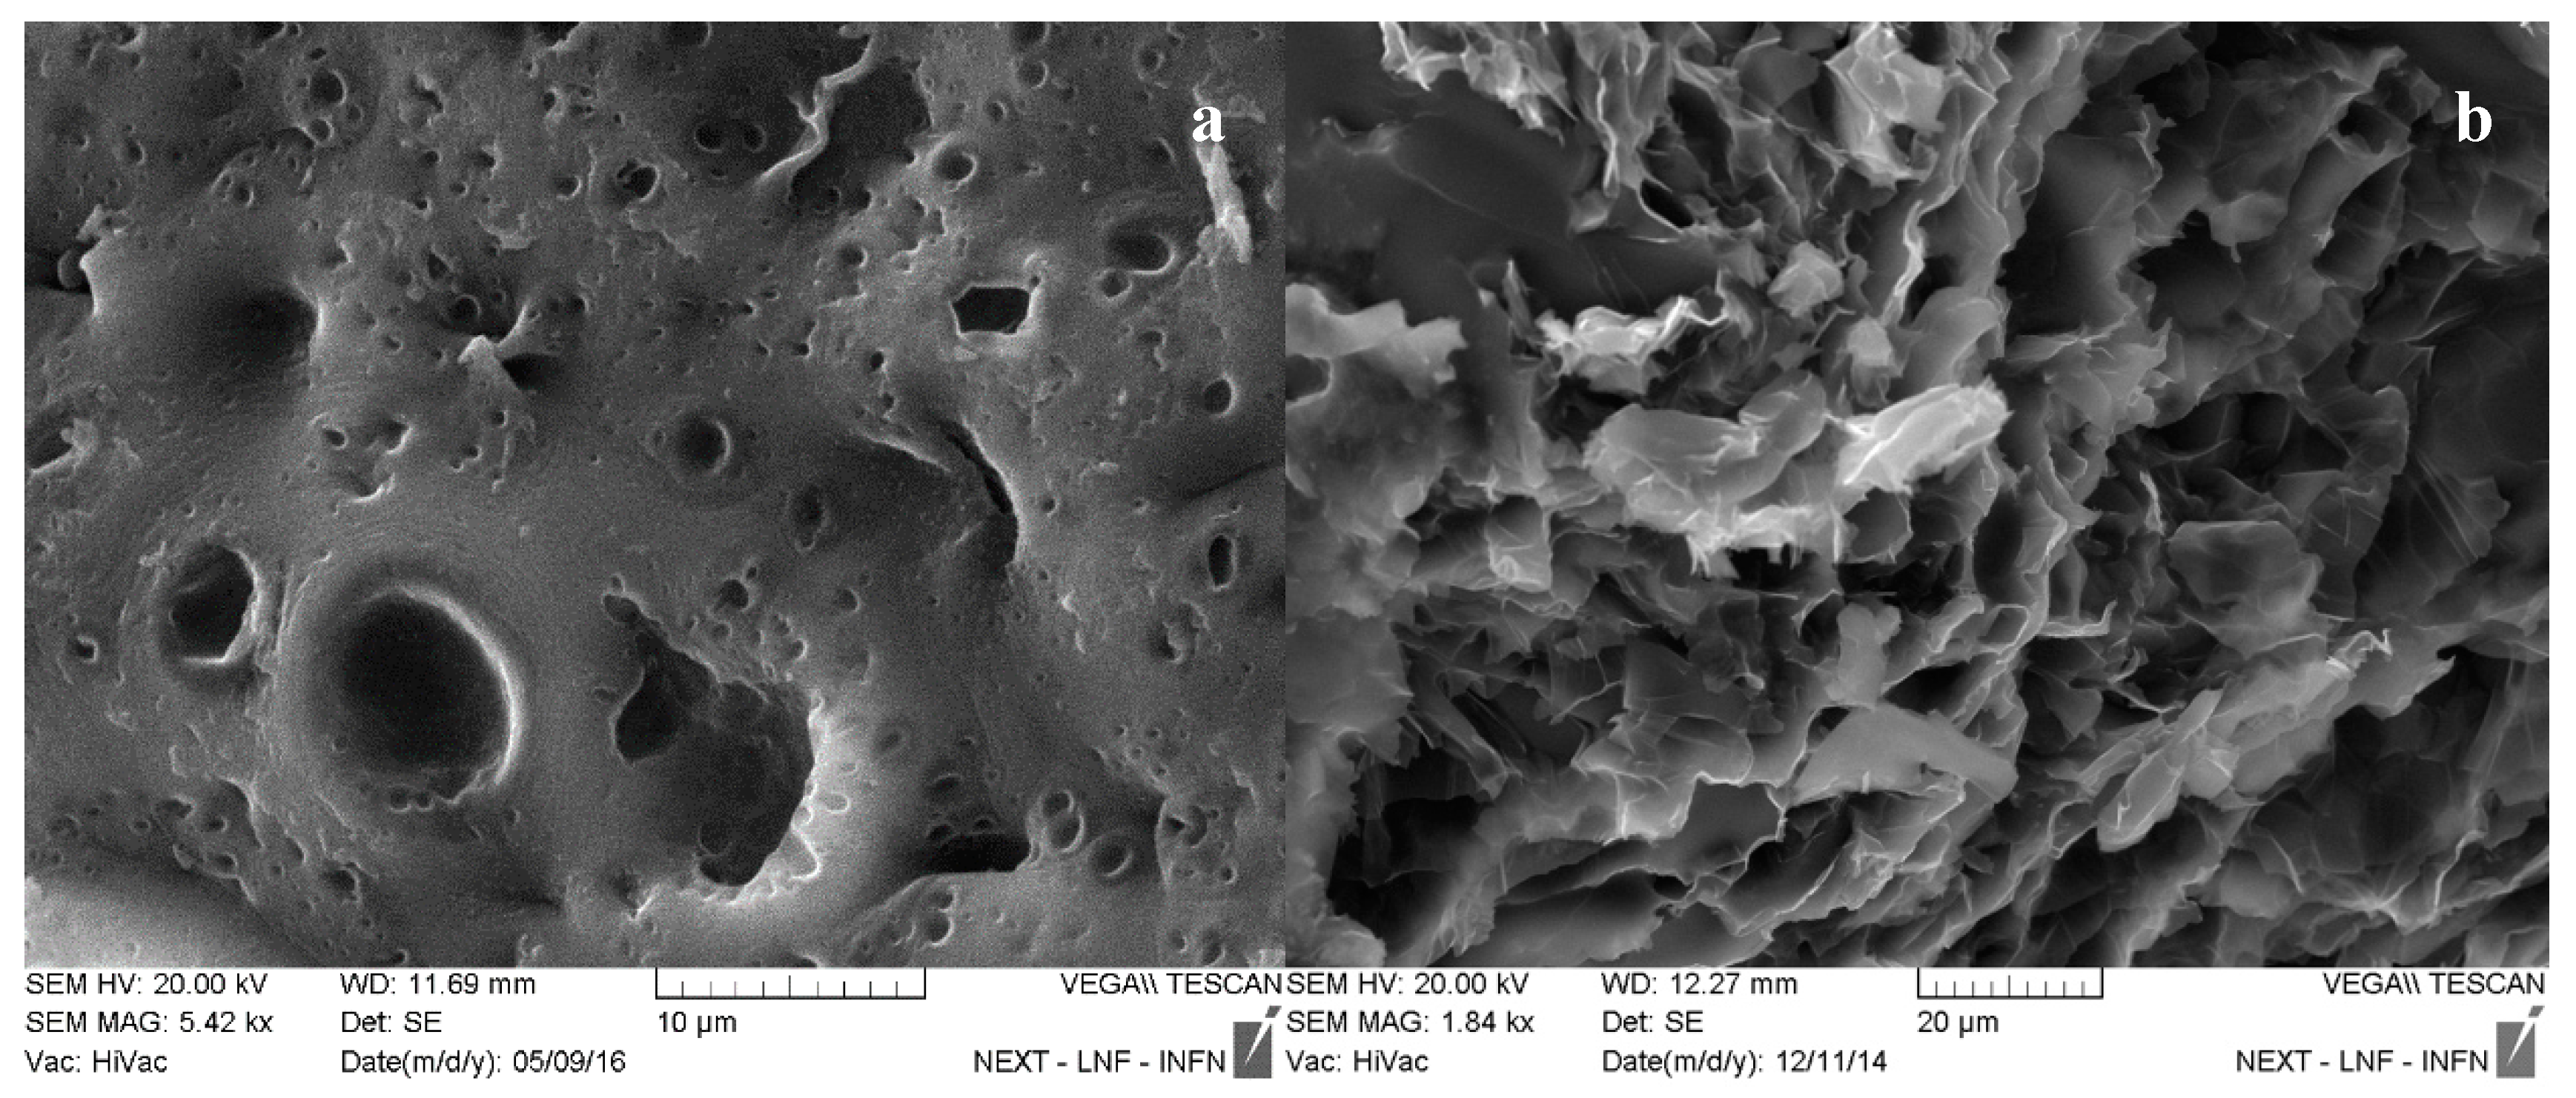
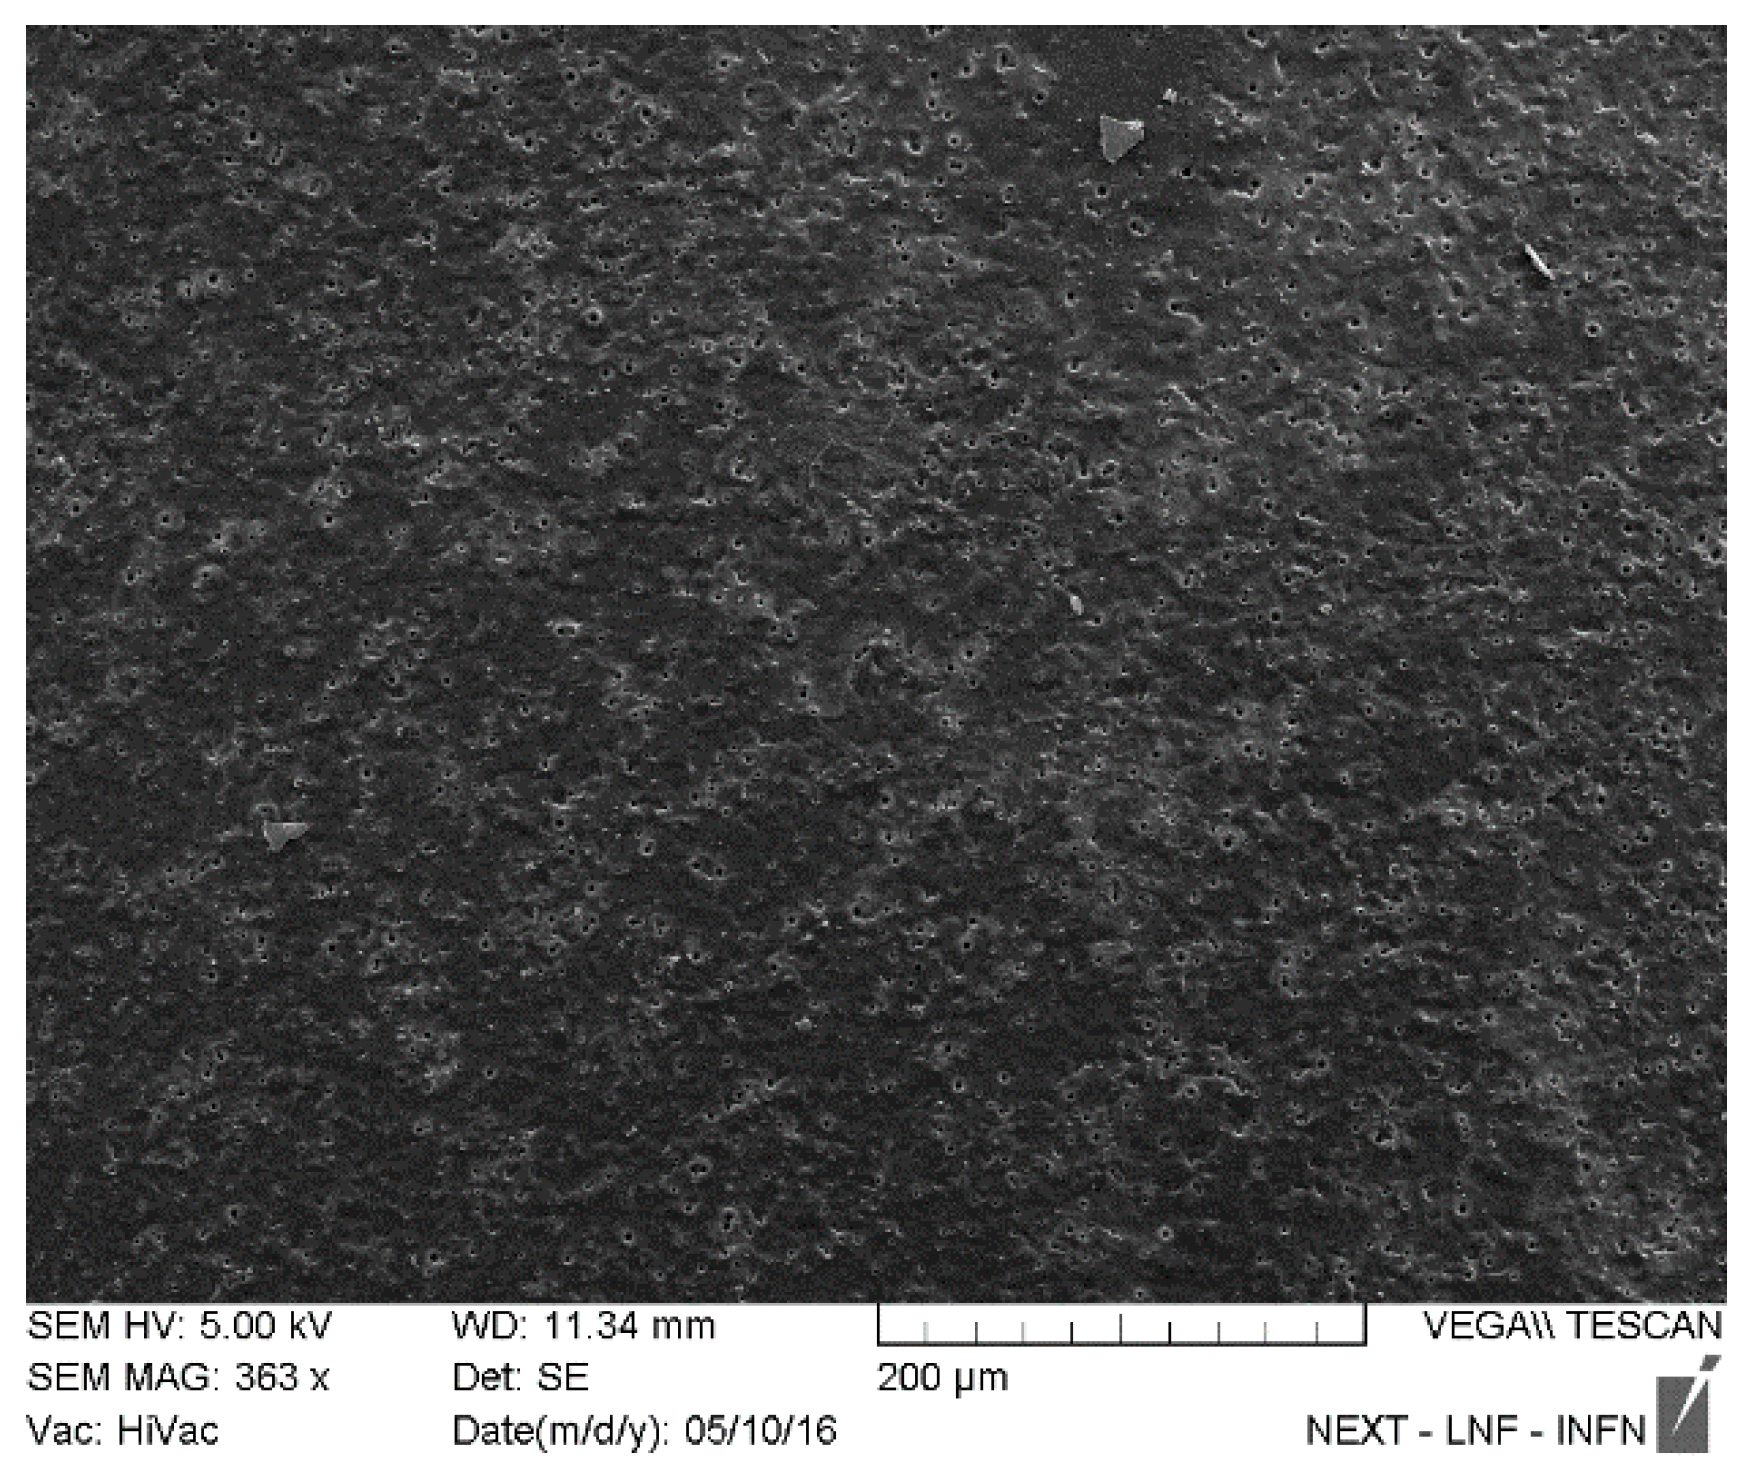
17], the realization process, carried out by the ARV-310 planetary mixer, is powerful to prepare nanocomposite materials of high quality dispersion: The scanning electron microscopy (SEM) characterization, carried out by means of a Tescan Vega II microscope, highlights a good dispersion of all types of filler in the investigated range.
In
Figure 2, the surface of GNP composites at 2% and 10% were selected to highlight the differences of the surface:
At low concentration, no regions of agglomerate fillers are visible (
Figure 2a). Furthermore, the surface of the nanocomposite appears with a high porosity in which nanofillers protrude from the holes (see
Appendix A,
Figure A5). The nanocomposite loaded at 10% of filler shows the analogous features, such as no agglomerates and porosity, besides an outstanding presence of filler on the surface, according to the amount of loading. The increase of superficial area, due to the presence of filler, is most evident in these nanocomposites.
These surface properties, porosity, and nanofiller emerging from the pores, could influence the electrochemical behavior of the nanocomposite as an electrode and increase the superficial area of SPE modified with nanocomposites with respect to the SPE modified with epoxy resin. In fact, the superficial area plays an important role in the electrochemical process: The greater the superficial area is, the greater the number of redox processes that occur on the electrode surface.
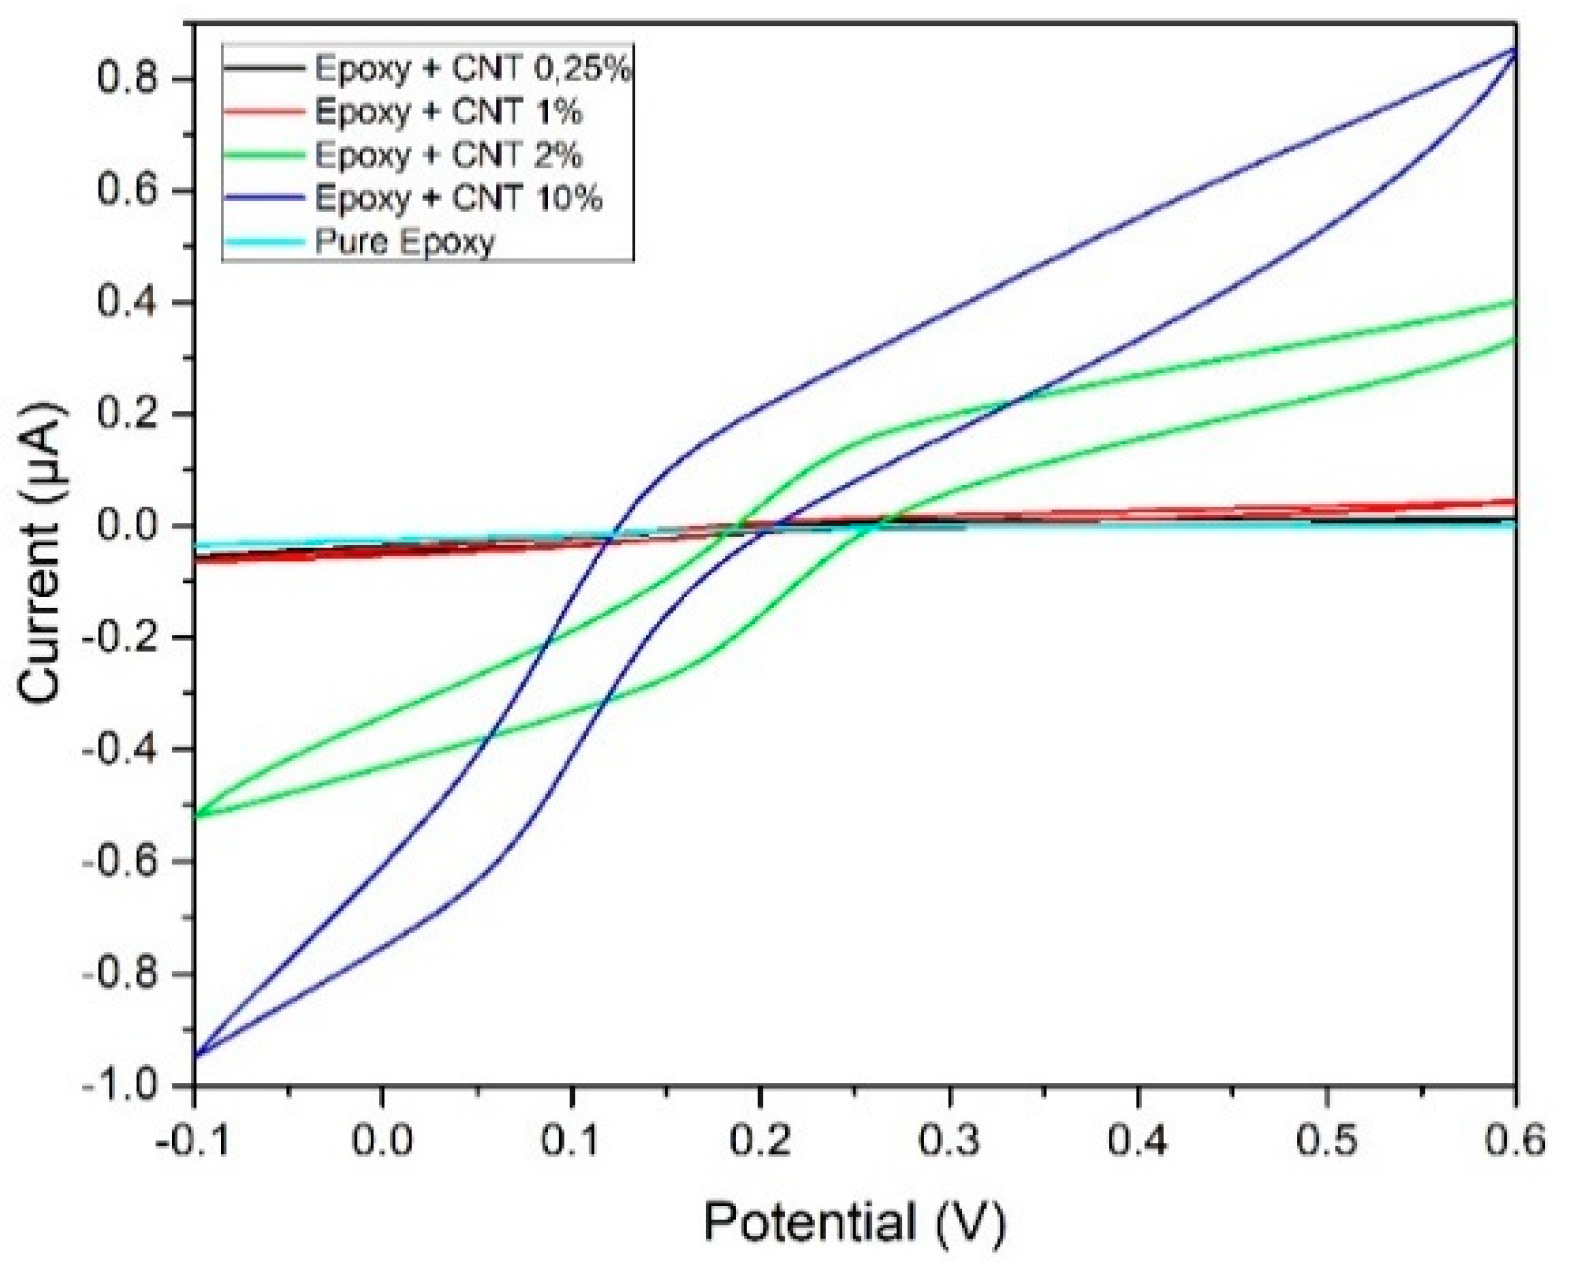
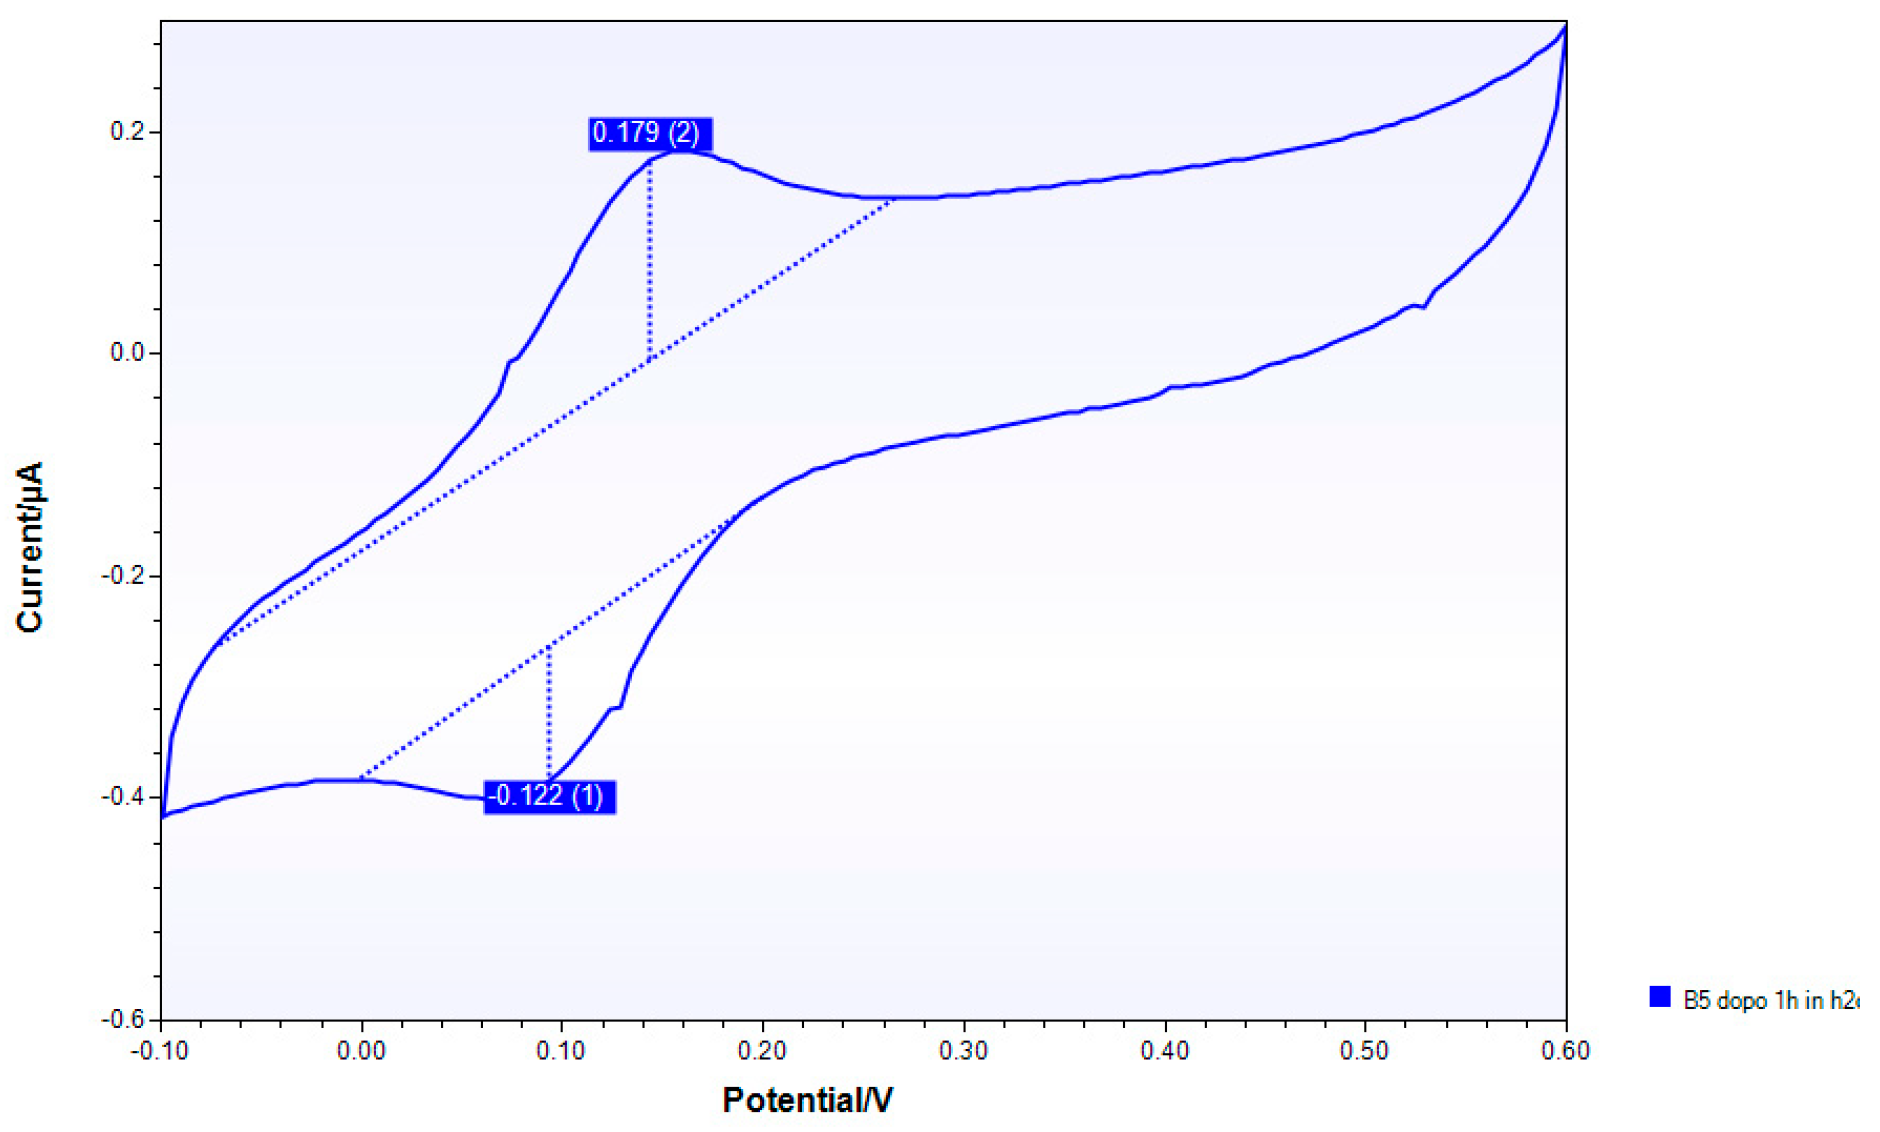
The nanocomposites were studied from an electrochemical point of view using cyclic voltammetry (CV).
Firstly, we analyze the cyclic voltammetric behavior of nanocomposites having pristine carbon nanotubes as a filler. The cyclic voltammograms are reported in
Figure 3 for each filler concentration.
From these cyclic voltammograms, the CV trend is visible but there are no peaks related to the reduction and oxidation of the analyte (Fe
2+/Fe
3+). The comparison among the pure resin and nanocomposite filled with CNT showed an increase in the conductivity of the nanocomposites as the concentration of the nanofiller increases. Furthermore, it is possible to distinguish the percolation threshold between 1% and 2%, in good agreement with previous results using other techniques (1.5% reported in [
9]).
To verify the stability and improve the response of the samples, we proceeded by placing the SPE in water in order to condition them and acquire the voltammetric measurements after various time intervals (up to three days).
The conditioning improves the response of the composites to the electrochemical stimulus by presenting the peaks to the discharge potential of the electroactive species used. In particular, it is interesting to note that the conditioning time decreases as the concentration of the nanofiller present in the matrix increases, observing the shorter time in the nanocomposite, loaded at 10%.
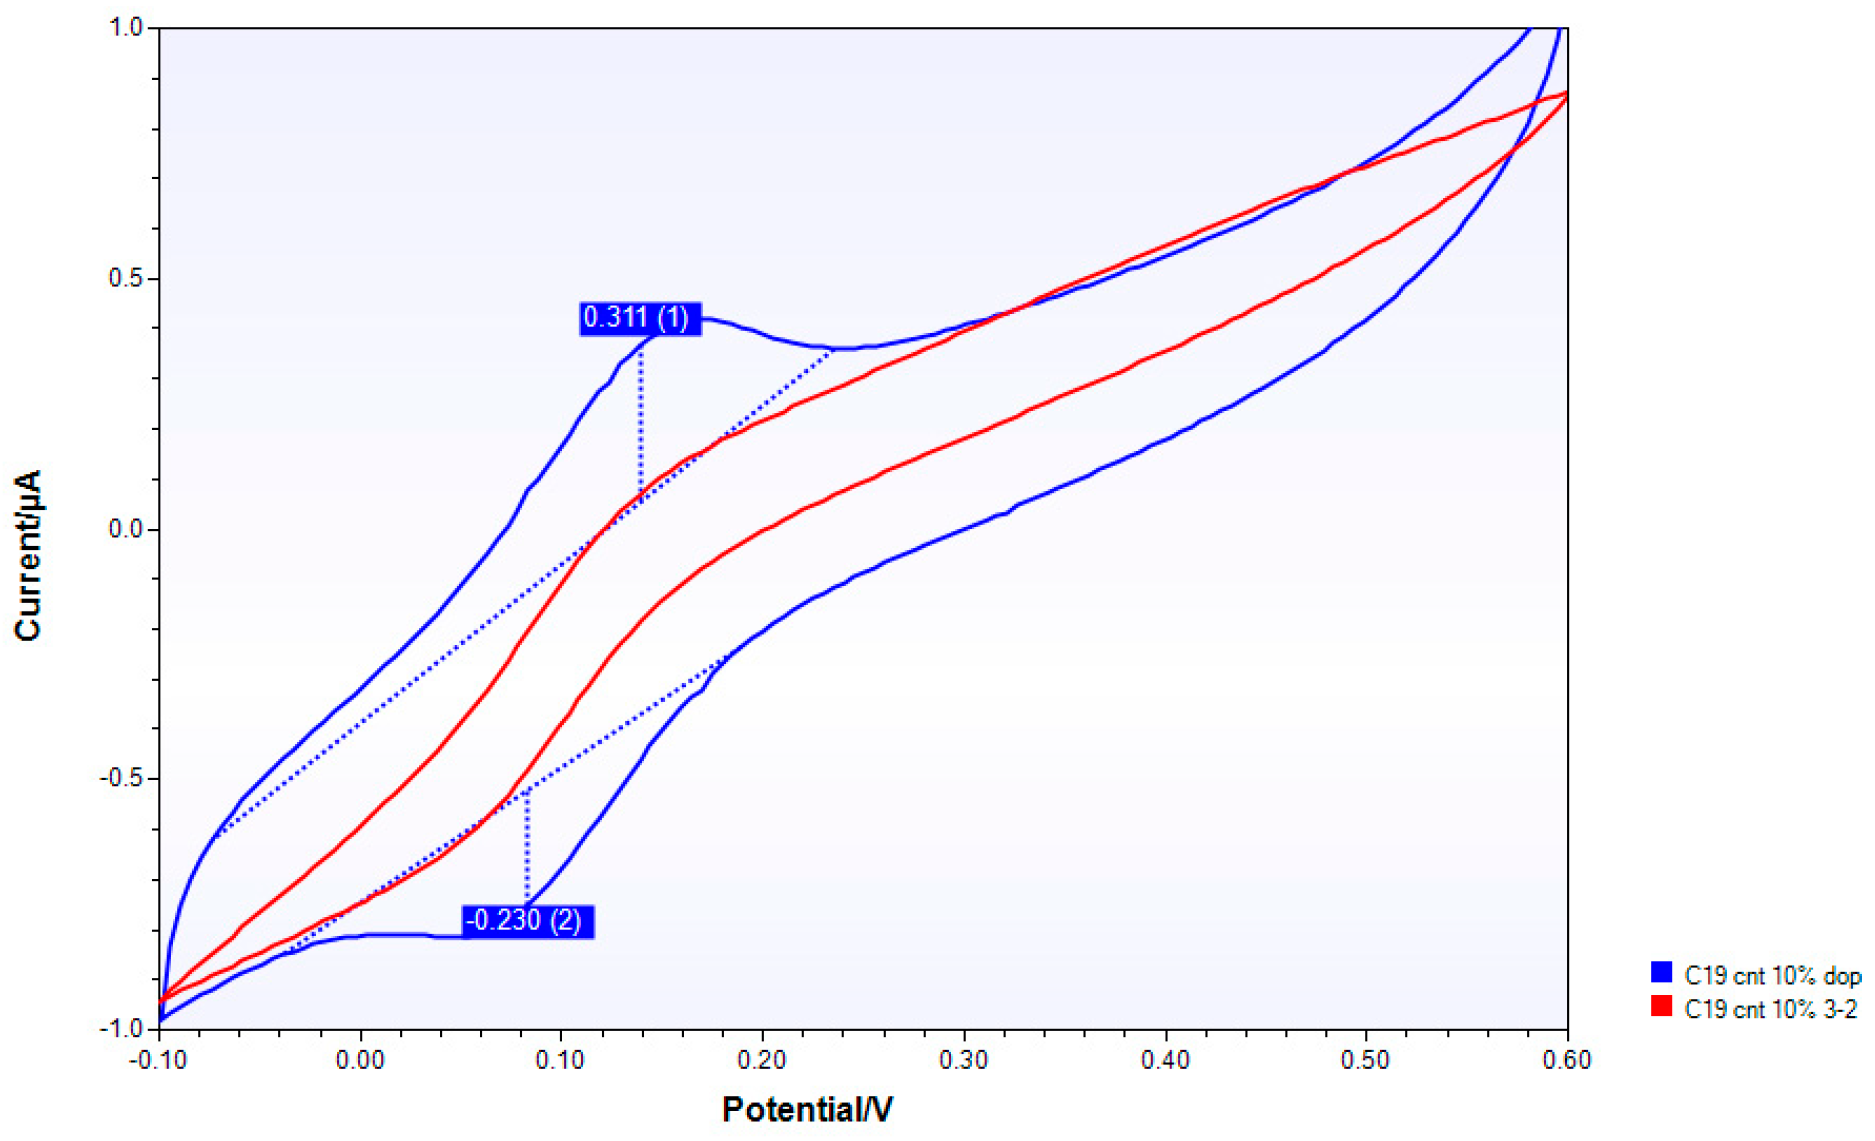
In
Figure 4, the CVs show the behavior of the nanostructured composite, loaded at 10% of CNT pristine, before and after conditioning. The conditioning time in water is really shorter, 3 h, than the conditioning time for the other nanocomposite, three days. Thus, it could suggest an important role of water percolation in the electrochemical processes: In fact, this could be the effect of the superficial swelling and absorption of water that allows a more efficient electrochemical ion exchange.
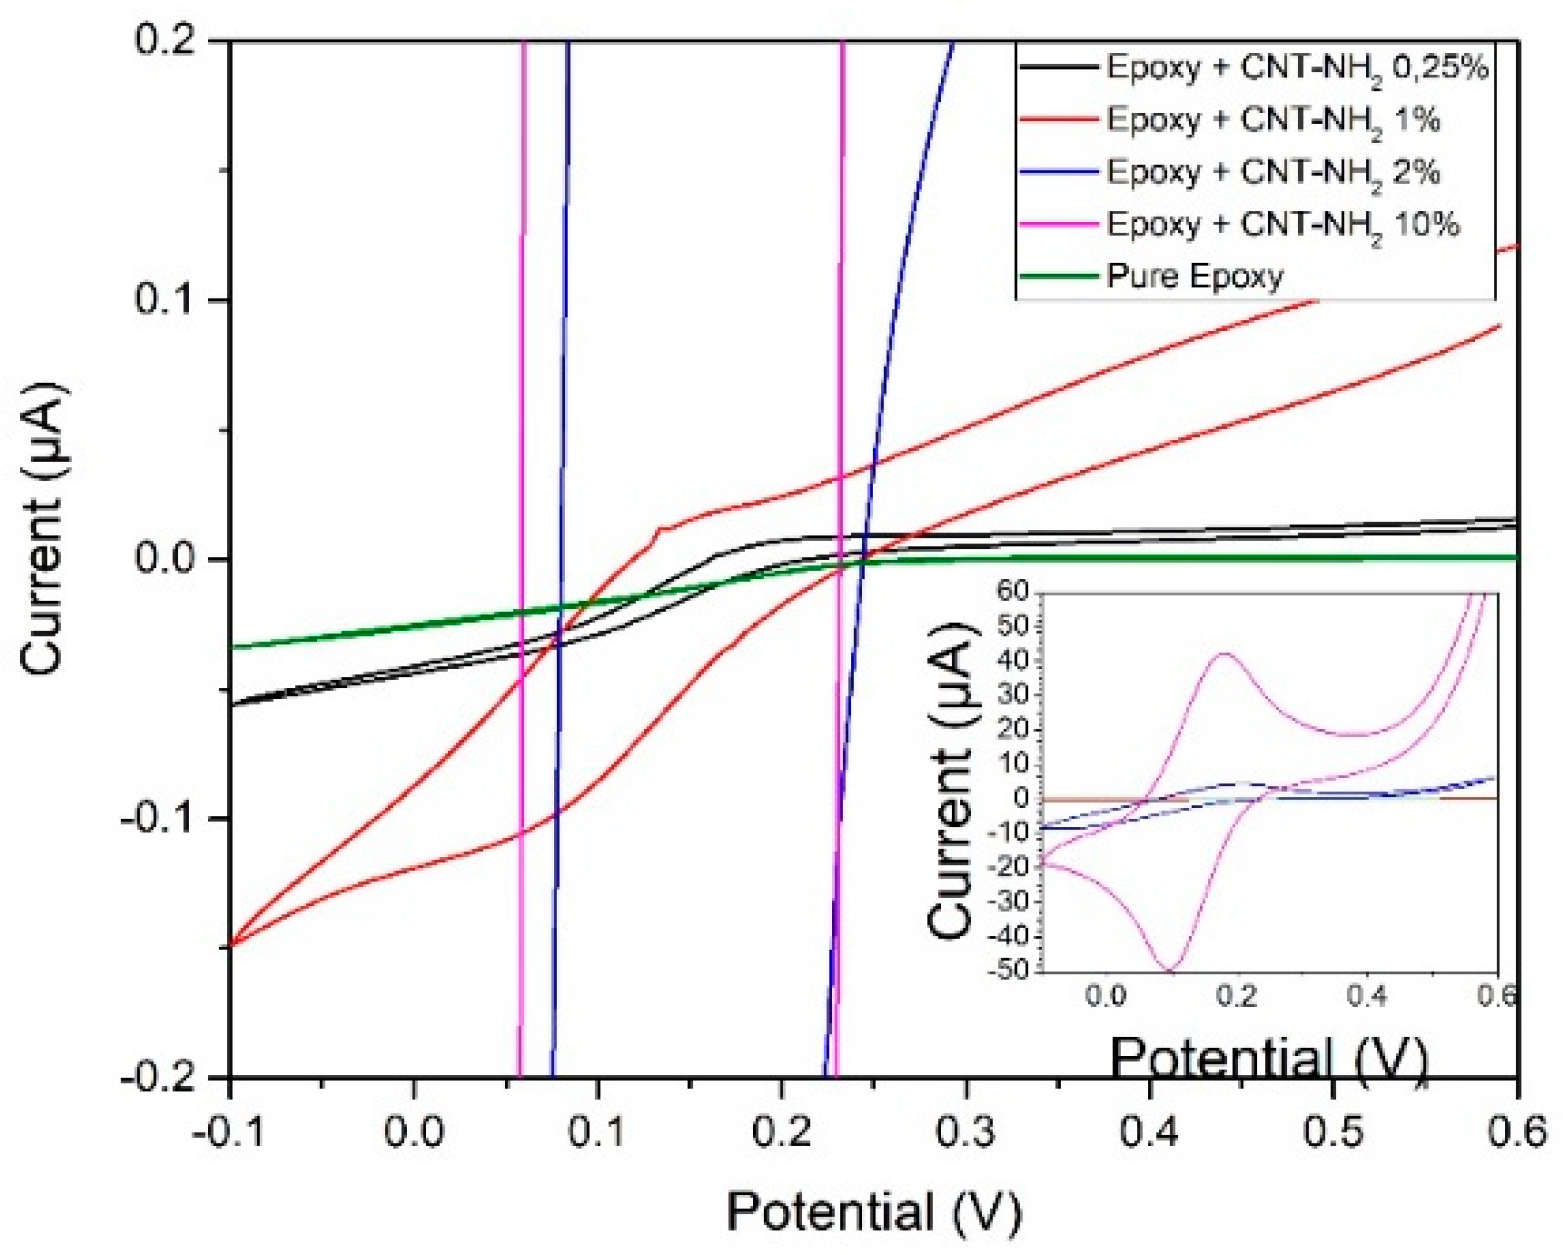
Then, we analyze the behavior of nanocomposites having carbon nanotubes functionalized with NH
2 groups as fillers. The cyclic voltammograms are reported in
Figure 5 for each concentration of the filler.
As visible from the curves reported in
Figure 5, the composites having the CNT-NH
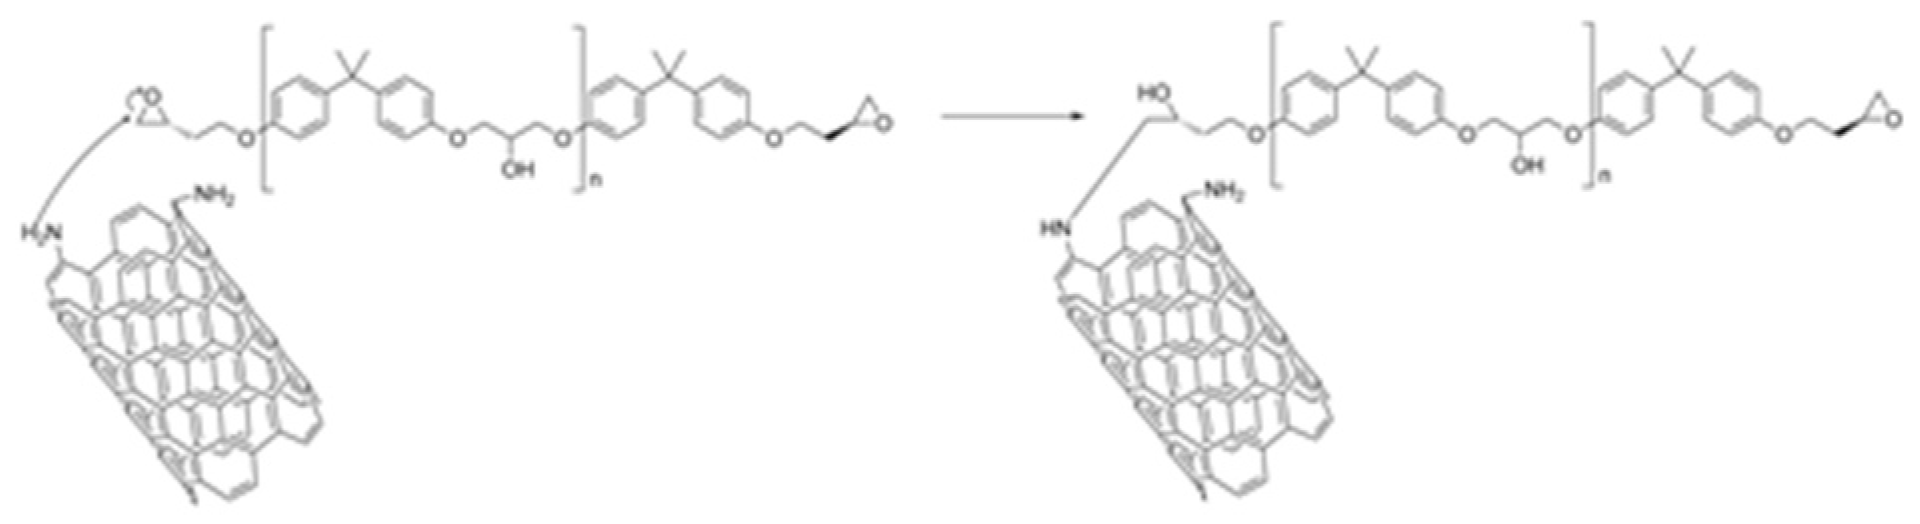
2 nanofiller show the classic trend of a CV and present peaks related to the redox process, starting from 2% and well visible in the 10% nanocomposite. Furthermore, it is possible to distinguish the percolation threshold also in these nanocomposites: In this case, the percolation threshold is considerably lower than the percolation threshold of CNT pristine nanocomposite. In fact, the percolation threshold is estimated below 1%. This phenomenon could be explained by analyzing the curing process of the epoxy resin, as shown in
Scheme 1.
In this scheme, the opening mechanism of the epoxy ring by means of a curing agent (A1 [
24]) is reported, in particular by means of a nucleophilic group, in this case the hydroxyl or amine group present in the A1.
The reactivity of the epoxy ring is obviously connected by nucleophilicity of functional groups and also by steric hindrance. Therefore, the amine group present on the surface of a carbon nanotube could react and open the epoxy ring if not sterically hindered. Probably, the amine group present on the edge of CNT-NH
2 could be in the best position to open the epoxy ring [
28], as shown in
Scheme 2.
In this hypothesis, a chain of epoxy resin is directly linked to the carbon nanostructure, as represented in
Scheme 2, and could more efficiently enhance the conductivity pathway.
Analogously as CNT/epoxy nanocomposites, we proceeded in placing the SPE in water in order to condition them and acquire the voltammetric measurements after various time intervals (up to three days).
Moreover, although in this case the conditioning process improves the electrochemical response of SPE, i.e.
Figure 6, the process seems not to be dependent on the concentration. In particular, composites loaded at 0.25% and 1%
w/w of CNT-NH
2, show a marked improvement in the response to electrochemical stress (see
Appendix B). On the other hand, the composite obtained at a concentration of 2% shows an improvement in conductivity, but the peaks, related to the discharge potential of the electroactive species used, appear broad, not useful for the detection purpose (see
Appendix B,
Figure A13).
The cyclic voltammograms of the 10% composite of CNT-NH2 show the best electrochemical response in this series, as it responds very well to electrochemical stress showing the discharge signal of the electroactive species. The improvement of the electrochemical response of SPE strengthens the suggestion of a superficial water absorption on the electrode interface, the importance of water percolation, and confirms the superficial swelling and absorption water.
Finally, we analyze the behavior of nanocomposites having graphene nanoplates as fillers. The cyclic voltammograms are reported in
Figure 7 for each filler concentration:
Even for these nanostructured composites, at low concentrations of carbon nanofiller, no significant peak is obtained without conditioning. Nevertheless, the percolation threshold is determined between 2% and 10%.
We carried out the conditioning in water for these nanocomposites, too.
Even for composites with GNP as the filler, the conditioning step greatly improves the electrochemical sensitivity. In this case, it is interesting to highlight that the necessary conditioning time decreases as the concentration of the nanofiller dispersions in the polymer matrix increases.
From cyclic voltammograms, in
Figure 8, we can see how the electrochemical response of the nanocomposite enhances after conditioning, even if the peaks relative to the redox process are just present before the conditioning step.
Then, we would argue that the conditioning step influences the electrochemical properties of the modified SPE: We suppose that the improvement of the electrochemical properties is due to the water percolation onto the electrode surface. The water, absorbed in the inner layers of the nanocomposite, promotes the electrochemical processes, previously restricted partially by the epoxy resin. The presence of carbon nanofillers mitigates the epoxy restriction and, in the case of highest concentration, promotes, in turn, the redox reactions due to the marked presence at the surface.
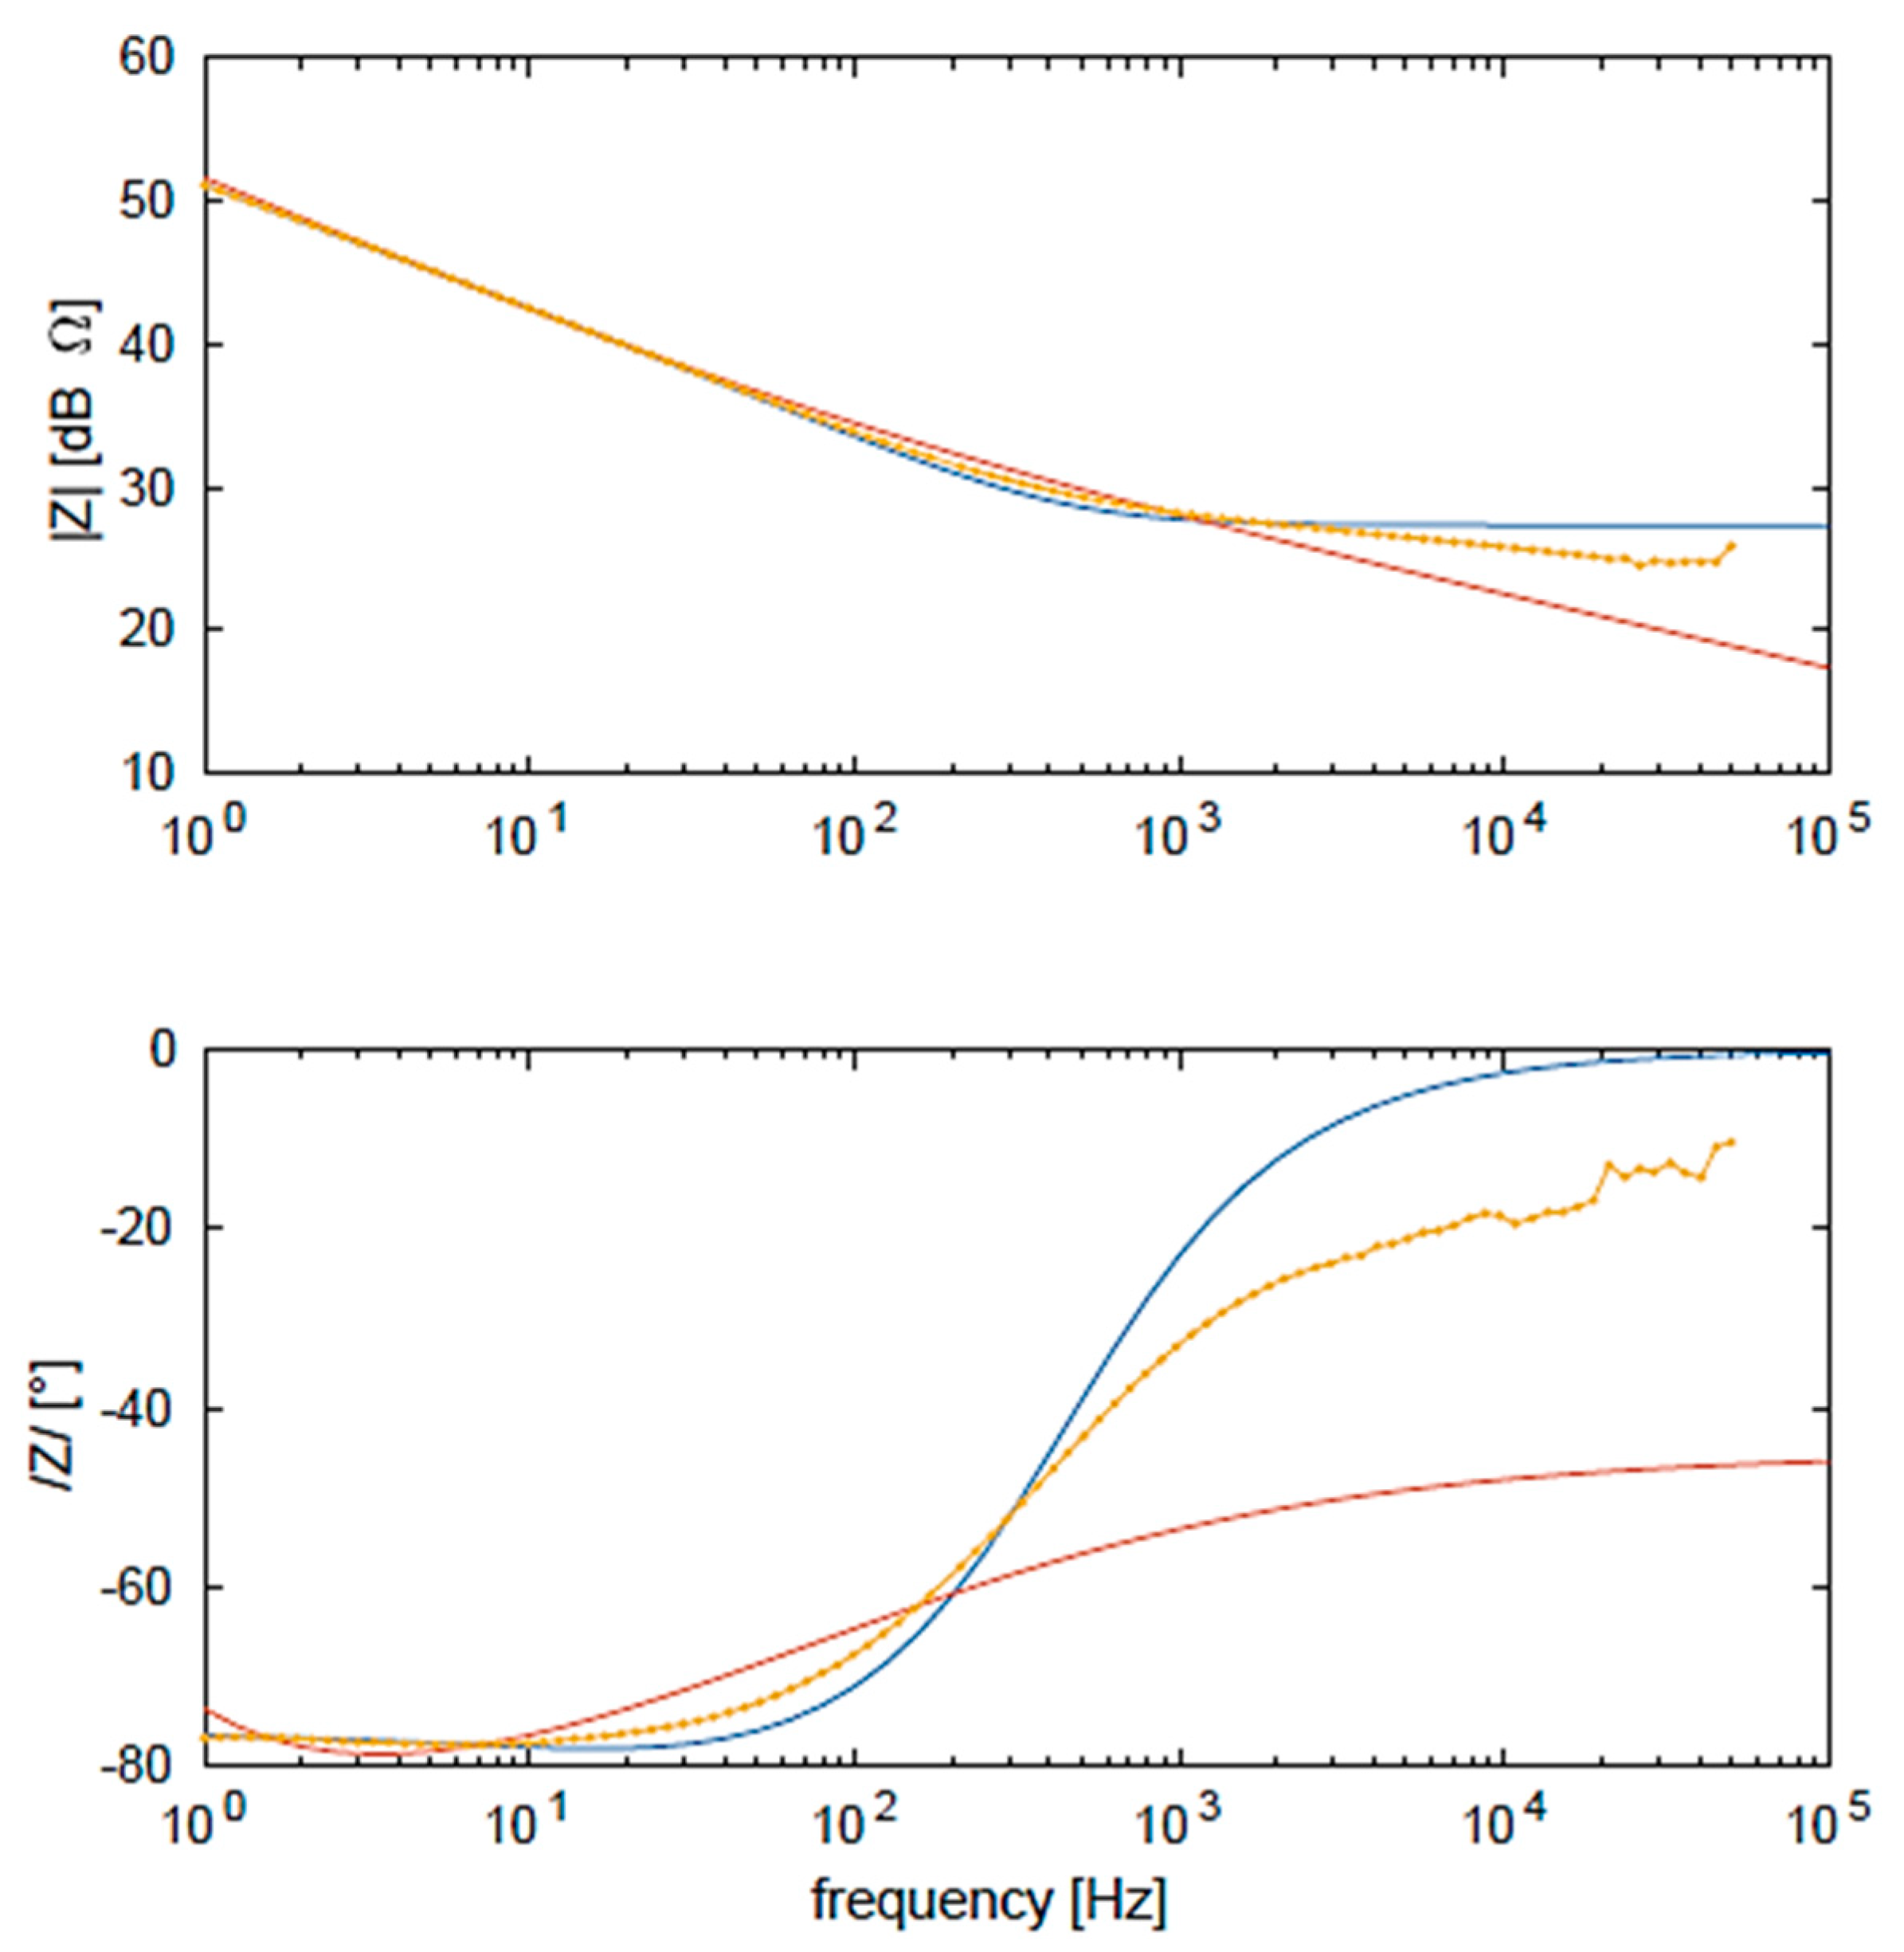
Since the conditioning step has an important role in the electrochemical behavior and the best electrochemical response is present in nanocomposites loaded at 10% of the filler, we studied the electrochemical impedance spectroscopy (EIS) to analyze and model the equivalent electrical circuit, justifying the electrochemical behavior and highlighting the circuit elements responsible for the working principles.
The screen-printed electrodes with 10% filler (MWCNT pristine, NH2 and GNP) were characterized by electrochemical impedance spectroscopy, before and after immersion in water.
The Nyquist plots show a complex pattern of impedance, not attributable to a classical Randle’s circuit.
In order to provide a compact and efficient model of the overall process, we investigate and propose an equivalent lumped elements electrical circuit, that, on the one hand, is based on a previous article of the literature [
14], and, on the other, provides a remarkable and definite improvement of it in terms of applicability. In fact, the general aim is also to use the equivalent circuit as a design tool for the optimal setup of the global chemical process. In the following, we will make use of the concepts introduced in
Section 3.
In Reference [
14], a parallel RC combination (modeling the epoxy resin) and a variable number of RC series in parallel to the previous one (modeling the fillers network) were considered to achieve a good fit between the network and the measured equivalent impedance.
In this work, in order to refine the base equivalent electrical circuit, we decide to modify the circuit by adding the contact resistance to simulate the liquid/composite interface and replacing the RC series with an RCL series to simulate the mechanisms of current flow in the fillers, including the hopping conduction mechanism (L) [
21,
22,
23].
Finally, since the CV characterization showed an important role of the conditioning step, we decide to add the Warburg element, which takes into account the diffusion of a liquid inside the matrix. In fact, it is possible to demonstrate that the Warburg impedance, defined by:
is correlated with the ion diffusion in the electrochemical system, considering the second Fick’s law and defining the “Warburg capacitance” as:
in which
F is the Faraday constant,
E is the potential difference between the working and counter electrodes,
A is the unit area of electrode,
zi is the ion charge,
Di is the diffusion coefficient, and
ci is the concentration of ions [
29].
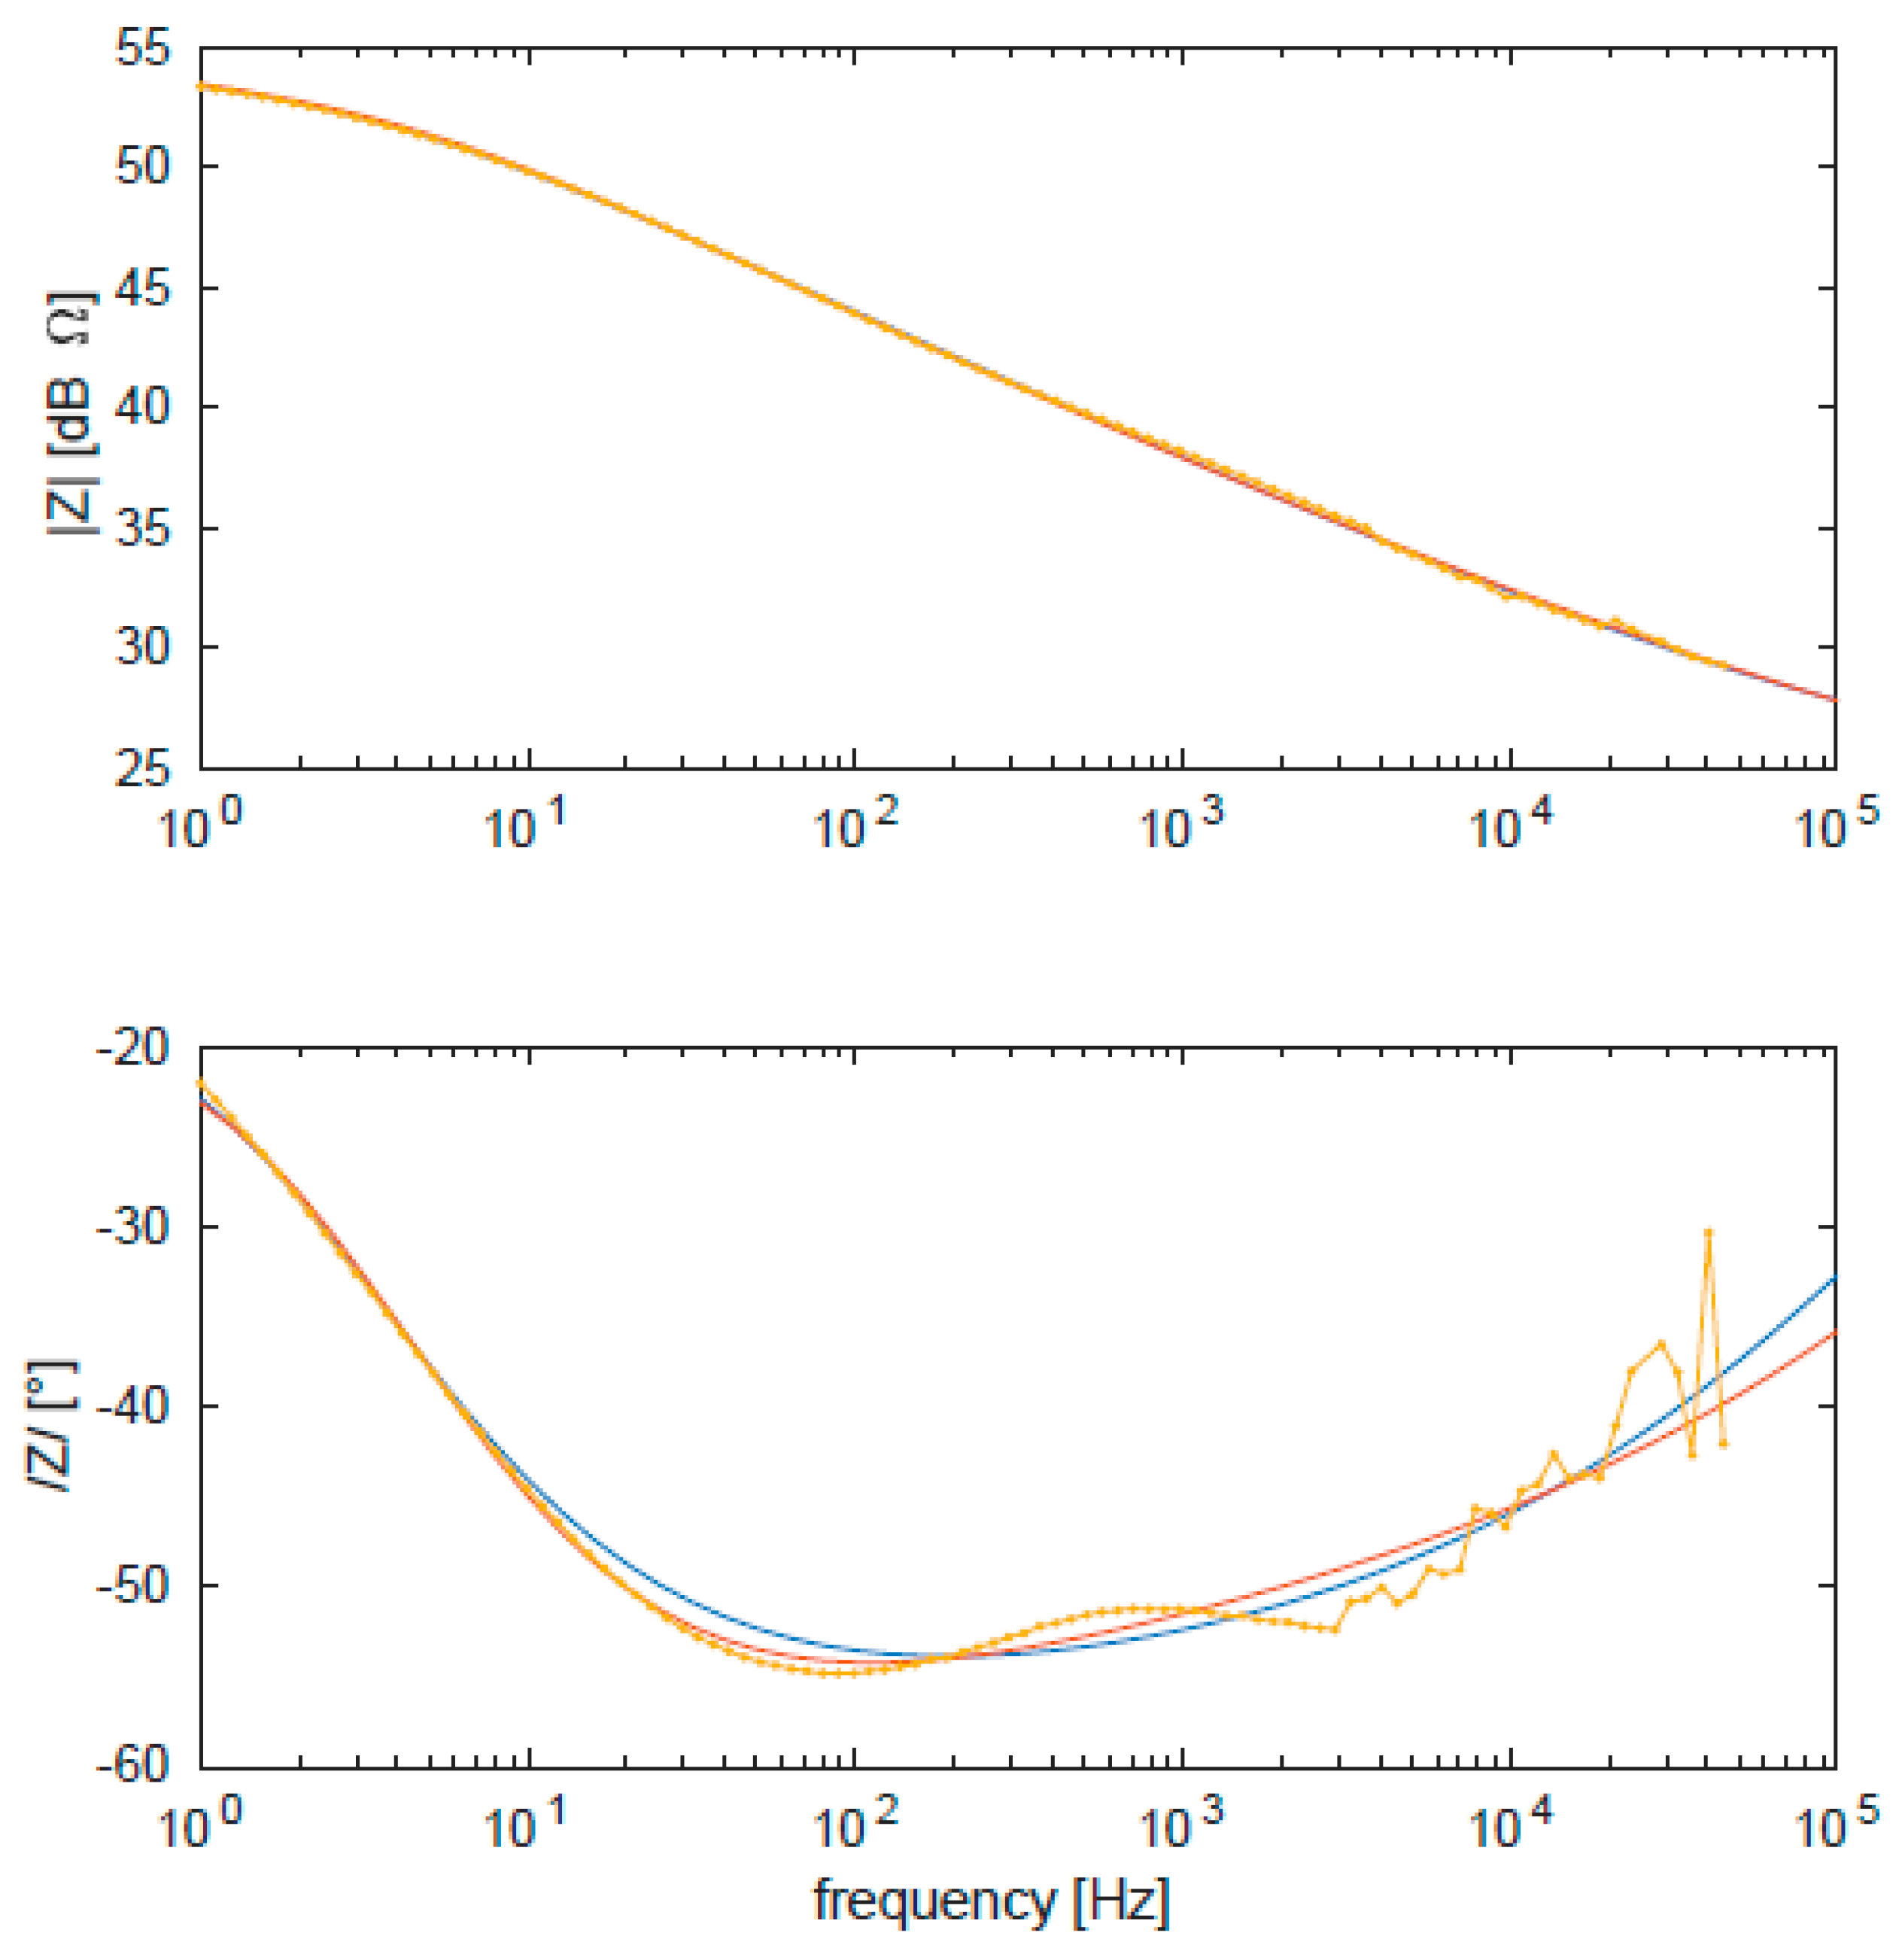
As it is possible to see in the comparison of
Figure 11, the equivalent electrical circuit proposed in the present work is simpler and more precise than previously proposed. In
Figure 11, we define Q1 = ω
0 C2(j ω⁄ω
0)
N2.
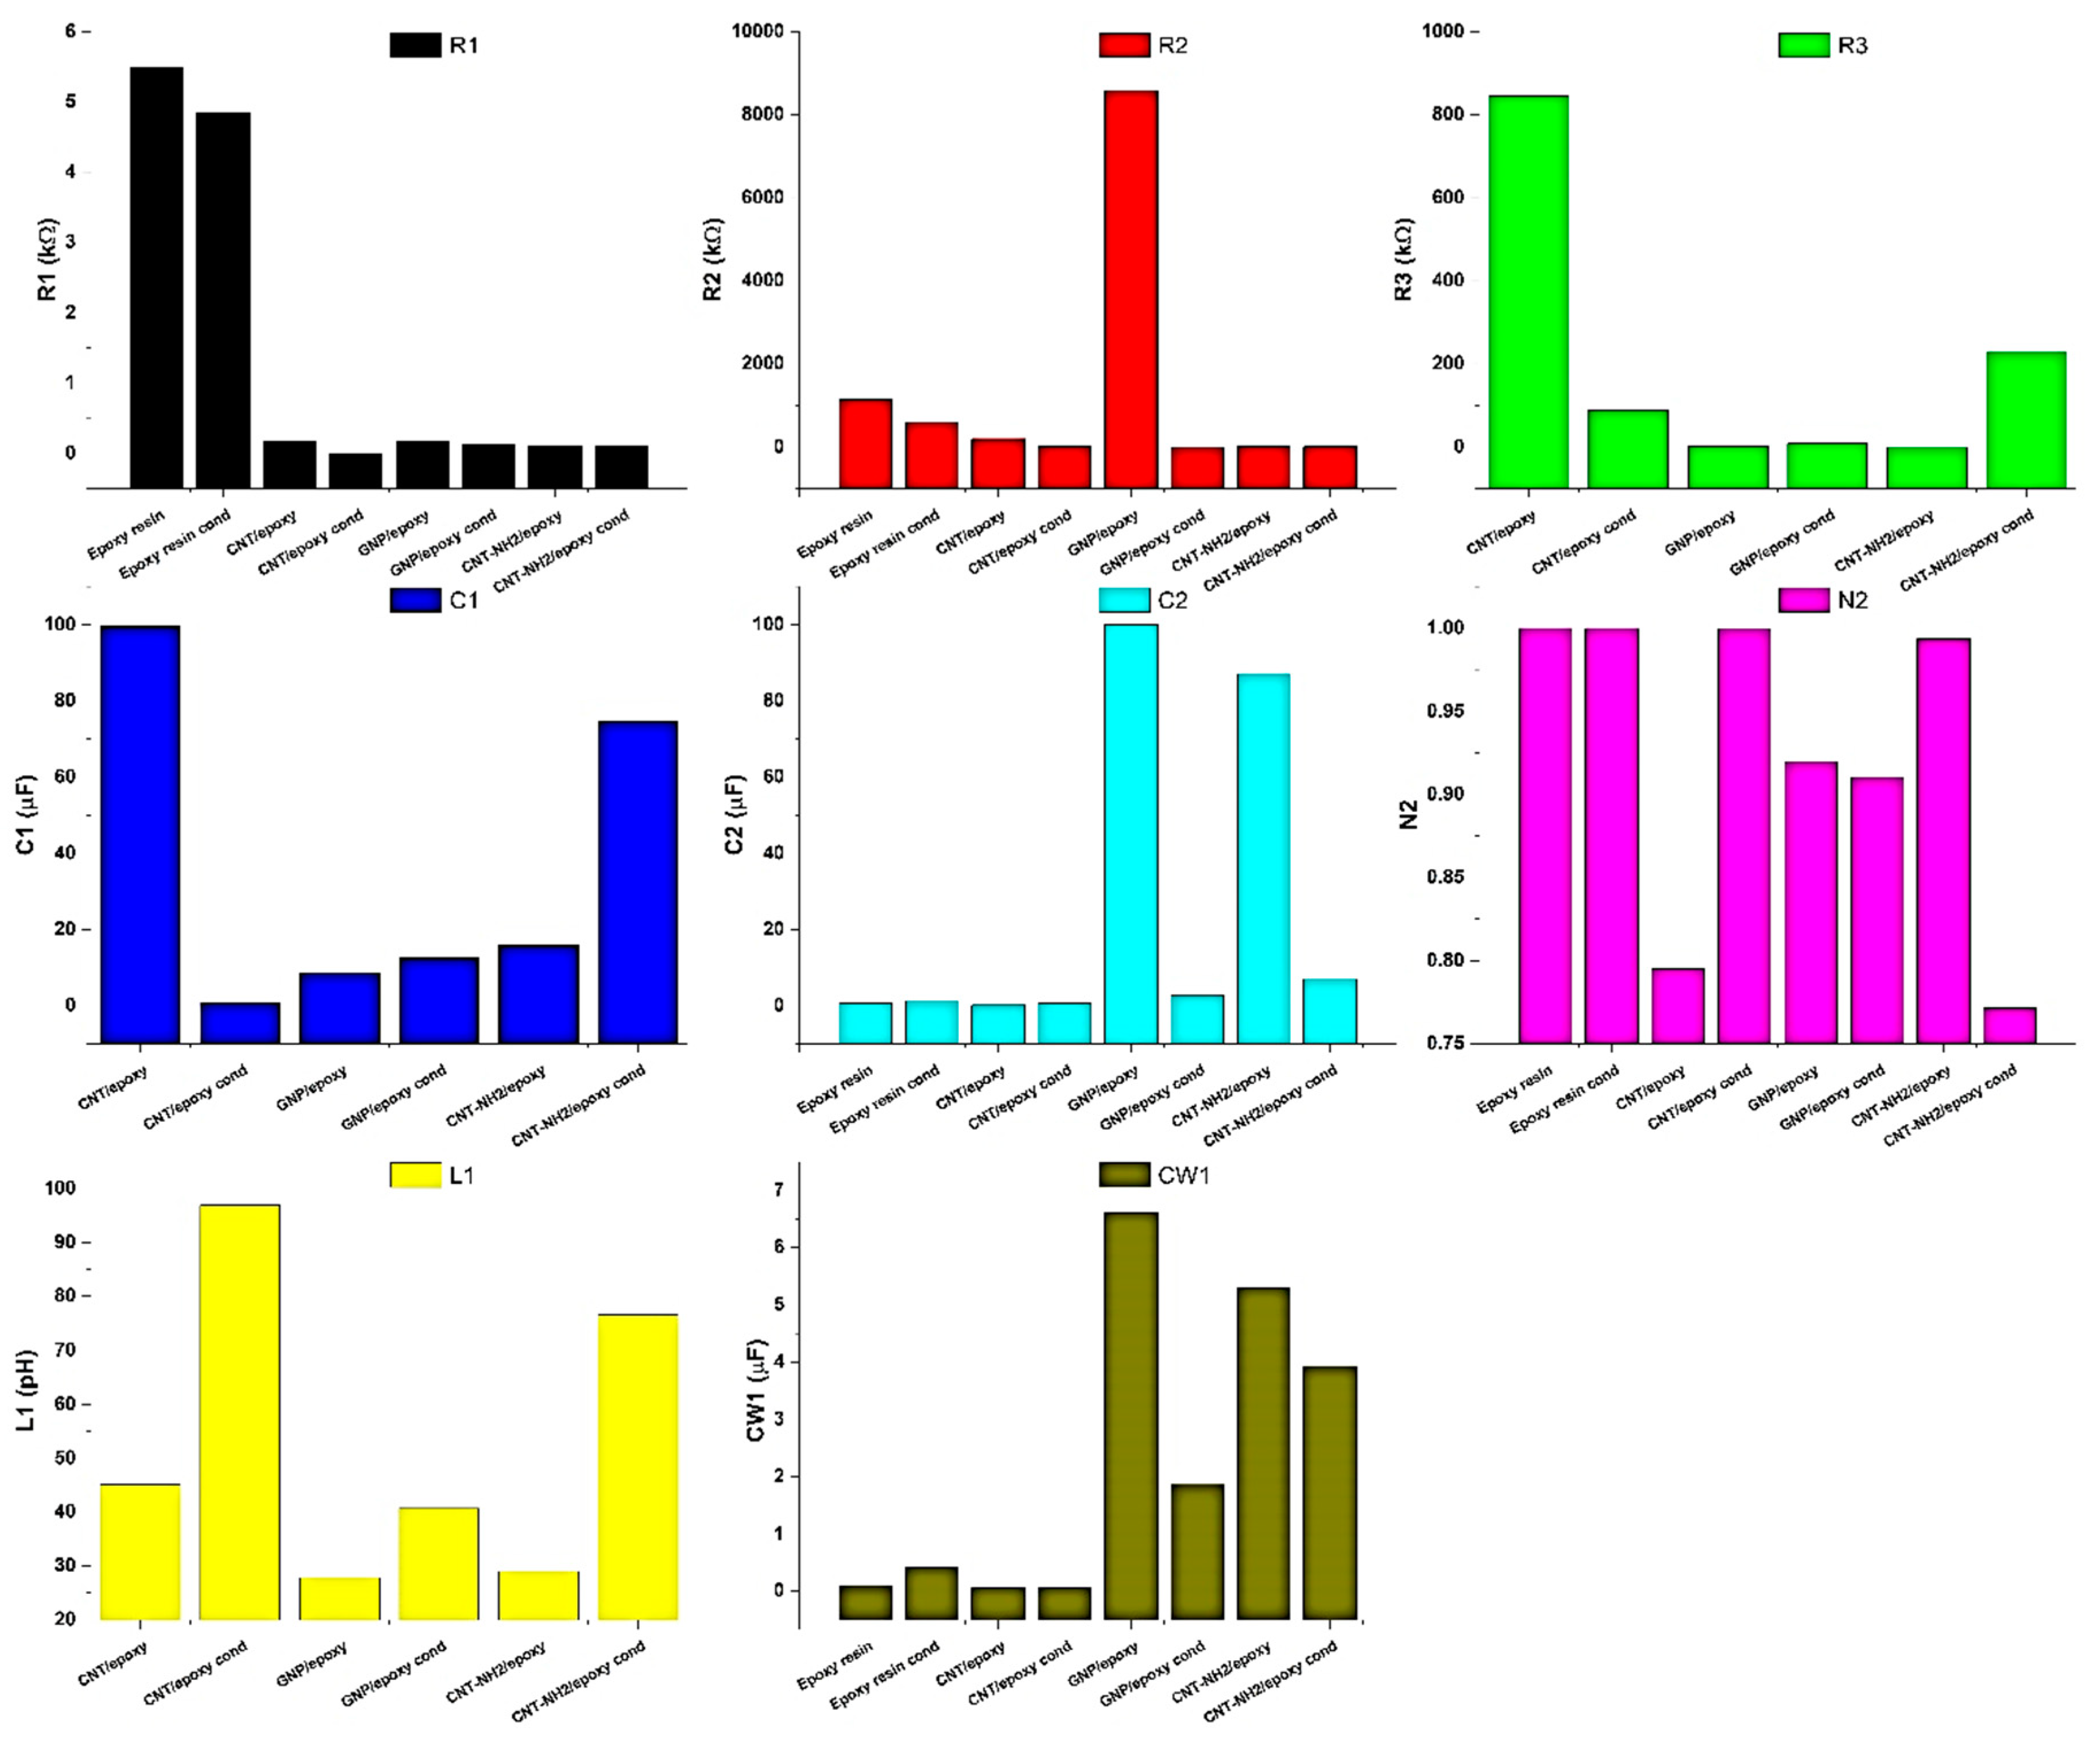
The results of the fitting performed using an optimization toolbox for MATLAB are reported in
Table 1; we use the formula Q2 = ω
0 C3(j ω⁄ω
0)
N3 where N
3 was fixed at 1⁄2, being Q2 = W1 a Warburg element. The best fitting parameters confirm the improvement of electrochemical properties given by loading of the nanofiller: In fact, it is possible to observe a general decreasing of values of resistance with respect to the neat epoxy resin and an increase in capacitance values.
In particular, the resistance at the liquid/composite interface is sensibly decreased, as shown in
Figure 12.
The decreasing in resistance allows the charge/discharge processes to the SPE. However, this parameter is not enough to guarantee that redox processes occur at the SPE. In fact, beyond the reduced resistance at the liquid/composite interface, it is essential that a conductive pathway occurs and promotes the electron migration from the SPE bulk to the redox species. The inductance (L1) and all capacitive elements (C1, C2, and W1) could suggest the electronic pathway.
In fact, the inductance models the electronic hopping between different nanofillers or the matrix and nanofiller [
21,
22,
23]. In the nanocomposite, the inductance increases after the conditioning step, as shown in
Figure 13.
After conditioning, we observe an increment of more than 50% for nanocomposites loaded with CNT and CNT-NH
2, and an increment of 30% for nanocomposites loaded with GNP. This enhancement could be attributed to the water diffusion inside the pores of the matrix. Furthermore, we can notice that the best fitting values of the CNT/epoxy nanocomposite are higher than both one of the CNT-NH
2/epoxy and GNP/epoxy, contrary to the results of CV characterization, in which the CNT-NH
2/epoxy and GNP/epoxy work better than the CNT/epoxy one. For a complete explanation of this electrochemical phenomenon, we analyze the trend of capacitive elements, as shown in
Figure 14.
The best fitting values obtained for the capacitive elements show the highest capacitive contribution for the CNT-NH
2/epoxy and GNP/epoxy with respect to the neat epoxy resin. The sum of capacitance of the system (C1, related to filler capacitance; C2, related to matrix capacitance; Warburg capacitance, related to water and ion diffusion inside the matrix) can explain the good behavior as an electrode for CNT-NH
2/epoxy and GNP/epoxy systems. Therefore, the conditioning step, as observed during CV characterization, has a real positive effect on the electrochemical behavior: In fact, the conditioning step affects all capacitances since the diffusion of water in the matrix changes the response of nanocomposites and, furthermore, allows the ions to penetrate inside the matrix and to have a higher electrochemical area for redox processes, as shown by the values of Warburg capacitance. On the other hand, the Warburg capacitance values for CNT-NH
2/epoxy and GNP/epoxy systems are in good agreement with CV characterization: In fact, we observe a low improvement after the conditioning step for these systems. A possible explanation could be the high electroactive area due to the nature of the fillers: In fact, if GNPs have a great superficial area, thanks to their aspect ratio, that protrude dramatically at the SPE surface, the CNTs-NH
2 play a role together with the matrix, since they are linked directly with the epoxy chain, i.e.,
Scheme 2, obtaining some conducting region of epoxy resin and hence increasing the electroactive area.

 ,
, 


