
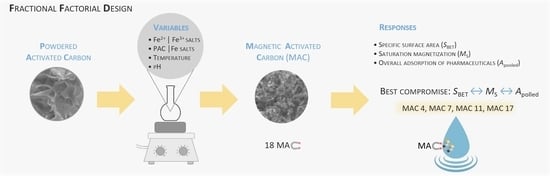
Producing Magnetic Nanocomposites from Paper Sludge for the Adsorptive Removal of Pharmaceuticals from Water—A Fractional Factorial Design


 ,
,  ,
,
Abstract
:
1. Introduction
2. Materials and Methods
2.1. Reagents and Chemicals
2.2. Preparation of Powdered Activated Carbon
2.3. Preparation of Magnetic Activated Carbon
2.4. Process Variables and Experimental Fractional Factorial Design
2.4.1. Factors
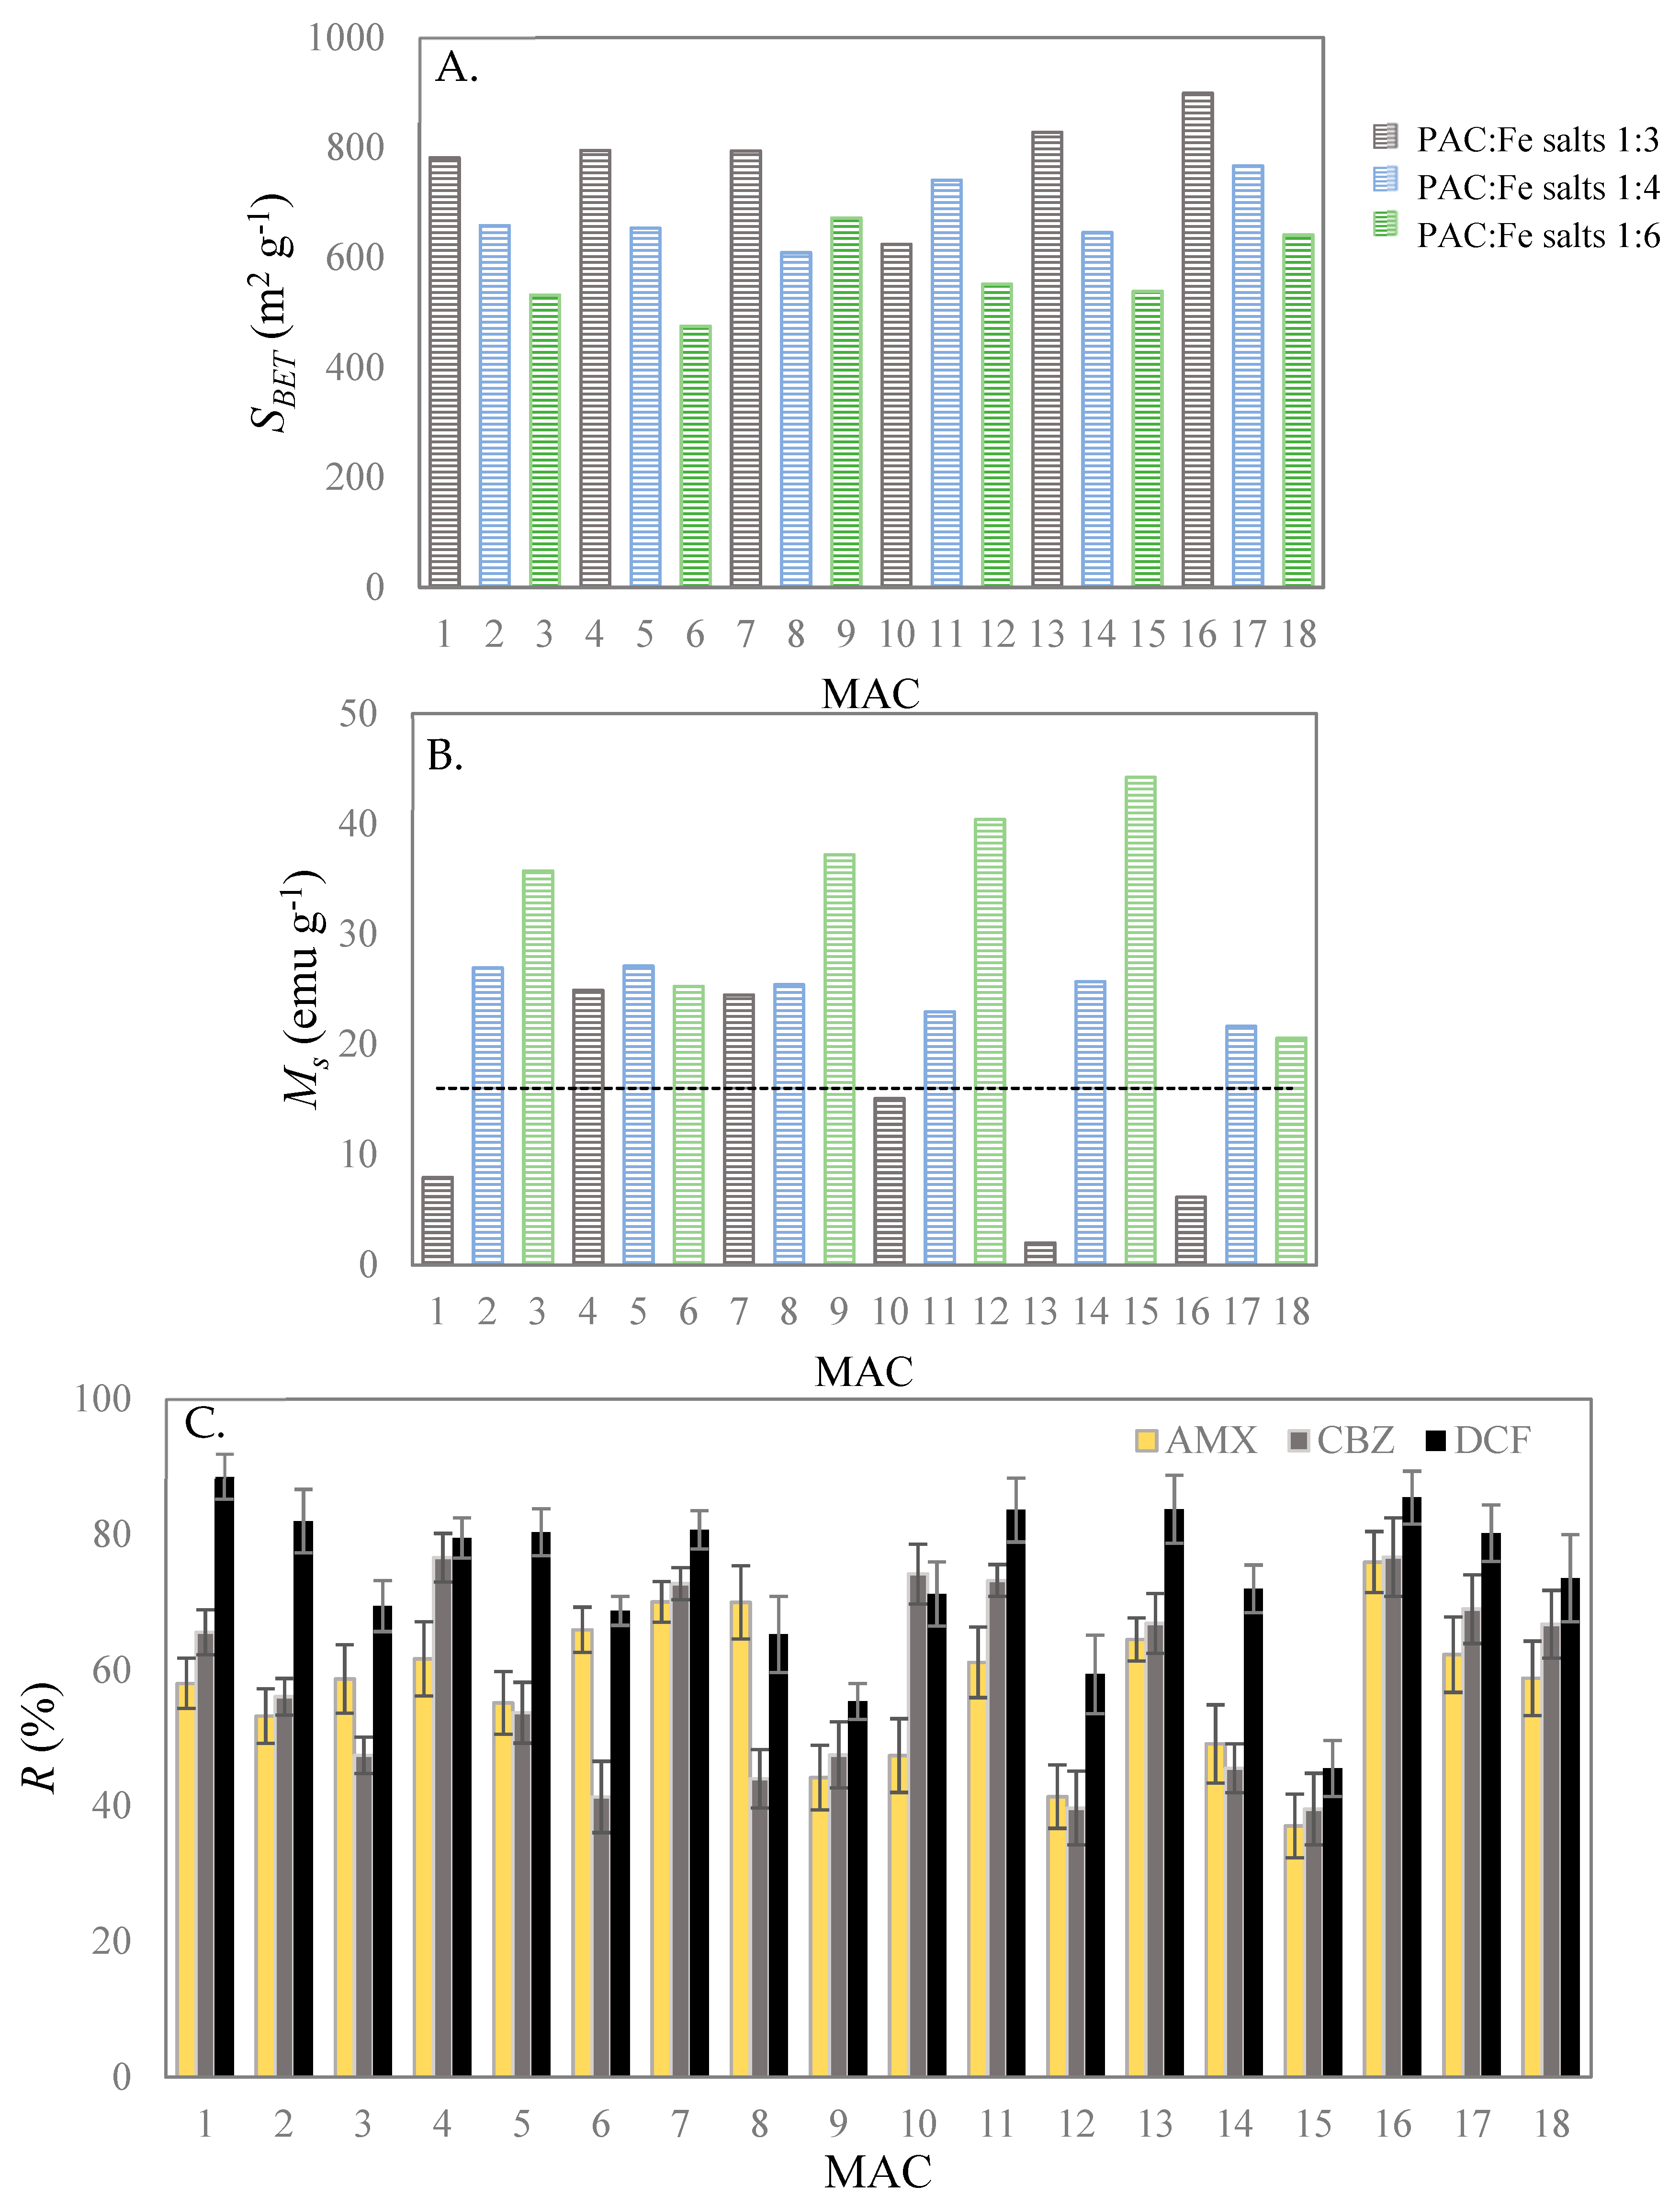
2.4.2. Responses
- (i)
- Specific surface area
- (ii)
- Saturation magnetization
- (iii)
- Adsorption percentage
2.5. Analytic Quantification of Pharmaceuticals
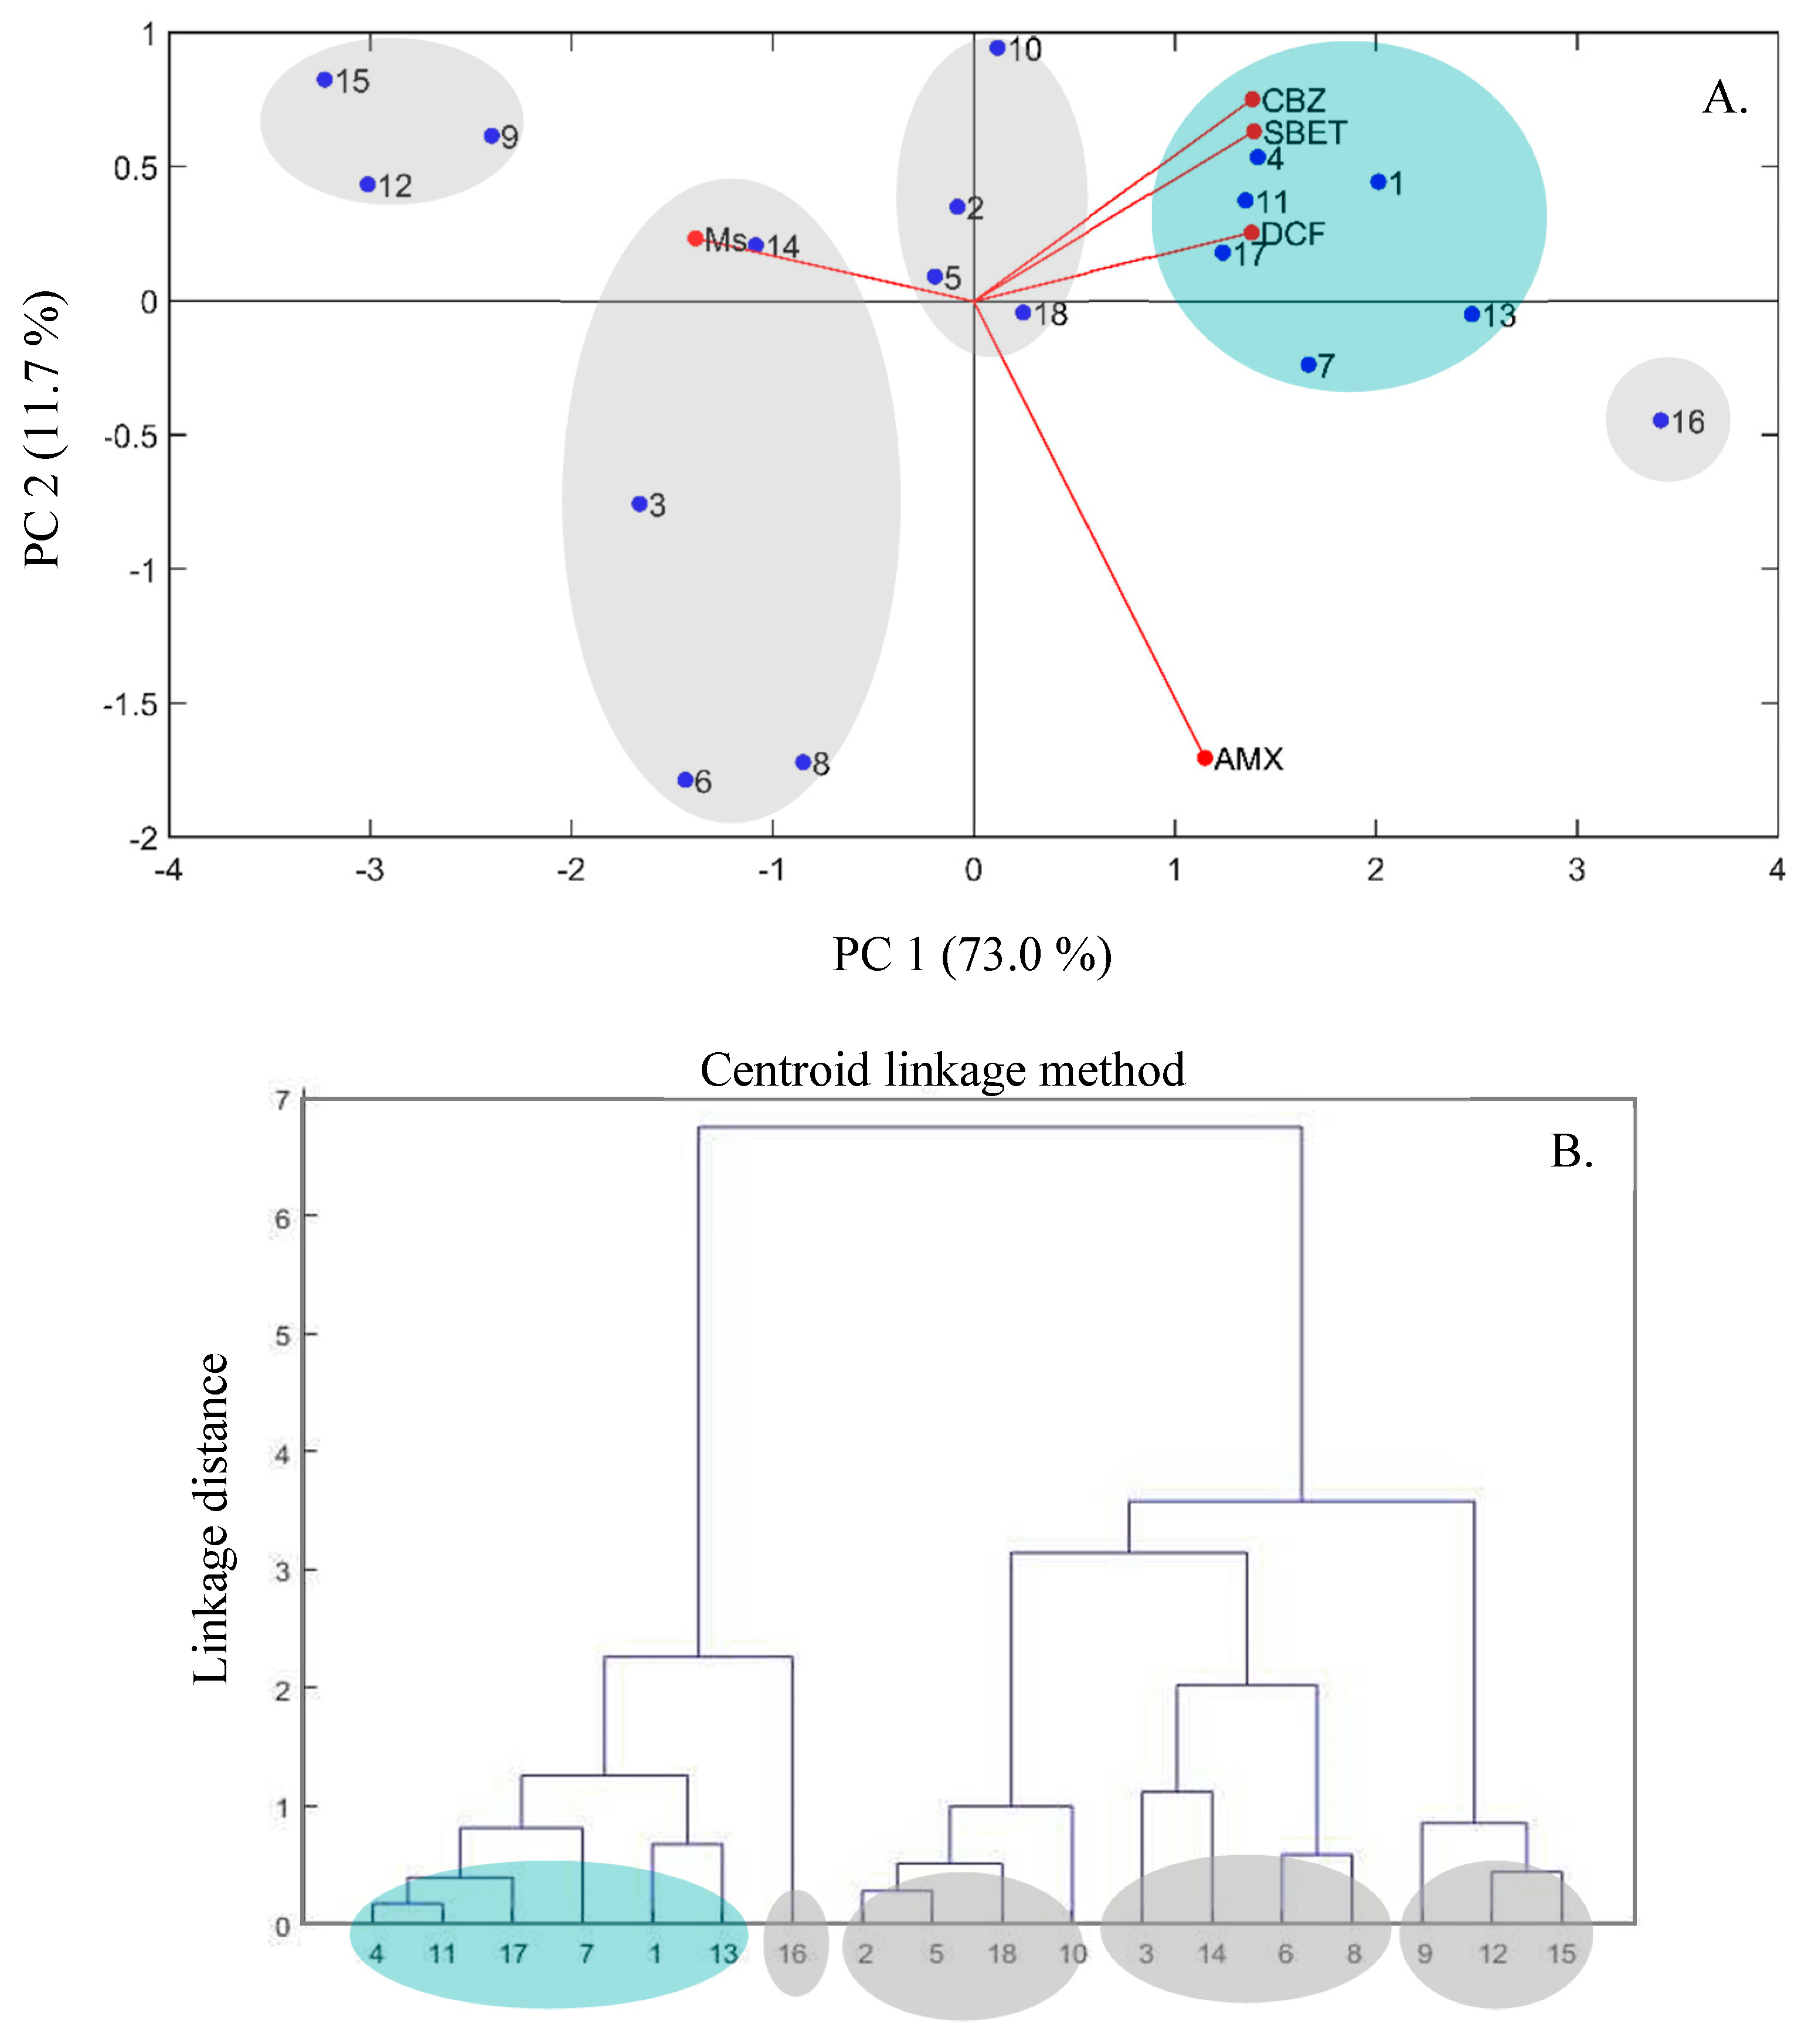
2.6. Data Treatment
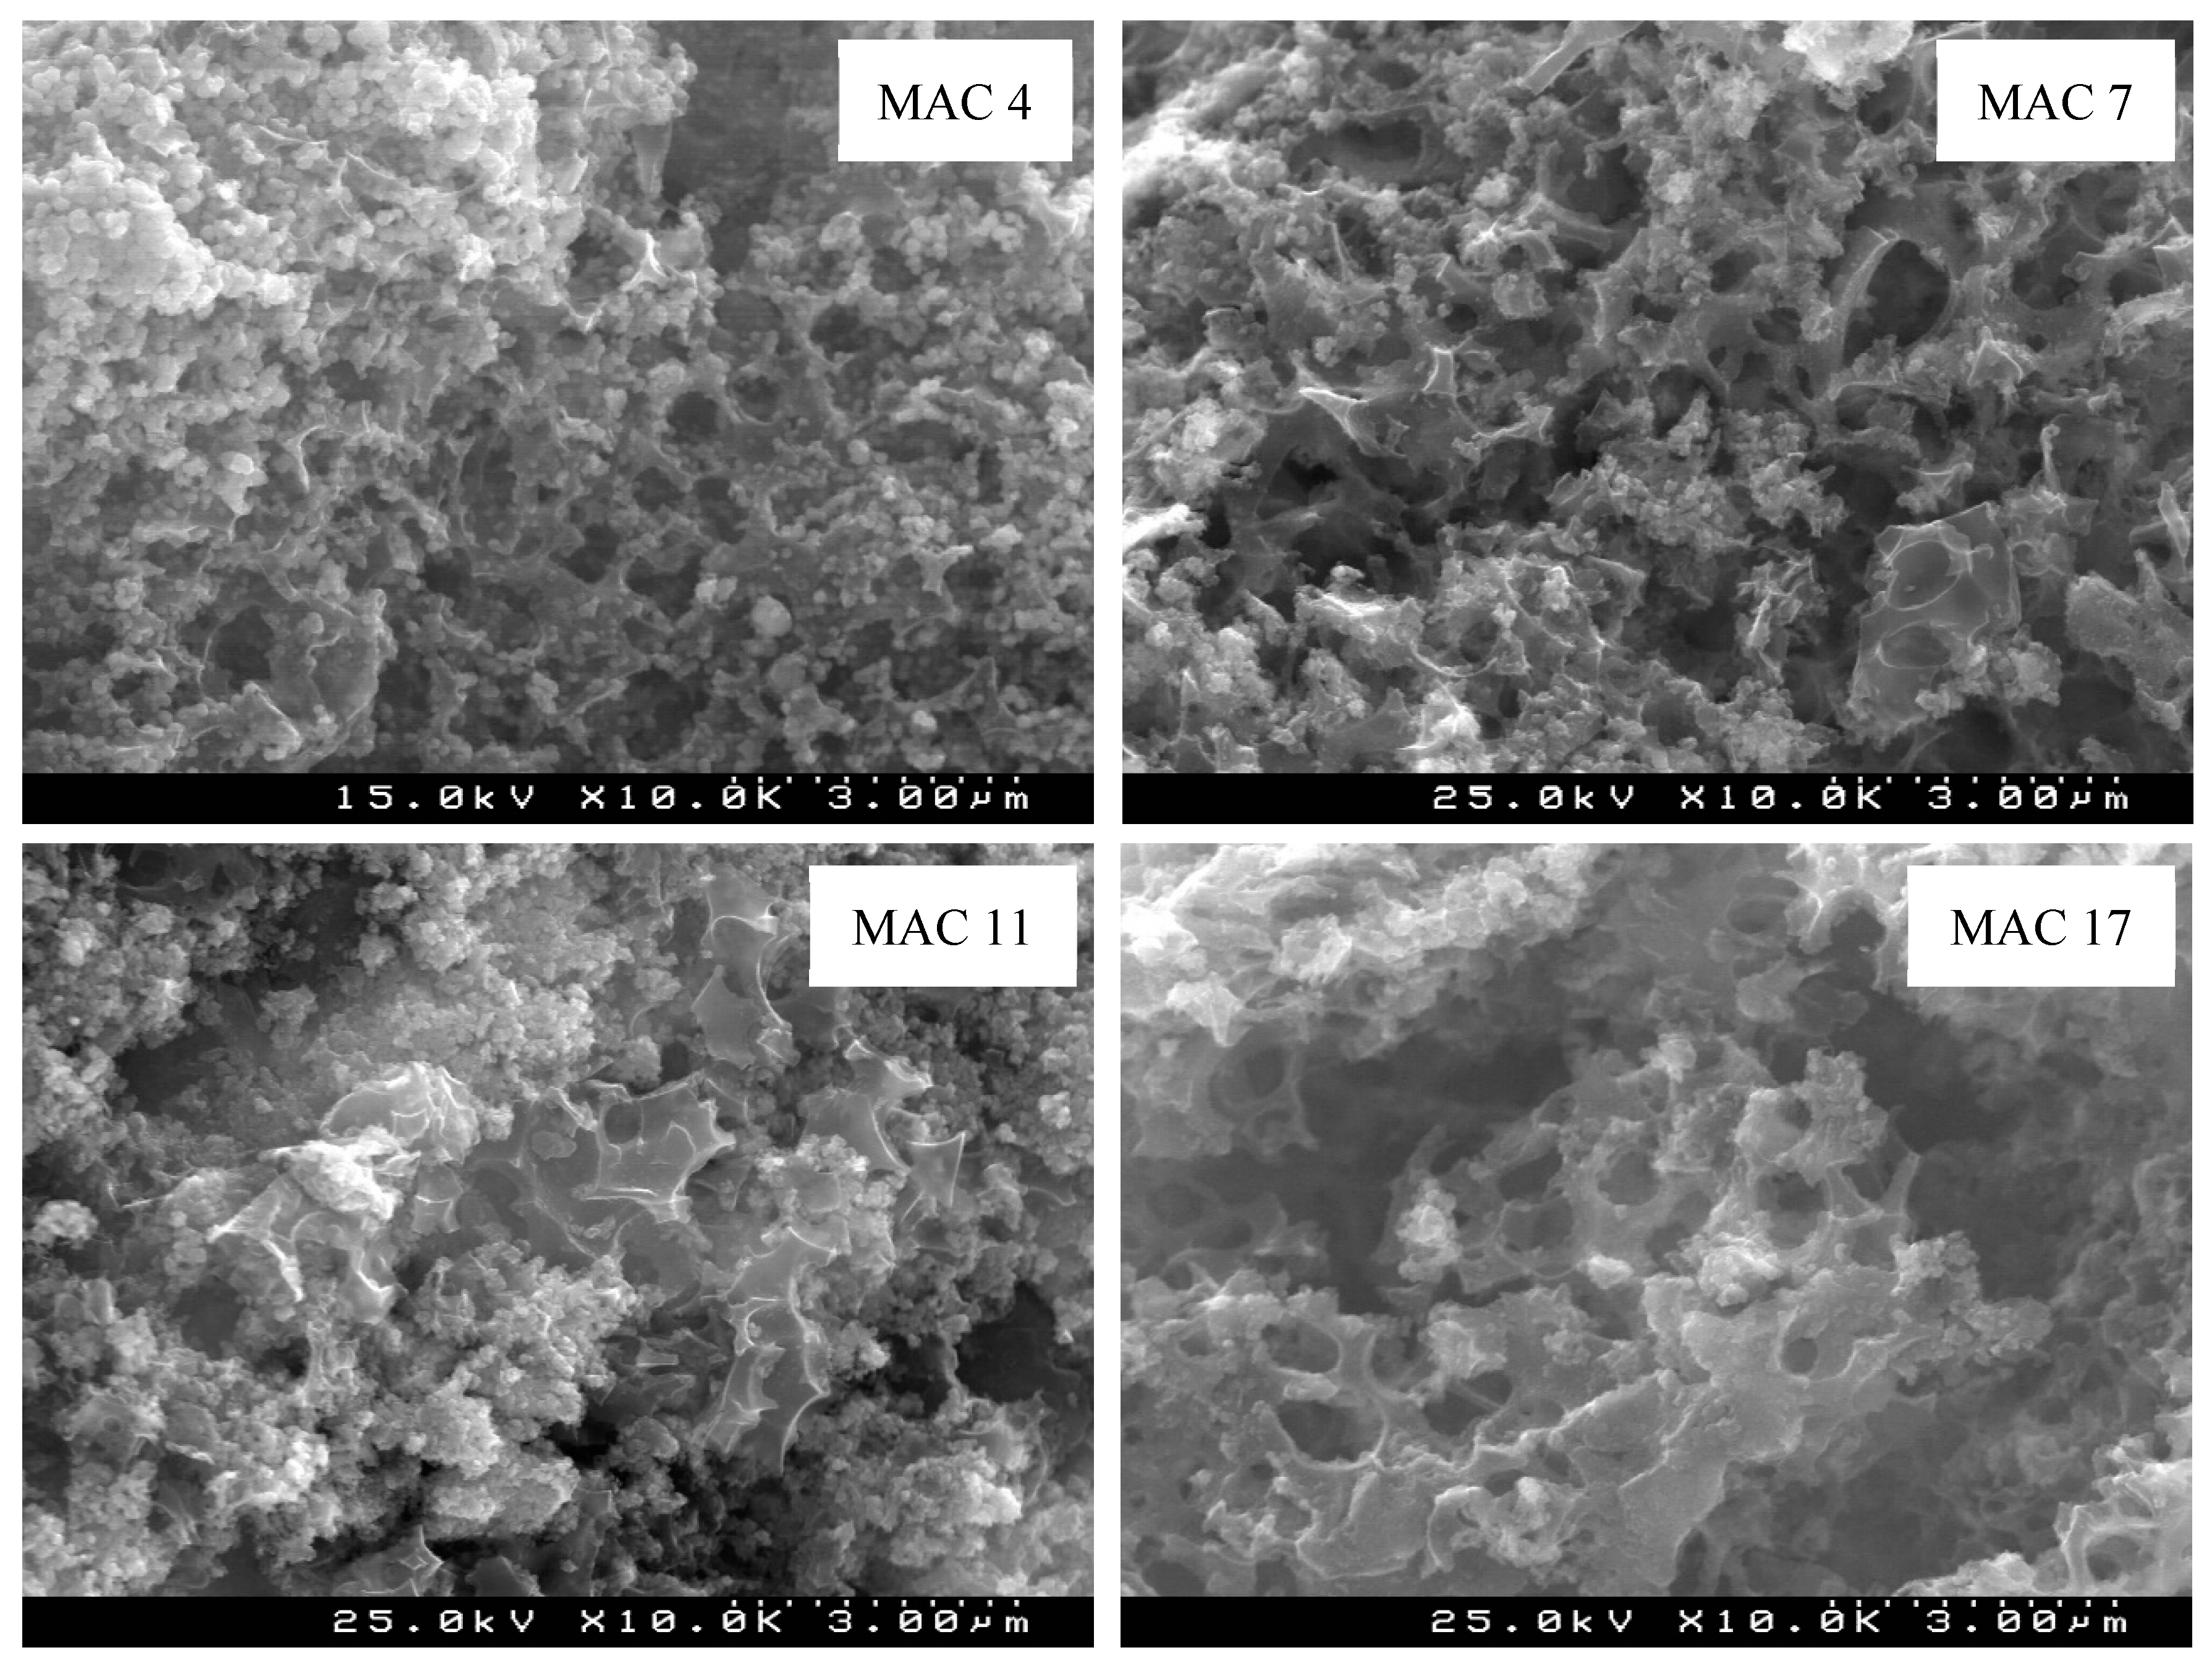
2.7. Morphological and Chemical Characterization of Selected Materials
3. Results and Discussion
3.1. Fractional Factorial Design
3.2. Statistical Data Analysis
3.2.1. Analysis of Variance
3.2.2. Quadratic Regression
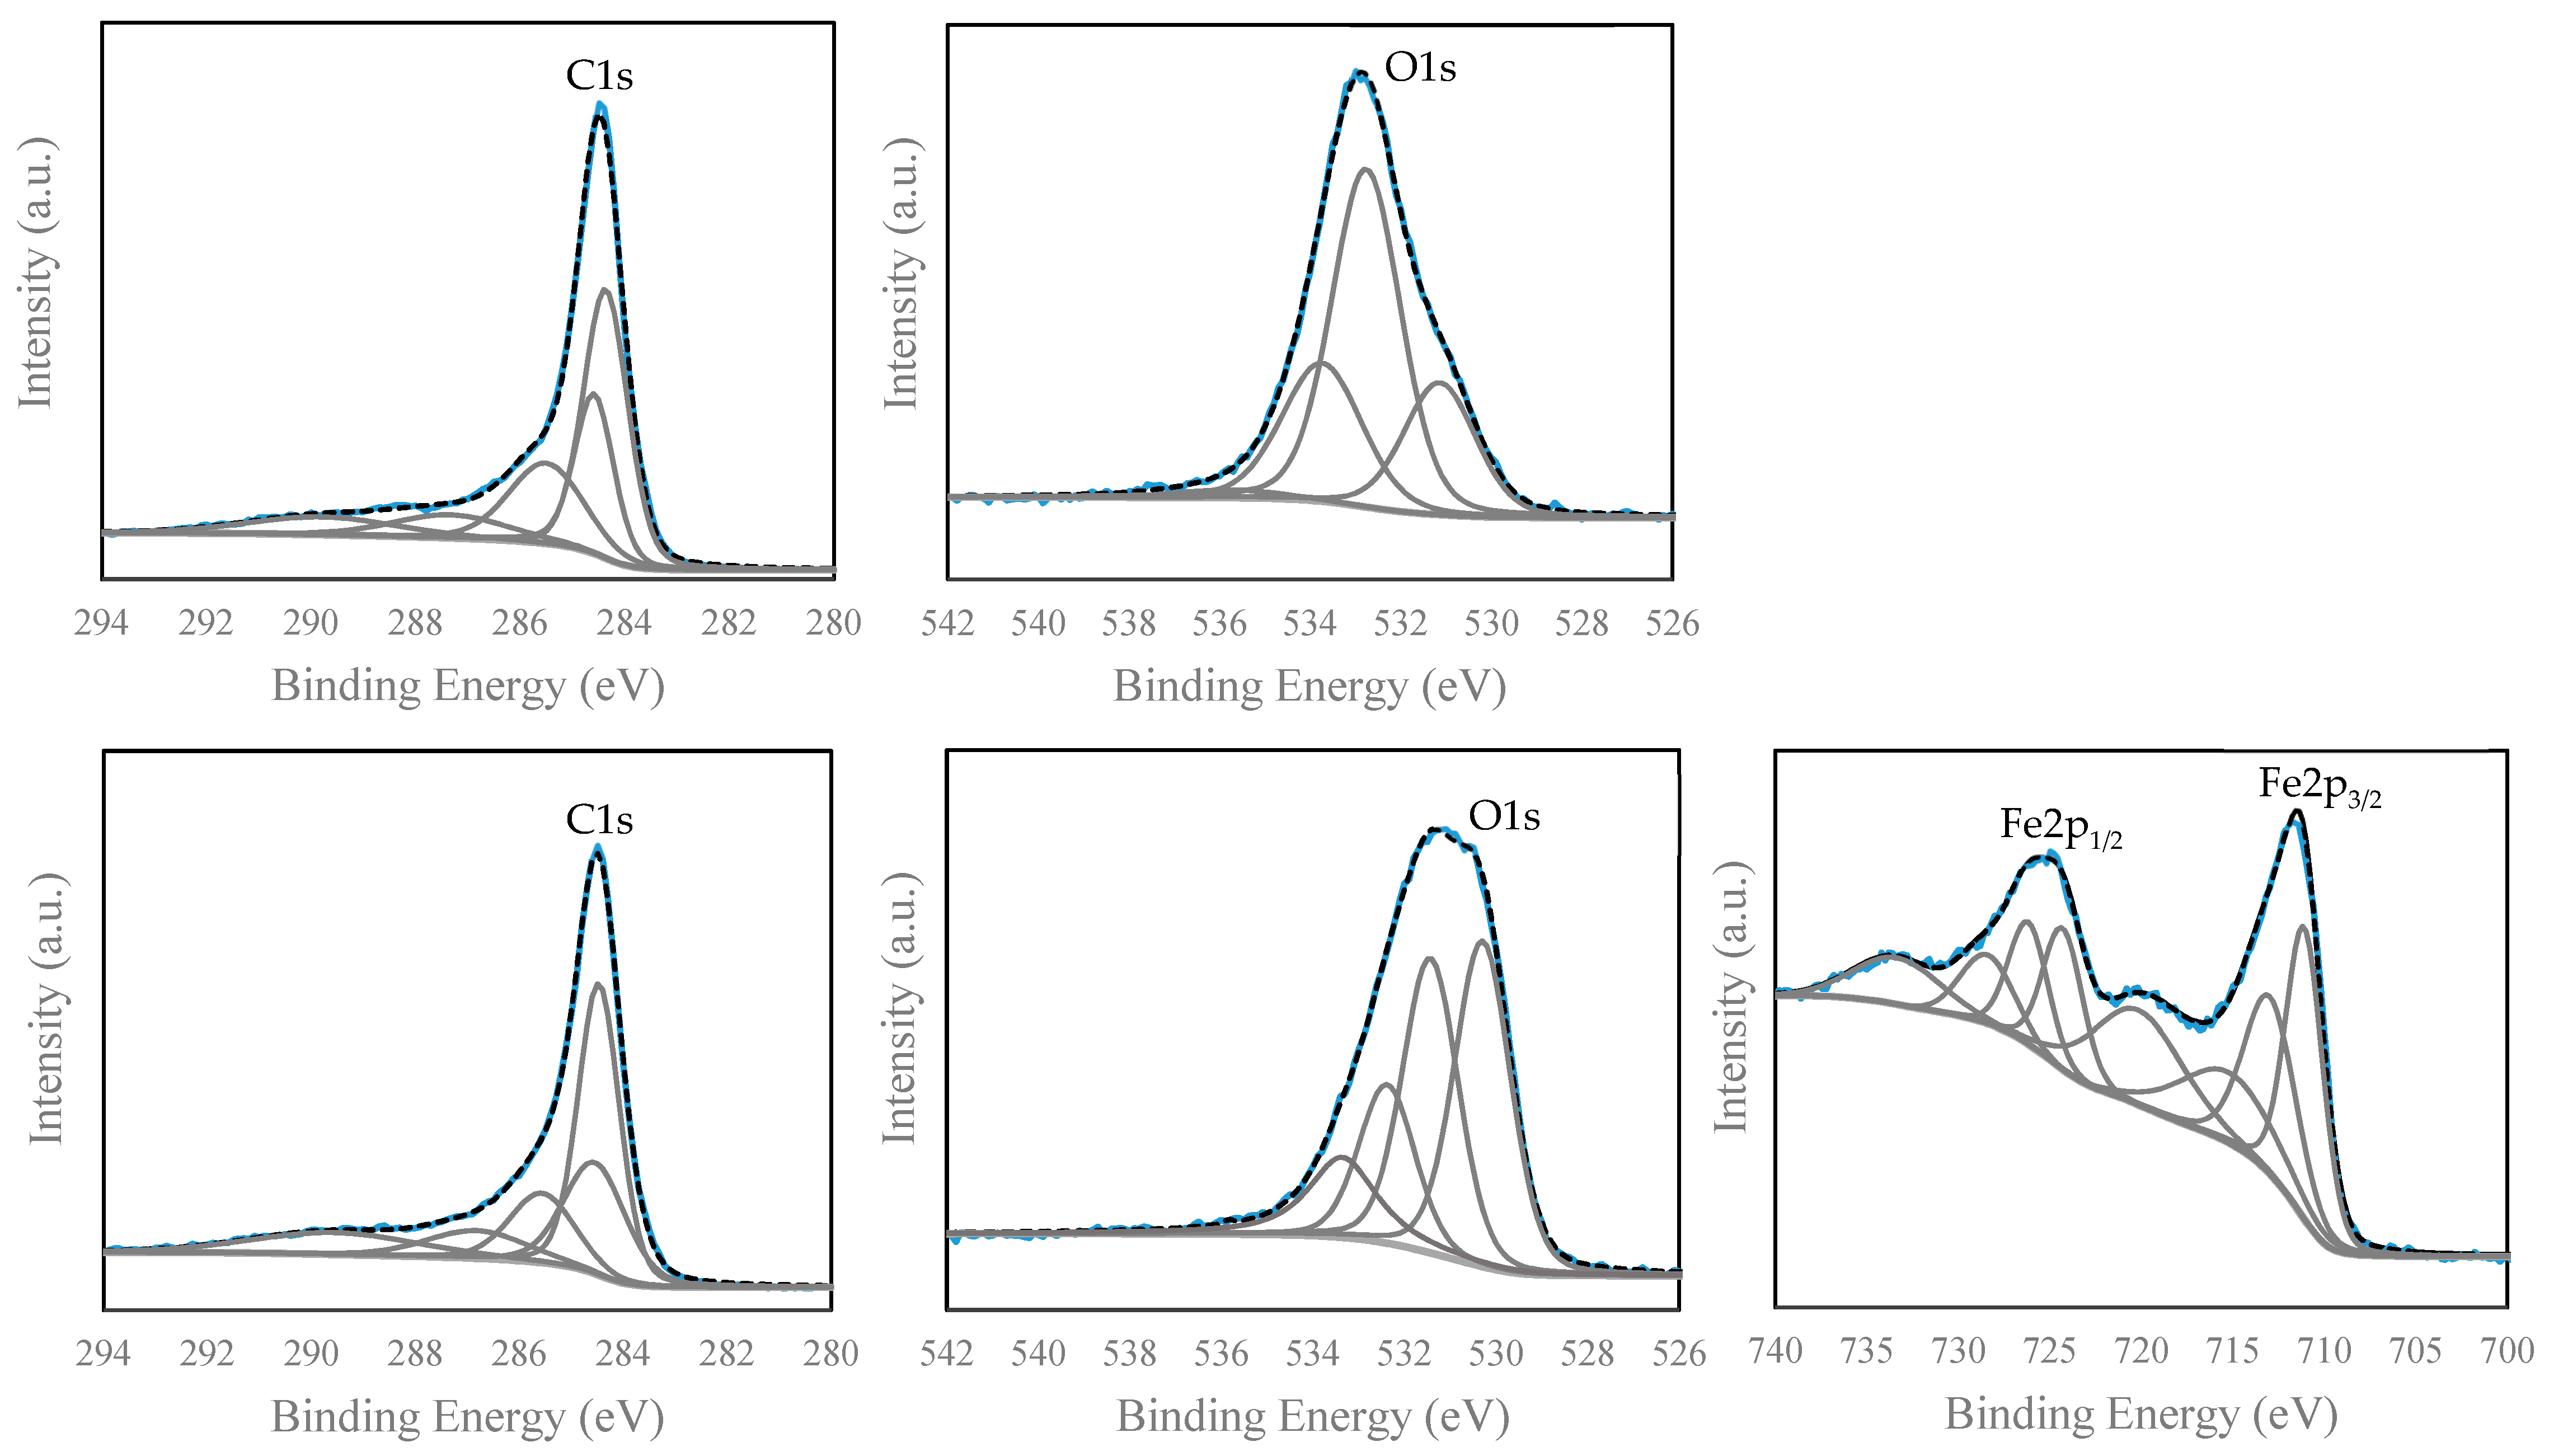
3.3. Morphologic and Chemical Features of the Optimal MAC
3.4. Comparison with Waste-Based MAC in the Literature
4. Conclusions
Supplementary Materials
Author Contributions
Funding
Data Availability Statement
Acknowledgments
Conflicts of Interest
References
- Akhtar, J.; Amin, N.A.S.; Shahzad, K. A review on removal of pharmaceuticals from water by adsorption. Desalin. Water Treat. 2015, 57, 12842–12860. [Google Scholar] [CrossRef]
- Ebele, A.J.; Abou-Elwafa Abdallah, M.; Harrad, S. Pharmaceuticals and personal care products (PPCPs) in the freshwater aquatic environment. Emerg. Contam. 2017, 3, 1–16. [Google Scholar] [CrossRef]
- Patel, M.; Kumar, R.; Kishor, K.; Mlsna, T.; Pittman, C.U.; Mohan, D. Pharmaceuticals of emerging concern in aquatic systems: Chemistry, occurrence, effects, and removal methods. Chem. Rev. 2019, 119, 3510–3673. [Google Scholar] [CrossRef] [Green Version]
- Fick, J.; Söderström, H.; Lindberg, R.H.; Phan, C.; Tysklind, M.; Larsson, D.G.J. Pharmaceuticals and Personal Care Products in the Environment CONTAMINATION OF SURFACE, GROUND, AND DRINKING WATER FROM PHARMACEUTICAL PRODUCTION. Environ. Toxicol. Chem. 2009, 28, 2522–2527. [Google Scholar] [CrossRef] [PubMed]
- Larsson, D.G.J.; de Pedro, C.; Paxeus, N. Effluent from drug manufactures contains extremely high levels of pharmaceuticals. J. Hazard. Mater. 2007, 148, 751–755. [Google Scholar] [CrossRef]
- Zenker, A.; Cicero, M.R.; Prestinaci, F.; Bottoni, P.; Carere, M. Bioaccumulation and biomagnification potential of pharmaceuticals with a focus to the aquatic environment. J. Environ. Manag. 2014, 133, 378–387. [Google Scholar] [CrossRef]
- Sui, Q.; Cao, X.; Lu, S.; Zhao, W.; Qiu, Z.; Yu, G. Occurrence, sources and fate of pharmaceuticals and personal care products in the groundwater: A review. Emerg. Contam. 2015, 1, 14–24. [Google Scholar] [CrossRef] [Green Version]
- European Parliament. Directive 2013/39/EU of the European Parliament and of the Council of 12 August 2013 Amending Directives 2000/60/EC and 2008/105/EC as Regards Priority Substances in the Field of Water Policy; European Parliament: Brussels, Belgium, 2013. [Google Scholar]
- Verlicchi, P.; Galletti, A.; Petrovic, M.; Barceló, D. Hospital effluents as a source of emerging pollutants: An overview of micropollutants and sustainable treatment options. J. Hydrol. 2010, 389, 416–428. [Google Scholar] [CrossRef]
- Silva, C.P.; Jaria, G.; Otero, M.; Esteves, V.I.; Calisto, V. Waste-based alternative adsorbents for the remediation of pharmaceutical contaminated waters: Has a step forward already been taken? Bioresour. Technol. 2018, 250, 888–901. [Google Scholar] [CrossRef] [Green Version]
- Krahnstöver, T.; Wintgens, T. Separating powdered activated carbon (PAC) from wastewater-Technical process options and assessment of removal efficiency. J. Environ. Chem. Eng. 2018, 6, 5744–5762. [Google Scholar] [CrossRef]
- Calisto, V.; Ferreira, C.I.A.; Santos, S.M.; Victoria, M.; Otero, M.; Esteves, V.I. Production of adsorbents by pyrolysis of paper mill sludge and application on the removal of citalopram from water. Bioresour. Technol. 2014, 166, 335–344. [Google Scholar] [CrossRef] [PubMed]
- Jaria, G.; Calisto, V.; Victoria, M.; Otero, M.; Esteves, V.I. Journal of Colloid and Interface Science Removal of fluoxetine from water by adsorbent materials produced from paper mill sludge. J. Colloid Interface Sci. 2015, 448, 32–40. [Google Scholar] [CrossRef] [PubMed]
- Oliveira, G.; Calisto, V.; Santos, S.M.; Otero, M.; Esteves, V.I. Paper pulp-based adsorbents for the removal of pharmaceuticals from wastewater: A novel approach towards diversi fi cation. Sci. Total Environ. 2018, 631–632, 1018–1028. [Google Scholar] [CrossRef] [PubMed] [Green Version]
- Pereira, D.; Rocha, L.S.; Gil, M.V.; Otero, M.; Silva, N.J.O.; Esteves, V.I.; Calisto, V. In situ functionalization of a cellulosic-based activated carbon with magnetic iron oxides for the removal of carbamazepine from wastewater. Environ. Sci. Pollut. Res. 2020. [Google Scholar] [CrossRef]
- Masomi, M.; Ghoreyshi, A.A.; Najafpour, G.D.; Mohamed, A.R. Adsorption of Phenolic Compounds onto the Activated Carbon Synthesized from Pulp and Paper Mill Sludge: Equilibrium Isotherm, Kinetics, Thermodynamics and Mechanism Studies. Int. J. Eng. Trans. A Basics 2014, 27, 1485–1494. [Google Scholar]
- Calace, N.; Nardi, E.; Petronio, B.M.; Pietroletti, M. Adsorption of phenols by papermill sludges. Environ. Pollut. 2002, 118, 315–319. [Google Scholar] [CrossRef]
- Battaglia, A.; Calace, N.; Nardi, E.; Petronio, B.M.; Pietroletti, M. Reduction of Pb and Zn bioavailable forms in metal polluted soils due to paper mill sludge addition. Effects on Pb and Zn transferability to barley. Bioresour. Technol. 2007, 98, 2993–2999. [Google Scholar] [CrossRef]
- Rai, P.; Singh, K.P. Valorization of Poly (ethylene) terephthalate (PET) wastes into magnetic carbon for adsorption of antibiotic from water: Characterization and application. J. Environ. Manage. 2018, 207, 249–261. [Google Scholar] [CrossRef]
- Siddiqui, M.T.H.; Nizamuddin, S.; Baloch, H.A.; Mubarak, N.M.; Al-Ali, M.; Mazari, S.A.; Bhutto, A.W.; Abro, R.; Srinivasan, M.; Griffin, G. Fabrication of advance magnetic carbon nano-materials and their potential applications: A review. J. Environ. Chem. Eng. 2019, 7. [Google Scholar] [CrossRef]
- Wong, S.; Ngadi, N.; Inuwa, I.M.; Hassan, O. Recent advances in applications of activated carbon from biowaste for wastewater treatment: A short review. J. Clean. Prod. 2018, 175, 361–375. [Google Scholar] [CrossRef]
- Rocha, L.S.; Pereira, D.; Sousa, É.; Otero, M.; Esteves, V.I.; Calisto, V. Recent advances on the development and application of magnetic activated carbon and char for the removal of pharmaceutical compounds from waters: A review. Sci. Total Environ. 2020, 718, 137272. [Google Scholar] [CrossRef] [PubMed]
- Gnanaprakash, G.; Mahadevan, S.; Jayakumar, T.; Kalyanasundaram, P.; Philip, J.; Raj, B. Effect of initial pH and temperature of iron salt solutions on formation of magnetite nanoparticles. Mater. Chem. Phys. 2007, 103, 168–175. [Google Scholar] [CrossRef]
- Petrova, T.M.; Fachikov, L.; Hristov, J. The magnetite as adsorbent for some hazardous species from aqueous solutions: A review. arXiv 2011, arXiv:1104.5647. [Google Scholar]
- Baghdadi, M.; Ghaffari, E.; Aminzadeh, B. Removal of carbamazepine from municipal wastewater effluent using optimally synthesized magnetic activated carbon: Adsorption and sedimentation kinetic studies. J. Environ. Chem. Eng. 2016, 4, 3309–3321. [Google Scholar] [CrossRef]
- Badi, M.Y.; Azari, A.; Pasalari, H.; Esrafili, A.; Farzadkia, M. Modification of activated carbon with magnetic Fe3O4 nanoparticle composite for removal of ceftriaxone from aquatic solutions. J. Mol. Liq. 2018, 261, 146–154. [Google Scholar] [CrossRef]
- Lompe, K.M.; Vo Duy, S.; Peldszus, S.; Sauvé, S.; Barbeau, B. Removal of micropollutants by fresh and colonized magnetic powdered activated carbon. J. Hazard. Mater. 2018, 360, 349–355. [Google Scholar] [CrossRef]
- Jaria, G.; Patrícia, C.; Oliveira, J.A.B.P.; Santos, S.M.; Victoria, M.; Otero, M.; Calisto, V.; Esteves, V.I. Production of highly efficient activated carbons from industrial wastes for the removal of pharmaceuticals from water—A full factorial design. J. Hazard. Mater. 2019, 370, 212–218. [Google Scholar] [CrossRef] [Green Version]
- İlbay, Z.; Şahin, S.; Kerkez, Ö.; Bayazit, S. Isolation of naproxen from wastewater using carbon-based magnetic adsorbents. Int. J. Environ. Sci. Technol. 2015, 12, 3541–3550. [Google Scholar] [CrossRef] [Green Version]
- Wong, K.T.; Yoon, Y.; Snyder, S.A.; Jang, M. Phenyl-functionalized magnetic palm-based powdered activated carbon for the effective removal of selected pharmaceutical and endocrine-disruptive compounds. Chemosphere 2016, 152, 71–80. [Google Scholar] [CrossRef]
- Arya, V.; Philip, L. Adsorption of pharmaceuticals in water using Fe3O4 coated polymer clay composite. Microporous Mesoporous Mater. 2016, 232, 273–280. [Google Scholar] [CrossRef]
- Danalıoğlu, S.T.; Bayazit, Ş.S.; Kerkez Kuyumcu, Ö.; Salam, M.A. Efficient removal of antibiotics by a novel magnetic adsorbent: Magnetic activated carbon/chitosan (MACC) nanocomposite. J. Mol. Liq. 2017, 240, 589–596. [Google Scholar] [CrossRef]
- Castro, C.S.; Guerreiro, M.C.; Gonçalves, M.; Oliveira, L.C.A.; Anastácio, A.S. Activated carbon/iron oxide composites for the removal of atrazine from aqueous medium. J. Hazard. Mater. 2009, 164, 609–614. [Google Scholar] [CrossRef] [PubMed]
- Brunauer, S.; Emmett, P.H.; Teller, E. Adsorption of Gases in Multimolecular Layers. J. Am. Chem. Soc. 1938, 60, 309–319. [Google Scholar] [CrossRef]
- Marsh, H.; Rand, B. The Characterization of Microporous Carbons by Means of the Dubinin-Radushkevich Equation. J. Colloid Interface Sci. 1970, 33, 101–116. [Google Scholar] [CrossRef]
- Calisto, V.; Domingues, M.R.M.; Erny, G.L.; Esteves, V.I. Direct photodegradation of carbamazepine followed by micellar electrokinetic chromatography and mass spectrometry. Water Res. 2011, 45, 1095–1104. [Google Scholar] [CrossRef]
- Hassan, M.; Naidu, R.; Du, J.; Liu, Y.; Qi, F. Critical review of magnetic biosorbents: Their preparation, application, and regeneration for wastewater treatment. Sci. Total Environ. 2020, 702, 134893. [Google Scholar] [CrossRef]
- Lago, R.M.; Sapag, K.; Fabris, J.D.; Rios, R.V.R.A.; Oliveira, L.C.A.; Garg, V. Activated carbon/iron oxide magnetic composites for the adsorption of contaminants in water. Carbon 2003, 40, 2177–2183. [Google Scholar] [CrossRef]
- Reguyal, F.; Sarmah, A.K.; Gao, W. Synthesis of magnetic biochar from pine sawdust via oxidative hydrolysis of FeCl2 for the removal sulfamethoxazole from aqueous solution. J. Hazard. Mater. 2017, 321, 868–878. [Google Scholar] [CrossRef]
- Wang, S.Y.; Tang, Y.K.; Li, K.; Mo, Y.Y.; Li, H.F.; Gu, Z.Q. Combined performance of biochar sorption and magnetic separation processes for treatment of chromium-contained electroplating wastewater. Bioresour. Technol. 2014, 174, 67–73. [Google Scholar] [CrossRef]
- Wong, K.T.; Yoon, Y.; Jang, M. Enhanced recyclable magnetized palm shell waste-based powdered activated carbon for the removal of ibuprofen: Insights for kinetics and mechanisms. PLoS ONE 2015, 10, e0141013. [Google Scholar] [CrossRef]
- Wan, J.; Deng, H.P.; Shi, J.; Zhou, L.; Su, T. Synthesized magnetic manganese ferrite nanoparticles on activated carbon for sulfamethoxazole removal. Clean-Soil Air Water 2014, 42, 1199–1207. [Google Scholar] [CrossRef]
- Cornell, R.M.; Schwertmann, U. The Iron Oxides Structure, Properties, Reactions, Occurences and Uses, 2nd ed.; WILEY-VCH Verlag GmbH & Co: Weinheim, Germany, 2003; ISBN 3527302743. [Google Scholar]
- Thines, K.R.; Abdullah, E.C.; Mubarak, N.M.; Ruthiraan, M. Synthesis of magnetic biochar from agricultural waste biomass to enhancing route for waste water and polymer application: A review. Renew. Sustain. Energy Rev. 2017, 67, 257–276. [Google Scholar] [CrossRef]
- Ma, X.; Yang, H.; Yu, L.; Chen, Y.; Li, Y. Preparation, Surface and Pore Structure of High Surface Area Activated Carbon Fibers from Bamboo by Steam Activation. Materials 2014, 4431–4441. [Google Scholar] [CrossRef] [PubMed]
- Velo-gala, I.; López-Peñalver, J.J.; Sánchez-Polo, M.; Rivera-Utrilla, J. Surface modifications of activated carbon by gamma irradiation. Carbon 2014, 67, 236–249. [Google Scholar] [CrossRef]
- Rattanachueskul, N.; Saning, A.; Kaowphong, S.; Chumha, N.; Chuenchom, L. Magnetic carbon composites with a hierarchical structure for adsorption of tetracycline, prepared from sugarcane bagasse via hydrothermal carbonization coupled with simple heat treatment process. Bioresour. Technol. 2017, 226, 164–172. [Google Scholar] [CrossRef] [PubMed]
- Yamashita, T.; Hayes, P. Analysis of XPS spectra of Fe2+ and Fe3+ ions in oxide materials. Appl. Surf. Sci. 2008, 254, 2441–2449. [Google Scholar] [CrossRef]
- Kakavandi, B.; Esrafili, A.; Mohseni-Bandpi, A.; Jafari, A.J.; Kalantary, R.R. Magnetic Fe3O4@C nanoparticles as adsorbents for removal of amoxicillin from aqueous solution. Water Sci. Technol. 2014, 69, 147–155. [Google Scholar] [CrossRef]
- Singh, K.P.; Singh, A.K.; Singh, U.V.; Verma, P. Optimizing removal of ibuprofen from water by magnetic nanocomposite using Box-Behnken design. Environ. Sci. Pollut. Res. 2012, 19, 724–738. [Google Scholar] [CrossRef]
- Shan, D.; Deng, S.; Zhao, T.; Wang, B.; Wang, Y.; Huang, J.; Yu, G.; Winglee, J.; Wiesner, M.R. Preparation of ultrafine magnetic biochar and activated carbon for pharmaceutical adsorption and subsequent degradation by ball milling. J. Hazard. Mater. 2016, 305, 156–163. [Google Scholar] [CrossRef] [Green Version]


| Factors | ||||||||
|---|---|---|---|---|---|---|---|---|
| Fe3+:Fe2+ (χ1) | PAC:Fe (χ2) | Temperature (χ3) | pH (χ4) | |||||
| MAC | Molar Ratio | Level | Mass Ratio | Level | °C | Level | pH | Level |
| 1 | 1:4 | 1 | 1:3 | −1 | 60 | 0 | 9.5 | −1 |
| 2 | 1:4 | 0 | 60 | 0 | ||||
| 3 | 1:6 | 1 | 80 | 1 | ||||
| 4 | 1:3 | 0 | 1:3 | −1 | 80 | 1 | 9.5 | −1 |
| 5 | 1:4 | 0 | 60 | 0 | ||||
| 6 | 1:6 | 1 | 40 | −1 | ||||
| 7 | 2:1 | −1 | 1:3 | −1 | 80 | 1 | 9.5 | −1 |
| 8 | 1:4 | 0 | 40 | −1 | ||||
| 9 | 1:6 | 1 | 40 | −1 | ||||
| 10 | 1:4 | 1 | 1:3 | −1 | 40 | −1 | 13.5 | 1 |
| 11 | 1:4 | 0 | 40 | −1 | ||||
| 12 | 1:6 | 1 | 80 | 1 | ||||
| 13 | 1:3 | 0 | 1:3 | −1 | 40 | −1 | 13.5 | 1 |
| 14 | 1:4 | 0 | 80 | 1 | ||||
| 15 | 1:6 | 1 | 60 | 0 | ||||
| 16 | 2:1 | −1 | 1:3 | −1 | 60 | 0 | 13.5 | 1 |
| 17 | 1:4 | 0 | 80 | 1 | ||||
| 18 | 1:6 | 1 | 60 | 0 | ||||
| Fe | Si | Ca | S | K | Ti | Cl | P | Minor Elements 1 | |
|---|---|---|---|---|---|---|---|---|---|
| (%) | (%) | (%) | (%) | (%) | (%) | (%) | (%) | (%) | |
| PAC | 16.2 | 19.1 | 17.8 | 21.5 | 10.8 | 7.0 | 4.0 | 1.4 | 2.2 |
| MAC4 | 95.8 | 0.98 | 0.87 | 0.75 | 0.53 | 0.27 | 0.06 | 0.20 | 0.54 |
| MAC7 | 95.0 | 0.91 | 0.86 | 0.58 | 1.24 | 0.30 | 0.12 | 0.19 | 0.80 |
| MAC11 | 96.3 | 0.80 | 0.88 | 0.42 | 0.76 | 0.24 | 0.02 | 0.19 | 0.39 |
| MAC17 | 95.2 | 0.61 | 1.00 | 0.32 | 1.54 | 0.24 | 0.06 | 0.18 | 0.85 |
| PAC | MAC 4 | MAC 7 | MAC 11 | MAC 17 | |||||||
|---|---|---|---|---|---|---|---|---|---|---|---|
| Peak | Possible Bond Assignment | Bind. Energy | Abundance | Bind. Energy | Abundance | Bind. Energy | Abundance | Bind. Energy | Abundance | Bind. Energy | Abundance |
| Binding | (eV) | (%) | (eV) | (%) | (eV) | (%) | (eV) | (%) | (eV) | (%) | |
| Graphitic C | 284.4 | 40.5 | 284.4 | 40.4 | 284.2 | 26.4 | 284.3 | 36.0 | 284.3 | 38.8 | |
| C–C sp3; C–H | 284.6 | 21.2 | 284.5 | 22.9 | 284.5 | 36.6 | 284.6 | 23.1 | 284.6 | 21.0 | |
| C1s | C–O | 285.5 | 20.3 | 285.6 | 15.0 | 285.2 | 18.2 | 285.5 | 18.5 | 285.2 | 26.2 |
| C=O | 287.3 | 9.0 | 286.8 | 9.3 | 286.4 | 11.2 | 287.1 | 10.0 | 286.5 | 7.8 | |
| O–C=O | 289.8 | 9.0 | 289.6 | 12.3 | 289.0 | 7.5 | 289.9 | 12.4 | 288.9 | 6.2 | |
| Total carbon percentage | 74.9 | 62.6 | 57.2 | 60.8 | 58.8 | ||||||
| Fe–O | --- | --- | 530.3 | 36.3 | 530.2 | 43.3 | 530.1 | 36.4 | 530.1 | 44.2 | |
| C=O | 531.1 | 21.4 | 531.4 | 32.5 | 531.2 | 24.2 | 531.0 | 24.8 | 530.9 | 22.3 | |
| O1s | O–H and C=O | 532.8 | 52.2 | 532.4 | 17.6 | 532.1 | 14.5 | 531.8 | 20.1 | 531.7 | 13.9 |
| –C–O–C– | 533.7 | 24.7 | 533.4 | 13.6 | 532.8 | 18.0 | 532.7 | 18.7 | 532.6 | 19.6 | |
| Physiosorbed water | 535.8 | 1.8 | --- | --- | --- | --- | --- | --- | --- | --- | |
| Total oxygen percentage | 17.8 | 24.4 | 28.1 | 25.5 | 26.5 | ||||||
| Fe2p3/2, Fe–O, Fe2+ | --- | --- | 711.1 | 20.7 | 710.8 | 21.2 | 710.9 | 21.0 | 710.7 | 19.9 | |
| Fe2p3/2, Fe–O, Fe3+ | --- | --- | 713.0 | 17.8 | 712.6 | 16.3 | 712.6 | 14.8 | 712.4 | 16.2 | |
| Fe2p3/2, Fe2+ satellite | --- | --- | 715.2 | 12.8 | 714.9 | 12.1 | 714.7 | 12.4 | 714.5 | 12.1 | |
| Fe2p | Fe2p3/2, Fe3+ satellite | --- | --- | 720.2 | 15.8 | 719.6 | 15.3 | 719.6 | 16.3 | 719.5 | 16.7 |
| Fe2p1/2, Fe–O, Fe2+ | --- | --- | 724.3 | 10.4 | 724.1 | 11.9 | 724.0 | 10.8 | 724.1 | 11.3 | |
| Fe2p1/2, Fe–O, Fe3+ | --- | --- | 726.2 | 8.9 | 725.9 | 8.7 | 725.7 | 8.4 | 725.6 | 8.3 | |
| Fe2p1/2, Fe2+ satellite | --- | --- | 728.4 | 6.4 | 728.0 | 7.3 | 727.6 | 8.4 | 727.6 | 8.0 | |
| Fe2p1/2, Fe3+ satellite | --- | --- | 733.4 | 7.2 | 733.1 | 7.1 | 732.7 | 7.9 | 732.7 | 7.6 | |
| Total iron percentage | 0.0 | 6.6 | 8.7 | 8.4 | 9.5 | ||||||
| Si2p | SiO2 | 103.8 | 6.3 | 102.2 | 5.0 | 102.1 | 5.3 | 101.8 | 4.8 | 101.7 | 4.7 |
| N1s | Pyridinic N (N-6) | 397.6 | 0.3 | 399.9 | 0.8 | 400.1 | 0.2 | 400.0 | 0.5 | 400.1 | 0.4 |
| Carbon Precursor | MAC Synthesis | SBET (m2 g−1) | Ms (emu g−1) | References |
|---|---|---|---|---|
| Paper mill sludge/KOH activation and pyrolysis | Co-precipitation | 741–795 | 21.6–24.9 | Present study |
| Commercial powder AC followed by HNO3 treatment | Co-precipitation | 1241 | 5.1 | [25] |
| Polyethylene terephthalate containers/pyrolysis and calcination with CO2 | Co-precipitation | 289 | 35.4 | [19] |
| Commercial powder AC followed by treatment with basic steam | Co-precipitation | 556 | 5.2 | [30] |
| Sugarcane bagasse/NaOH activation | Co-precipitation | 43 | 9.7 | [47] |
| Coconut shell/H2SO4 activation and pyrolysis | Co-precipitation | 335 | 15.8 | [50] |
| Commercial PAC | Oxidative hydrolysis of FeII2+ in alkaline media | 666–556 | 2.3–9.8 | [41] |
| Commercial AC | Oxidative hydrolysis of Fe2+ in alkaline media | 535–652 | 2.0–14.8 | [42] |
| Commercial PAC followed by HNO3 treatment | Thermochemical methods | 671 | 6.9 | [49] |
| Commercial granular AC | Ball milling | 486 | 20.8 | [51] |
Publisher’s Note: MDPI stays neutral with regard to jurisdictional claims in published maps and institutional affiliations. |
© 2021 by the authors. Licensee MDPI, Basel, Switzerland. This article is an open access article distributed under the terms and conditions of the Creative Commons Attribution (CC BY) license (http://creativecommons.org/licenses/by/4.0/).
Share and Cite
Rocha, L.S.; Sousa, É.M.L.; Gil, M.V.; Oliveira, J.A.B.P.; Otero, M.; Esteves, V.I.; Calisto, V. Producing Magnetic Nanocomposites from Paper Sludge for the Adsorptive Removal of Pharmaceuticals from Water—A Fractional Factorial Design. Nanomaterials 2021, 11, 287. https://doi.org/10.3390/nano11020287
Rocha LS, Sousa ÉML, Gil MV, Oliveira JABP, Otero M, Esteves VI, Calisto V. Producing Magnetic Nanocomposites from Paper Sludge for the Adsorptive Removal of Pharmaceuticals from Water—A Fractional Factorial Design. Nanomaterials. 2021; 11(2):287. https://doi.org/10.3390/nano11020287
Chicago/Turabian StyleRocha, Luciana S., Érika M. L. Sousa, María V. Gil, João A. B. P. Oliveira, Marta Otero, Valdemar I. Esteves, and Vânia Calisto. 2021. "Producing Magnetic Nanocomposites from Paper Sludge for the Adsorptive Removal of Pharmaceuticals from Water—A Fractional Factorial Design" Nanomaterials 11, no. 2: 287. https://doi.org/10.3390/nano11020287