
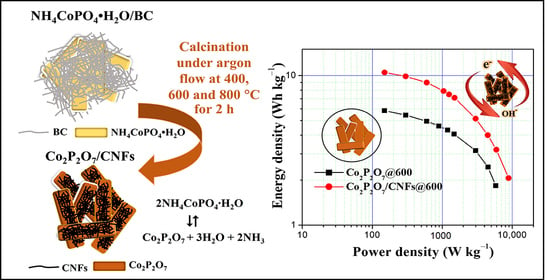
Co2P2O7 Microplate/Bacterial Cellulose–Derived Carbon Nanofiber Composites with Enhanced Electrochemical Performance


Abstract
:
1. Introduction
2. Materials and Methods
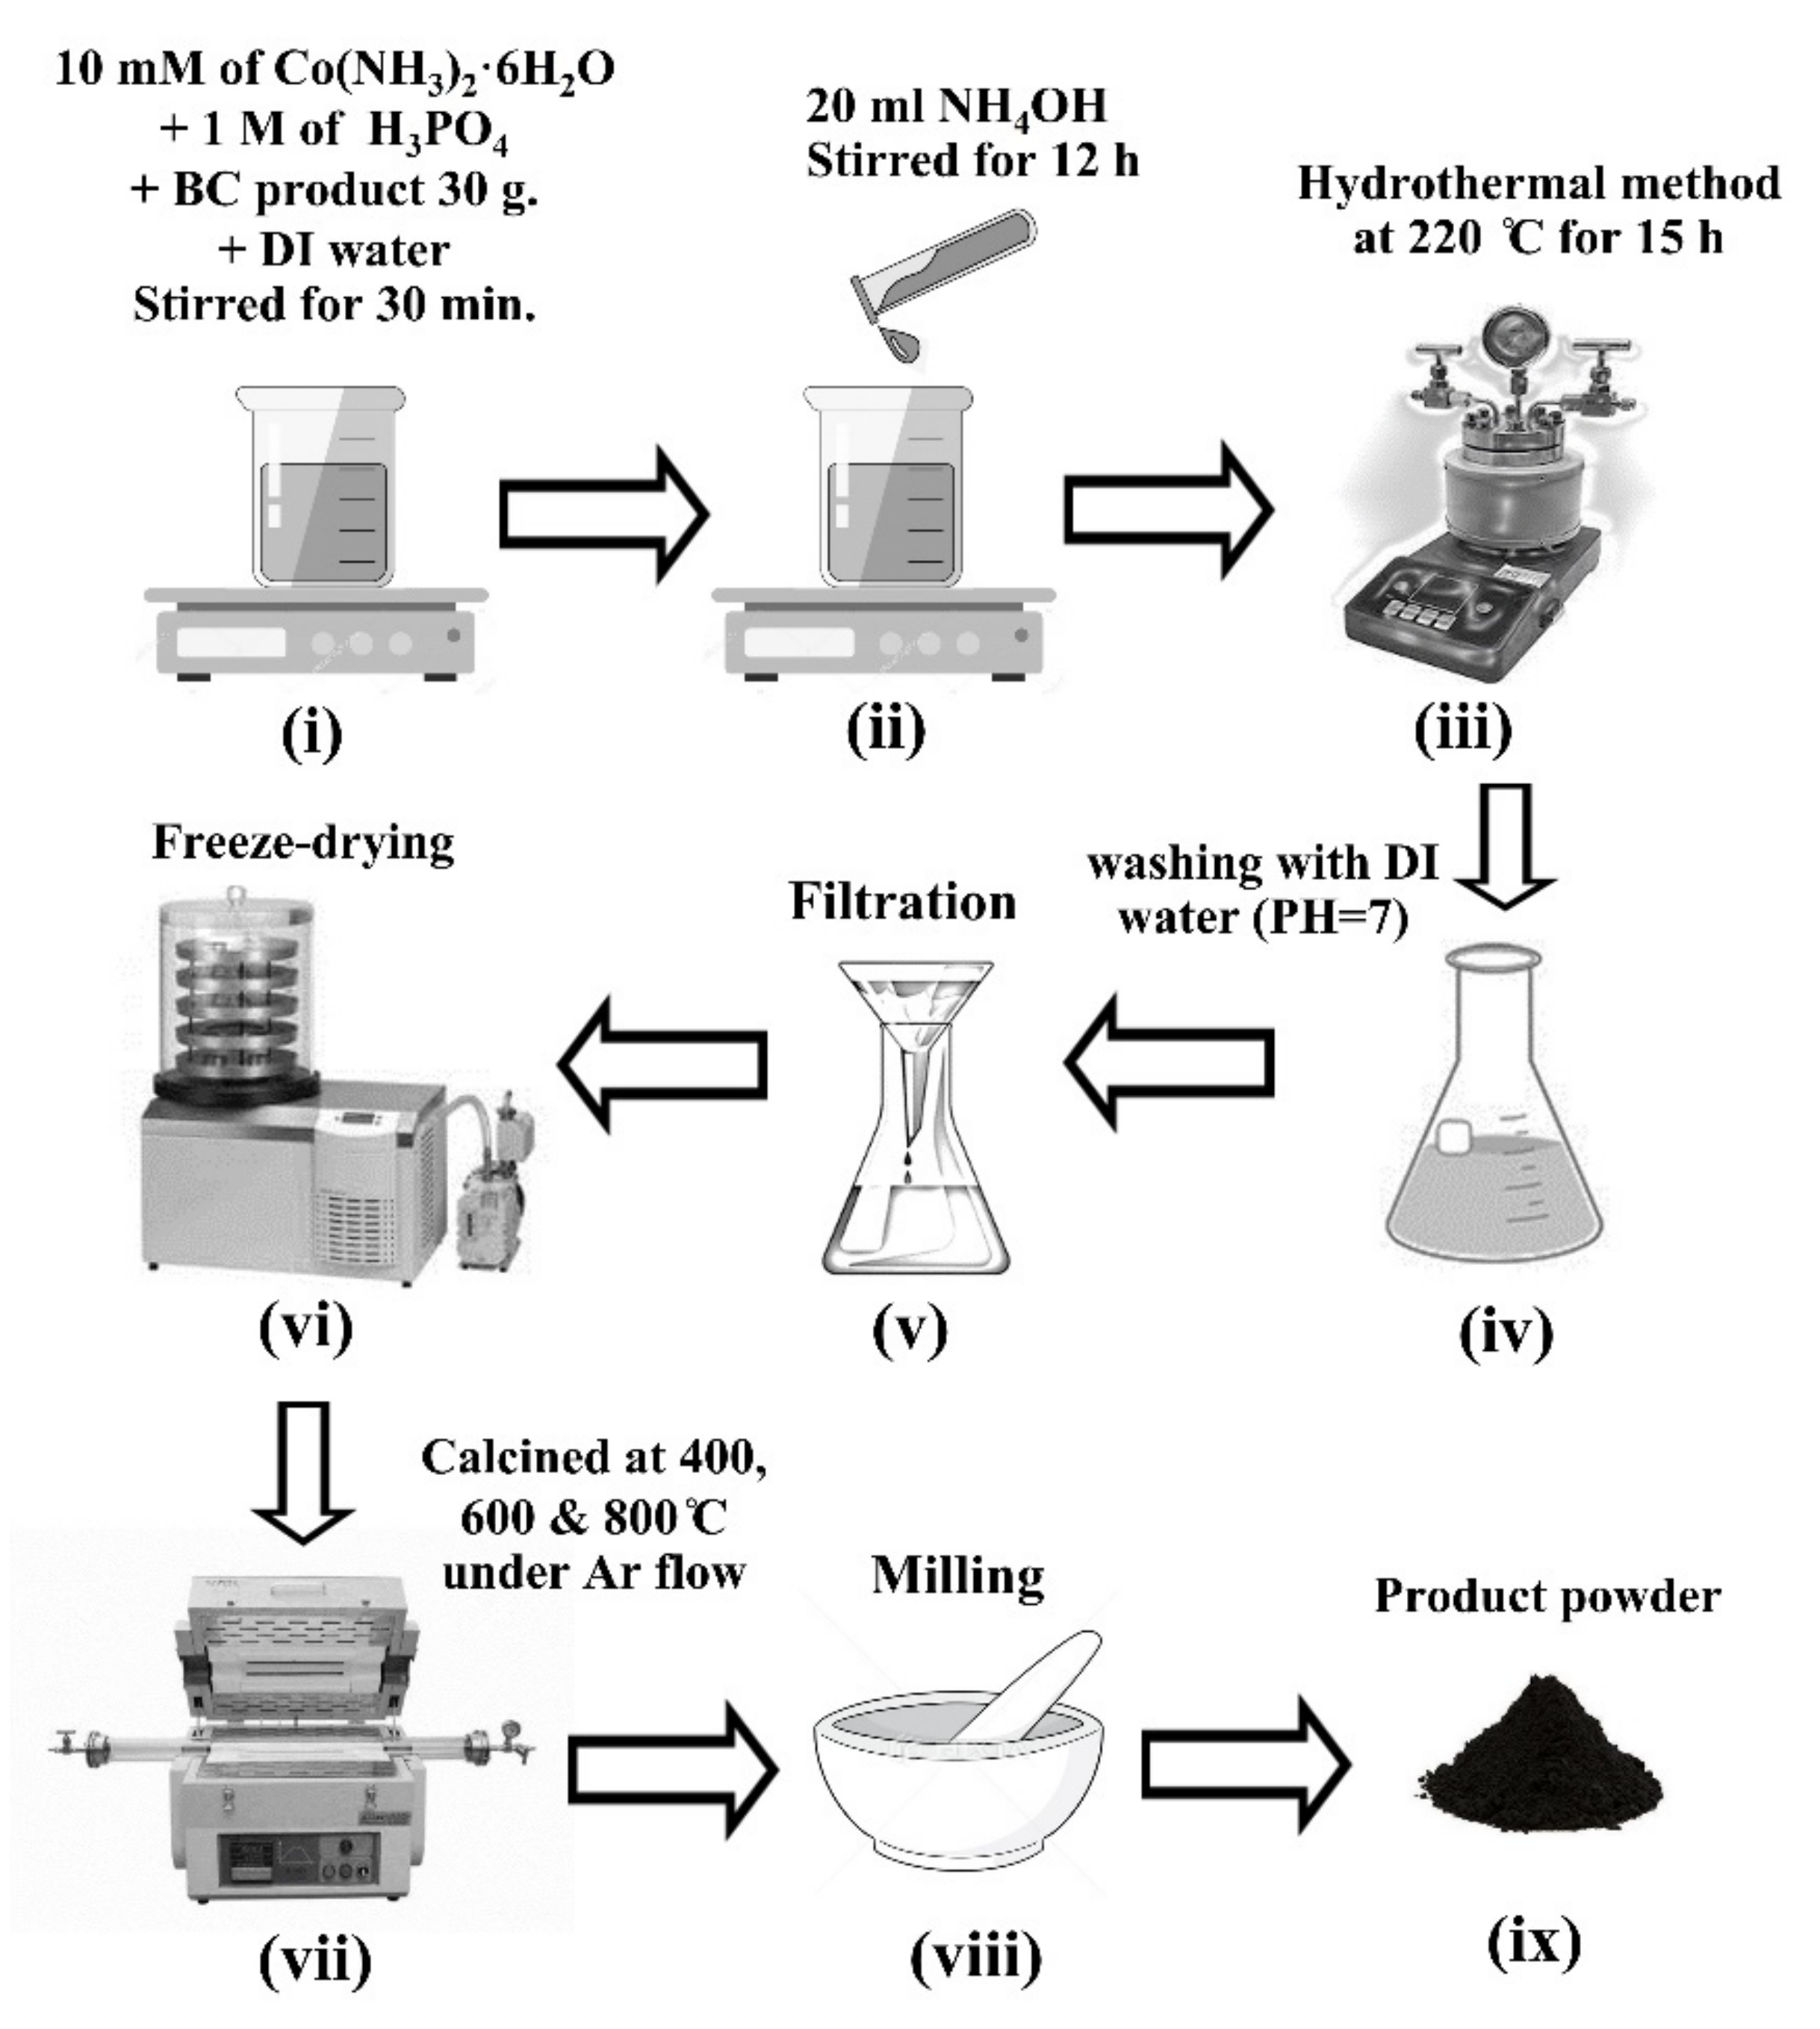
2.1. Biosynthesis of Bacterial Cellulose (BC)
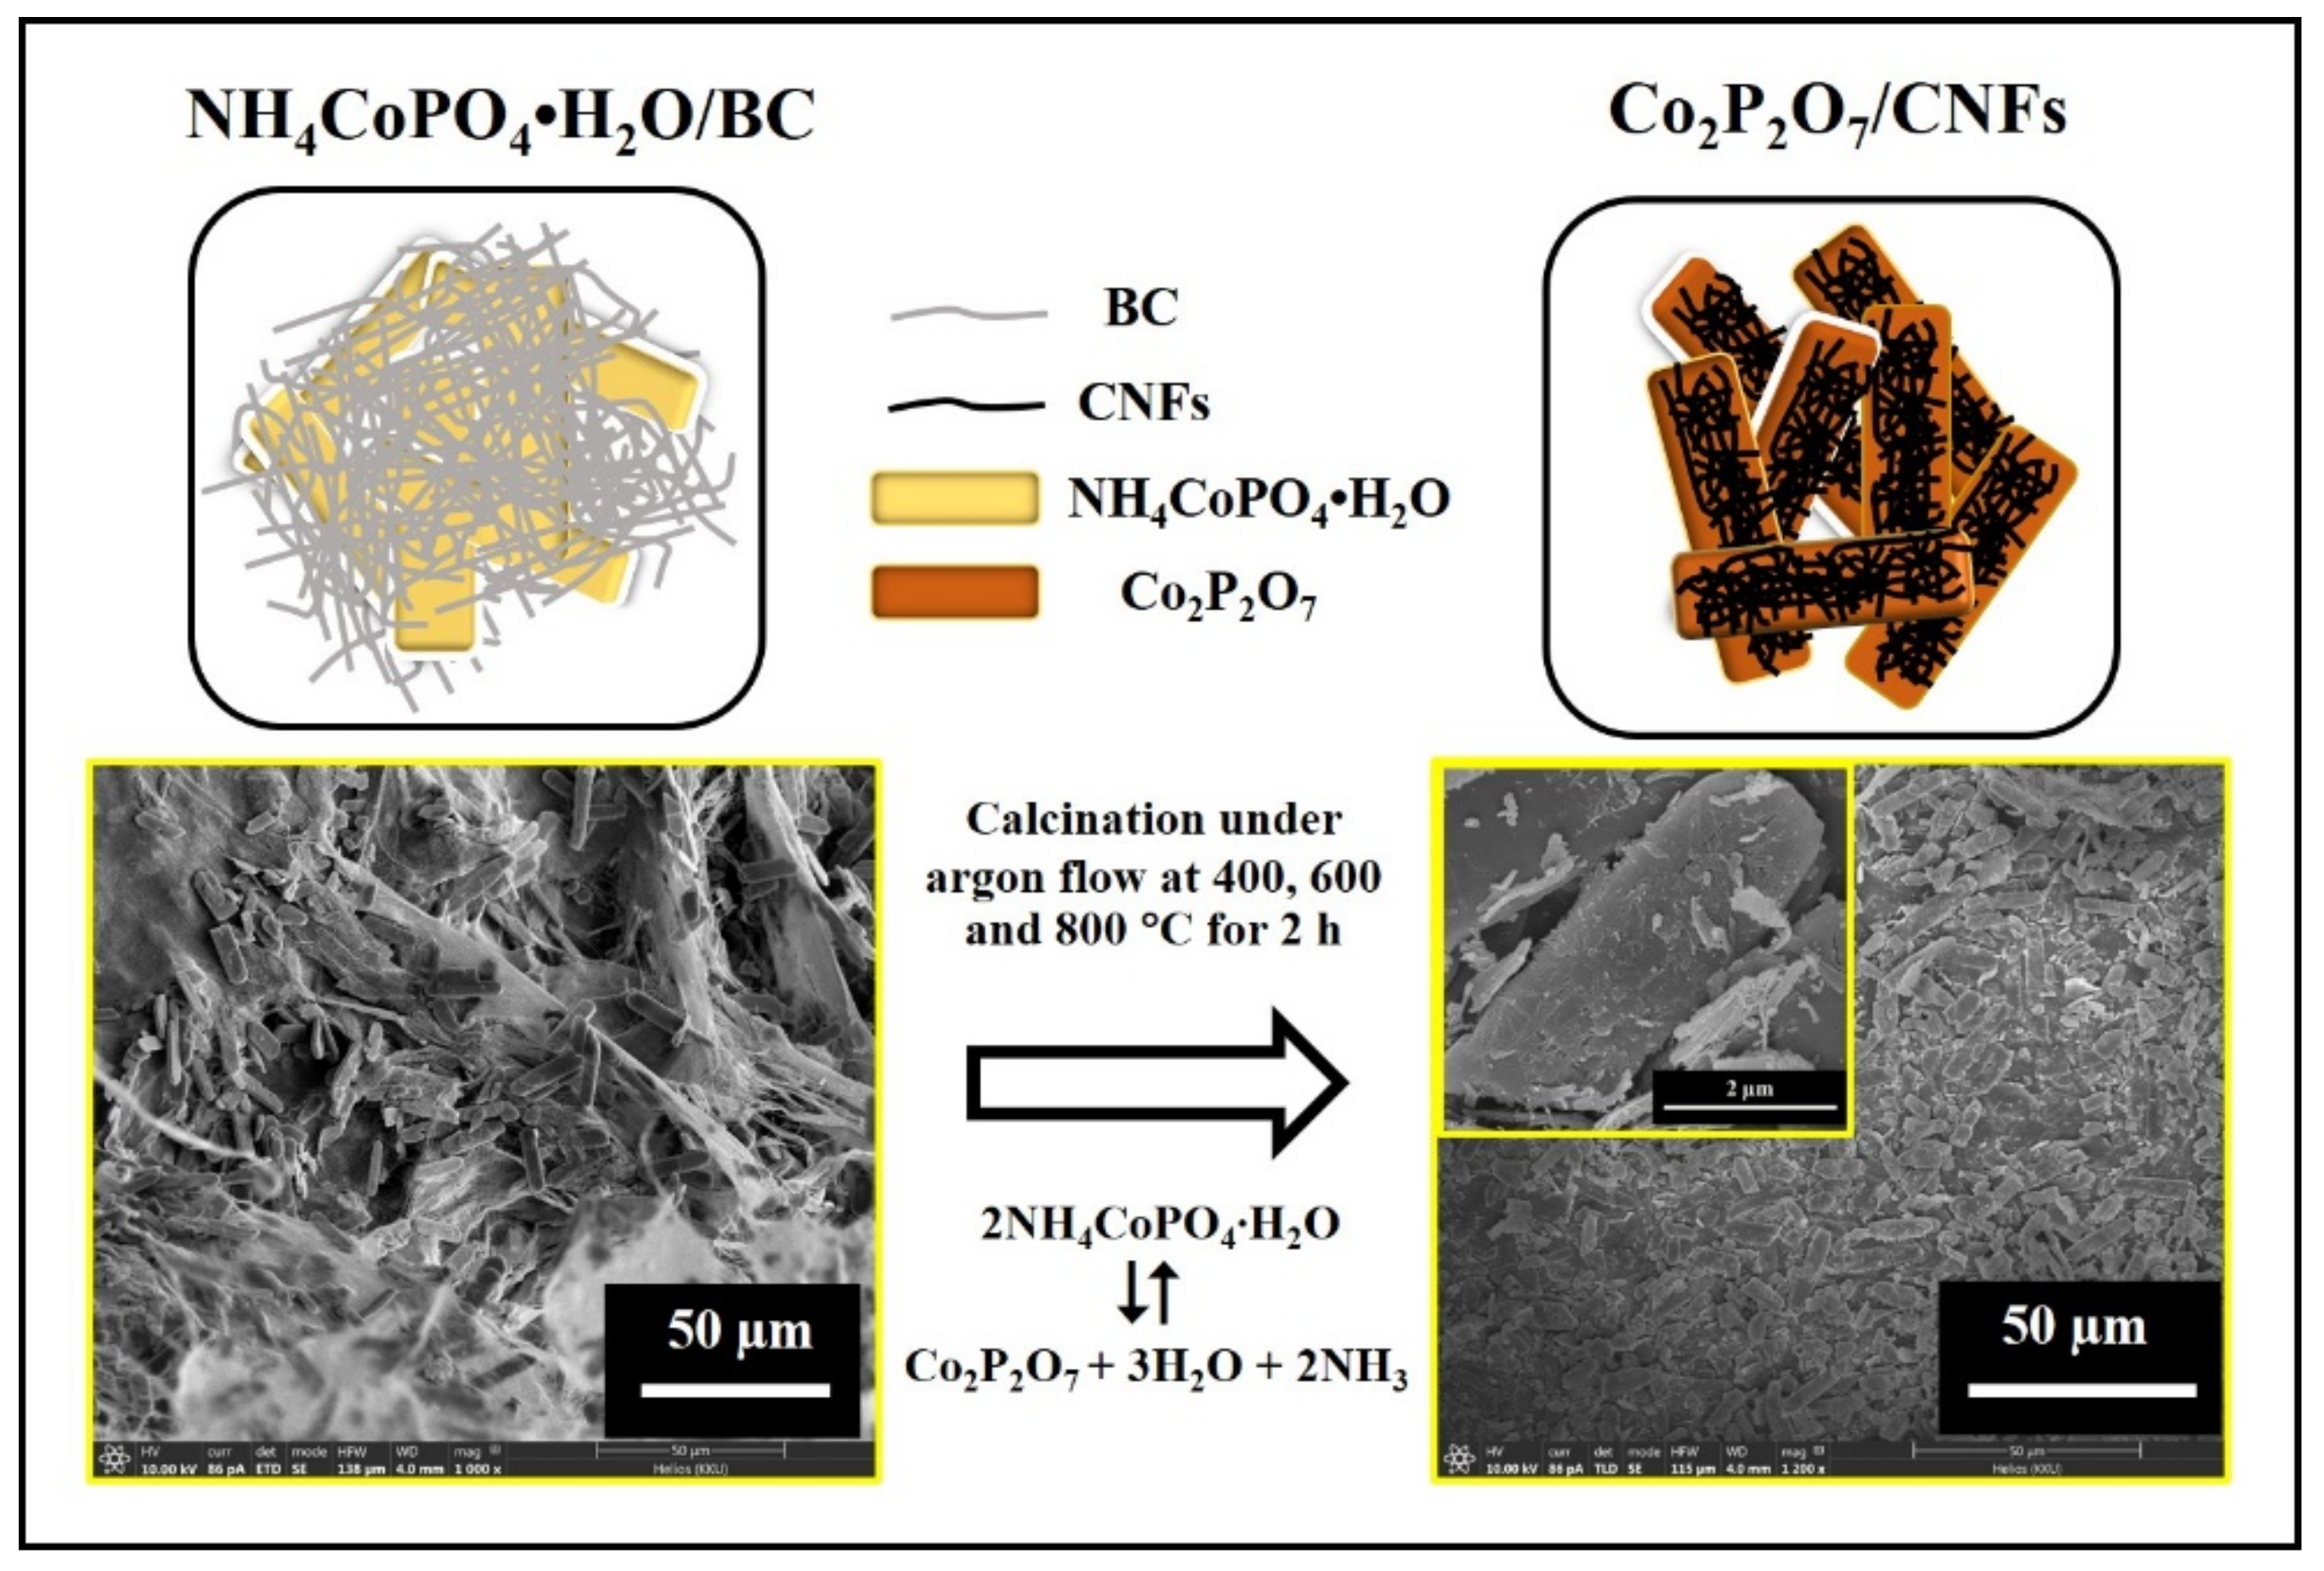
2.2. Preparation of Co2P2O7/CNFs Composites
2.3. Characterizations
2.4. Electrochemical Measurements
3. Results and Discussion
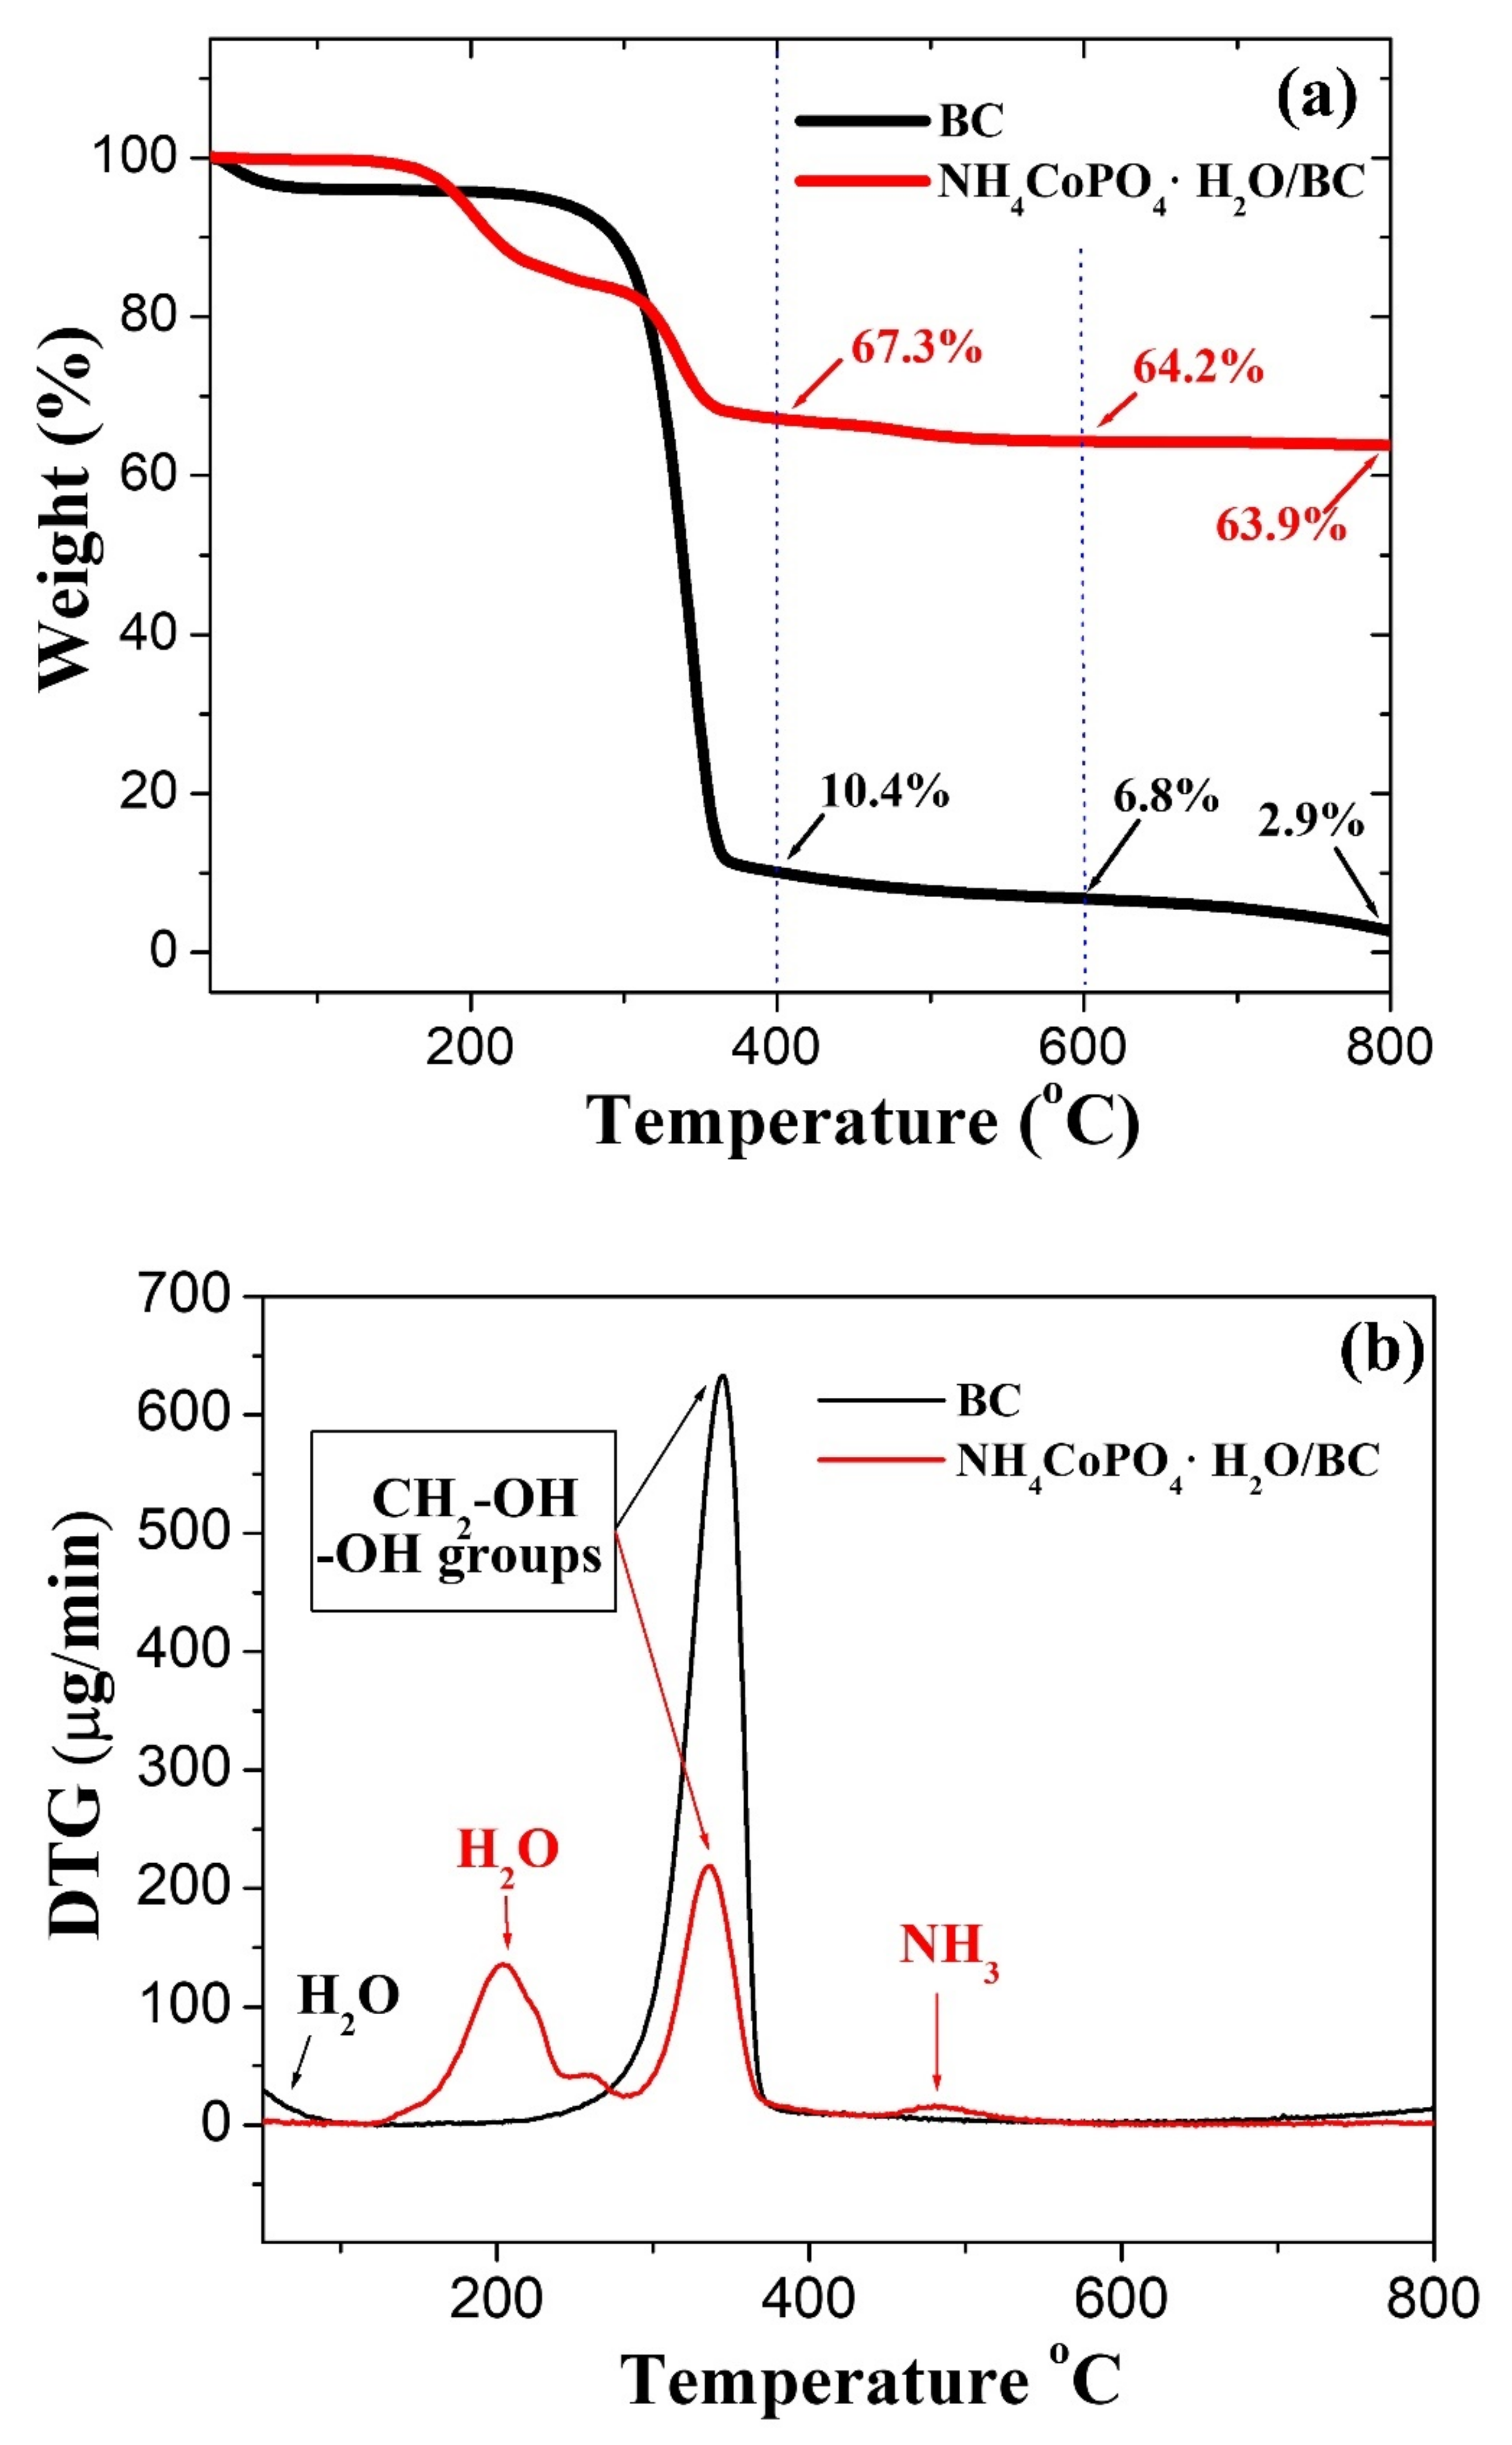
3.1. TGA–DTG
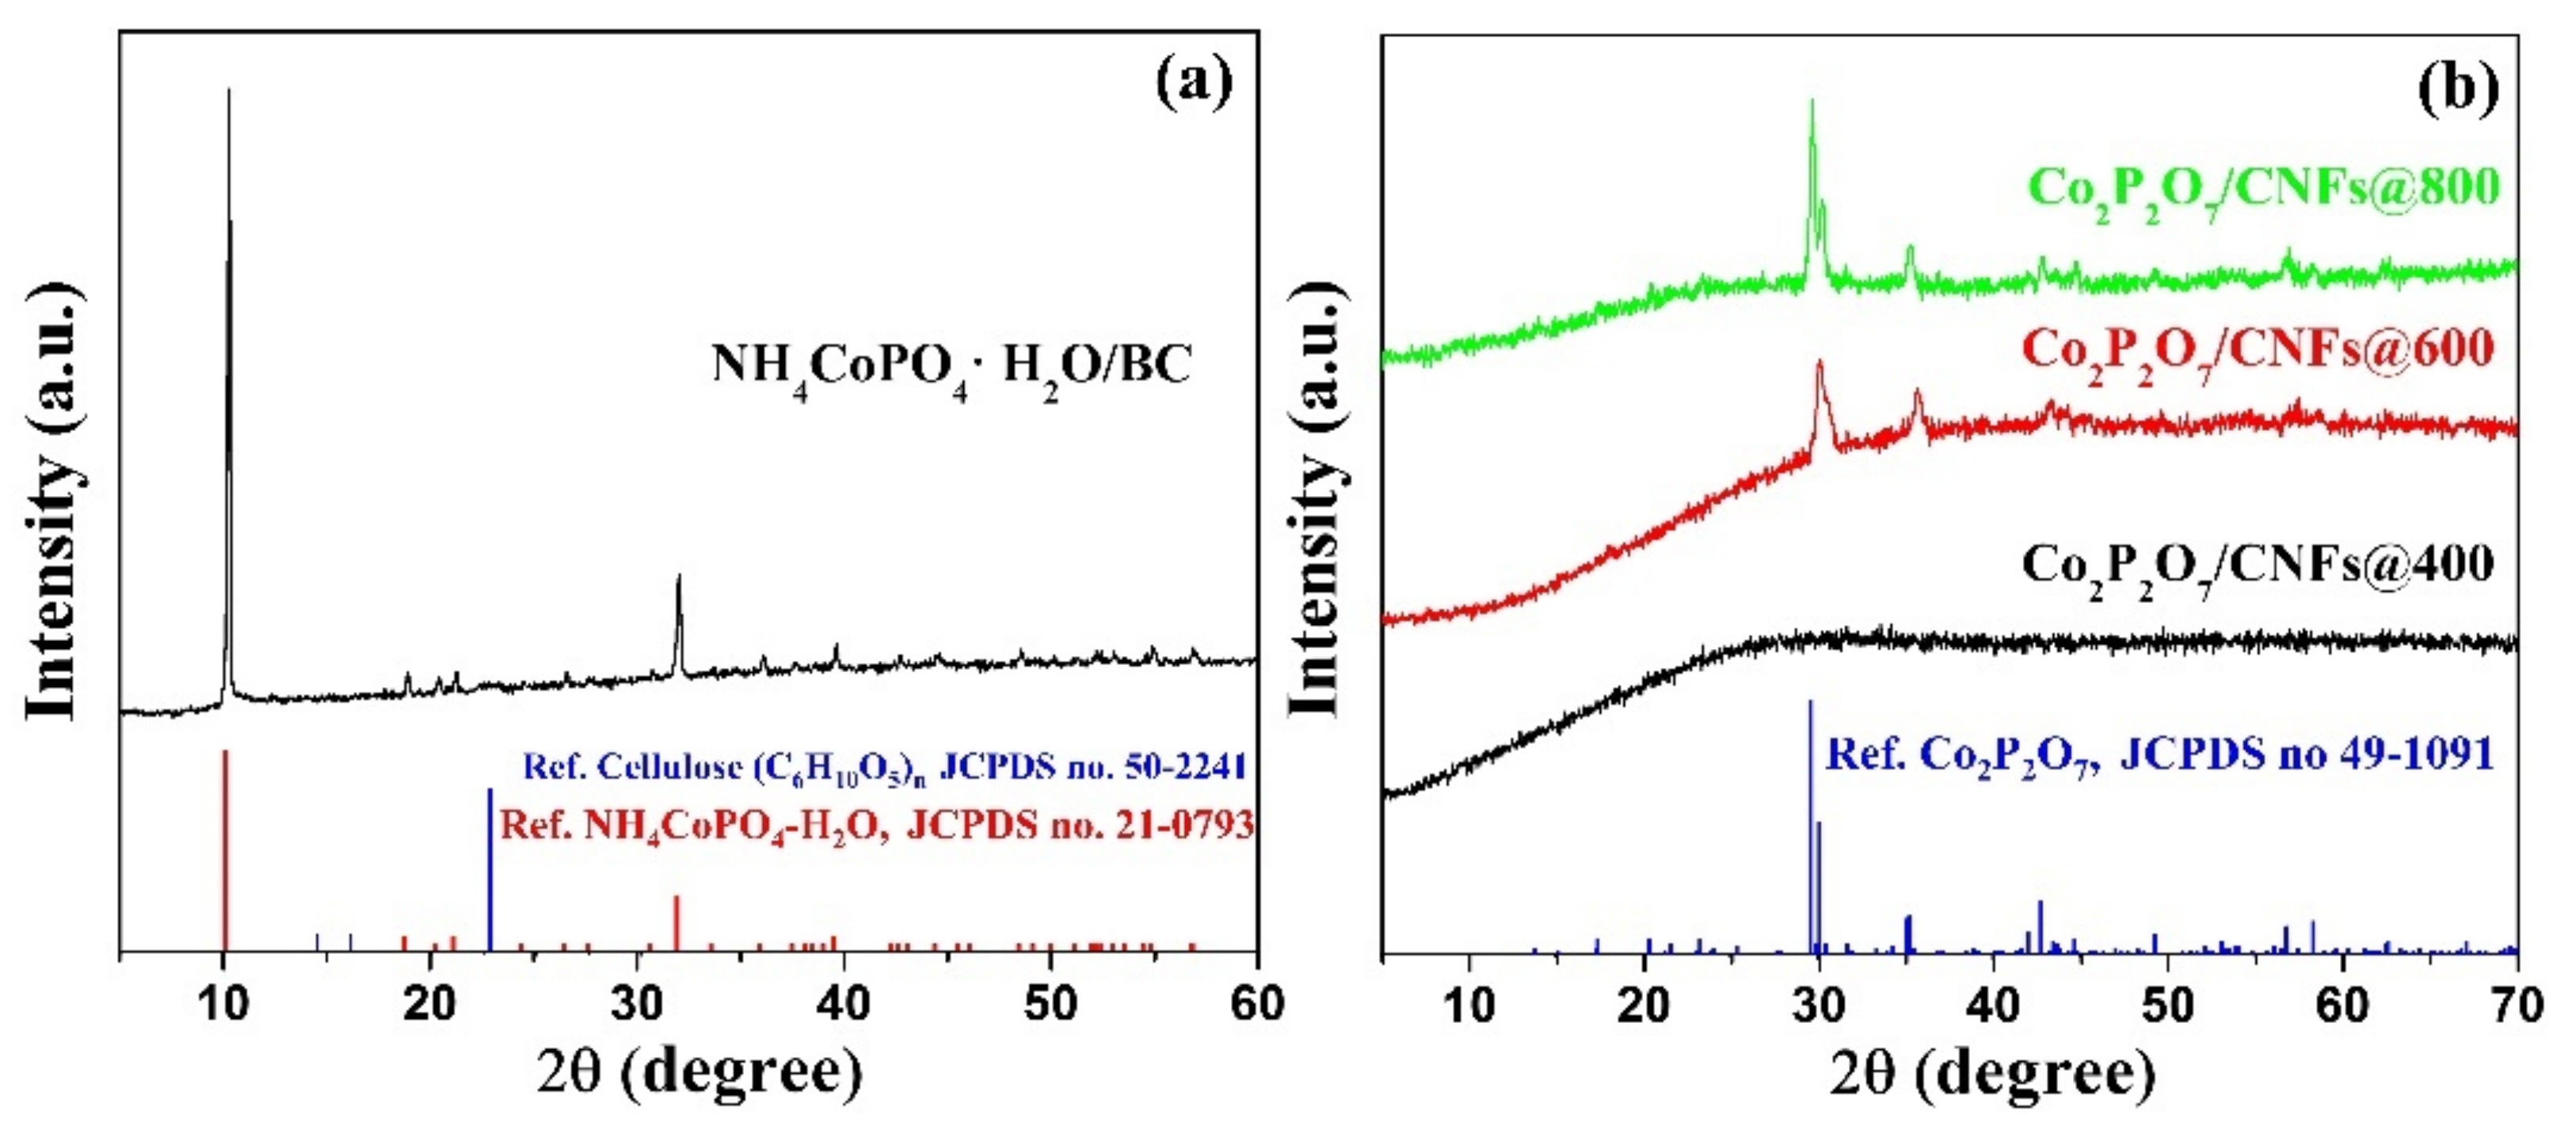
3.2. XRD
3.3. FE–SEM
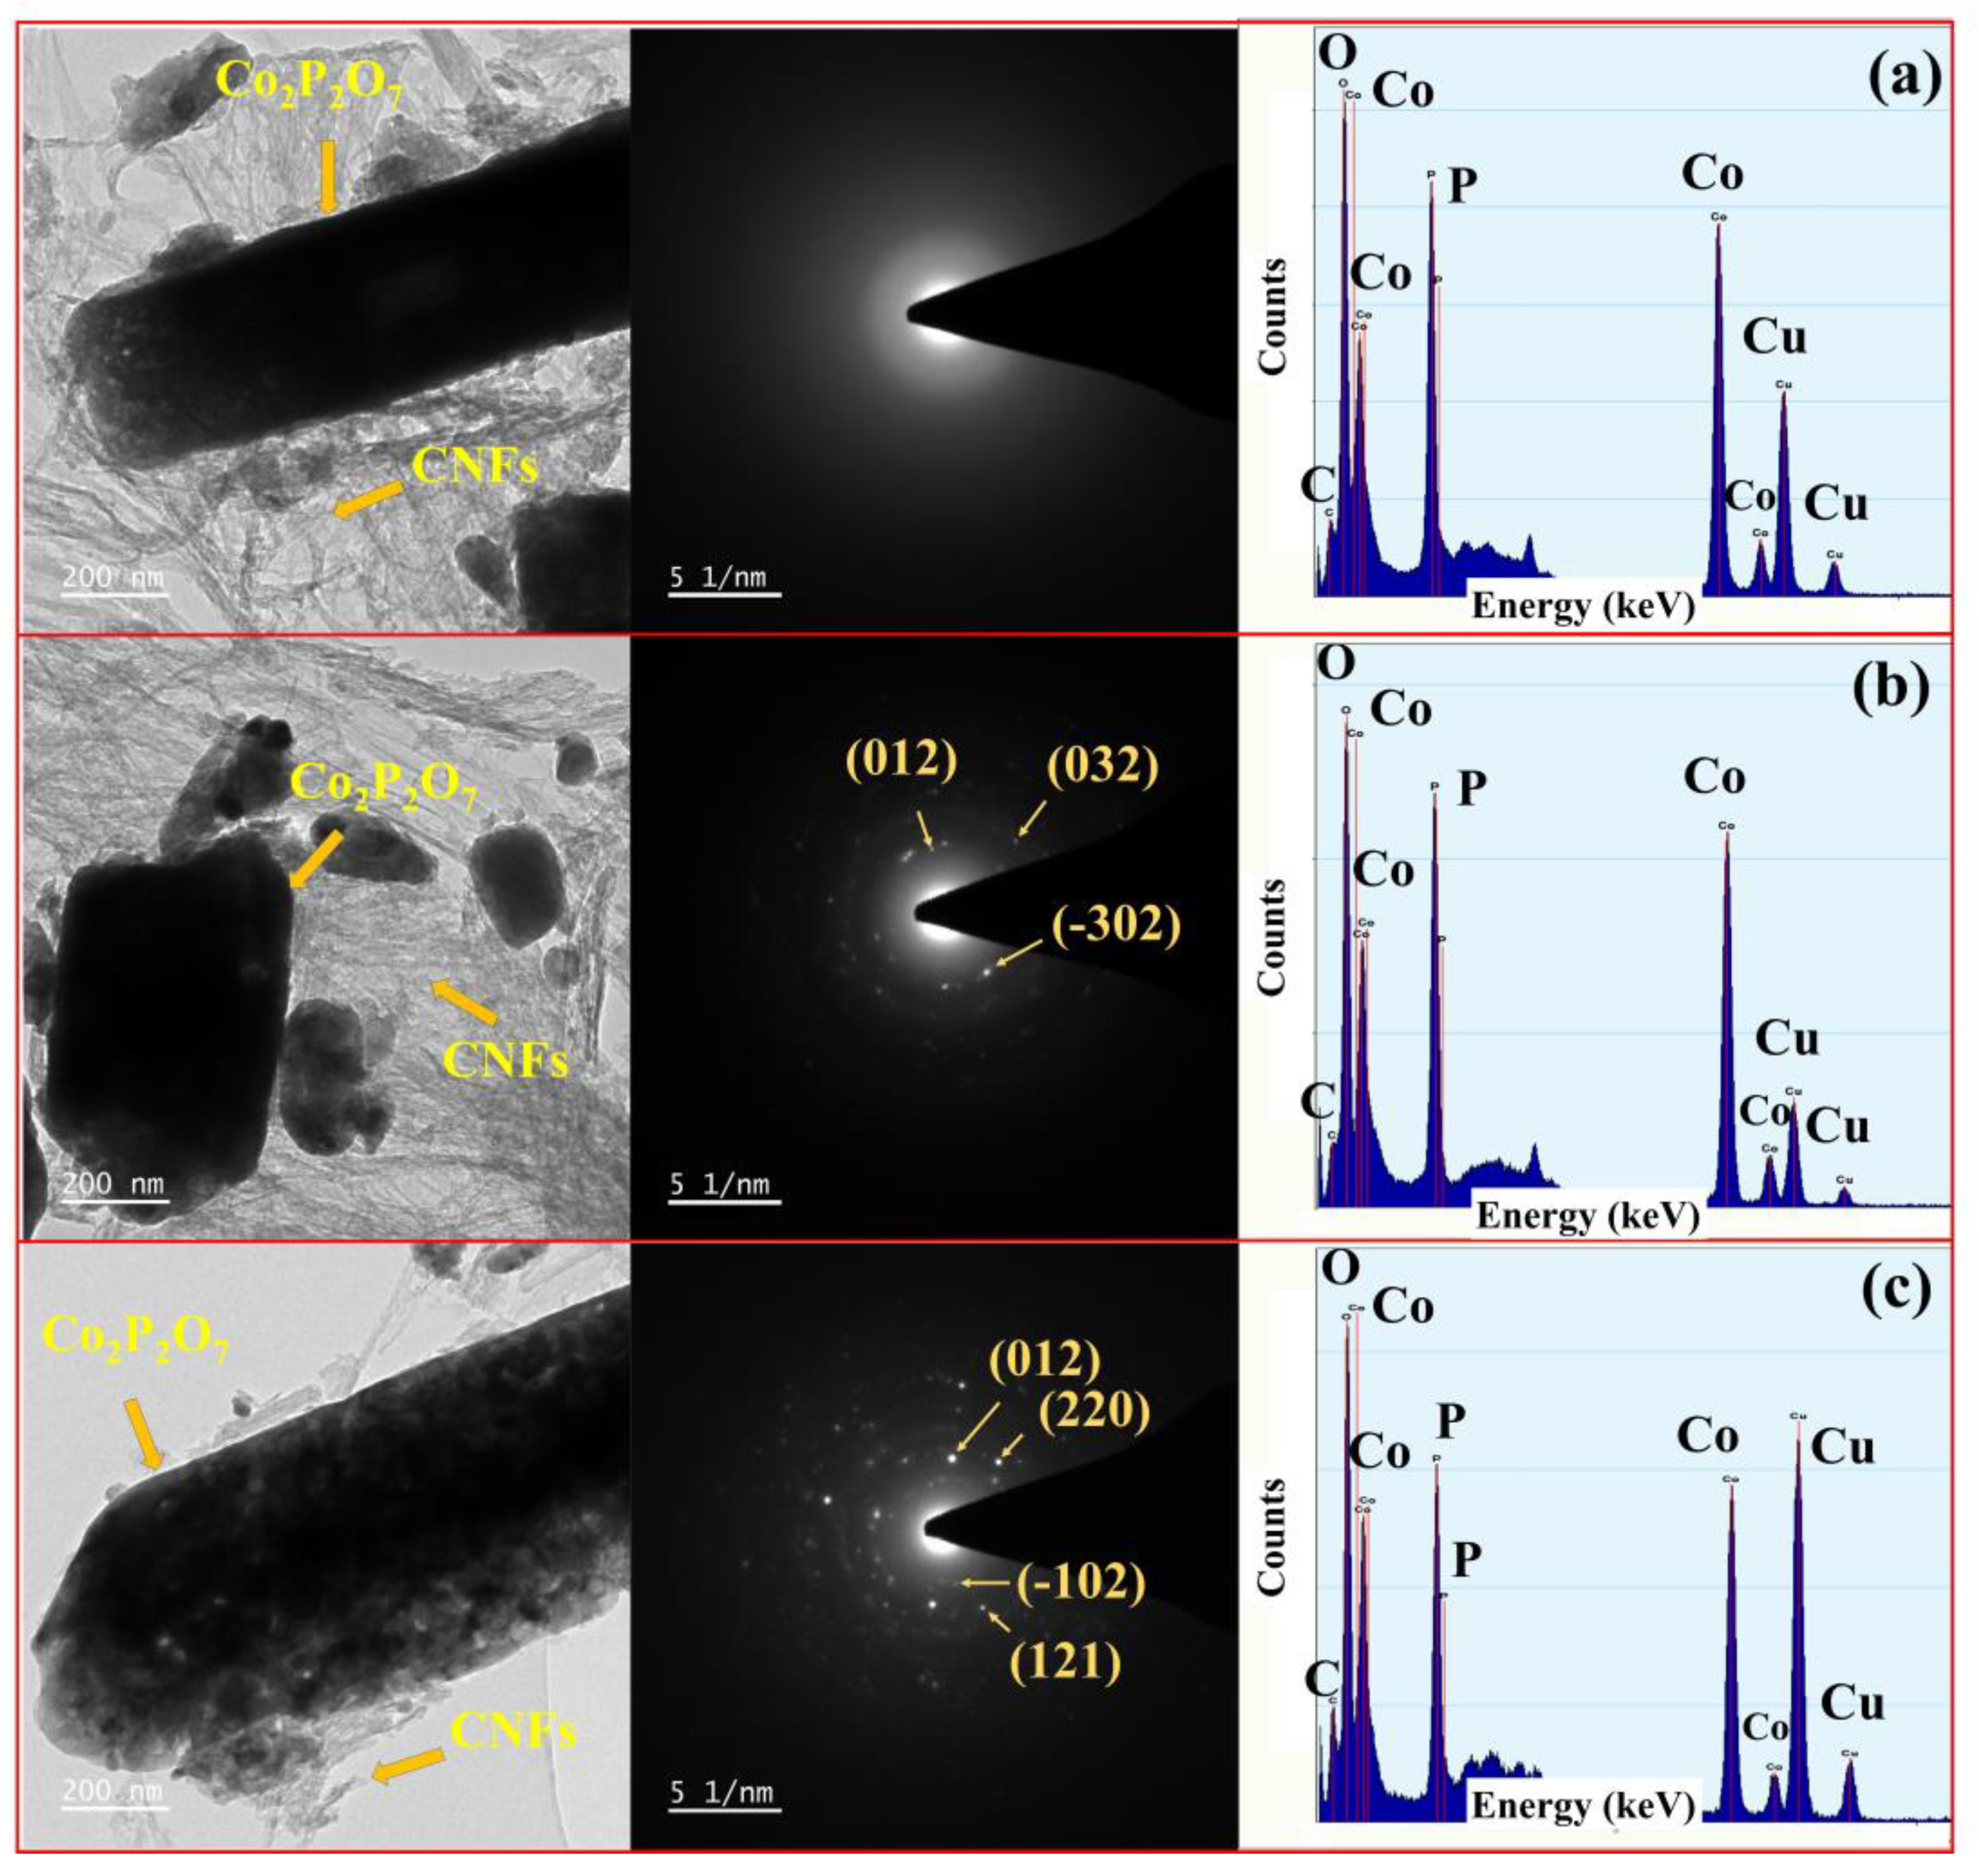
3.4. TEM
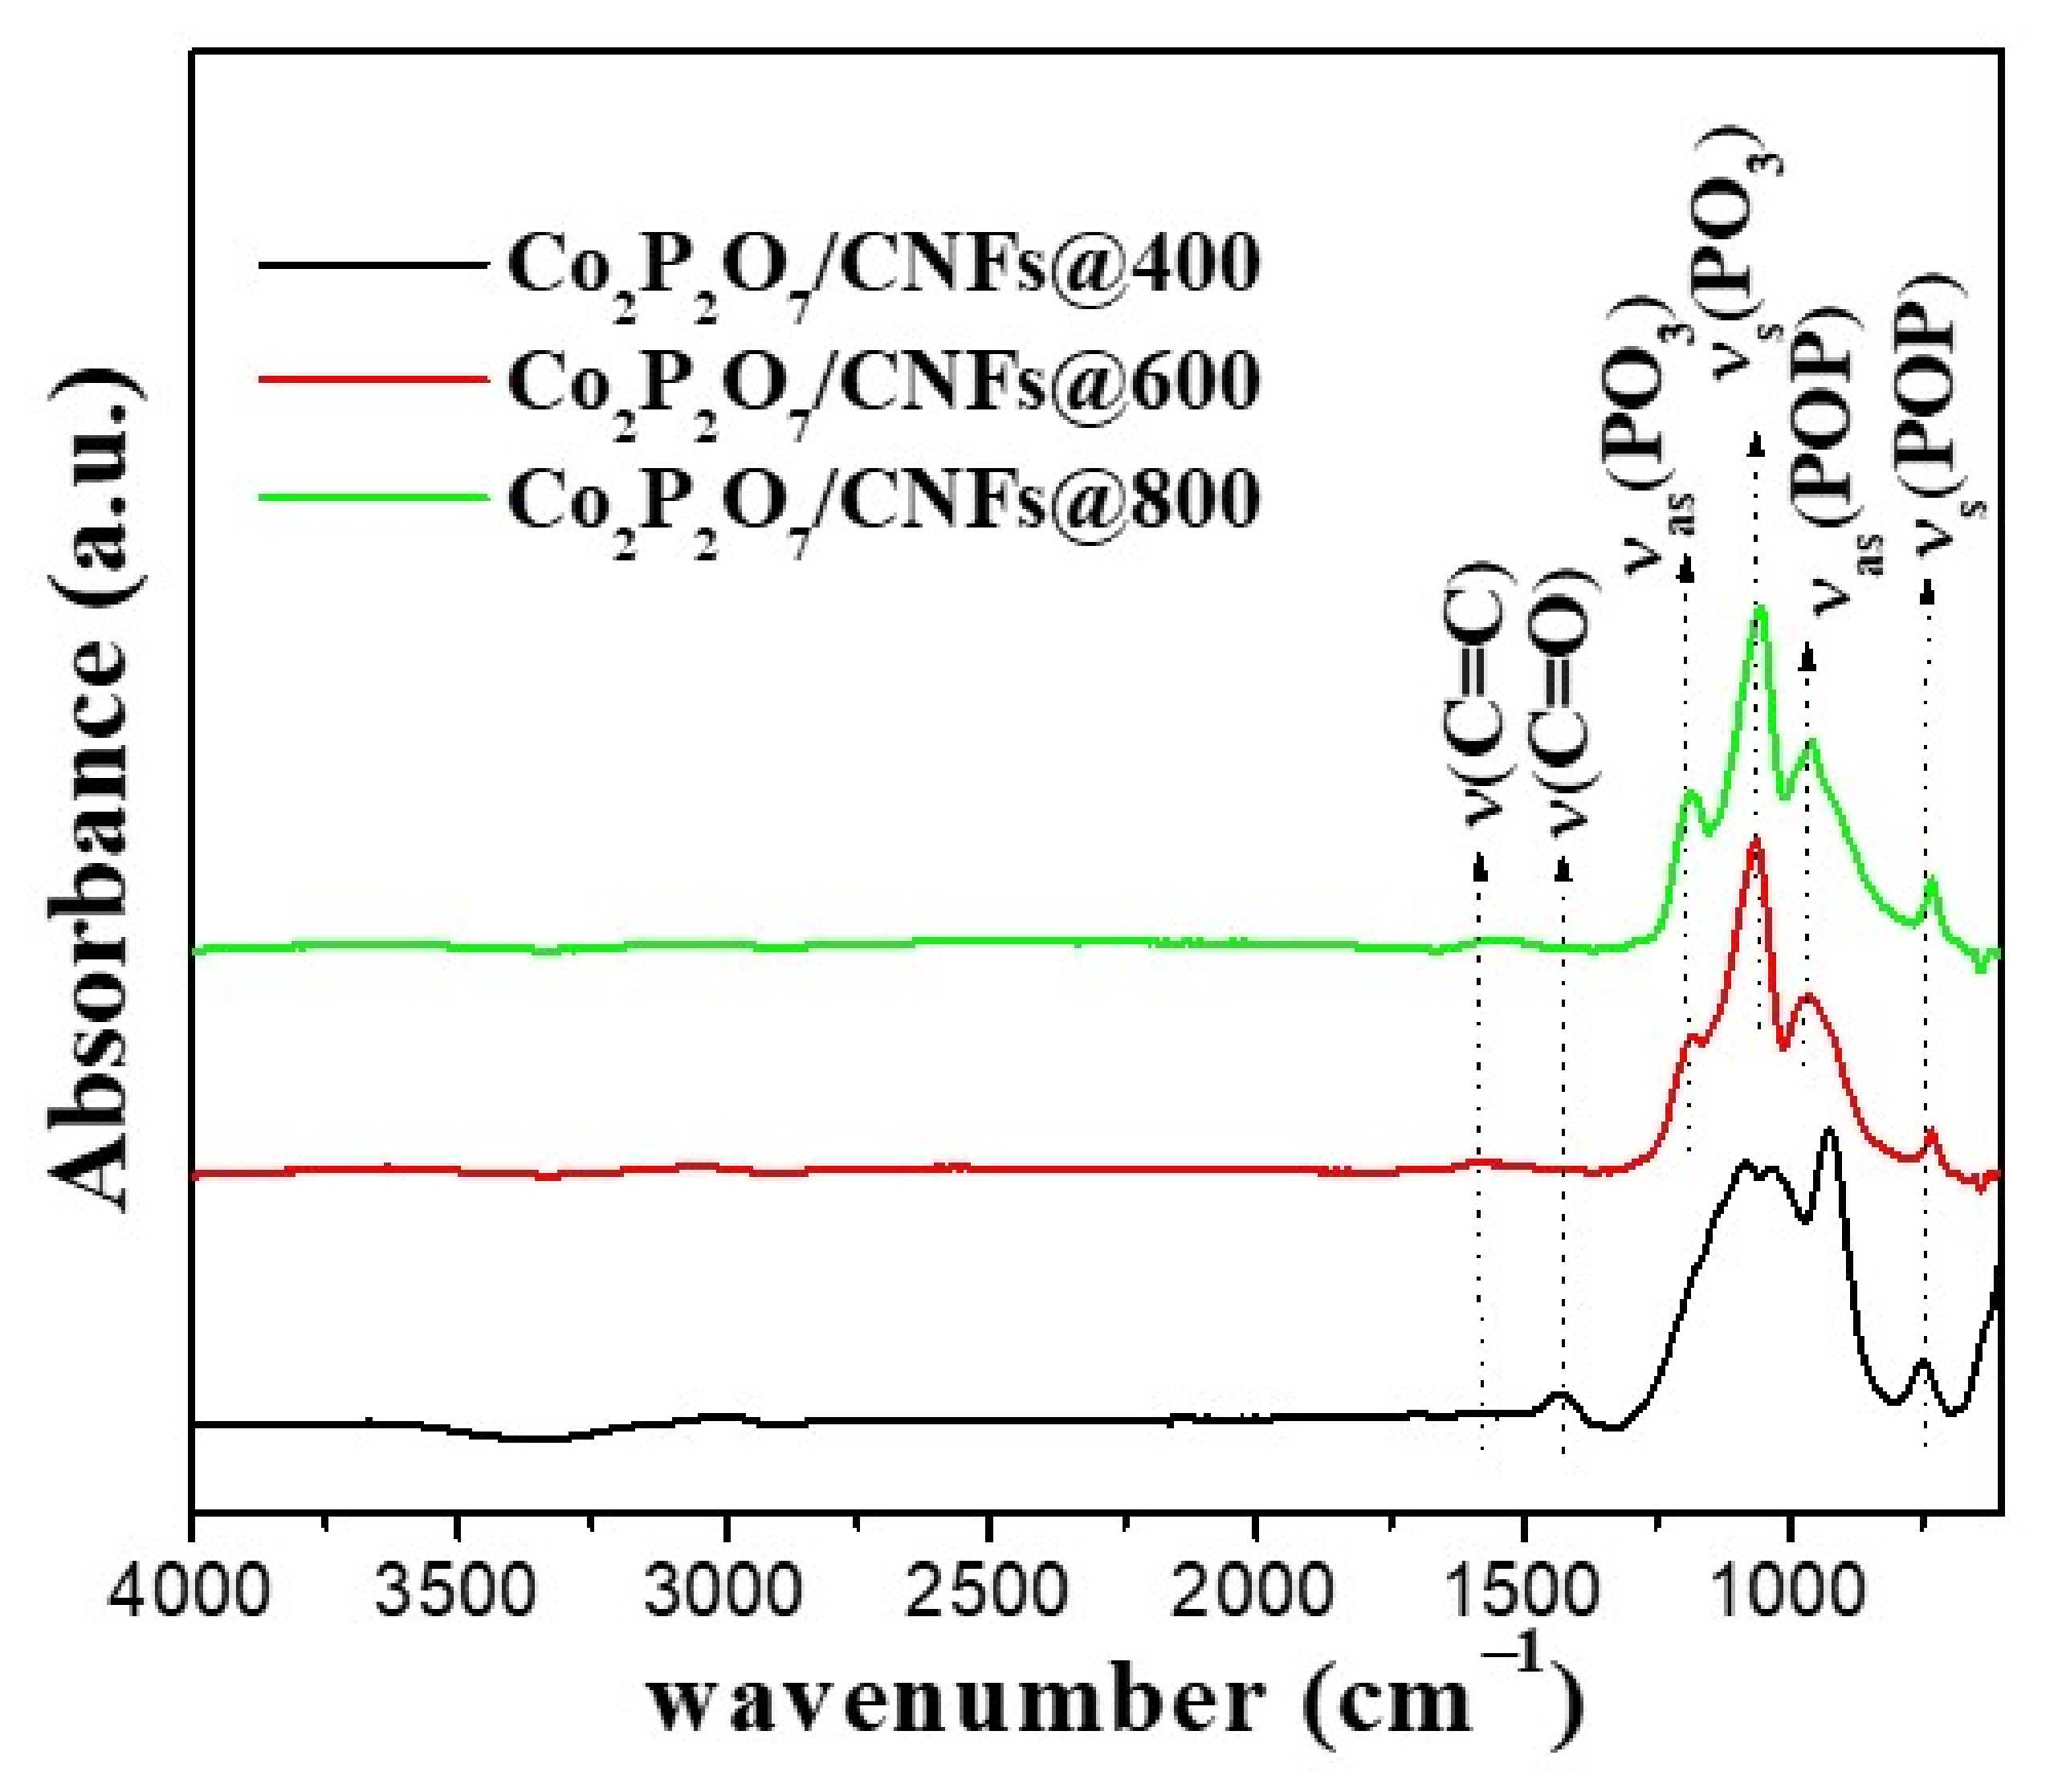
3.5. FT–IR
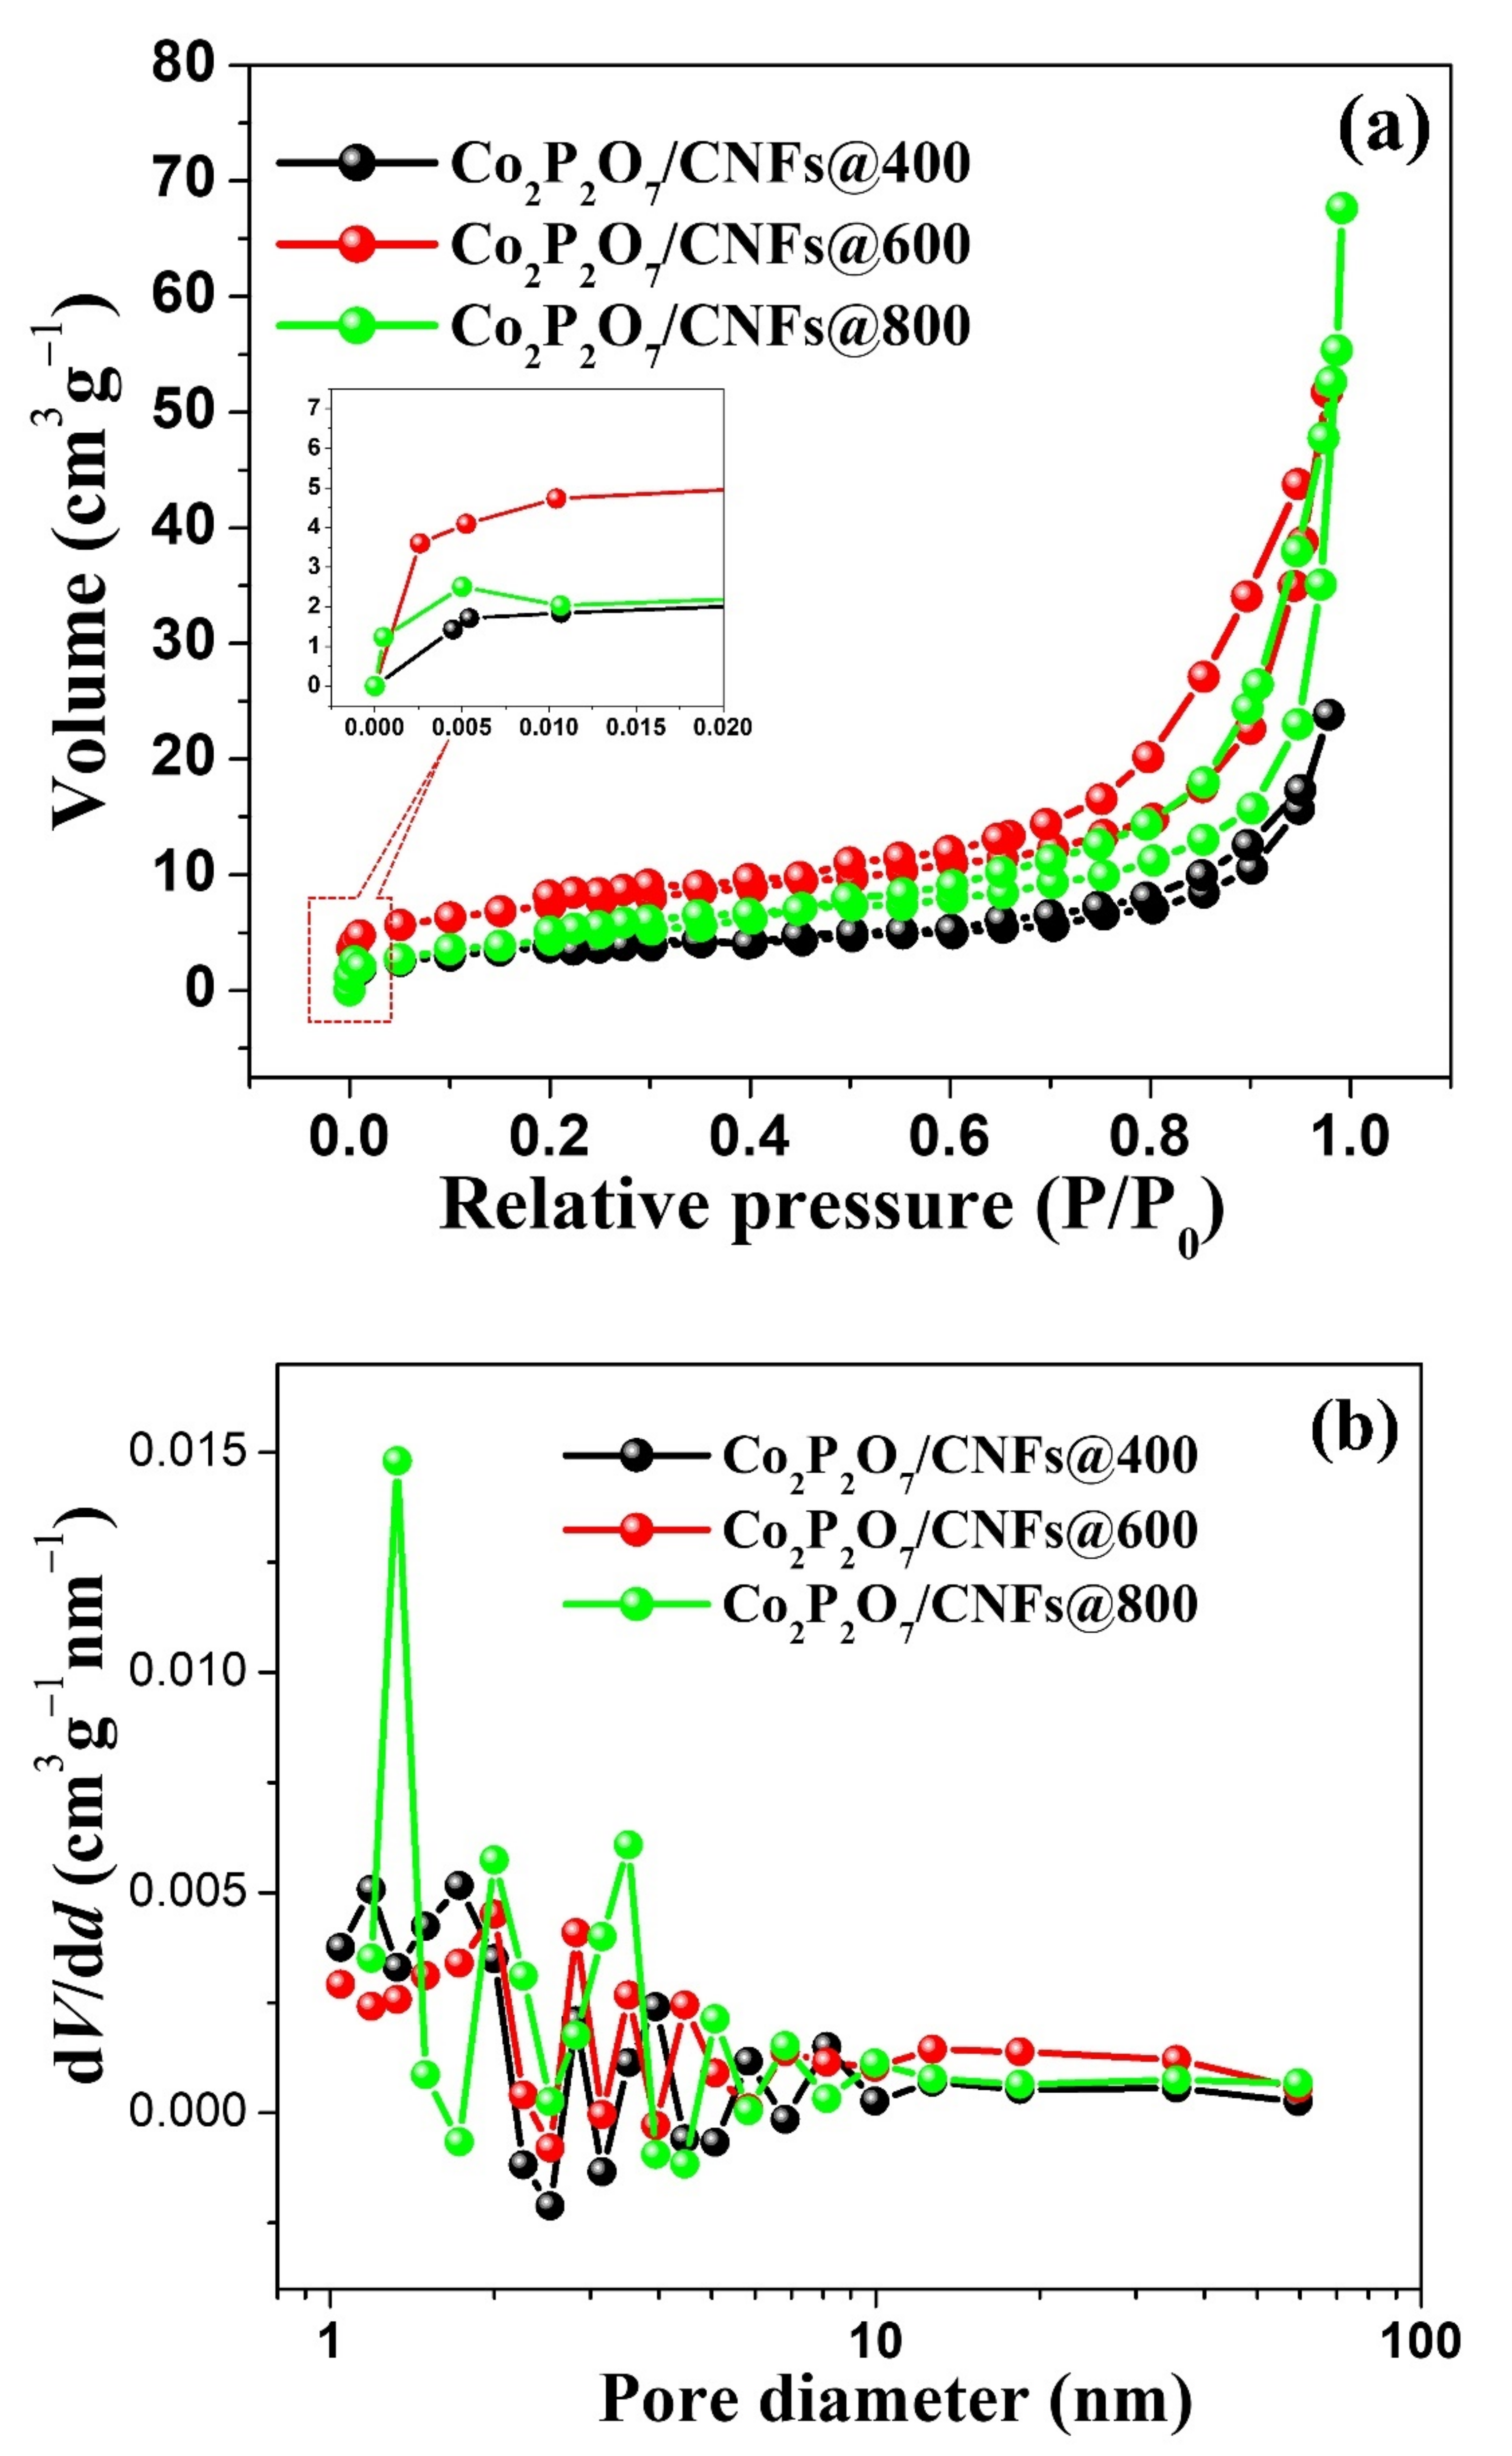
3.6. Nitrogen Adsorption–Desorption Measurements
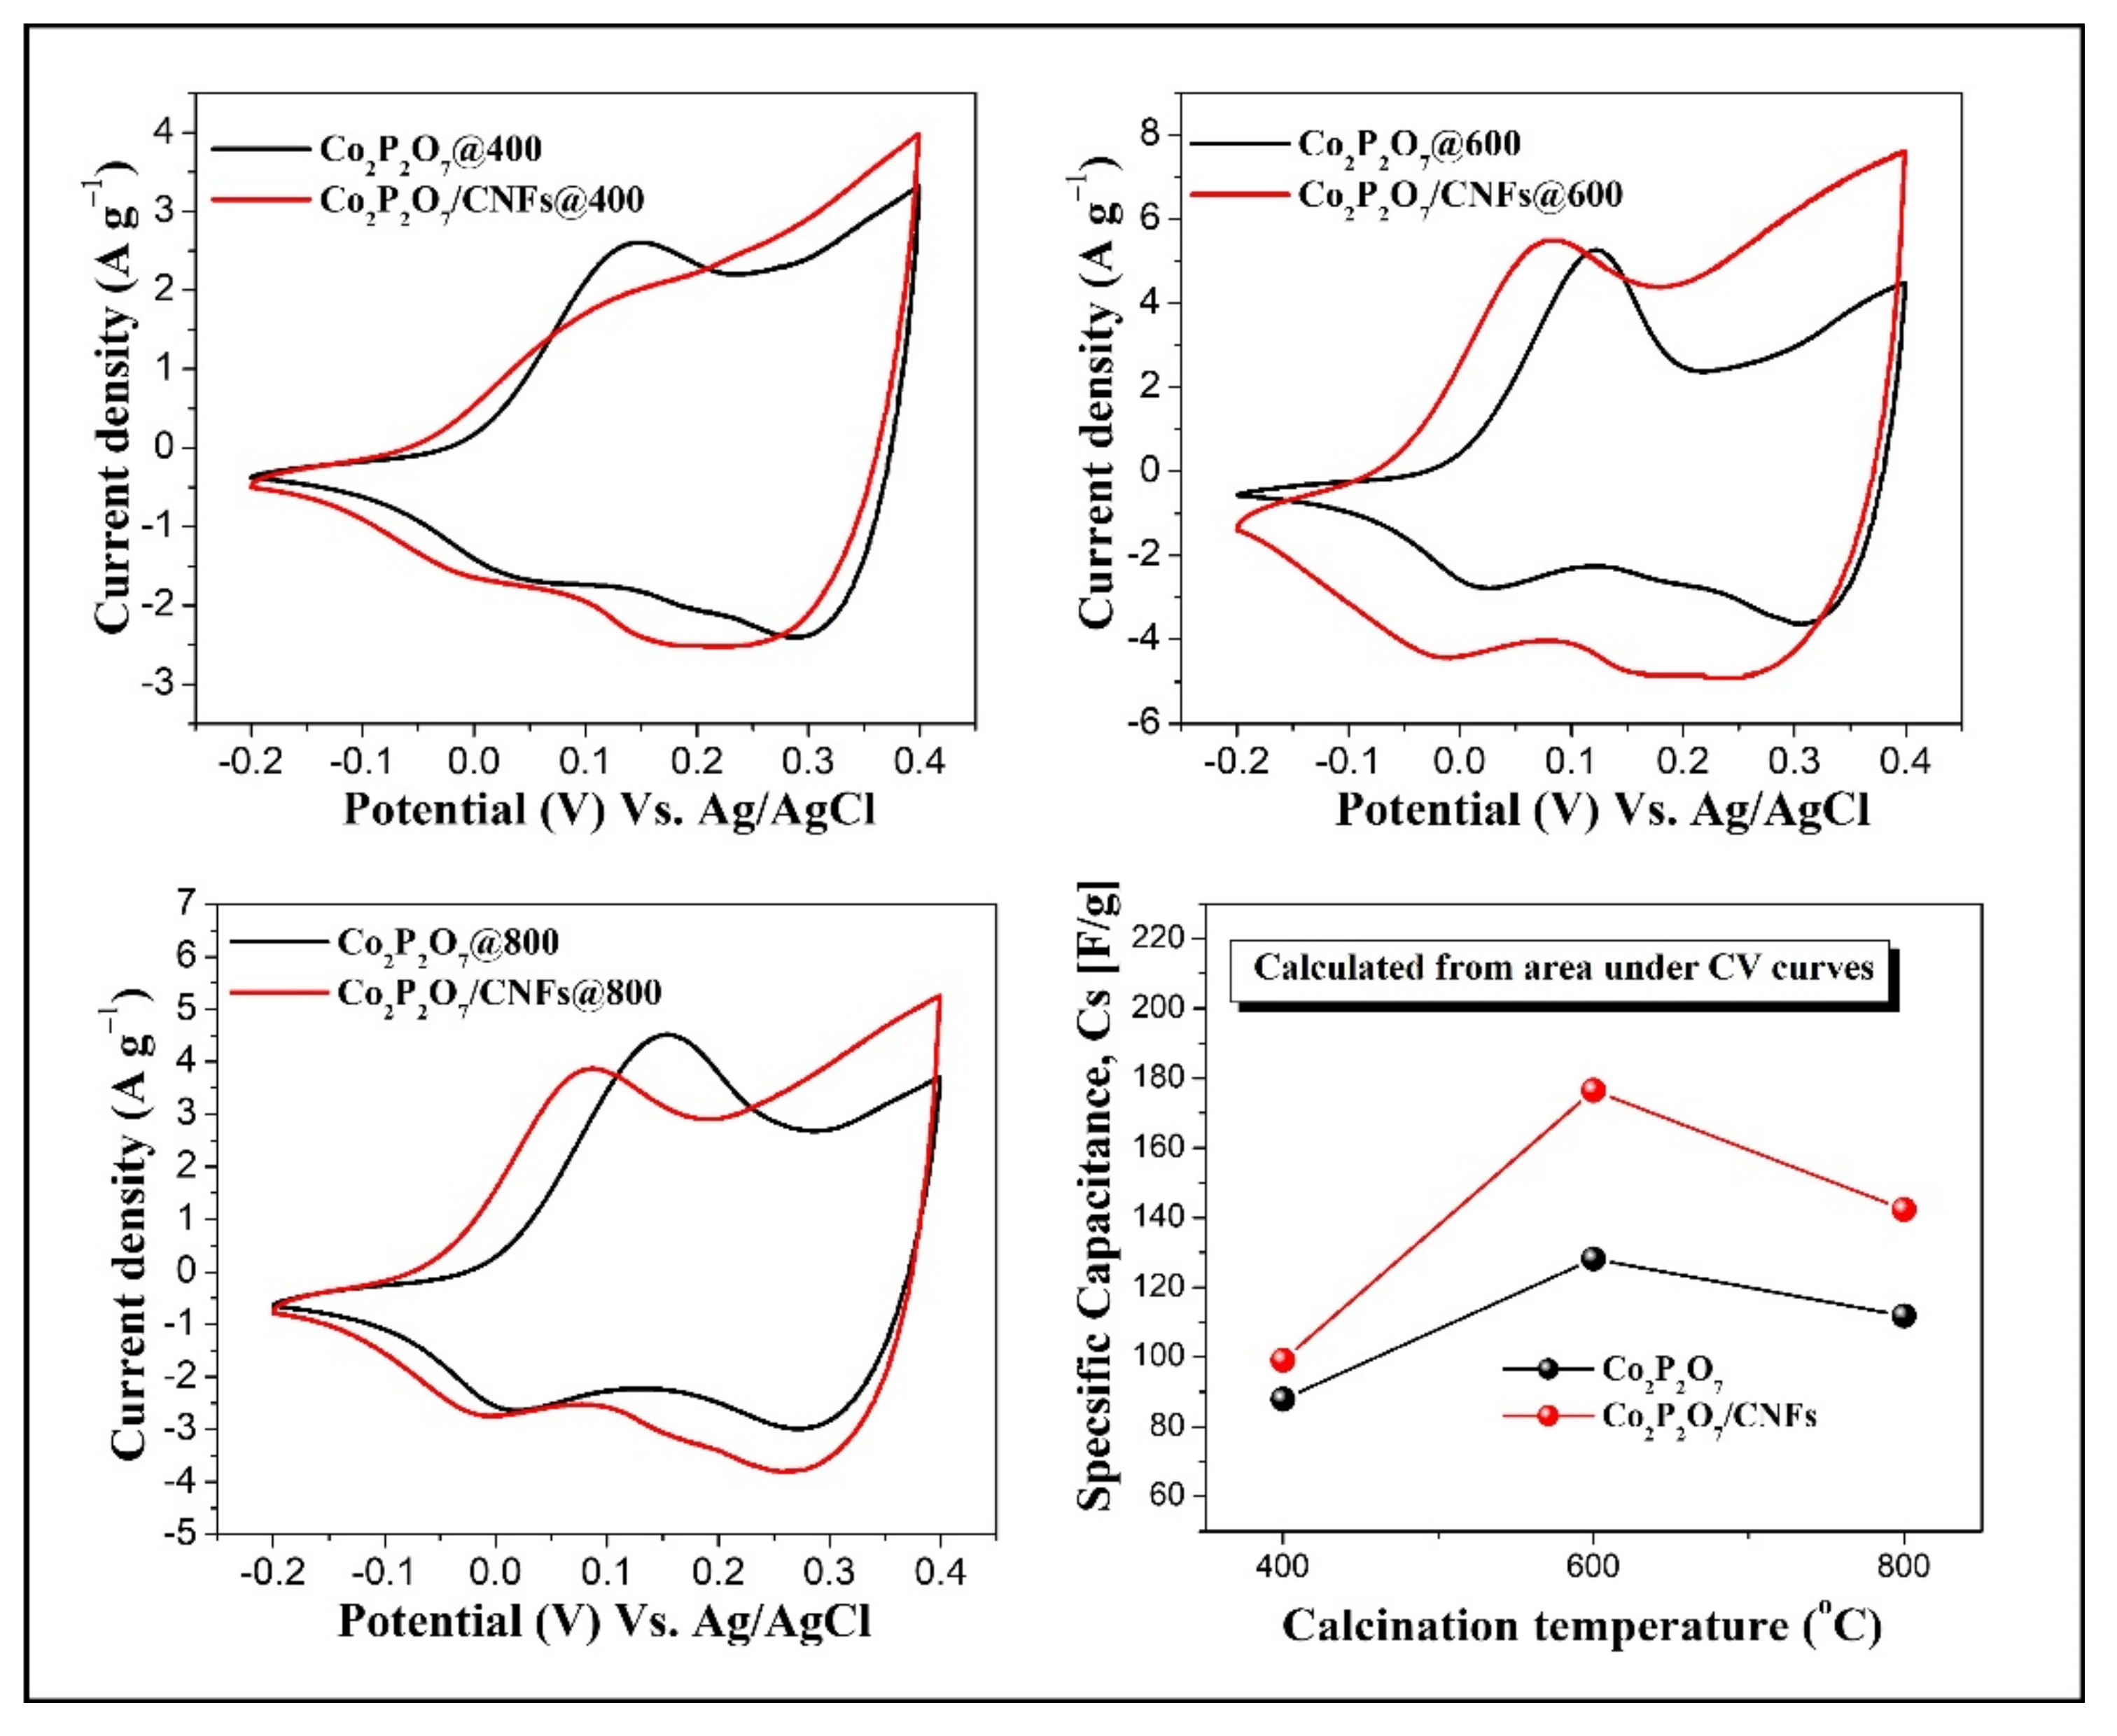
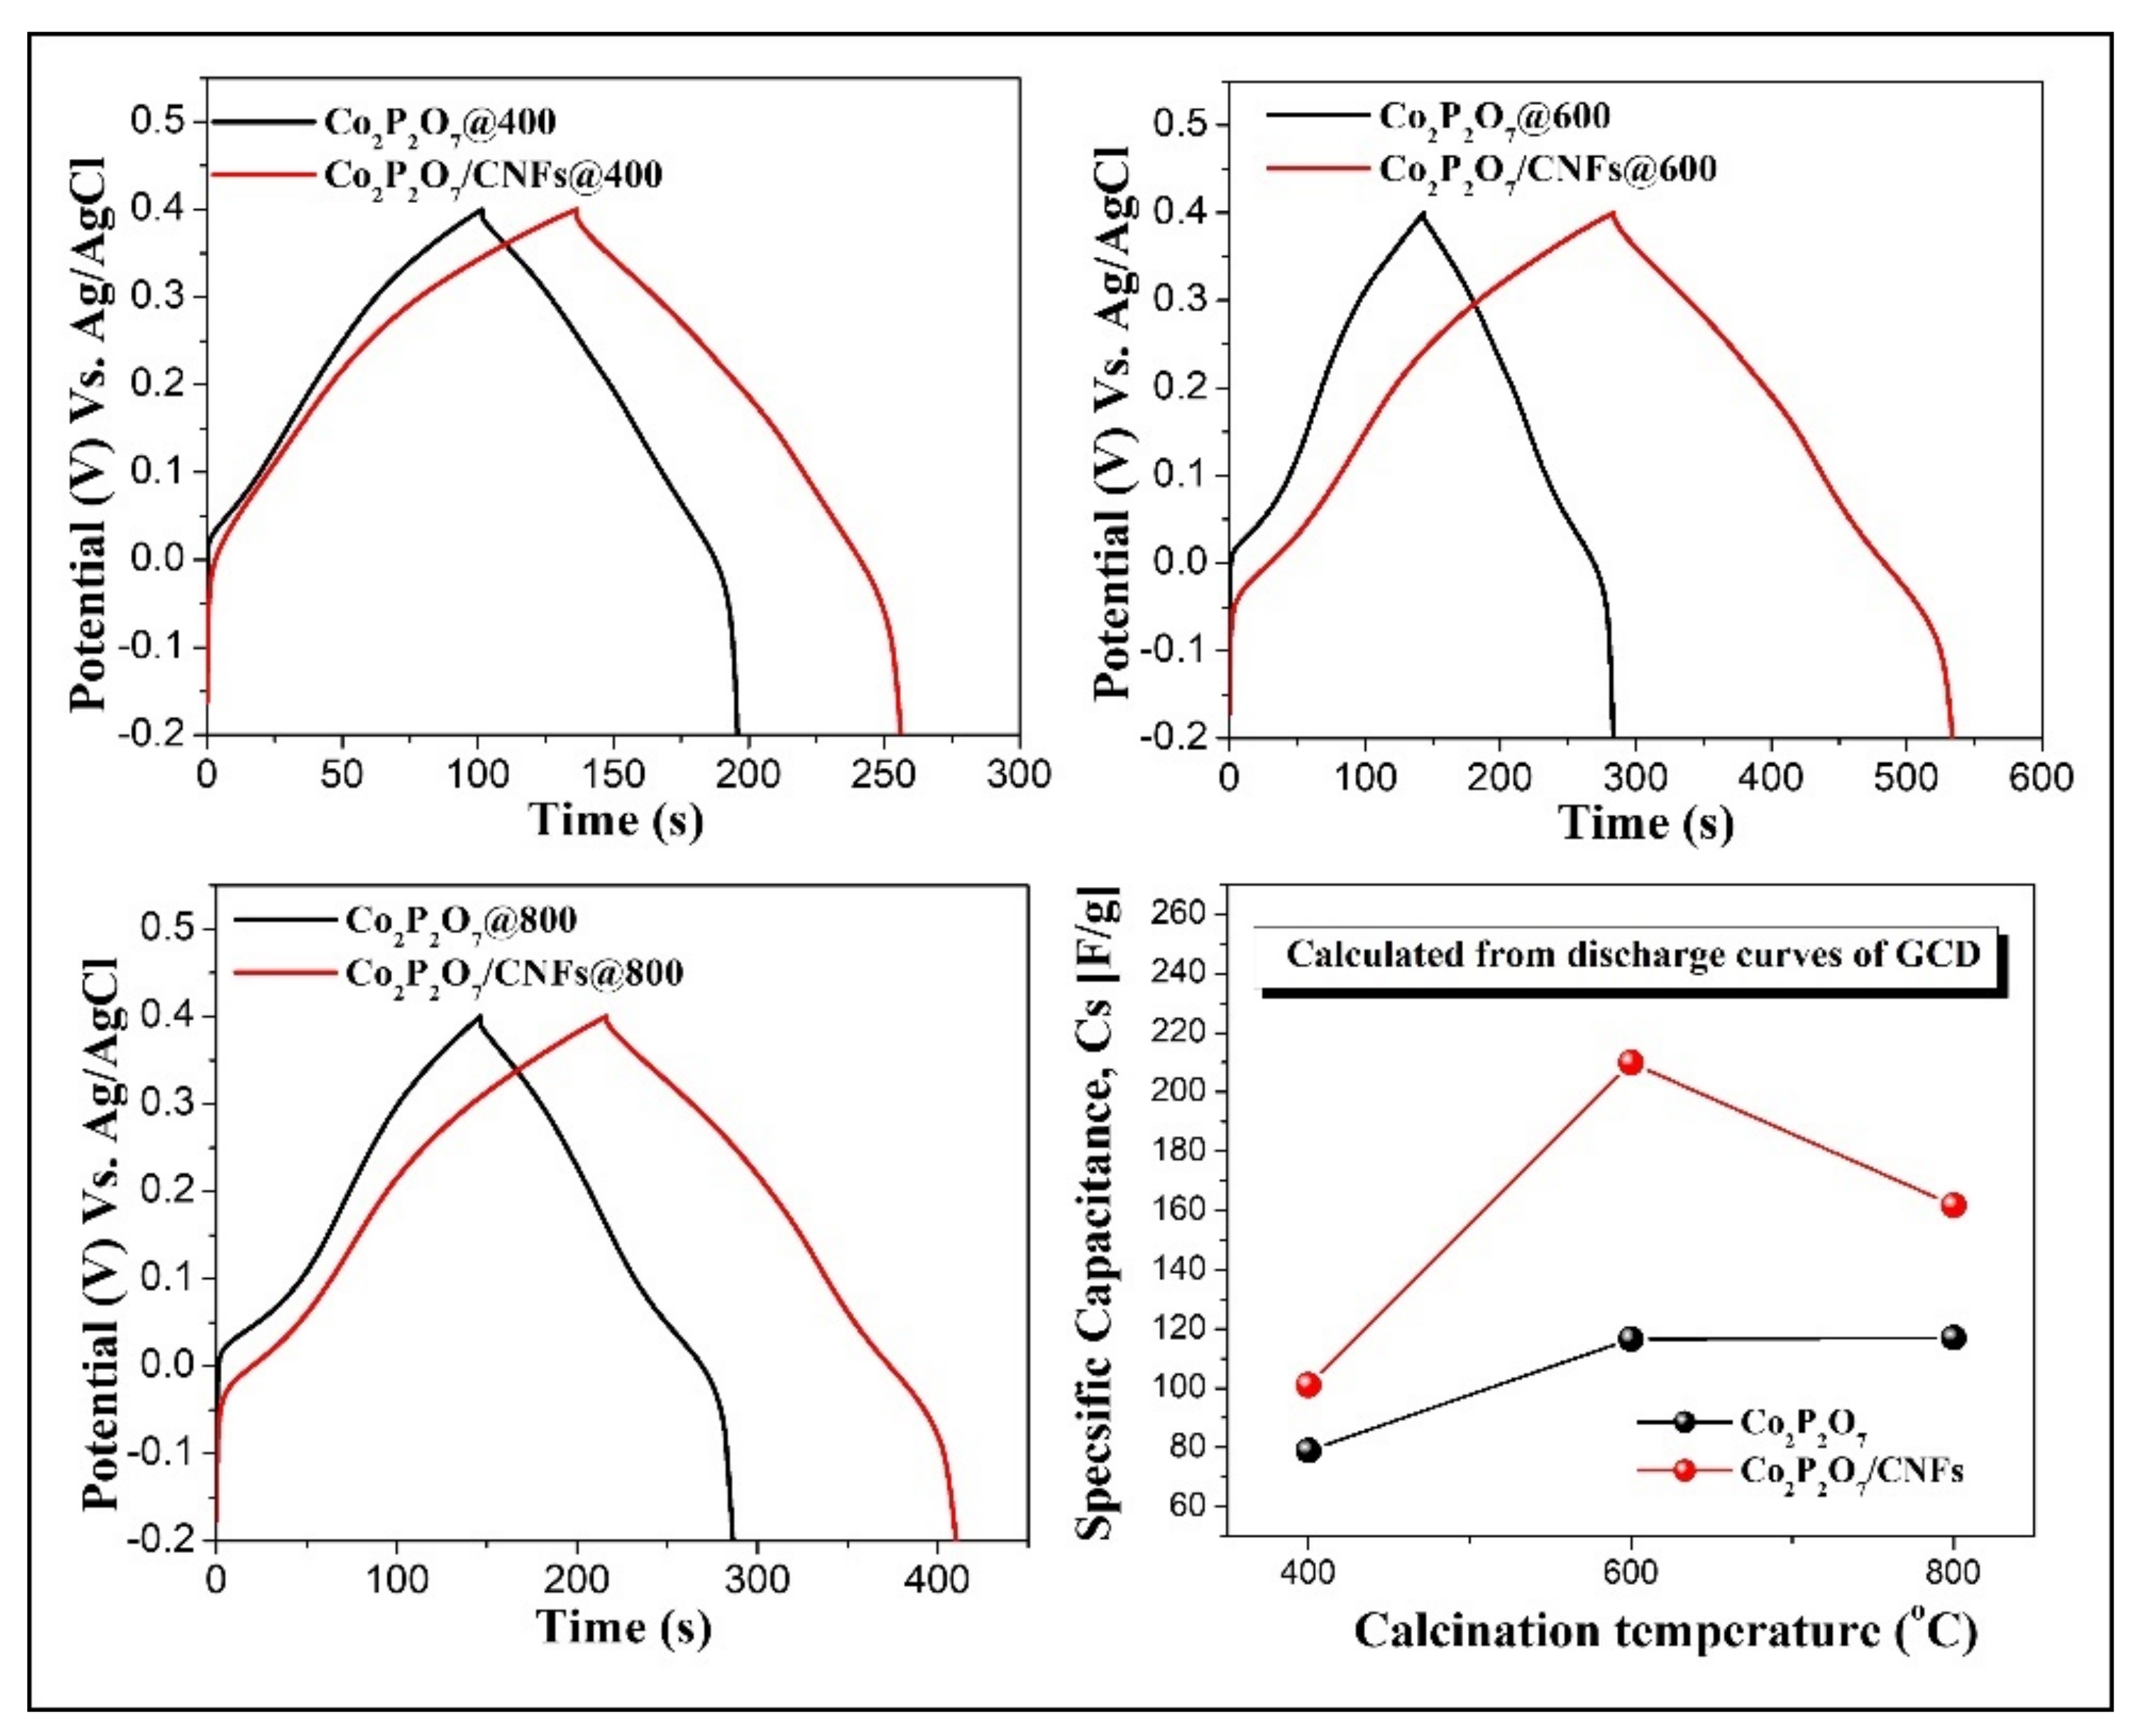
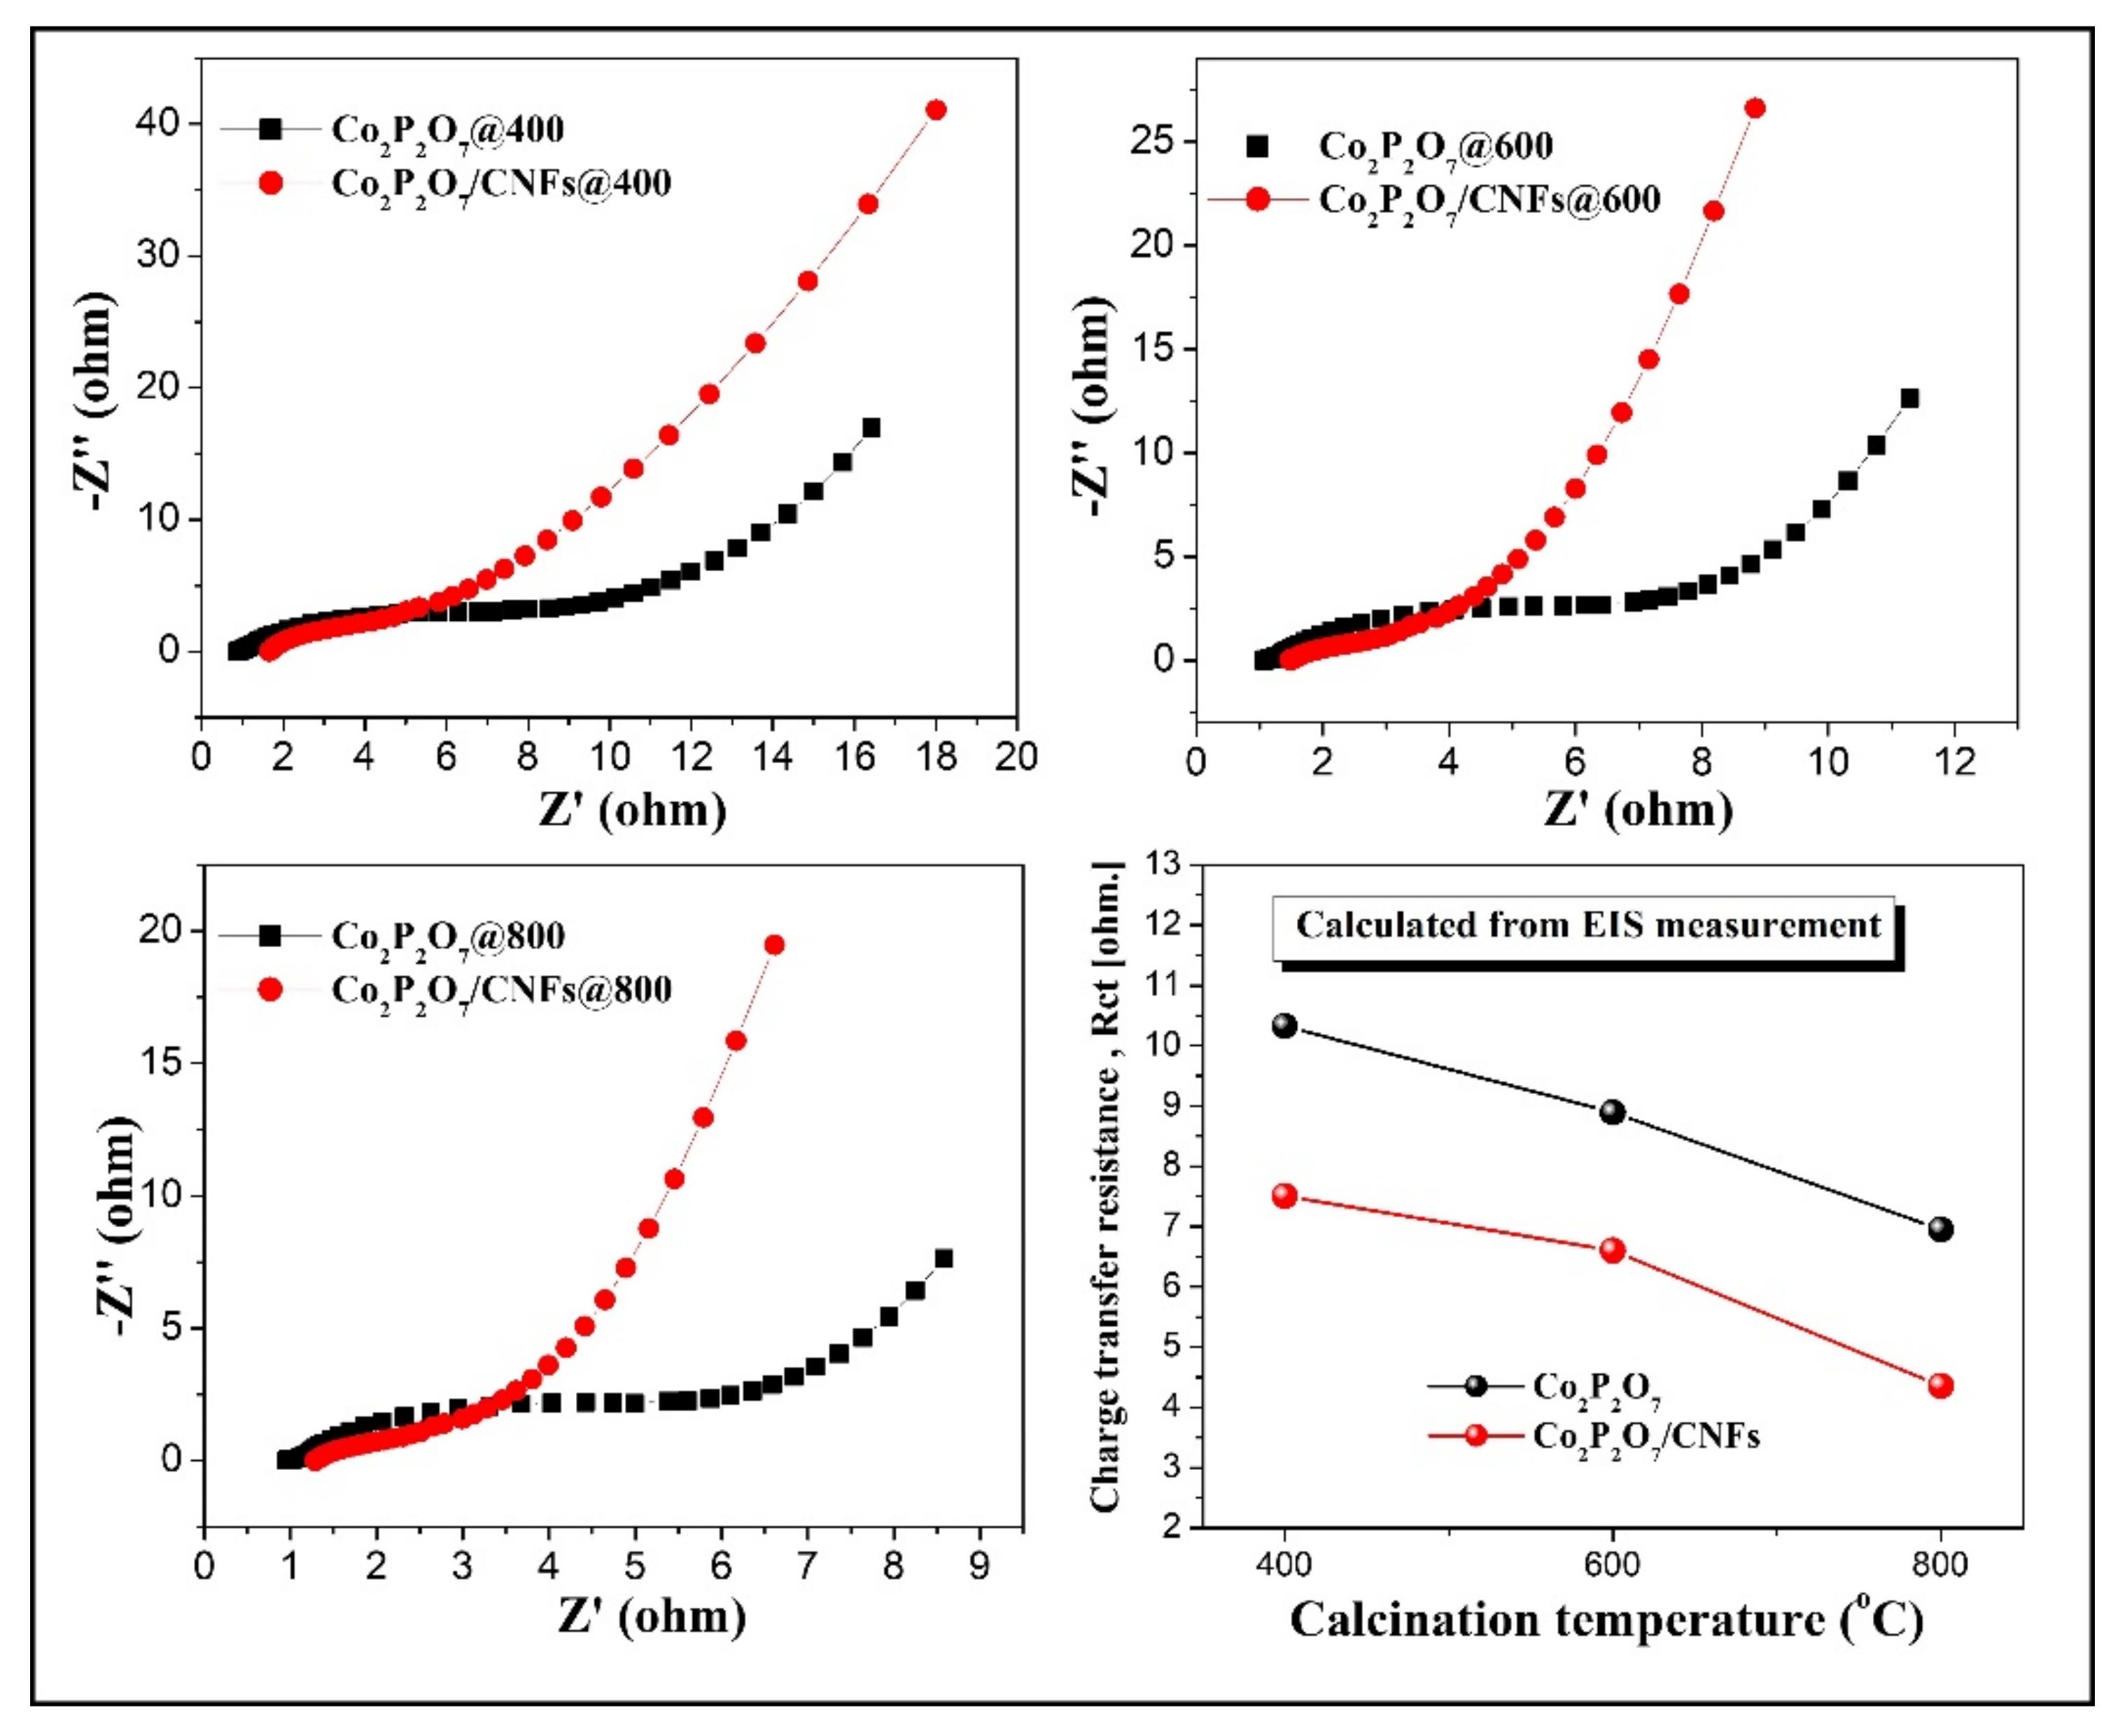
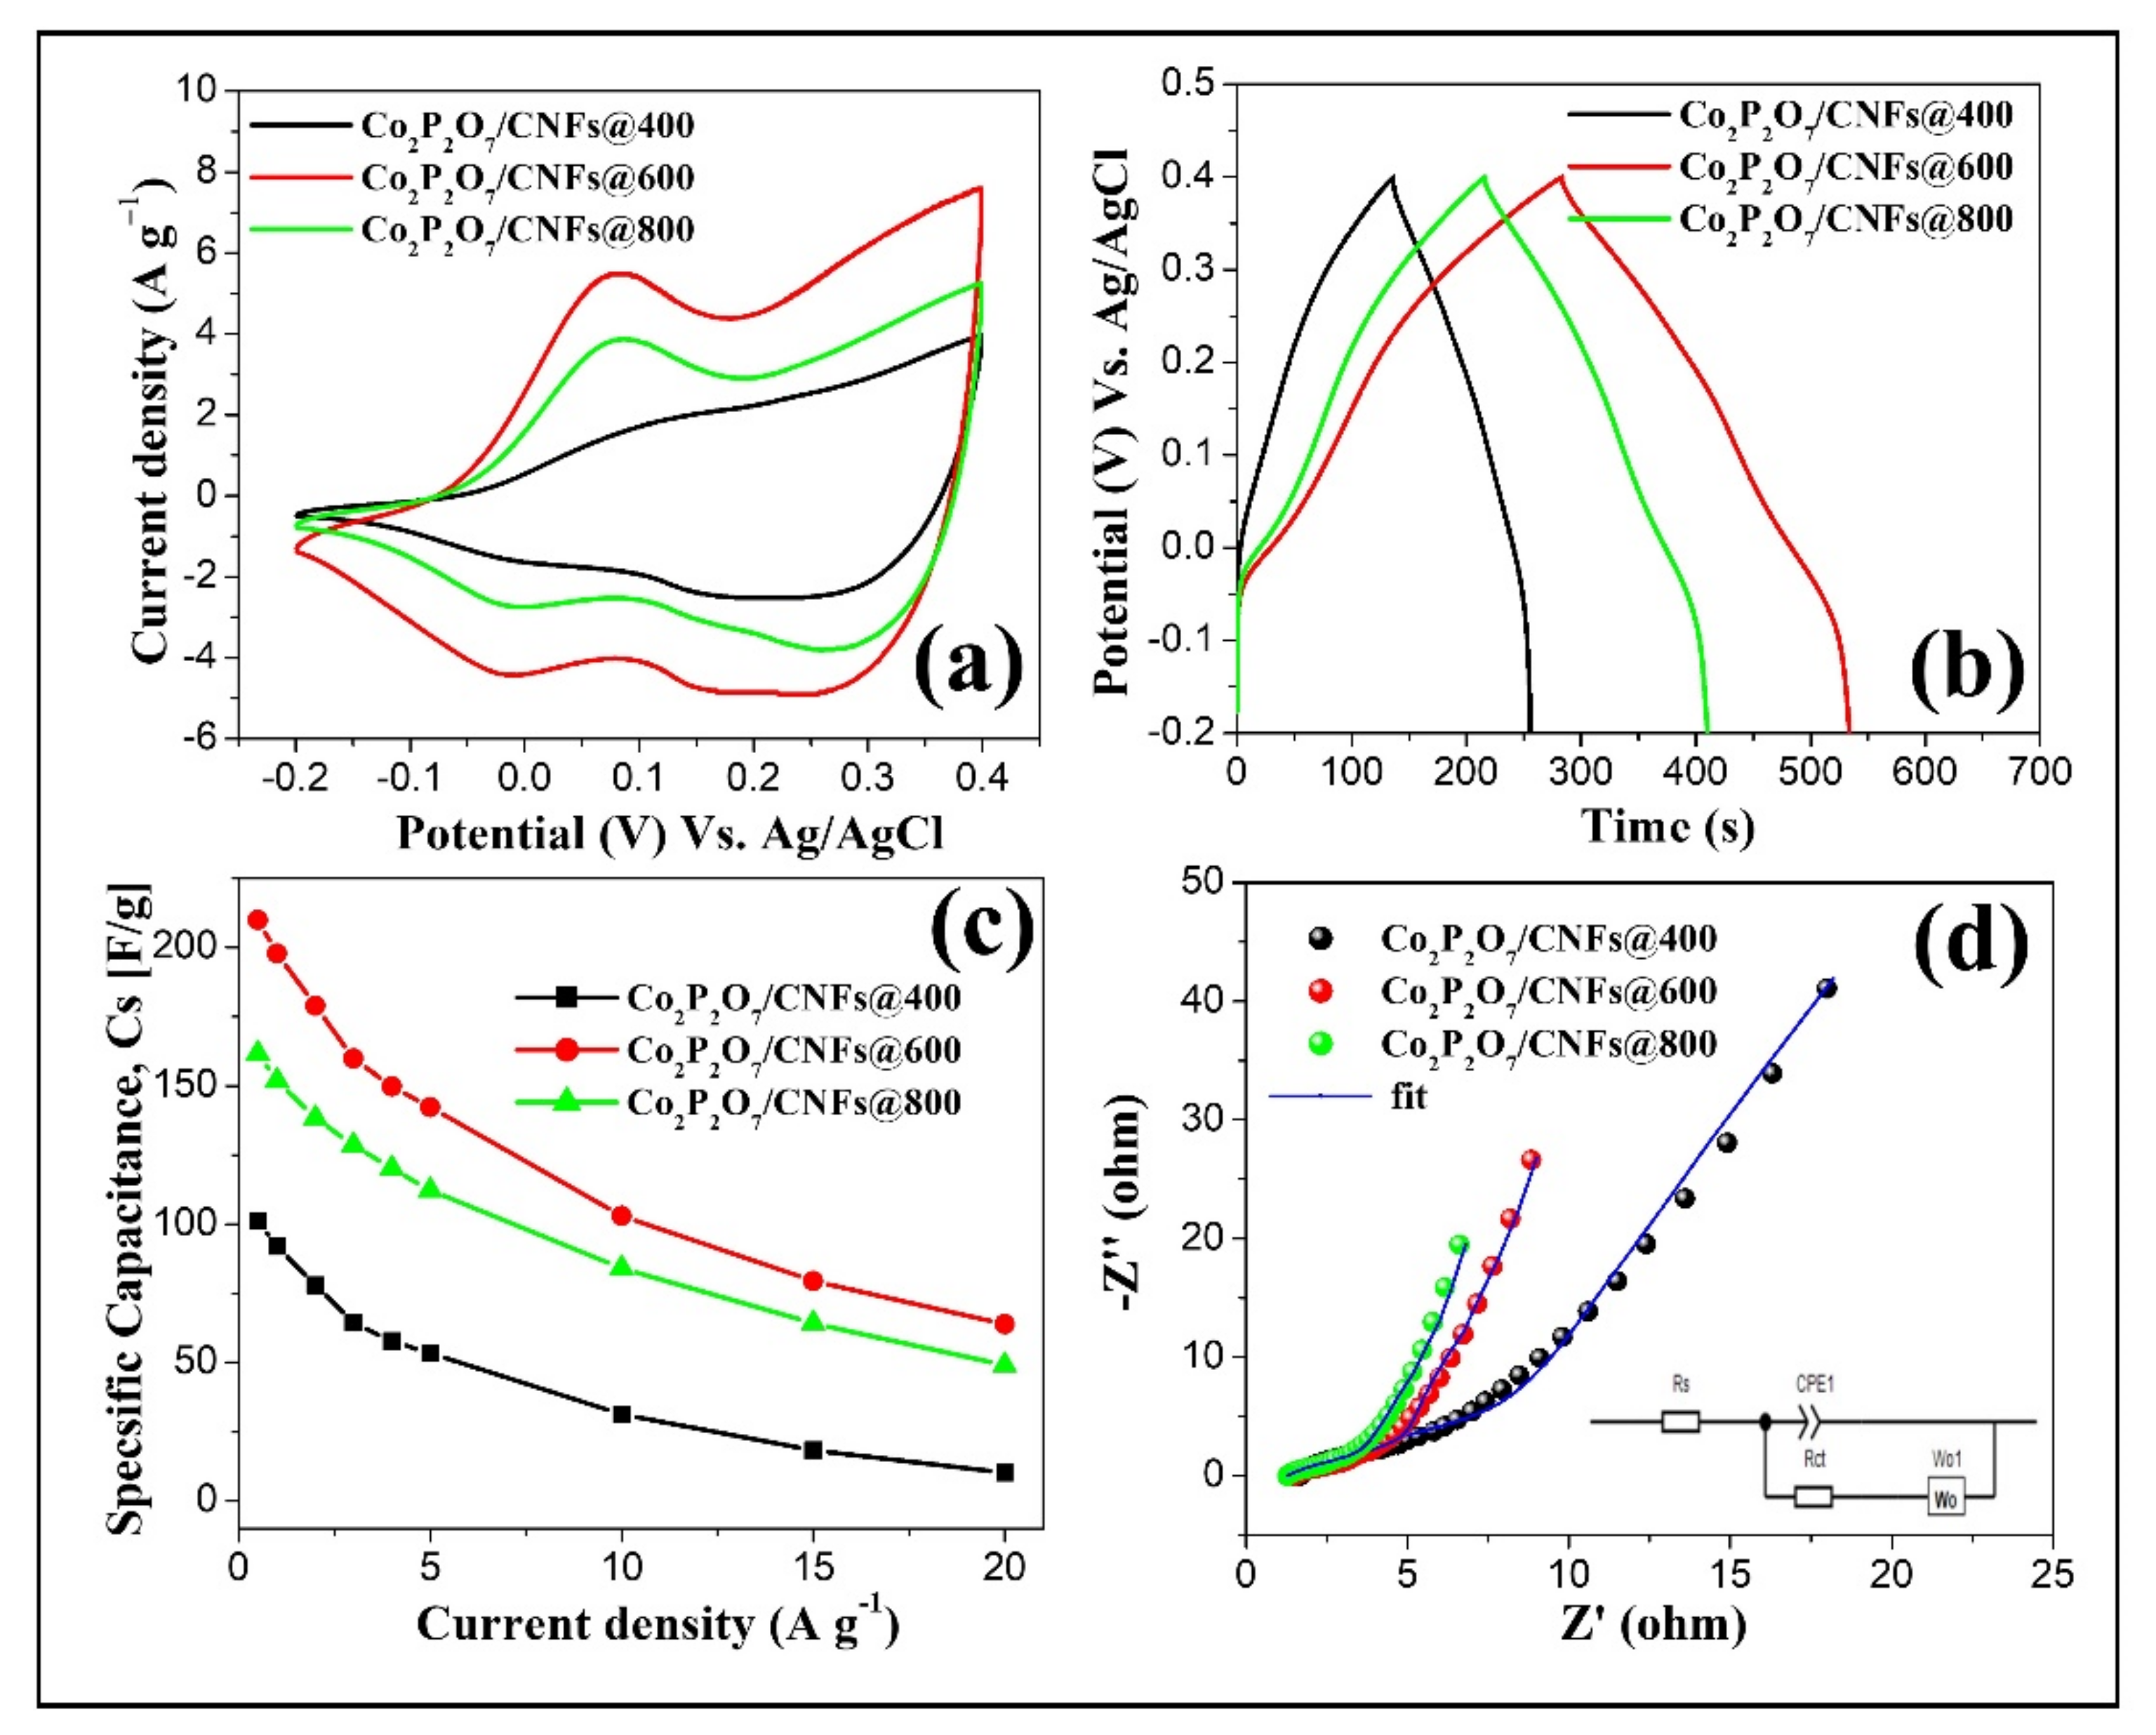
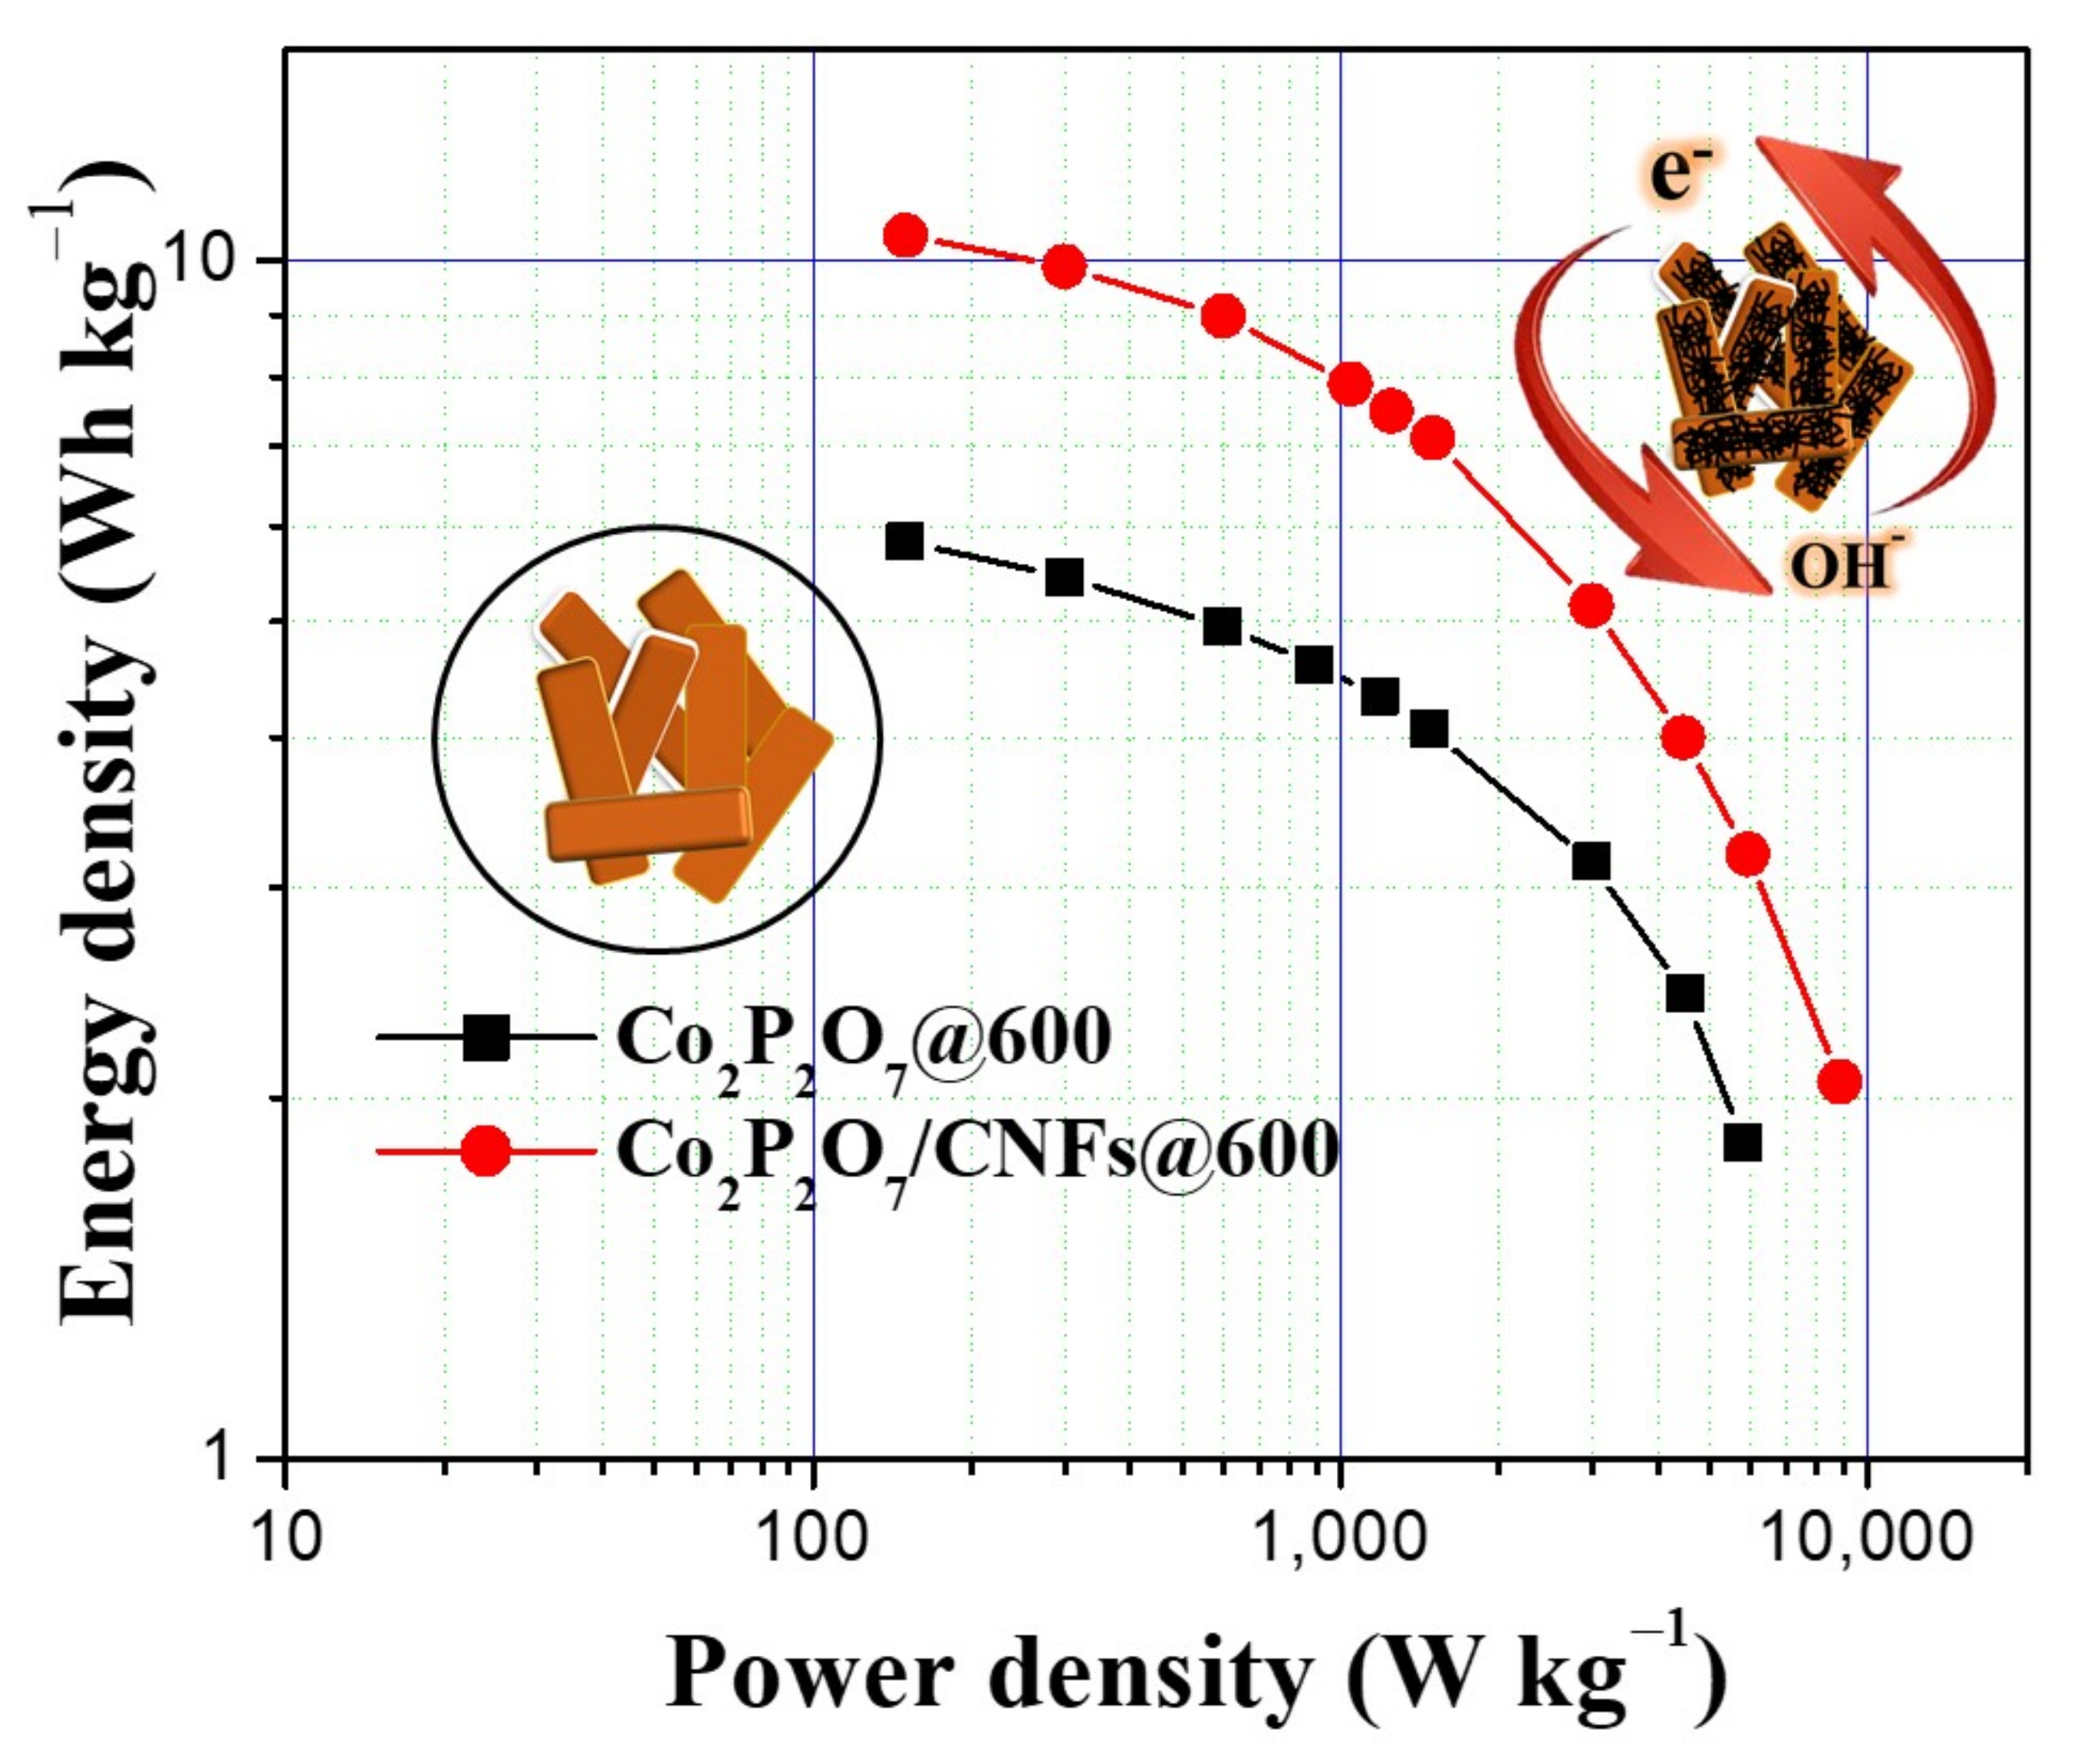
3.7. Electrochemical Properties
4. Conclusions
Supplementary Materials
Author Contributions
Funding
Institutional Review Board Statement
Data Availability Statement
Conflicts of Interest
References
- Lonngren, K.E.; Bai, E.-W. On the global warming problem due to carbon dioxide. Energy Policy 2008, 36, 1567–1568. [Google Scholar] [CrossRef]
- Seinfeld, J.H.; Pandis, S.N.; Noone, K. Atmospheric Chemistry and Physics: From Air Pollution to Climate Change. Phys. Today 1998, 51, 88–90. [Google Scholar] [CrossRef]
- Karden, E.; Ploumen, S.; Fricke, B.; Miller, T.; Snyder, K. Energy storage devices for future hybrid electric vehicles. J. Power Sources 2007, 168, 2–11. [Google Scholar] [CrossRef]
- Cao, J.; Emadi, A. A New Battery/UltraCapacitor Hybrid Energy Storage System for Electric, Hybrid, and Plug–In Hybrid Electric Vehicles. IEEE Trans. Power Electron. 2012, 27, 122–132. [Google Scholar]
- Jarushi, A.M.; Schofield, N. Battery and supercapacitor combination for a series hybrid electric vehicle. IET Conf. Proc. 2010, 2010, 1–6. [Google Scholar]
- Augustyn, V.; Simon, P.; Dunn, B. Pseudocapacitive oxide materials for high–rate electrochemical energy storage. Energy Environ. Sci. 2014, 7, 1597–1614. [Google Scholar] [CrossRef] [Green Version]
- Hadjipaschalis, I.; Poullikkas, A.; Efthimiou, V. Overview of current and future energy storage technologies for electric power applications. Renew. Sustain. Energy Rev. 2009, 13, 1513–1522. [Google Scholar] [CrossRef]
- Deng, J.; Li, J.; Song, S.; Zhou, Y.; Li, L. Electrolyte–Dependent Supercapacitor Performance on Nitrogen–Doped Porous Bio–Carbon from Gelatin. Nanomaterials 2020, 10, 353. [Google Scholar] [CrossRef] [PubMed] [Green Version]
- Aricò, A.S.; Bruce, P.; Scrosati, B.; Tarascon, J.-M.; van Schalkwijk, W. Nanostructured materials for advanced energy conversion and storage devices. Nat. Mater. 2005, 4, 366–377. [Google Scholar] [CrossRef]
- An, K.H.; Kim, W.S.; Park, Y.S.; Choi, Y.C.; Lee, S.M.; Chung, D.C.; Bae, D.J.; Lim, S.C.; Lee, Y.H. Supercapacitors Using Single–Walled Carbon Nanotube Electrodes. Adv. Mater. 2001, 13, 497–500. [Google Scholar] [CrossRef]
- Frackowiak, E.; Metenier, K.; Bertagna, V.; Beguin, F. Supercapacitor electrodes from multiwalled carbon nanotubes. Appl. Phys. Lett. 2000, 77, 2421–2423. [Google Scholar] [CrossRef]
- Frackowiak, E.; Béguin, F. Carbon materials for the electrochemical storage of energy in capacitors. Carbon 2001, 39, 937–950. [Google Scholar] [CrossRef]
- Sarno, M.; Baldino, L.; Scudieri, C.; Cardea, S.; Ciambelli, P.; Reverchon, E. SC–CO2–assisted process for a high energy density aerogel supercapacitor: The effect of GO loading. Nanotechnology 2017, 28, 204001. [Google Scholar] [CrossRef] [PubMed]
- Dmowski, W.; Egami, T.; Swider–Lyons, K.E.; Love, C.T.; Rolison, D.R. Local Atomic Structure and Conduction Mechanism of Nanocrystalline Hydrous RuO2 from X–ray Scattering. J. Phys. Chem. B 2002, 106, 12677–12683. [Google Scholar] [CrossRef]
- Dubal, D.P.; Dhawale, D.S.; Salunkhe, R.R.; Pawar, S.M.; Lokhande, C.D. A novel chemical synthesis and characterization of Mn3O4 thin films for supercapacitor application. Appl. Surf. Sci. 2010, 256, 4411–4416. [Google Scholar] [CrossRef]
- Reddy, R.N.; Reddy, R.G. Synthesis and electrochemical characterization of amorphous MnO2 electrochemical capacitor electrode material. J. Power Sources 2004, 132, 315–320. [Google Scholar] [CrossRef]
- Wang, S.-Y.; Ho, K.-C.; Kuo, S.-L.; Wu, N.-L. Investigation on Capacitance Mechanisms of Fe3O4 Electrochemical Capacitors. J. Electrochem. Soc. 2006, 153, A75. [Google Scholar] [CrossRef]
- Xing, W.; Qiao, S.; Wu, X.; Gao, X.; Zhou, J.; Zhuo, S.; Hartono, S.B.; Hulicova–Jurcakova, D. Exaggerated capacitance using electrochemically active nickel foam as current collector in electrochemical measurement. J. Power Sources 2011, 196, 4123–4127. [Google Scholar] [CrossRef]
- Ning, F.; Shao, M.; Zhang, C.; Xu, S.; Wei, M.; Duan, X. Co3O4@layered double hydroxide core/shell hierarchical nanowire arrays for enhanced supercapacitance performance. Nano Energy 2014, 7, 134–142. [Google Scholar] [CrossRef]
- Bendi, R.; Kumar, V.; Bhavanasi, V.; Parida, K.; Lee, P.S. Metal Organic Framework–Derived Metal Phosphates as Electrode Materials for Supercapacitors. Adv. Energy Mater. 2016, 6, 1501833. [Google Scholar] [CrossRef]
- Wei, C.; Cheng, C.; Wang, S.; Xu, Y.; Wang, J.; Pang, H. Sodium–Doped Mesoporous Ni2P2O7 Hexagonal Tablets for High–Performance Flexible All–Solid–State Hybrid Supercapacitors. Chem. Asian J. 2015, 10, 1731–1737. [Google Scholar] [CrossRef] [PubMed]
- Gao, Y.; Zhao, J.; Run, Z.; Zhang, G.; Pang, H. Microporous Ni11(HPO3)8(OH)6 nanocrystals for high–performance flexible asymmetric all solid–state supercapacitors. Dalton Trans. 2014, 43, 17000–17005. [Google Scholar] [CrossRef]
- Li, X.; Xiao, X.; Li, Q.; Wei, J.; Xue, H.; Pang, H. Metal (M = Co, Ni) phosphate based materials for high–performance supercapacitors. Inorg. Chem. Front. 2018, 5, 11–28. [Google Scholar] [CrossRef]
- Pang, H.; Yan, Z.; Ma, Y.; Li, G.; Chen, J.; Zhang, J.; Du, W.; Li, S. Cobalt pyrophosphate nano/microstructures as promising electrode materials of supercapacitor. J. Solid State Electrochem. 2013, 17, 1383–1391. [Google Scholar] [CrossRef]
- Hou, L.; Lian, L.; Li, D.; Lin, J.; Pan, G.; Zhang, L.; Zhang, X.; Zhang, Q.; Yuan, C. Facile synthesis of Co2P2O7 nanorods as a promising pseudocapacitive material towards high–performance electrochemical capacitors. RSC Adv. 2013, 3, 21558–21562. [Google Scholar] [CrossRef]
- Wang, X.; Yan, Z.; Pang, H.; Wang, W.; Li, G.; Ma, Y.; Zhang, H.; Li, X.; Chen, J. NH4CoPO4·H2O microflowers and porous Co2P2O7 microflowers: Effective electrochemical supercapacitor behavior in different alkaline electrolytes. Int. J. Electrochem. Sci. 2013, 8, 3768–3785. [Google Scholar]
- Vamvakaki, V.; Tsagaraki, K.; Chaniotakis, N. Carbon Nanofiber–Based Glucose Biosensor. Anal. Chem. 2006, 78, 5538–5542. [Google Scholar] [CrossRef] [PubMed]
- Zhang, W.-D.; Xu, B.; Jiang, L.C. Functional hybrid materials based on carbon nanotubes and metal oxides. J. Mater. Chem. 2010, 20, 6383–6391. [Google Scholar] [CrossRef]
- De las Casas, C.; Li, W. A review of application of carbon nanotubes for lithium ion battery anode material. J. Power Sources 2012, 208, 74–85. [Google Scholar] [CrossRef]
- Zhi, M.; Xiang, C.; Li, J.; Li, M.; Wu, N. Nanostructured carbon–metal oxide composite electrodes for supercapacitors: A review. Nanoscale 2013, 5, 72–88. [Google Scholar] [CrossRef]
- Moon, I.K.; Lee, J.; Ruoff, R.S.; Lee, H. Reduced graphene oxide by chemical graphitization. Nat. Commun. 2010, 1, 73. [Google Scholar] [CrossRef] [Green Version]
- Zhu, H.; Fang, Z.; Wang, Z.; Dai, J.; Yao, Y.; Shen, F.; Preston, C.; Wu, W.; Peng, P.; Jang, N.; et al. Extreme Light Management in Mesoporous Wood Cellulose Paper for Optoelectronics. ACS Nano 2016, 10, 1369–1377. [Google Scholar] [CrossRef]
- Raymundo–Piñero, E.; Kierzek, K.; Machnikowski, J.; Beguin, F. Relationship Between the Nanoporous Texture of Activated Carbons and Their Capacitance Properties in Different Electrolytes. Carbon 2006, 44, 2498–2507. [Google Scholar] [CrossRef]
- Pandolfo, A.G.; Hollenkamp, A.F. Carbon properties and their role in supercapacitors. J. Power Sources 2006, 157, 11–27. [Google Scholar] [CrossRef]
- Kierzek, K.; Frackowiak, E.; Lota, G.; Gryglewicz, G.; Machnikowski, J. Electrochemical capacitors based on highly porous carbons prepared by KOH activation. Electrochim. Acta 2004, 49, 515–523. [Google Scholar] [CrossRef]
- Dutta, S.; Kim, J.; Ide, Y.; Ho Kim, J.; Hossain, M.S.A.; Bando, Y.; Yamauchi, Y.; Wu, K.C.W. 3D network of cellulose–based energy storage devices and related emerging applications. Mater. Horiz. 2017, 4, 522–545. [Google Scholar] [CrossRef] [Green Version]
- Czaja, W.K.; Young, D.J.; Kawecki, M.; Brown, R.M. The Future Prospects of Microbial Cellulose in Biomedical Applications. Biomacromolecules 2007, 8, 1–12. [Google Scholar] [CrossRef]
- Lai, F.; Miao, Y.-E.; Huang, Y.; Zhang, Y.; Liu, T. Nitrogen–Doped Carbon Nanofiber/Molybdenum Disulfide Nanocomposites Derived from Bacterial Cellulose for High–Efficiency Electrocatalytic Hydrogen Evolution Reaction. ACS Appl. Mater. Interfaces 2016, 8, 3558–3566. [Google Scholar] [CrossRef] [PubMed]
- Seok, D.; Jeong, Y.; Han, K.; Yoon, D.Y.; Sohn, H. Recent Progress of Electrochemical Energy Devices: Metal Oxide–Carbon Nanocomposites as Materials for Next–Generation Chemical Storage for Renewable Energy. Sustainability 2019, 11, 3694. [Google Scholar] [CrossRef] [Green Version]
- Stoller, M.D.; Ruoff, R.S. Best practice methods for determining an electrode material’s performance for ultracapacitors. Energy Environ. Sci. 2010, 3, 1294–1301. [Google Scholar] [CrossRef]
- Li, Q.; Li, Y.; Huarong, P.; Cui, X.; Zhou, M.; Feng, K.; Xiao, P. Layered NH4Co x Ni1−x PO4·H2O (0 ≦ x ≦ 1) nanostructures finely tuned by Co/Ni molar ratios for asymmetric supercapacitor electrodes. J. Mater. Sci. 2016, 51, 9946–9957. [Google Scholar] [CrossRef]
- Czaja, W.; Romanovicz, D.; Brown, R.M. Structural investigations of microbial cellulose produced in stationary and agitated culture. Cellulose 2004, 11, 403–411. [Google Scholar] [CrossRef]
- Shah, A.; Rather, M. Effect of calcination temperature on the crystallite size, particle size and zeta potential of TiO2 nanoparticles synthesized via polyol–mediated method. Mater. Today Proc. 2020, 44, 482–488. [Google Scholar] [CrossRef]
- Chen, Z.; Chai, Q.; Liao, S.; He, Y.; Li, Y.; Bo, X.; Wu, W.; Li, B. Application of isoconversional calculation procedure to non–isothermal kinetic study: III. Thermal decomposition of ammonium cobalt phosphate hydrate. Thermochim. Acta 2012, 543, 205–210. [Google Scholar] [CrossRef]
- Wenwei, W.; Yanjin, F.; Xuehang, W.; Sen, L.; Shushu, L. Preparation via solid–state reaction at room temperature and characterization of layered nanocrystalline NH4MnPO4·H2O. J. Phys. Chem. Solids 2009, 70, 584–587. [Google Scholar] [CrossRef]
- Li, J.; Li, J.; Feng, D.; Zhao, J.; Sun, J.; Li, D. Excellent rheological performance and impact toughness of cellulose nanofibers/PLA/ionomer composite. RSC Adv. 2017, 7, 28889–28897. [Google Scholar] [CrossRef] [Green Version]
- Li, P.; Wang, Y.; Hou, Q.; Liu, H.; Lei, H.; Jian, B.; Li, X. Preparation of cellulose nanofibrils from okara by high pressure homogenization method using deep eutectic solvents. Cellulose 2020, 27, 2511–2520. [Google Scholar] [CrossRef]
- Yurdakal, S.; Garlisi, C.; Özcan, L.; Bellardita, M.; Palmisano, G. Chapter 4—(Photo)catalyst Characterization Techniques: Adsorption Isotherms and BET, SEM, FTIR, UV–Vis, Photoluminescence, and Electrochemical Characterizations. In Heterogeneous Photocatalysis; Marcì, G., Palmisano, L., Eds.; Elsevier: Amsterdam, The Netherlands, 2019; pp. 87–152. [Google Scholar]
- Mays, T. A new classification of pore sizes. Stud. Surf. Sci. Catal. 2007, 160, 57–62. [Google Scholar]
- Arulepp, M.; Permann, L.; Leis, J.; Perkson, A.; Rumma, K.; Jänes, A.; Lust, E. Influence of the solvent properties on the characteristics of a double layer capacitor. J. Power Sources 2004, 133, 320–328. [Google Scholar] [CrossRef]
- Chang, J.-K.; Wu, C.-M.; Sun, I.W. Nano–architectured Co(OH)2 electrodes constructed using an easily–manipulated electrochemical protocol for high–performance energy storage applications. J. Mater. Chem. 2010, 20, 3729–3735. [Google Scholar] [CrossRef]
- Liang, R.; Wang, G.; Huang, X.; Zhu, L.; Li, S.; Yan, Y.; Zhong, B. Improving the specific capacitance of Ni(OH)2–based supercapacitors by tailoring its porous structures and particle size. Mater. Lett. 2015, 158, 128–131. [Google Scholar] [CrossRef]
- Cherusseri, J.; Sharma, R.; Kar, K.K. Nanotechnology Advancements on Carbon Nanotube/Polypyrrole Composite Electrodes for Supercapacitors. In Handbook of Polymer Nanocomposites. Processing, Performance and Application: Volume B: Carbon Nanotube Based Polymer Composites; Kar, K.K., Pandey, J.K., Rana, S., Eds.; Springer: Berlin/Heidelberg, Germany, 2015; pp. 479–510. [Google Scholar]
- Zhang, C.; Hatzell, K.B.; Boota, M.; Dyatkin, B.; Beidaghi, M.; Long, D.; Qiao, W.; Kumbur, E.C.; Gogotsi, Y. Highly porous carbon spheres for electrochemical capacitors and capacitive flowable suspension electrodes. Carbon 2014, 77, 155–164. [Google Scholar] [CrossRef]
- Van Wazer, J.R.; Griffith, E.J.; McCullough, J.F. Structure and Properties of the Condensed Phosphates. VII. Hydrolytic Degradation of Pyro– and Tripolyphosphate. J. Am. Chem. Soc. 1955, 77, 287–291. [Google Scholar] [CrossRef]
- Ryan, L.M.; Kozin, F.; Mccarty, D.J. Quantification of human plasma inorganic pyrophosphate. Arthritis Rheum. 1979, 22, 886–891. [Google Scholar] [CrossRef] [PubMed]
- Schrödter, K.; Bettermann, G.; Staffel, T.; Wahl, F.; Klein, T.; Hofmann, T. Phosphoric Acid and Phosphates. In Ullmann’s Encyclopedia of Industrial Chemistry; Wiley-VCH: Weinheim, Germany, 2008. [Google Scholar]
- Qu, D. The ac impedance studies for porous MnO2 cathode by means of modified transmission line model. J. Power Sources 2001, 102, 270–276. [Google Scholar] [CrossRef]
- Chen, L.-F.; Huang, Z.H.; Liang, H.-W.; Guan, Q.-F.; Yu, S.H. Bacterial–Cellulose–Derived Carbon Nanofiber@MnO2 and Nitrogen–Doped Carbon Nanofiber Electrode Materials: An Asymmetric Supercapacitor with High Energy and Power Density. Adv. Mater. 2013, 25, 4746–4752. [Google Scholar] [CrossRef]
- Rajagopalan, B.; Chung, J.S. Reduced chemically modified graphene oxide for supercapacitor electrode. Nanoscale Res. Lett. 2014, 9, 535. [Google Scholar] [CrossRef]


| Element | Atomic Weight (%) | ||
|---|---|---|---|
| Co2P2O7@400 | Co2P2O7@600 | Co2P2O7@800 | |
| C (K) | 18.5 ± 0.3% | 16.9 ± 0.4% | 7.3 ± 0.3% |
| O (K) | 54.3 ± 0.4% | 53.8 ± 0.5% | 57.2 ± 0.5% |
| P (K) | 13.9 ± 0.2% | 15.9 ± 0.3% | 16.8 ± 0.3% |
| Co (K) | 13.3 ± 0.3% | 13.5 ± 0.4% | 18.7 ± 0.5% |
| Samples | BET Specific Surface Area (m2g−1) | Mesopore Analysis | Micropore Analysis | ||||
|---|---|---|---|---|---|---|---|
| Pore Specific Surface Area (m2g−1) | Pore Volume (cm3 g−1) | Average Pore Diameter (nm) | Pore Specific Surface Area (m2g−1) | Pore Volume (cm3 g−1) | Average Pore Diameter (nm) | ||
| Co2P2O7/CNFs@400 | 13.4 | 18.8 | 0.0335 | 7.55 | 10.8 | 0.0227 | 1.9 |
| Co2P2O7/CNFs@600 | 25.8 | 25.8 | 0.0734 | 11.4 | 27.2 | 0.0660 | 1.5 |
| Co2P2O7/CNFs@800 | 17.5 | 21.4 | 0.0979 | 18.4 | 11.9 | 0.0295 | 1.3 |
Publisher’s Note: MDPI stays neutral with regard to jurisdictional claims in published maps and institutional affiliations. |
© 2021 by the authors. Licensee MDPI, Basel, Switzerland. This article is an open access article distributed under the terms and conditions of the Creative Commons Attribution (CC BY) license (https://creativecommons.org/licenses/by/4.0/).
Share and Cite
Wannasen, L.; Mongkolthanaruk, W.; Swatsitang, E.; Pavasant, P.; Pinitsoontorn, S. Co2P2O7 Microplate/Bacterial Cellulose–Derived Carbon Nanofiber Composites with Enhanced Electrochemical Performance. Nanomaterials 2021, 11, 2015. https://doi.org/10.3390/nano11082015
Wannasen L, Mongkolthanaruk W, Swatsitang E, Pavasant P, Pinitsoontorn S. Co2P2O7 Microplate/Bacterial Cellulose–Derived Carbon Nanofiber Composites with Enhanced Electrochemical Performance. Nanomaterials. 2021; 11(8):2015. https://doi.org/10.3390/nano11082015
Chicago/Turabian StyleWannasen, Likkhasit, Wiyada Mongkolthanaruk, Ekaphan Swatsitang, Prasert Pavasant, and Supree Pinitsoontorn. 2021. "Co2P2O7 Microplate/Bacterial Cellulose–Derived Carbon Nanofiber Composites with Enhanced Electrochemical Performance" Nanomaterials 11, no. 8: 2015. https://doi.org/10.3390/nano11082015