
Enhanced Solar Efficiency via Incorporation of Plasmonic Gold Nanostructures in a Titanium Oxide/Eosin Y Dye-Sensitized Solar Cell

 , , and
Abstract
: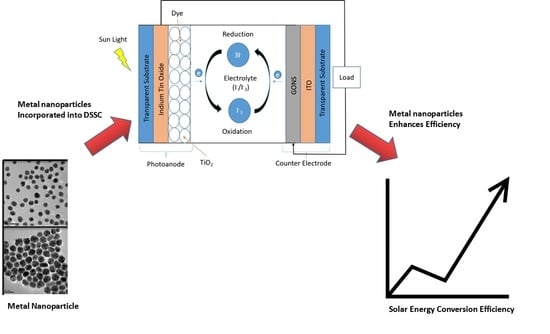
1. Introduction
2. Materials and Methods
2.1. Synthesis of Gold Nanoparticles (AuNPs) with Different Sizes
2.2. Synthesis of Au/TiO2 Nanocomposite
2.3. Fabrication of Au/TiO2 Customized Photoanode
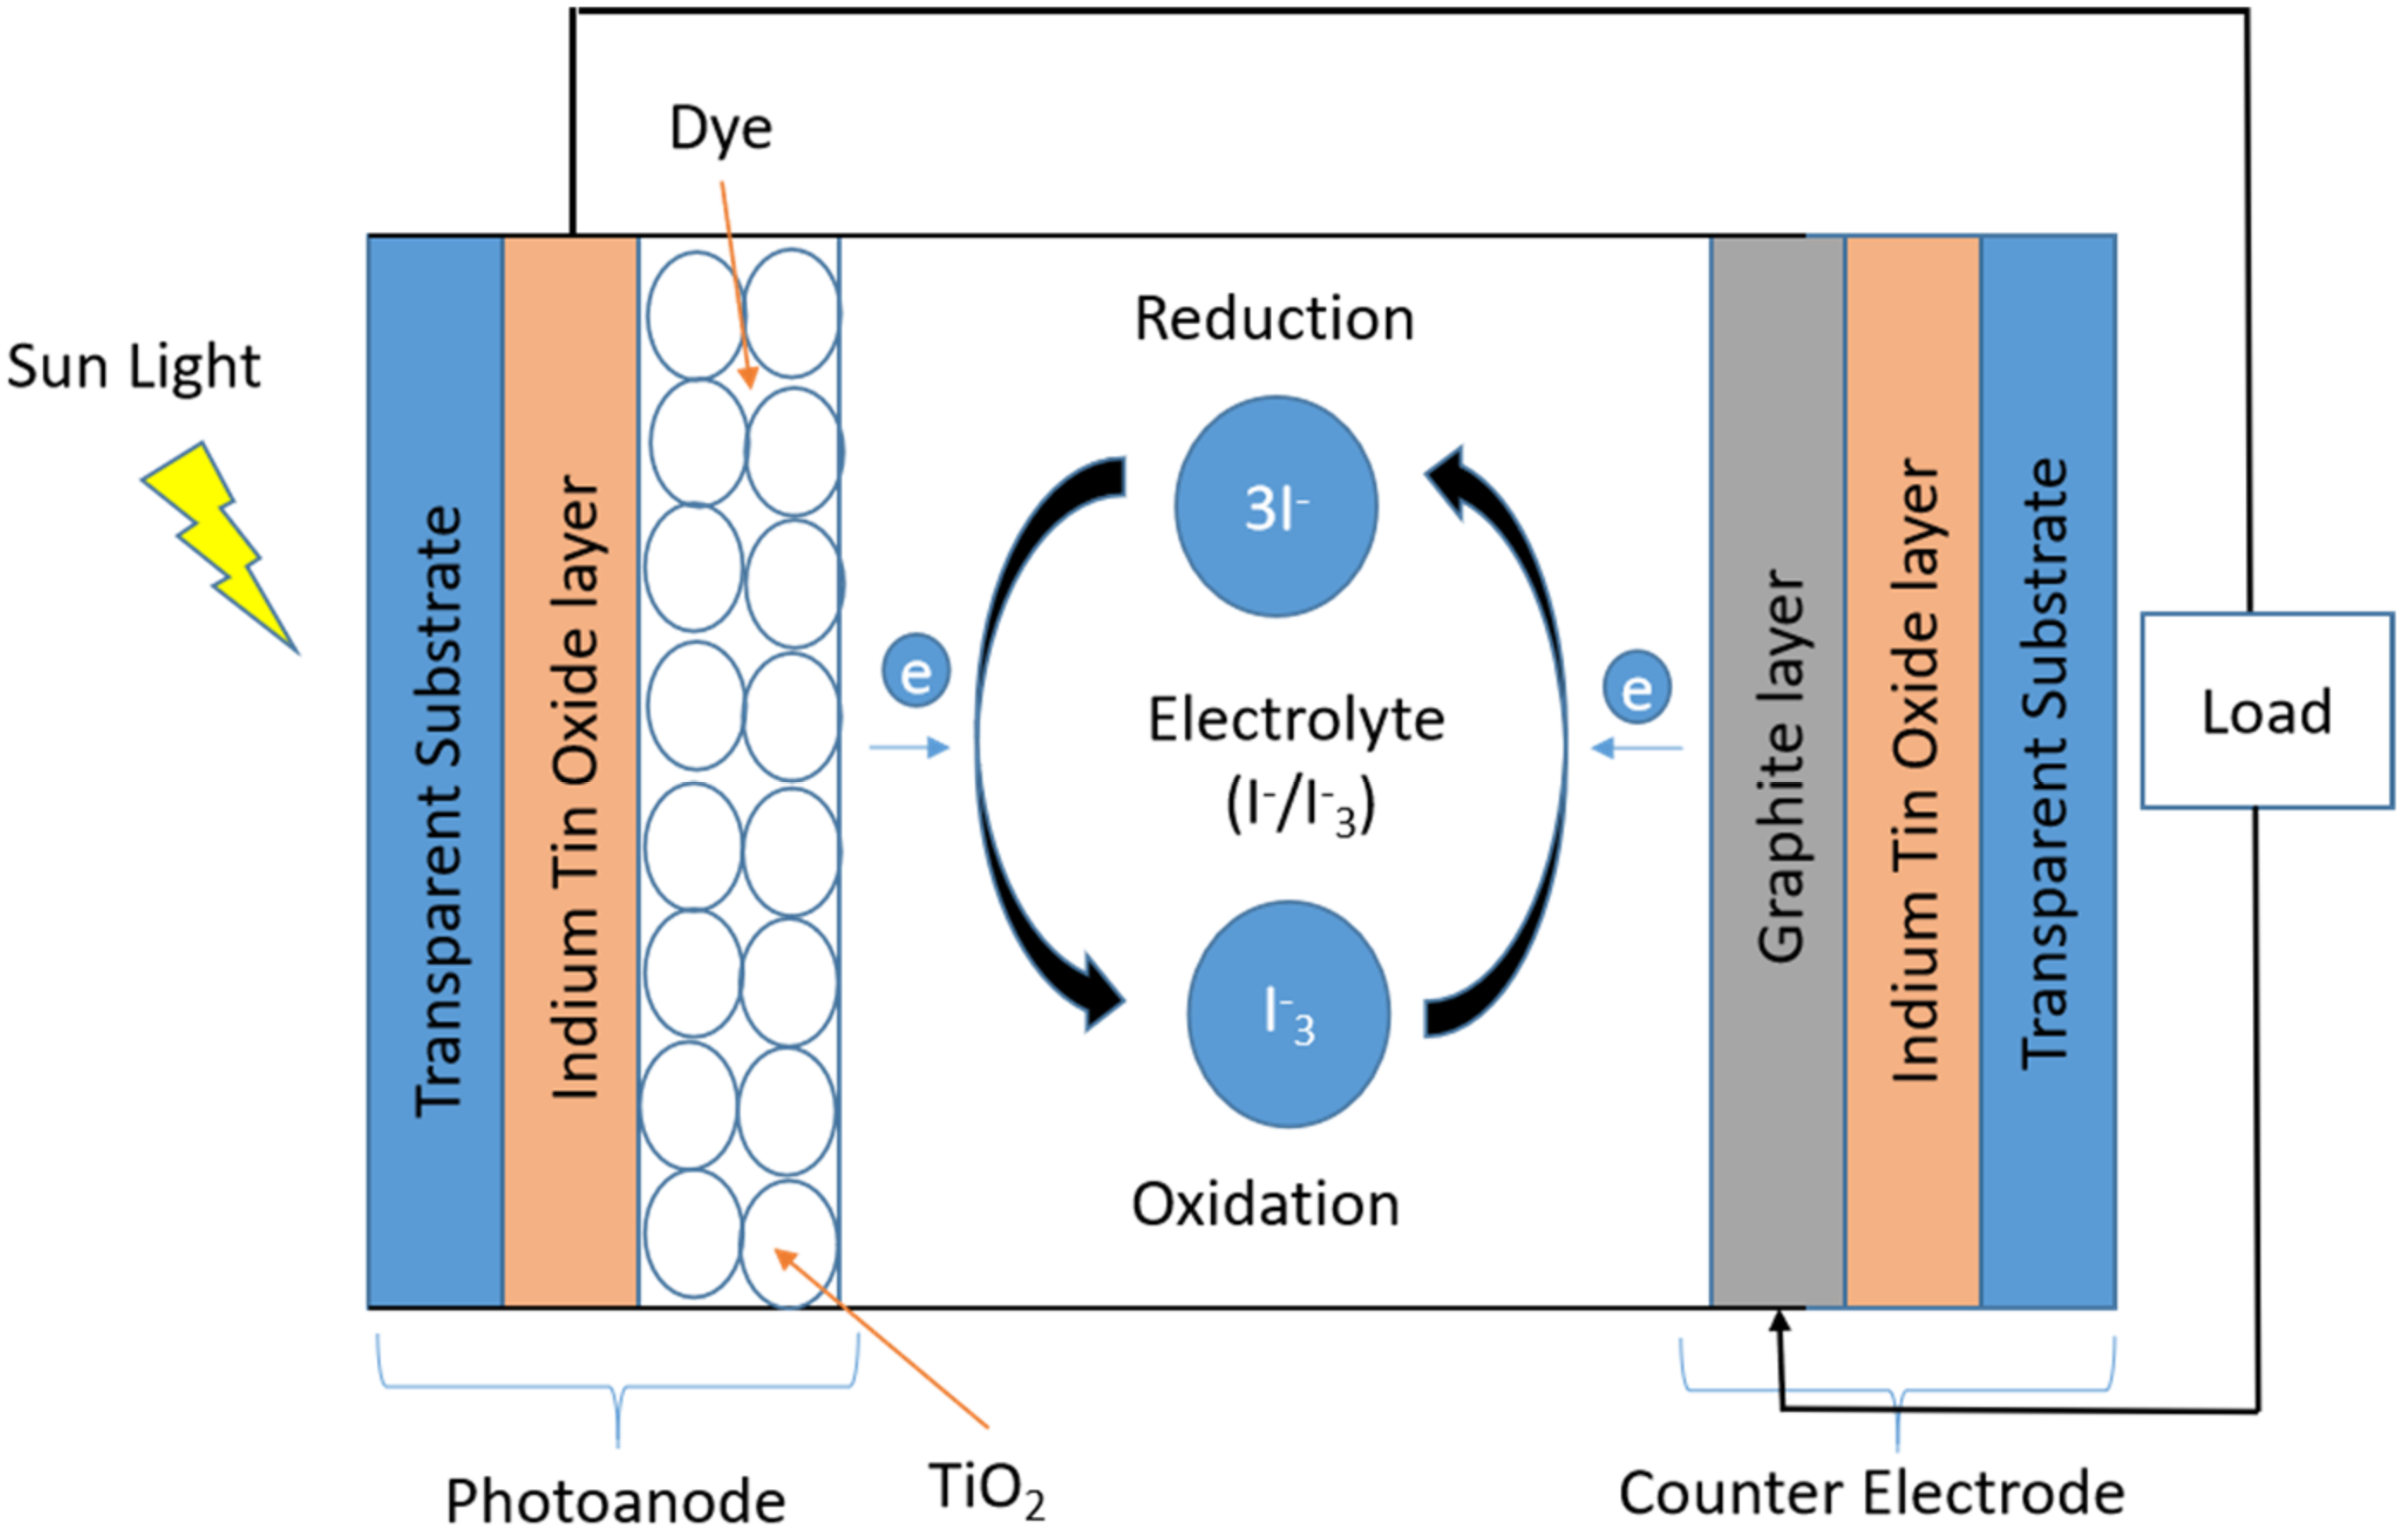
2.4. Fabrication of Dye-Sensitized Solar Cell and Testing
3. Results
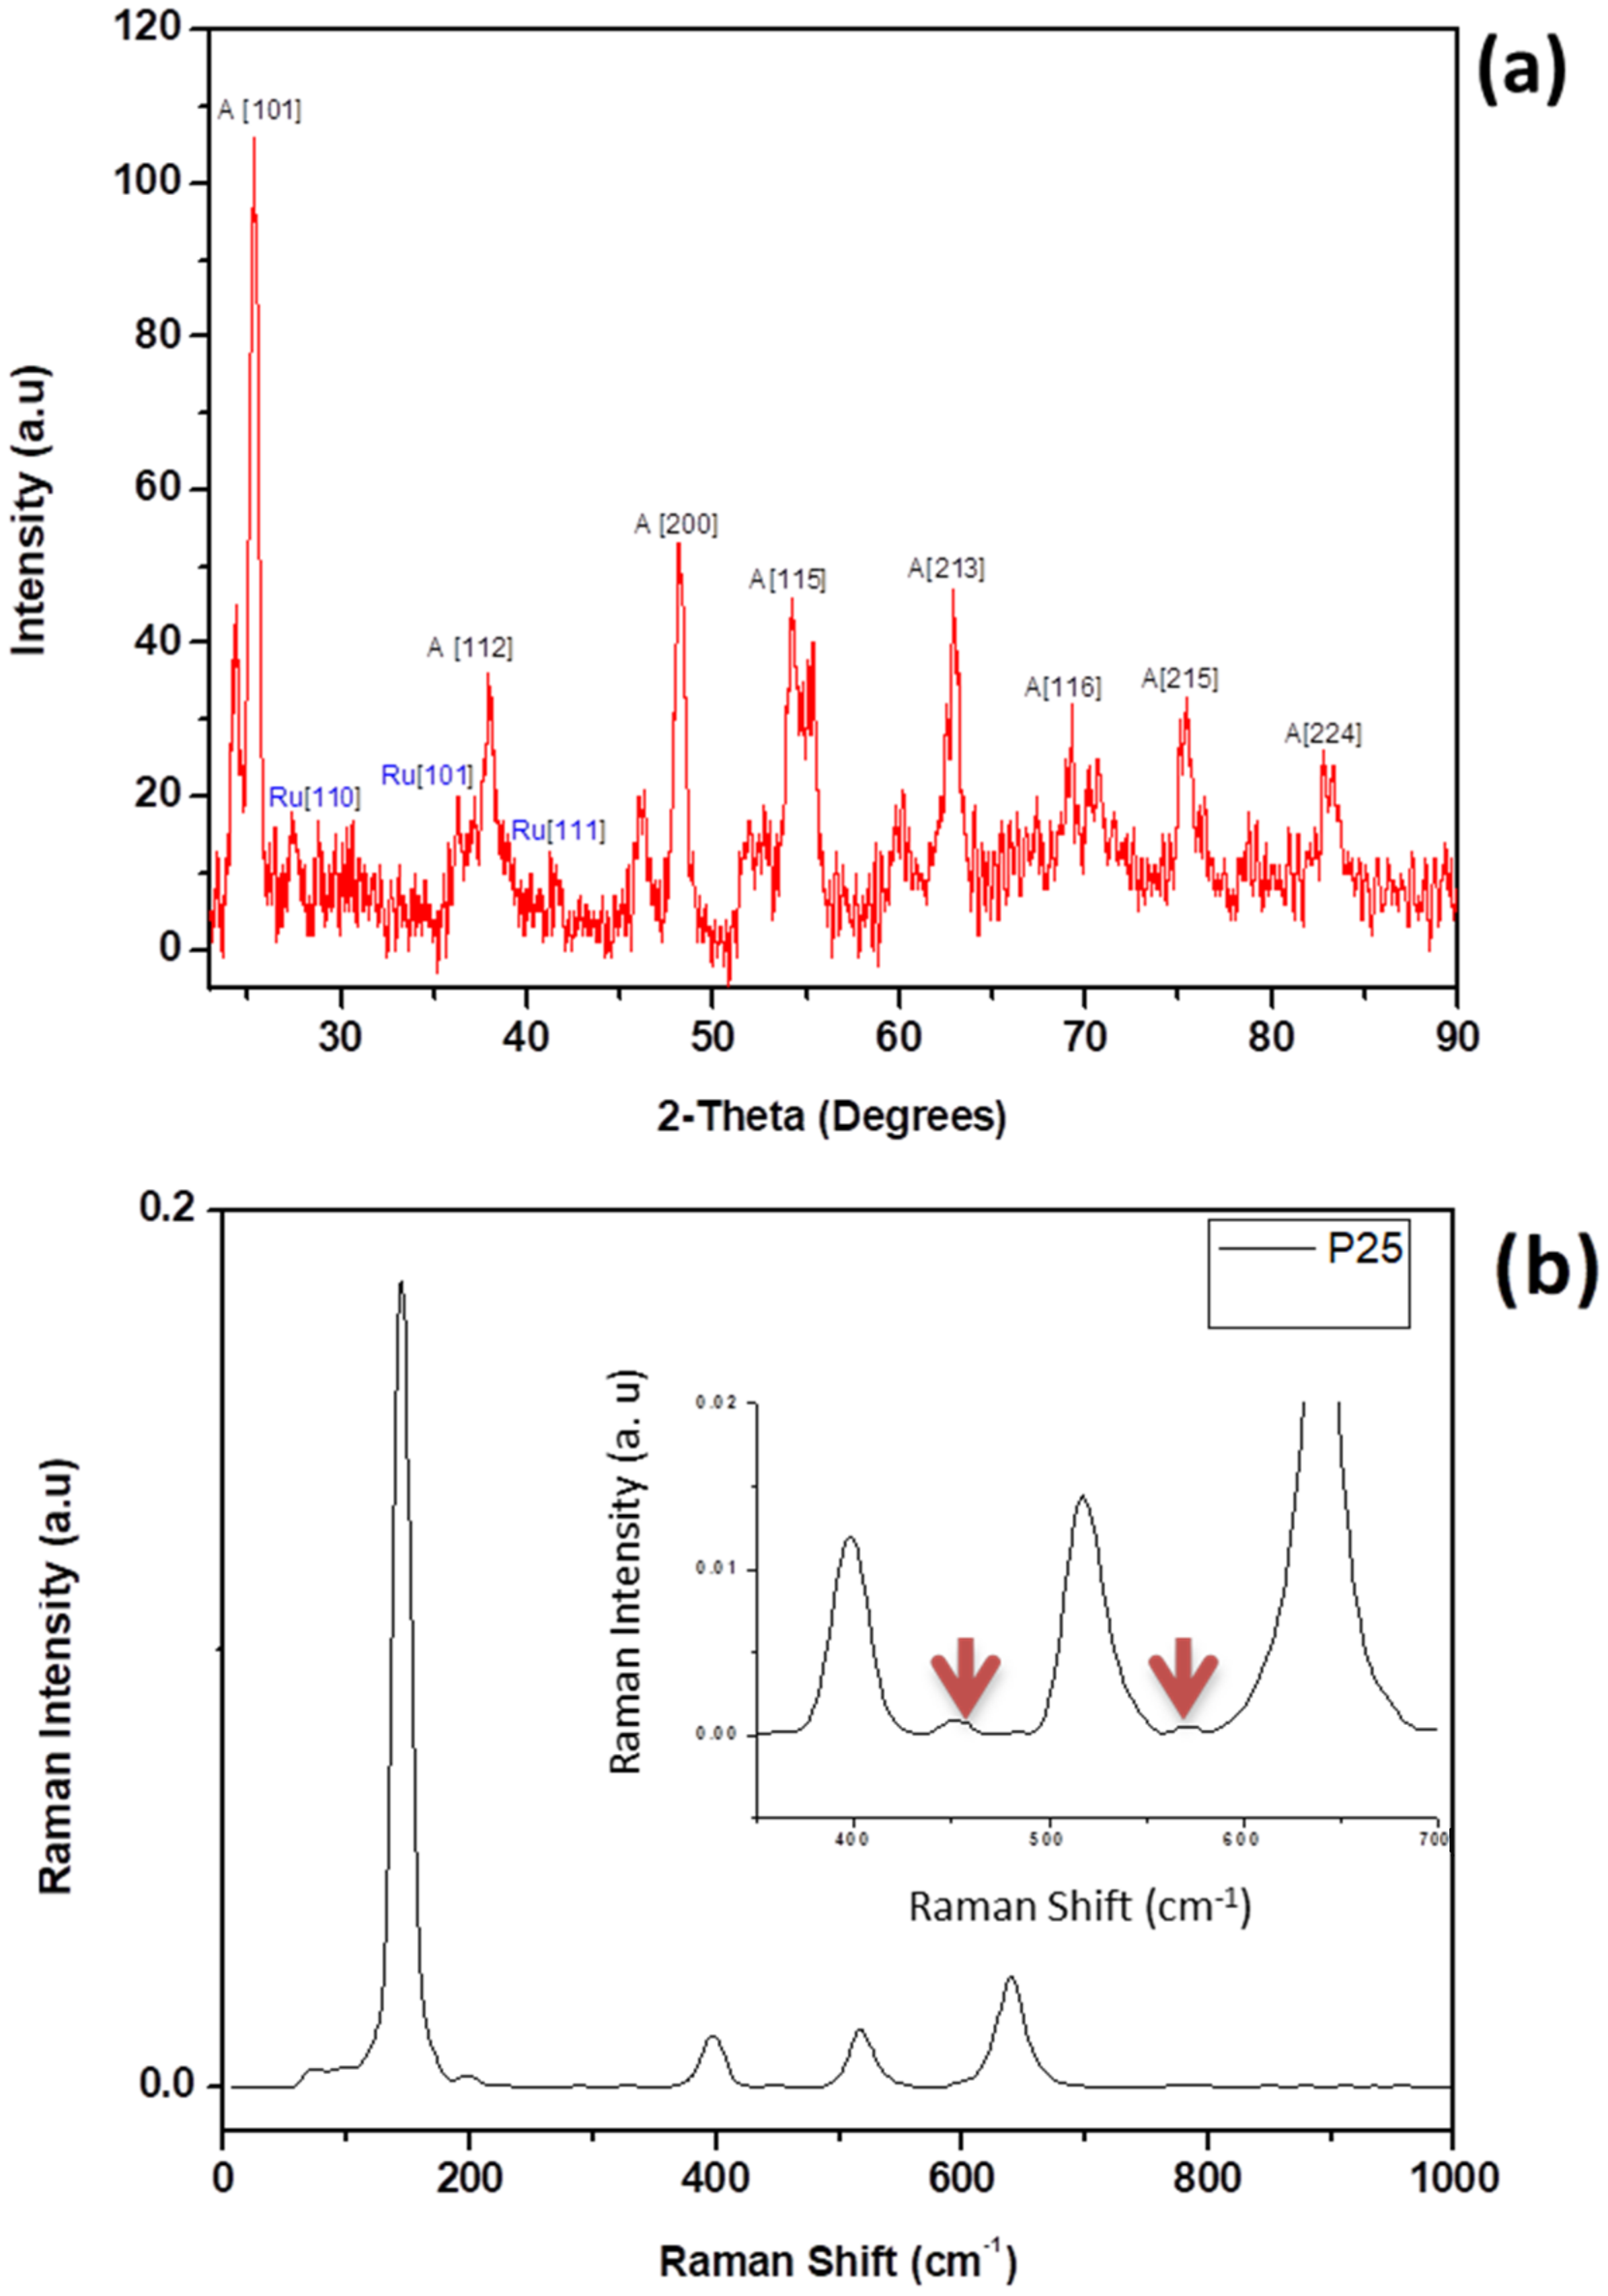
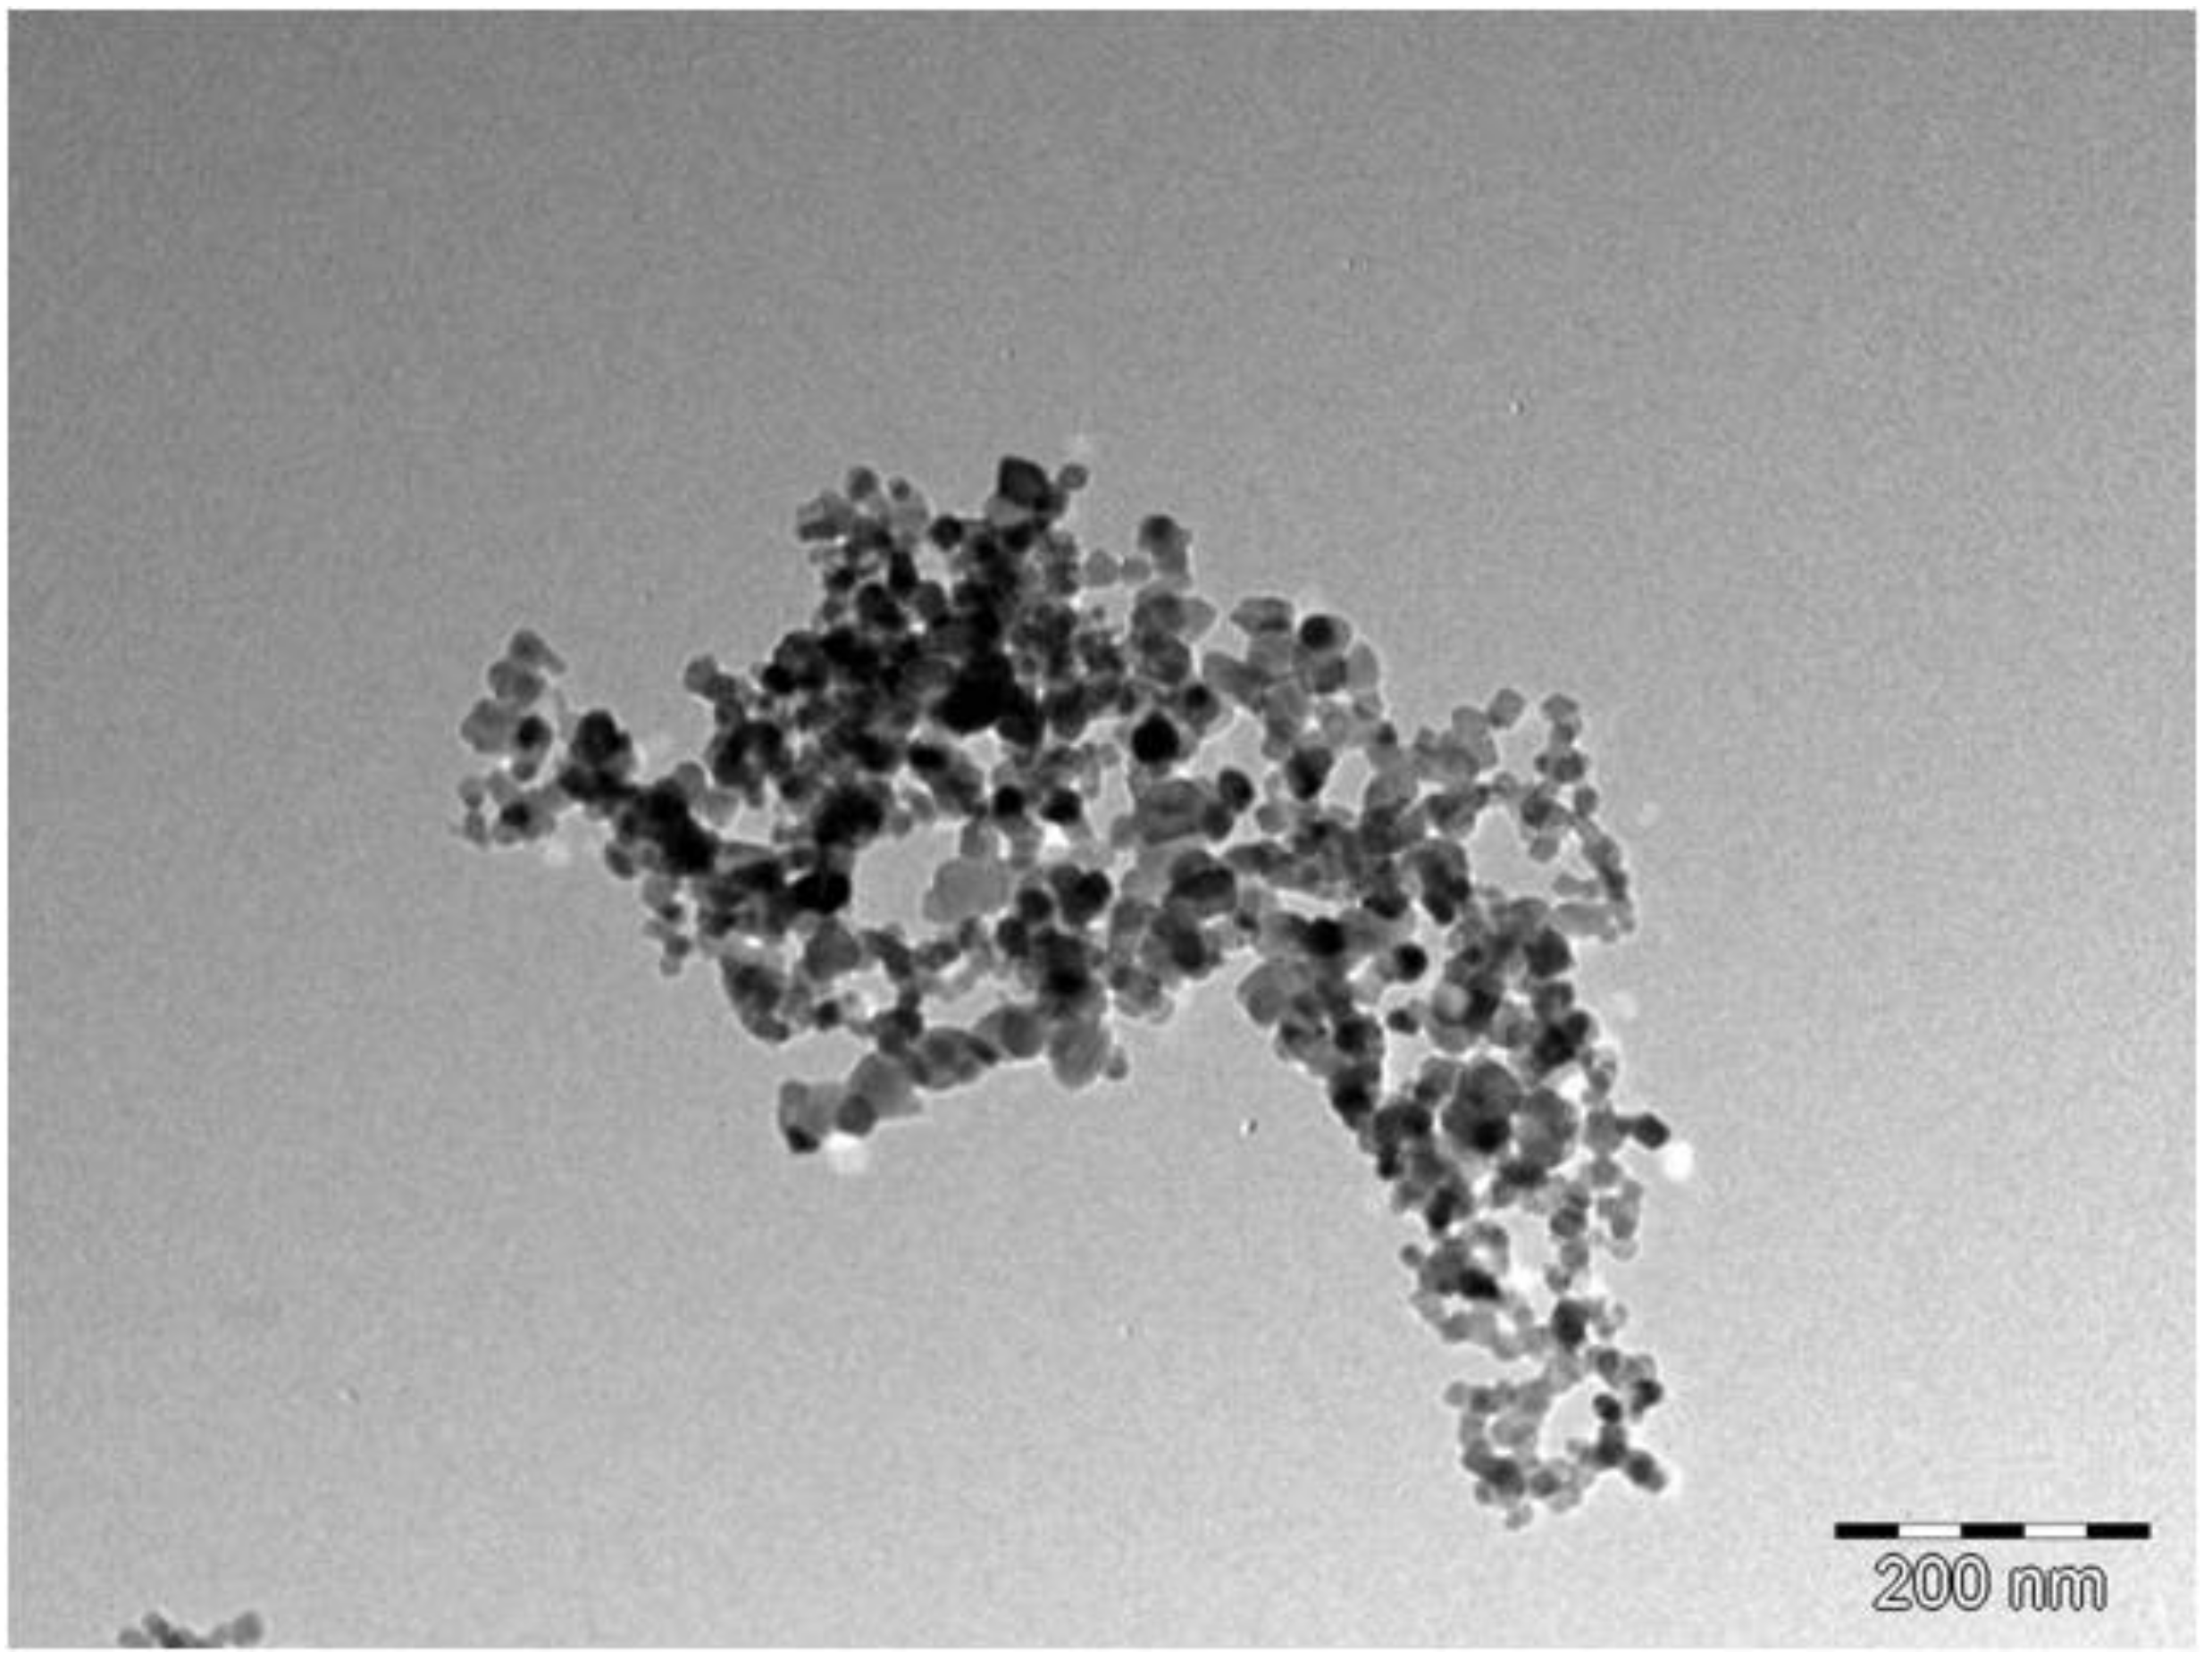
3.1. Physical and Structural Properties of TiO2 Nanoparticles
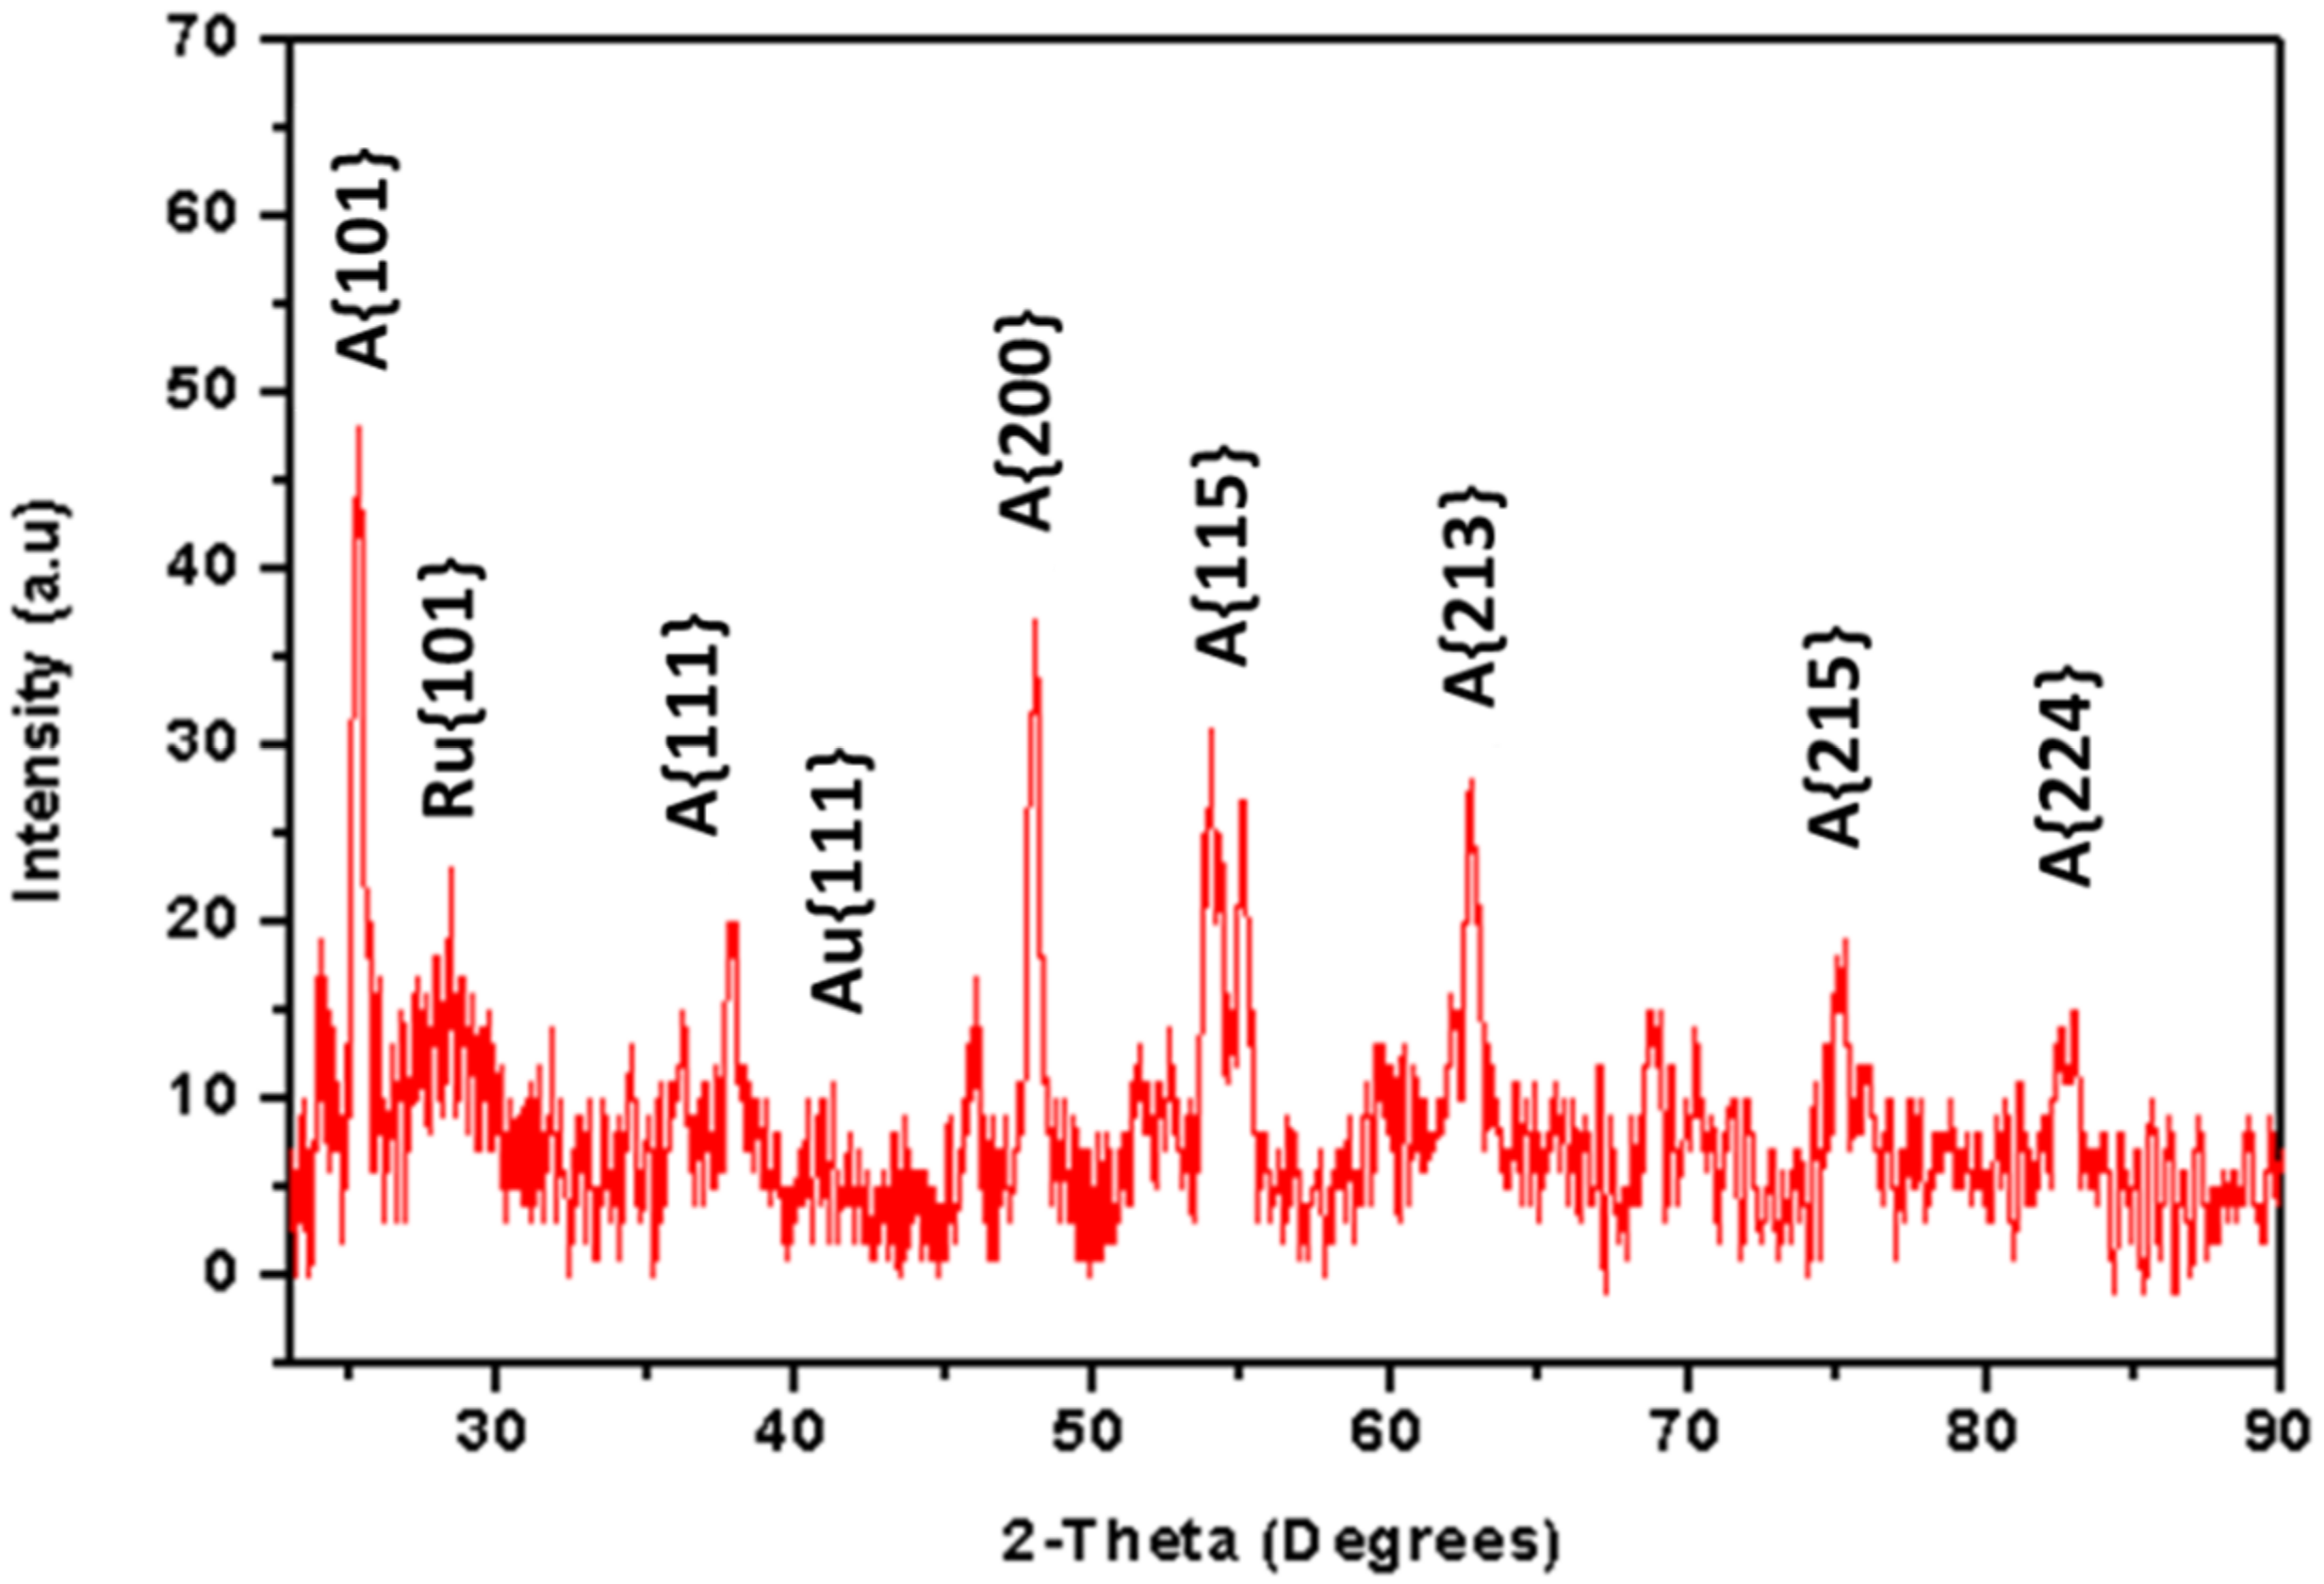
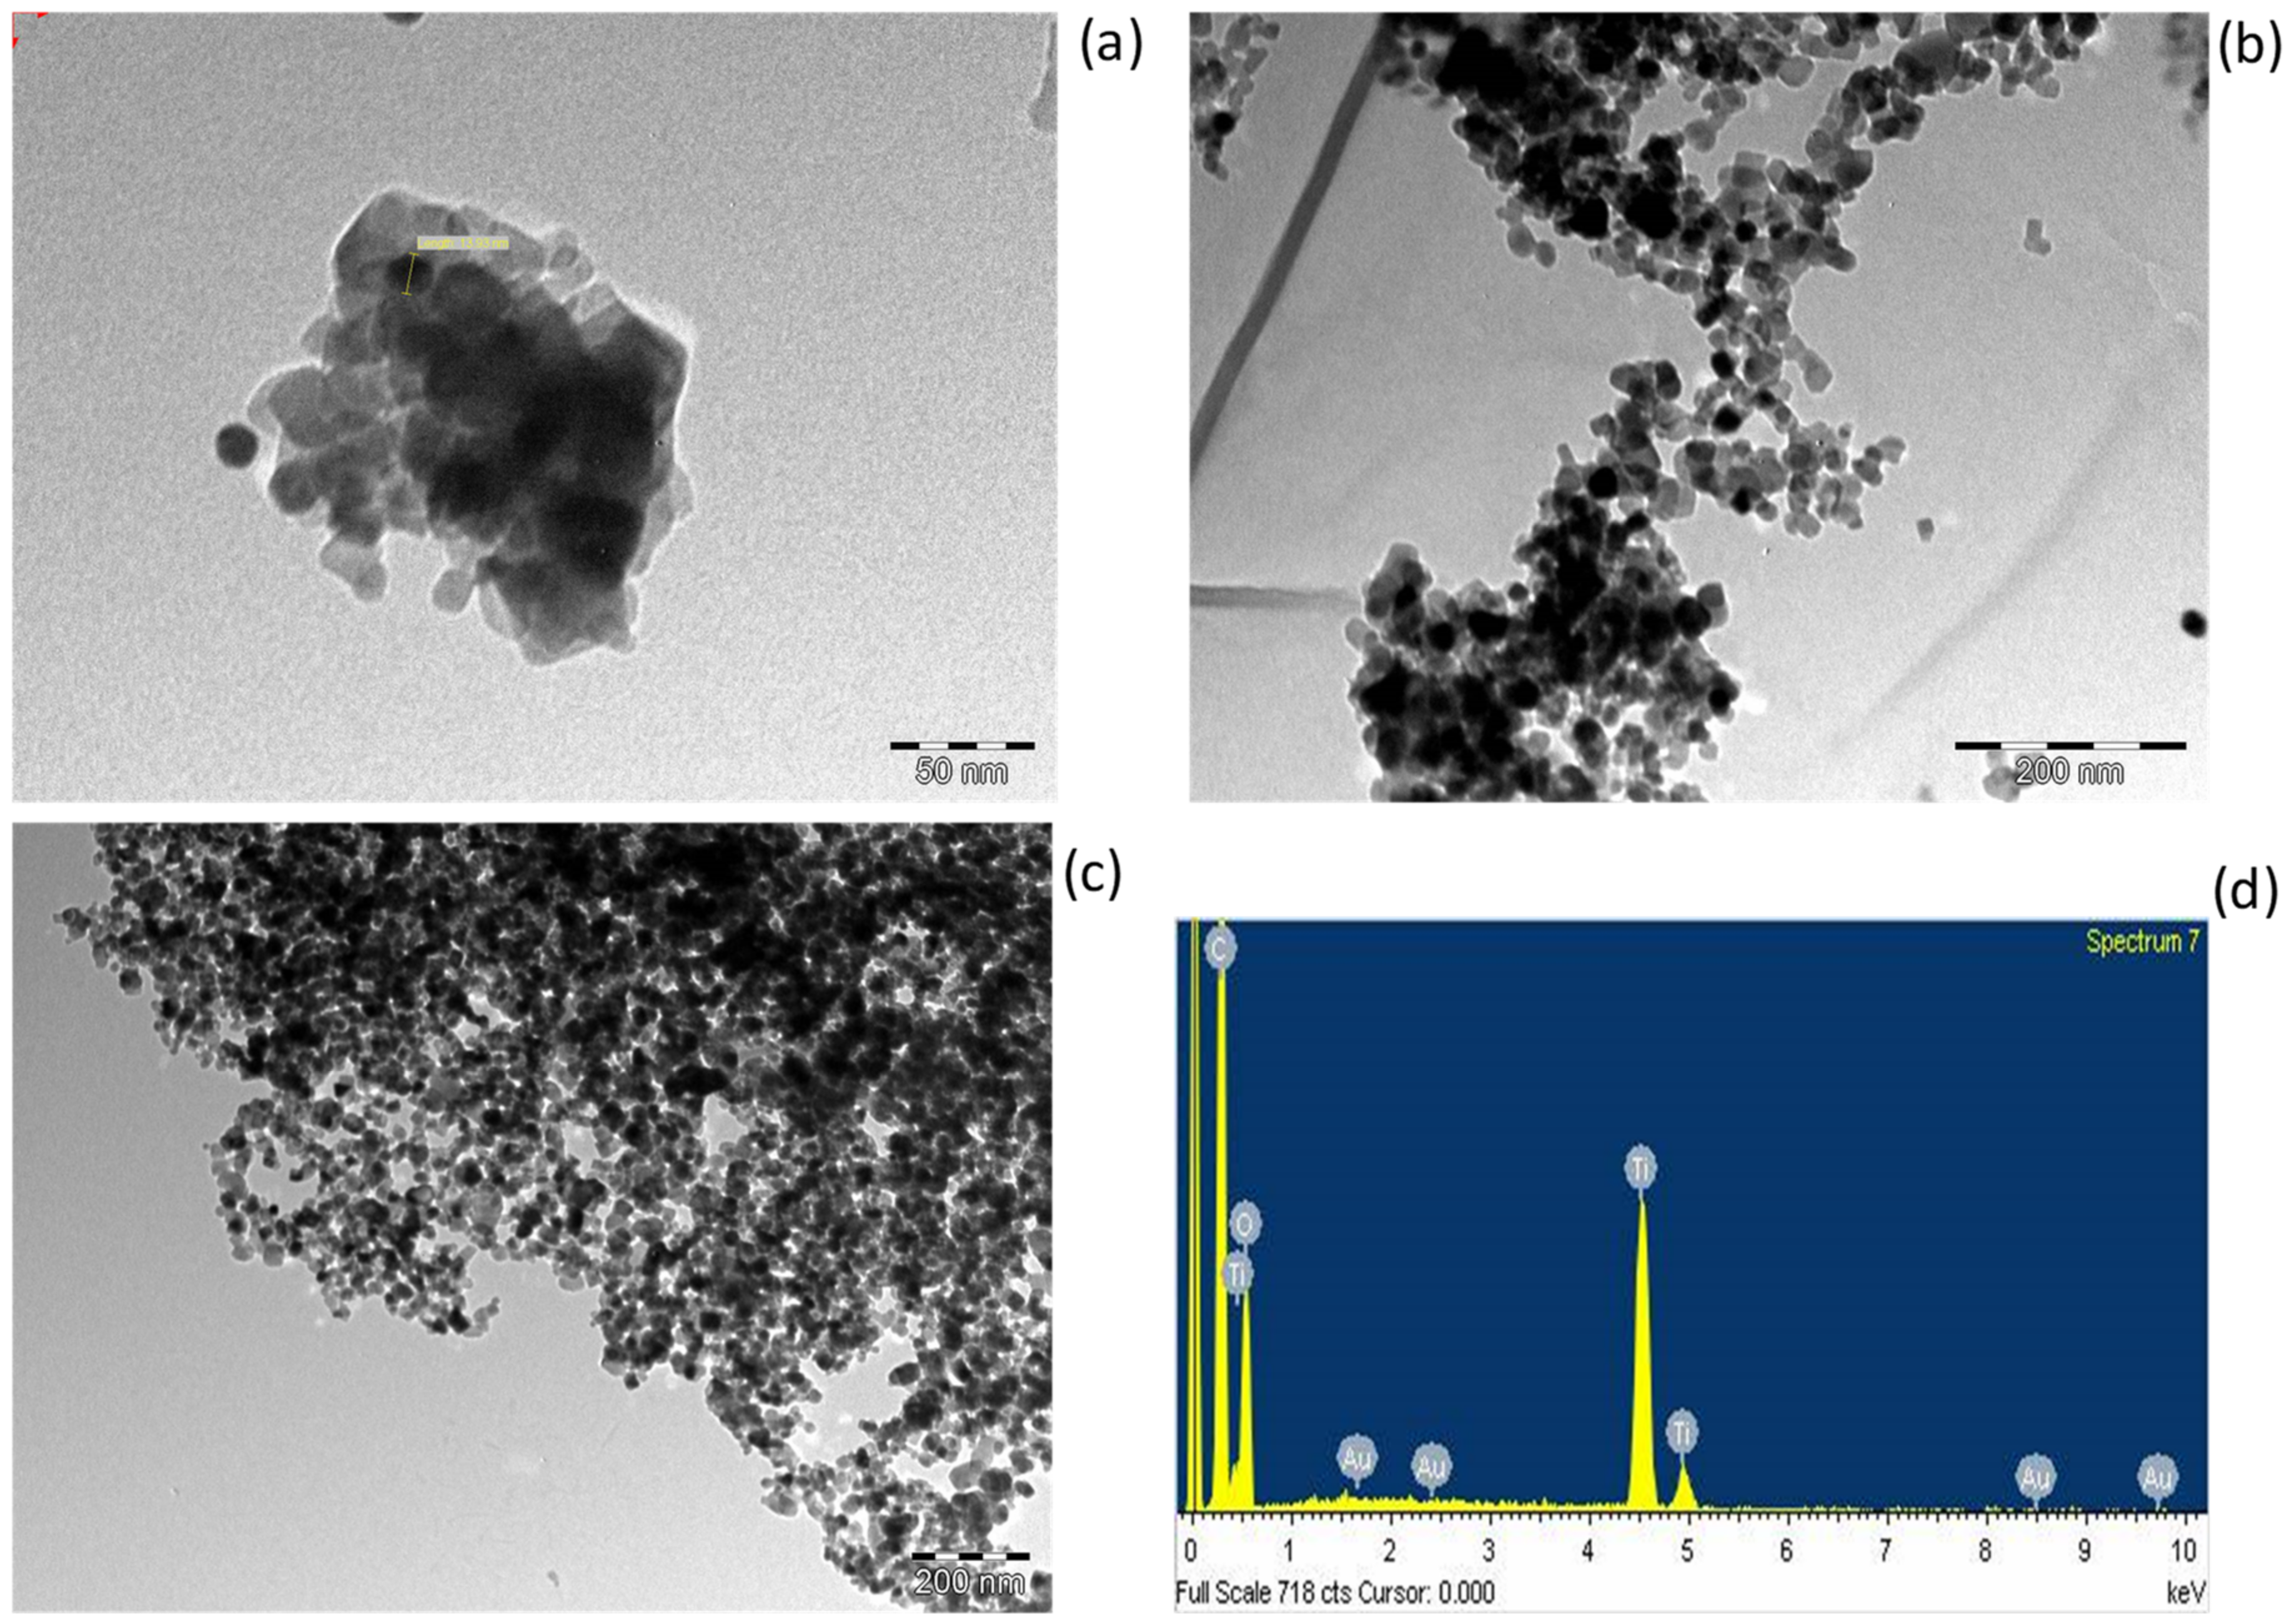
3.2. Physical and Structural Properties of Au/TiO2 Nanocomposite
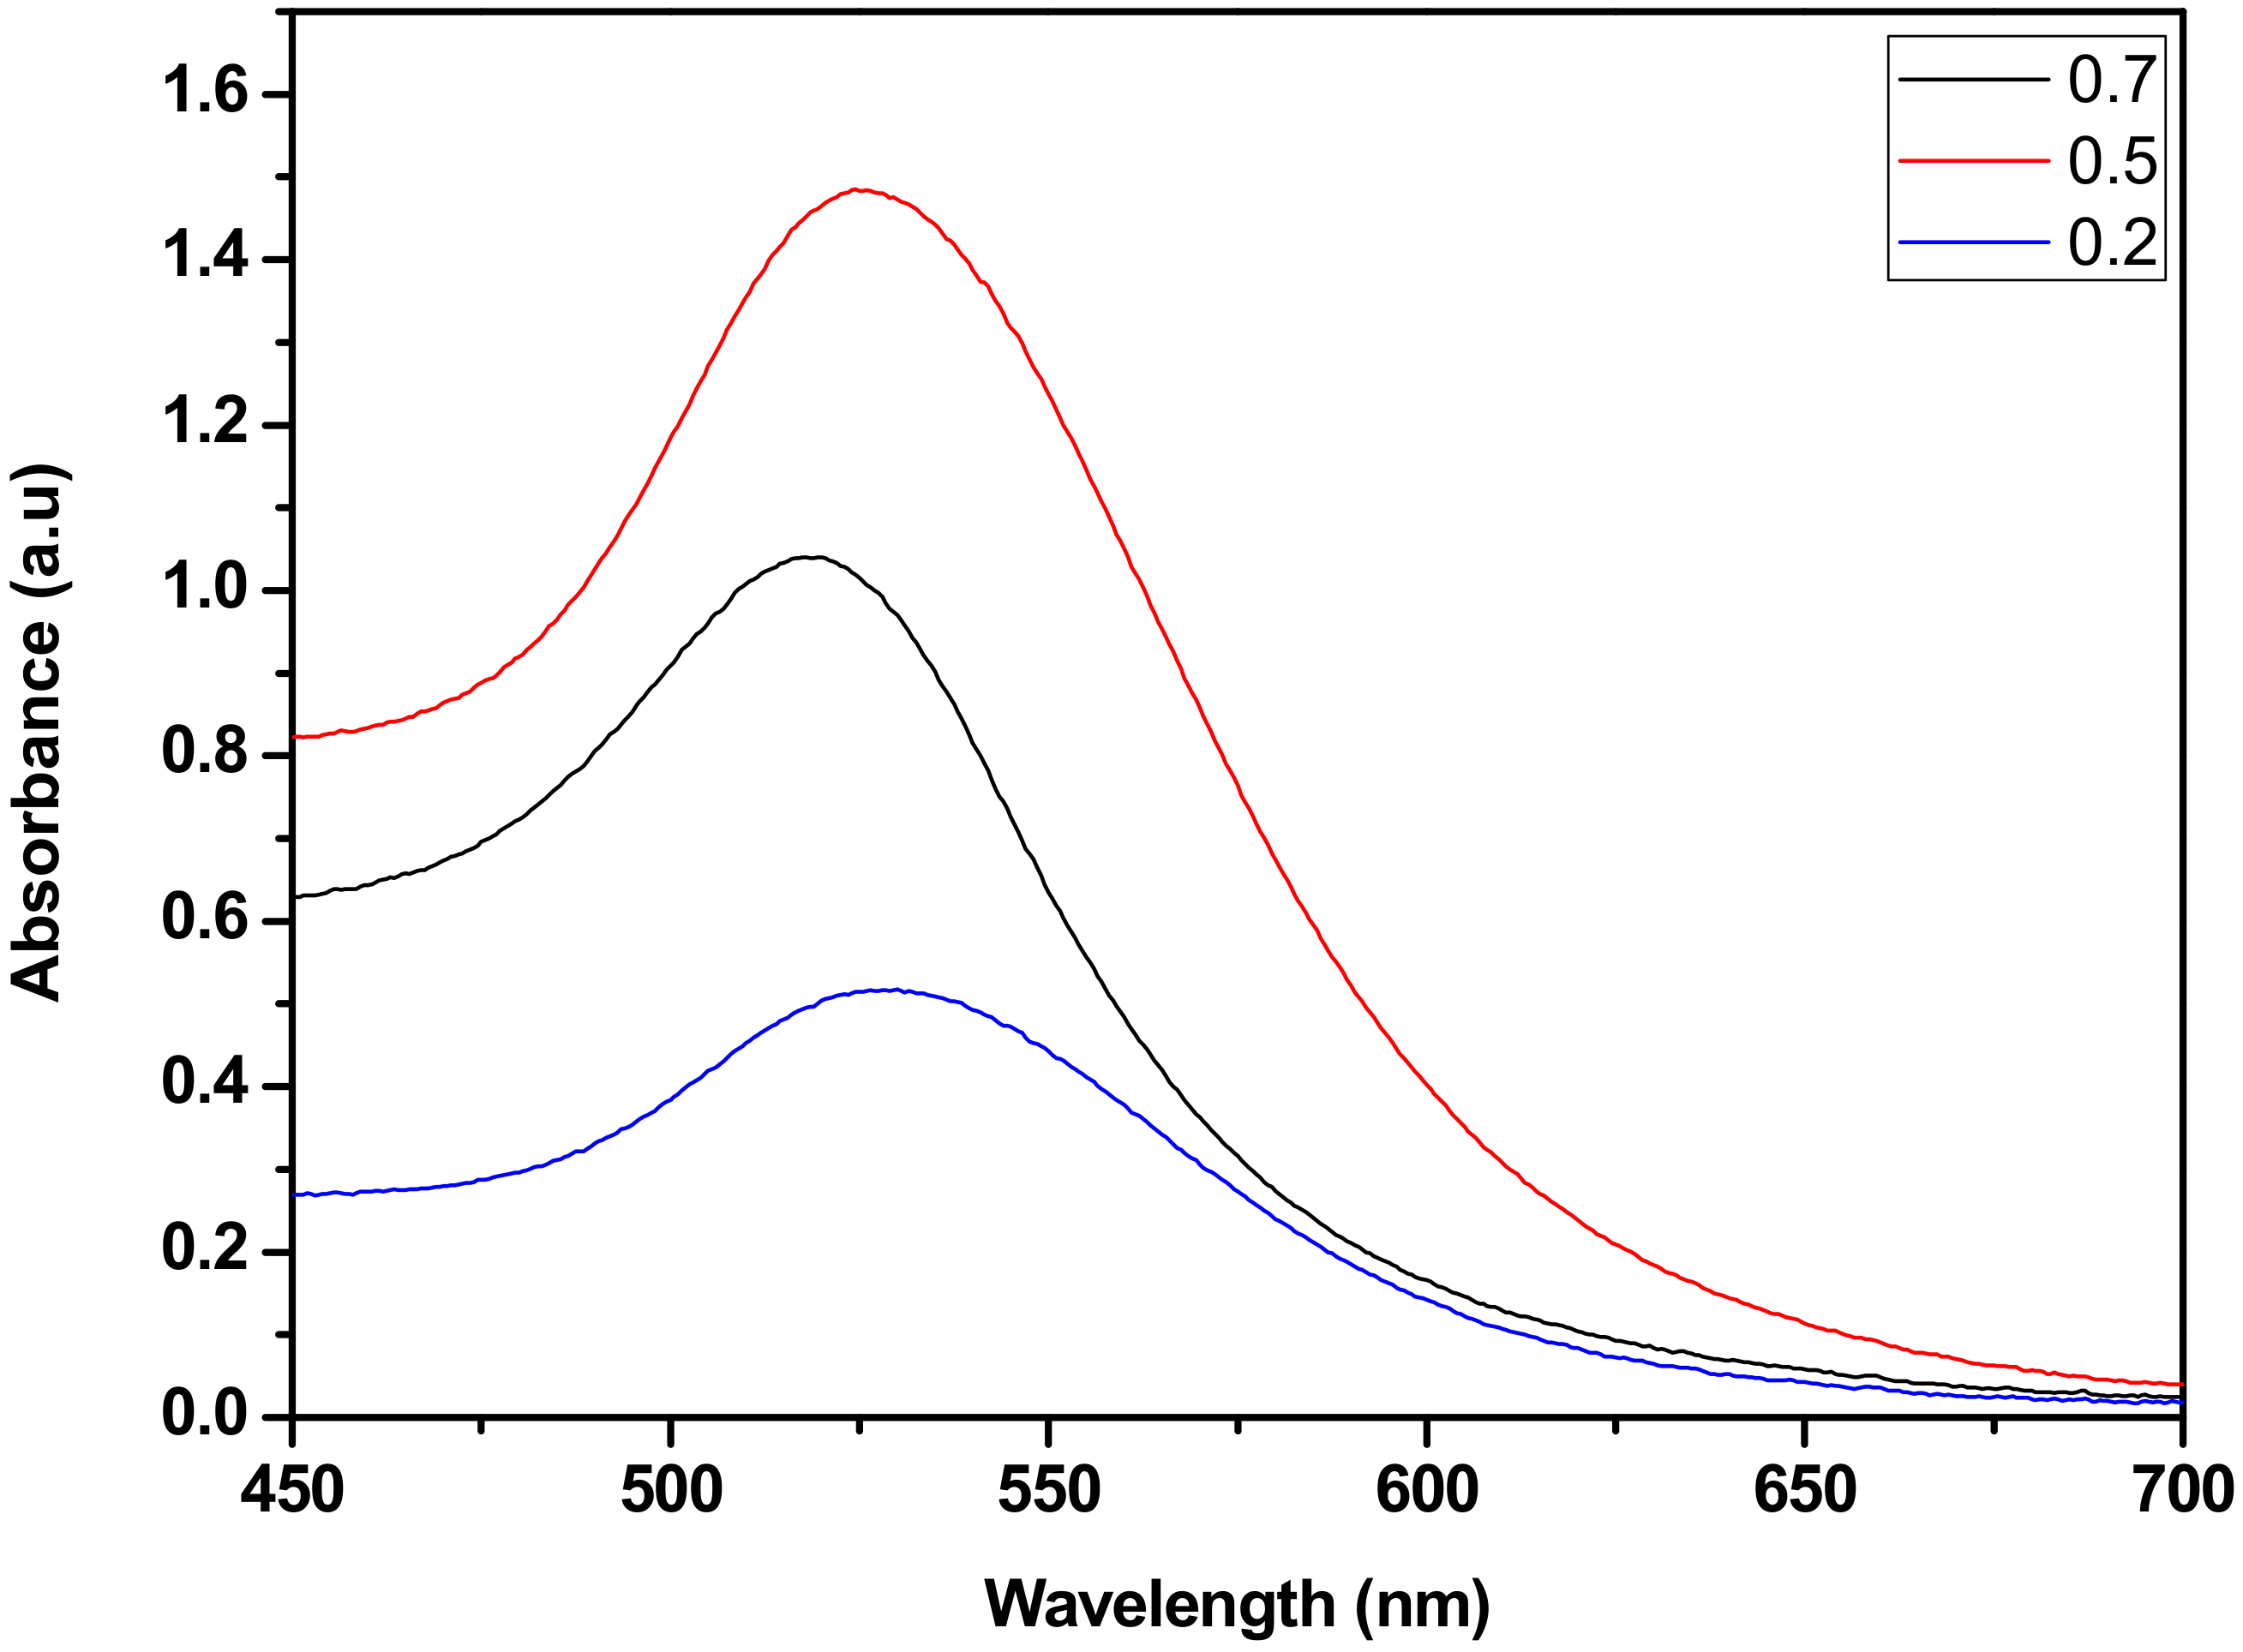
3.3. The Plasmonic Gold Nanopaticles Induced Effects on the Solar Conversion Efficiency
4. Conclusions
Author Contributions
Funding
Institutional Review Board Statement
Informed Consent Statement
Data Availability Statement
Acknowledgments
Conflicts of Interest
References
- Tsoskounoglou, M.; Ayerides, G.; Tritopoulou, E. The end of cheap oil: Current status and prospects. Energy Policy 2008, 36, 3797–3806. [Google Scholar] [CrossRef]
- Energy Information Association International Energy Outlook 2010. Available online: http://www.eia.doe.gov/ (accessed on 15 January 2022).
- Heinberg, R.; Fridley, D. The end of cheap coal. Nature 2010, 468, 367–369. [Google Scholar] [CrossRef] [PubMed]
- Pearce, J.; Lau, A. Net Energy Analysis for Sustainable Energy Production from Silicon Based Solar Cells. In Proceedings of the ASME Solar 2002: International Solar Energy Conference, Reno, NV, USA, 15–20 June 2002; pp. 181–186. [Google Scholar]
- Lim, S.P.; Pandikumar, A.; Huang, N.; Lim, H.R. Facile synthesis of Au@TiO2 nanocomposite and its application as a photoanode in dye-sensitized solar cells. Soc. Chem. 2015, 5, 44398–44399. [Google Scholar] [CrossRef]
- Chen, X.; Mao, S.S. Titanium dioxide nanomaterials: Synthesis, properties, modifications and applications. Chem. Rev. 2007, 107, 2891–2959. [Google Scholar] [CrossRef] [PubMed]
- O’Regan, B.; Gratzel, M. A low-cost, high-efficiently solar cell based on dye-sensitized colloidal TiO2 films. Nature 1991, 353, 445–449. [Google Scholar]
- Wang, R.; Mujahid, M.; Duan, Y.; Wang, Z.-K.; Xue, J.; Yang, Y. A Review of Perovskites Solar Cell Stability. Adv. Funct. Mater. 2019, 29, 1808843. [Google Scholar] [CrossRef]
- Giordano, F.; Abate, A.; Correa Baena, J.P. Enhanced electronic properties in mesoporous TiO2 via lithium doping for high-efficiency perovskite solar cells. Nat. Commun. 2016, 7, 10379–10380. [Google Scholar] [CrossRef] [PubMed]
- Burschka, N.J.; Pellet, S.; Moon, S.-J. Sequential deposition as a route to high-performance perovskite-sensitized solar cells. J. Nature 2013, 499, 316–319. [Google Scholar] [CrossRef] [PubMed]
- Kopidakis, N.; Neale, N.R.; Zhu, K.; van de Lagemaat, J.; Frank, A.J. Spatial location of transport-limiting traps in TiO2 nanoparticles films in dye-sensitized solar cells. Appl. Phys. Lett. 2005, 87, 202106–202110. [Google Scholar] [CrossRef]
- Van de Lagemaat, J.; Park, N.G.; Frank, A. Influence of electrical potential distribution, charge transport and recombination on the photopotential and photocurrent conversion efficiency of dye-sensitized nanocrystalline TiO2 solar cells: A study by electrical impedance and optical modulation techniques. J. Phys. Chem. B 2000, 104, 2044–2052. [Google Scholar]
- Jun, H.K.; Careem, M.A.; Arof, A.K. Plasmonic effects of quantum size gold nanoparticles on dye-sensitized solar cell. In Proceedings of the 5th International Conference on Functional Materials & Devices (ICFMD), London, UK, 4–6 August 2015; pp. 73–79. [Google Scholar]
- Hägglund, C.; Zäch, M.; Kasemo, B. Electromagnetic coupling of light into a silicon solar cell by nanodisk plasmons. Appl. Phys. Lett. 2008, 92, 013113–013118. [Google Scholar] [CrossRef]
- Schaadt, D.M.; Feng, B.; Yu, E.T. Enhanced semiconductor optical absorption via surface plasmon excitation in metal nanoparticles. Appl. Phys. Lett. 2005, 86, 063106–063108. [Google Scholar] [CrossRef]
- De Sousa, S.; Lyu, S.; Ducasse, L.; Toupance, T.; Olivier, C. Tuning visible-light absorption properties of Ru–diacetylide complexes: Simple access to colorful efficient dyes for DSSCs. J. Mater. Chem. A 2015, 3, 18256–18264. [Google Scholar] [CrossRef]
- Akila, Y.; Muthukumarasamy, N.; Velauthapillai, D. TiO2-based dye-sensitised solar cells. In Nanomaterials for Solar Cell Applications; Thomas, S., Kalarikkal, N., Wu, J., Oluwafemi, S.O., Sakho, E.H.M., Eds.; Elsevier: Amsterdam, The Netherlands, 2019; pp. 127–144. [Google Scholar]
- Furube, A.; Du, L.; Hara, K.; Katoh, R.; Tachiya, M. Ultrafast plasmon induced electron transfer from gold nanodots into TiO2 nanoparticles. J. Am. Chem. Soc. 2007, 129, 14852–14853. [Google Scholar] [CrossRef] [PubMed]
- Cushing, S.K.; Li, J.; Bright, J.; Yost, B.T.; Zheng, P.; Bristow, A.; Wu, N. Controlling plasmon-induced resonance energy transfer and hot electron injection processes in metal@TiO2 core-shell nanoparticle. J. Phys. Chem. 2015, 119, 16239–16244. [Google Scholar] [CrossRef]
- Brongersma, M.L.; Halas, N.J.; Nordlander, P. Plasmon-induced hot carrier science and technology. Nat. Nanotechnol. 2015, 10, 25–34. [Google Scholar] [CrossRef] [PubMed]
- Wang, Q.; Butburee, T.; Wu, X.; Chen, H.; Liu, G.; Wang, L. Enhanced performance of dye-sensitized solar cells by doping Au nanoparticles into photoanodes: A size effect study. J. Mater. Chem. A 2013, 1, 13524–13531. [Google Scholar] [CrossRef]
- Saravanan, S.; Kato, R.; Balamurugan, M.; Kaushik, S.; Soga, T. Efficiency improvement in dye sensitized solar cells by the plasmonic effect of green synthesized silver nanoparticles. J. Sci. Adv. Mater. Devices 2017, 2, 418–424. [Google Scholar] [CrossRef]
- Turkevich, J.; Stevenson, P.C.; Hillier, J. A study of the nucleation and growth processes in the synthesis of colloidal gold. Discuss. Faraday Soc. 1951, 11, 55–75. [Google Scholar] [CrossRef]
- Chander, N.; Komarala, V.K. Fabrication and characterisation of dye sensitized solar cells: A photographic guid. Indian J. Pure Appl. Phys. 2017, 55, 737–744. [Google Scholar]
- Nyembe, S.; Mpelane, S.; Shumbula, P.; Harris, R.; Moloto, N.; Sikhwivhilu, L. Plasmonic gold nanocrystals: Formation od icosahedron and decahedron nanostructures through twinning mechanism. J. Nanosci. Nanotechnol. 2016, 16, 9832–9837. [Google Scholar] [CrossRef]
- Ding, W.; Zhang, P.; Li, Y.; Wang, D.; Tao, X. Nanomaterials with enzyme-like characheristics. J. Phys. Chem. 2015, 16, 447–450. [Google Scholar]
- Kernazhitsky, L.; Shymanovska, V.; Gavrilko, T. Laser-excited excittonic luminescence of nanocrystalline TiO2 powder. Ukr. J. Phys. 2014, 59, 246–253. [Google Scholar] [CrossRef]
- Kumar, S.G.; Devi, L.G. Review on modified TiO2 photocatalysis under UV/visible light: Selected results and related mechanisms on interfacial charge carrier transfer dynamics. J. Phys. Chem. A 2011, 115, 13211–13241. [Google Scholar] [CrossRef] [PubMed]
- Wu, N. Plasmonic metal-semoconductor photocatalyst and photoelectrochemical cells: A review. Nanoscale 2018, 10, 2679–2696. [Google Scholar] [CrossRef] [PubMed]
- Tatsuma, T.; Nishi, H.; Ishida, I. Plasmonic-induced charge separation: Chemistry and wide applications. Chem. Sci. 2017, 8, 3325–3337. [Google Scholar] [CrossRef] [PubMed] [Green Version]
- Maier, S. A Plasmonic: Fundamentals and applications. Appl. Springer Sci. Bus. Media 2007, 1, 254–259. [Google Scholar]


| Sample Name | Jsc (mA cm−2) | Voc (V) | FF | η (%) |
|---|---|---|---|---|
| P25 | 1.75 | 0.23 | 0.29 | 2.41 |
| TiO2-P25//Au-14 nm | 4.36 | 0.24 | 0.30 | 2.60 |
| TiO2-P25//Au-30 nm | 26 | 0.29 | 0.30 | 5.91 |
| TiO2-P25//Au-40 nm | 45 | 0.08 | 0.23 | 6.43 |
Publisher’s Note: MDPI stays neutral with regard to jurisdictional claims in published maps and institutional affiliations. |
© 2022 by the authors. Licensee MDPI, Basel, Switzerland. This article is an open access article distributed under the terms and conditions of the Creative Commons Attribution (CC BY) license (https://creativecommons.org/licenses/by/4.0/).
Share and Cite
Nyembe, S.; Chindeka, F.; Ndlovu, G.; Mkhohlakali, A.; Nyokong, T.; Sikhwivhilu, L. Enhanced Solar Efficiency via Incorporation of Plasmonic Gold Nanostructures in a Titanium Oxide/Eosin Y Dye-Sensitized Solar Cell. Nanomaterials 2022, 12, 1715. https://doi.org/10.3390/nano12101715
Nyembe S, Chindeka F, Ndlovu G, Mkhohlakali A, Nyokong T, Sikhwivhilu L. Enhanced Solar Efficiency via Incorporation of Plasmonic Gold Nanostructures in a Titanium Oxide/Eosin Y Dye-Sensitized Solar Cell. Nanomaterials. 2022; 12(10):1715. https://doi.org/10.3390/nano12101715
Chicago/Turabian StyleNyembe, Sanele, Francis Chindeka, Gebhu Ndlovu, Andile Mkhohlakali, Tebello Nyokong, and Lucky Sikhwivhilu. 2022. "Enhanced Solar Efficiency via Incorporation of Plasmonic Gold Nanostructures in a Titanium Oxide/Eosin Y Dye-Sensitized Solar Cell" Nanomaterials 12, no. 10: 1715. https://doi.org/10.3390/nano12101715