
Remarkable Recycling Process of ZnO Quantum Dots for Photodegradation of Reactive Yellow Dye and Solar Photocatalytic Treatment Process of Industrial Wastewater


Abstract
:1. Introduction
2. Materials and Methods
2.1. Materials
2.2. Preparation of Zinc Oxide Quantum Dots Samples
2.3. Characterization
2.4. Photocatalytic Activity Performance
2.5. Solar Photocatalytic Activity
3. Results and Discussion
3.1. XRD
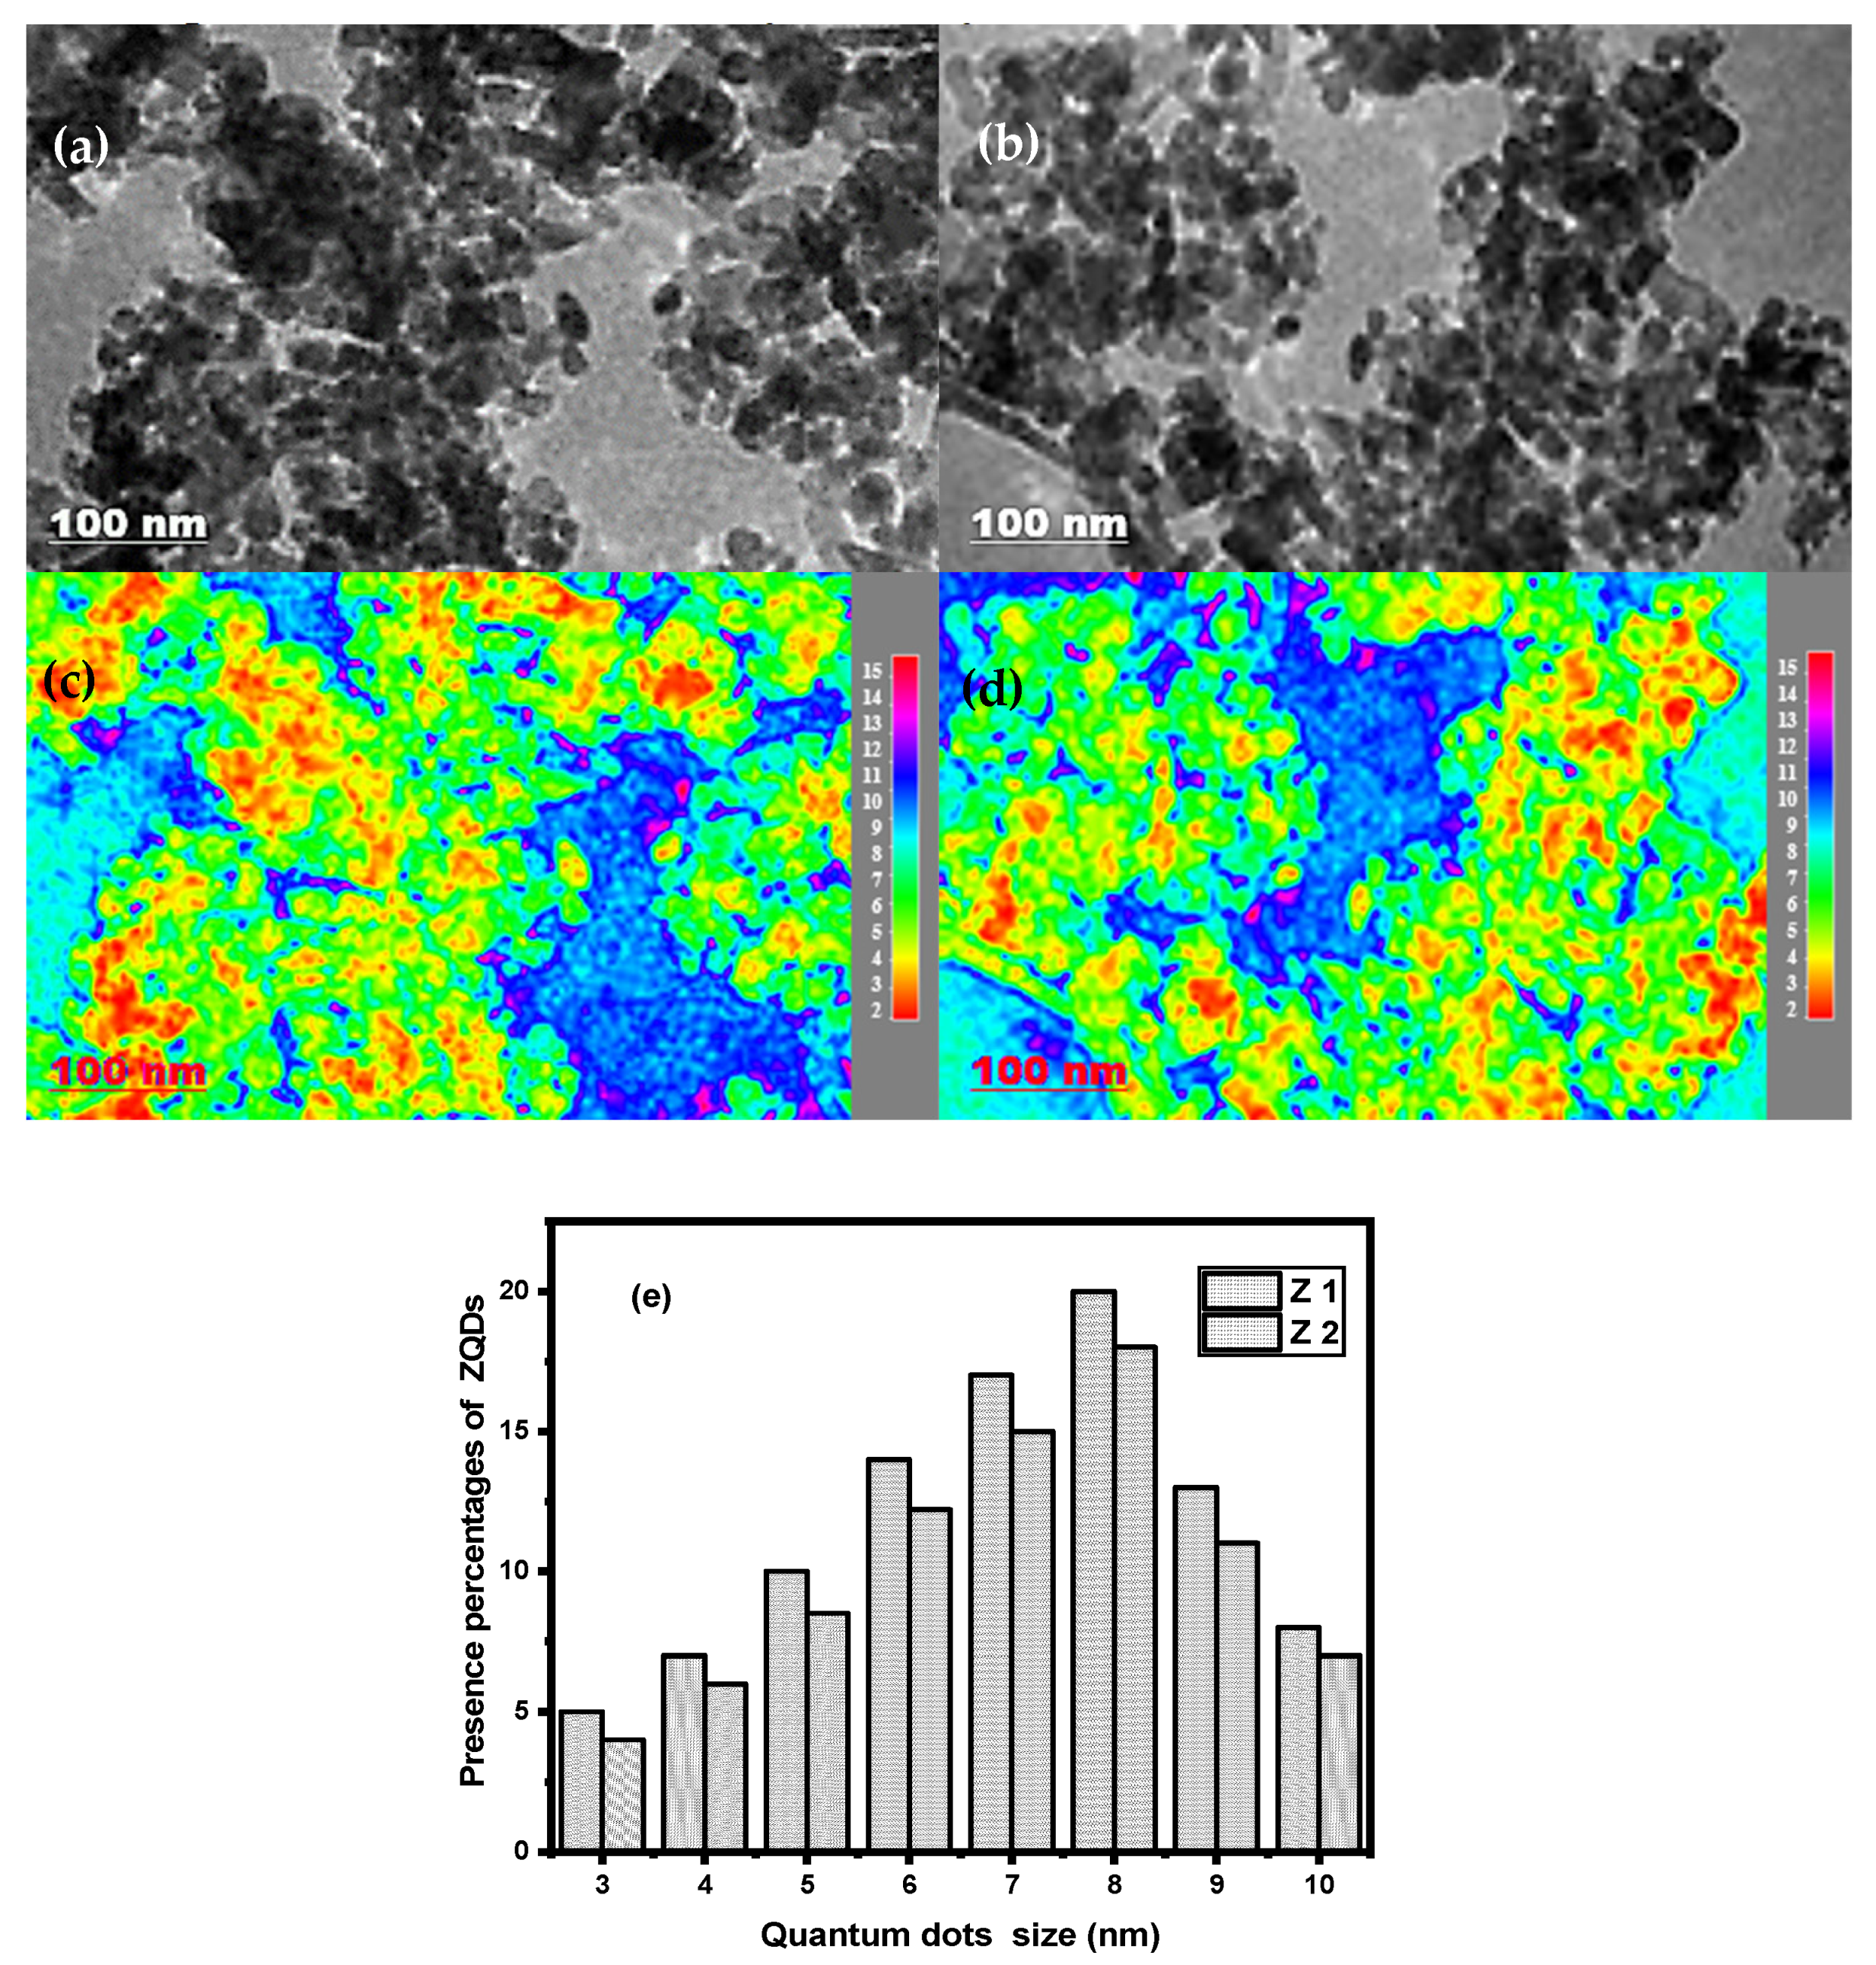
3.2. TEM
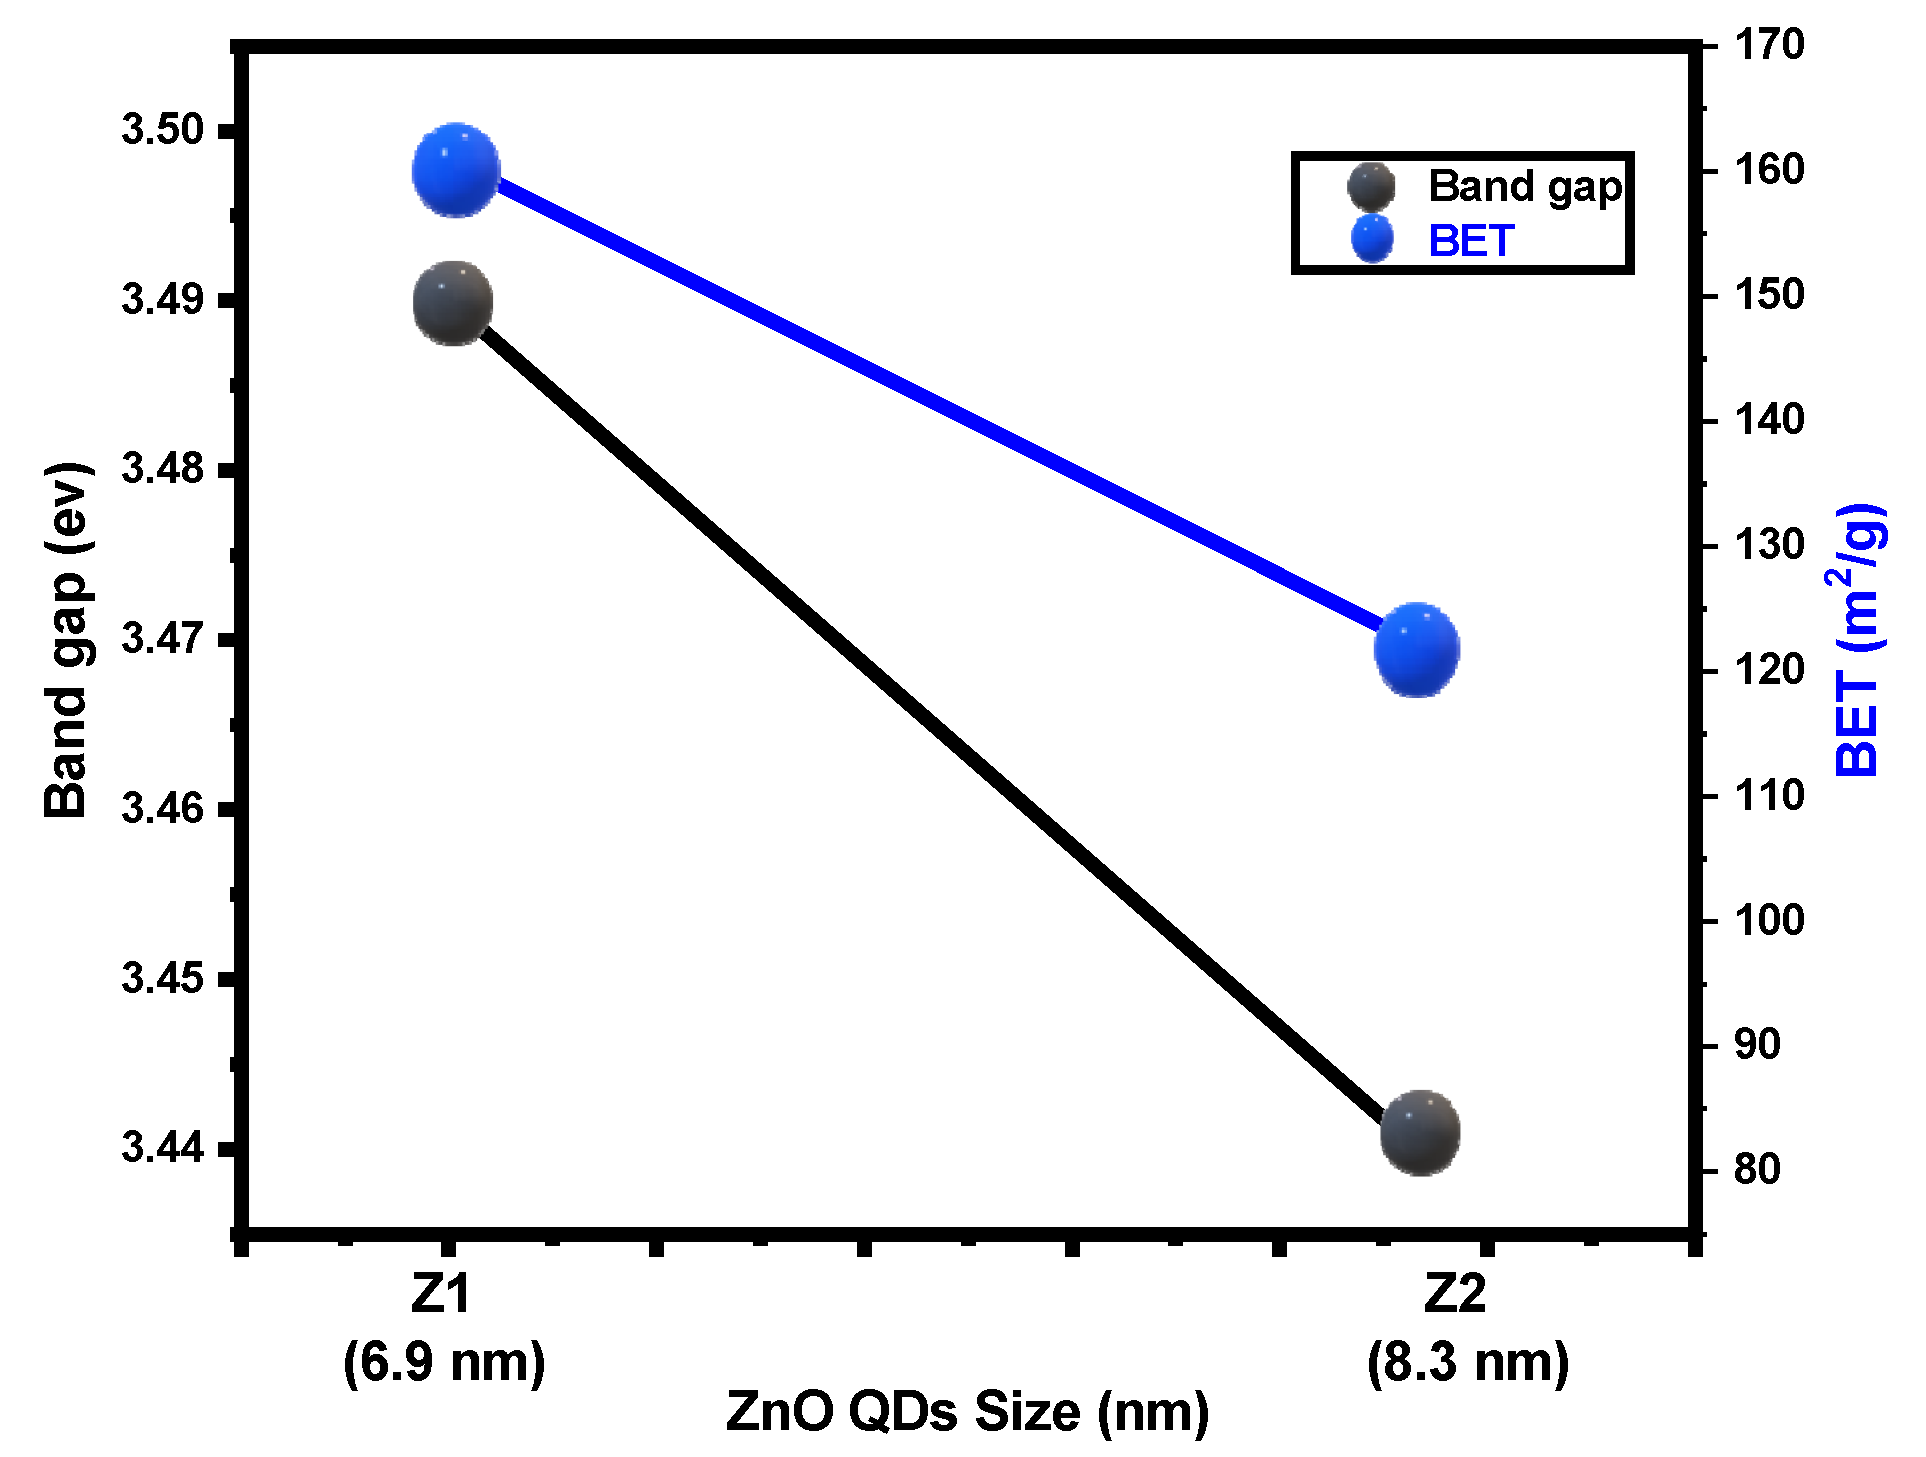
3.3. Bandgap
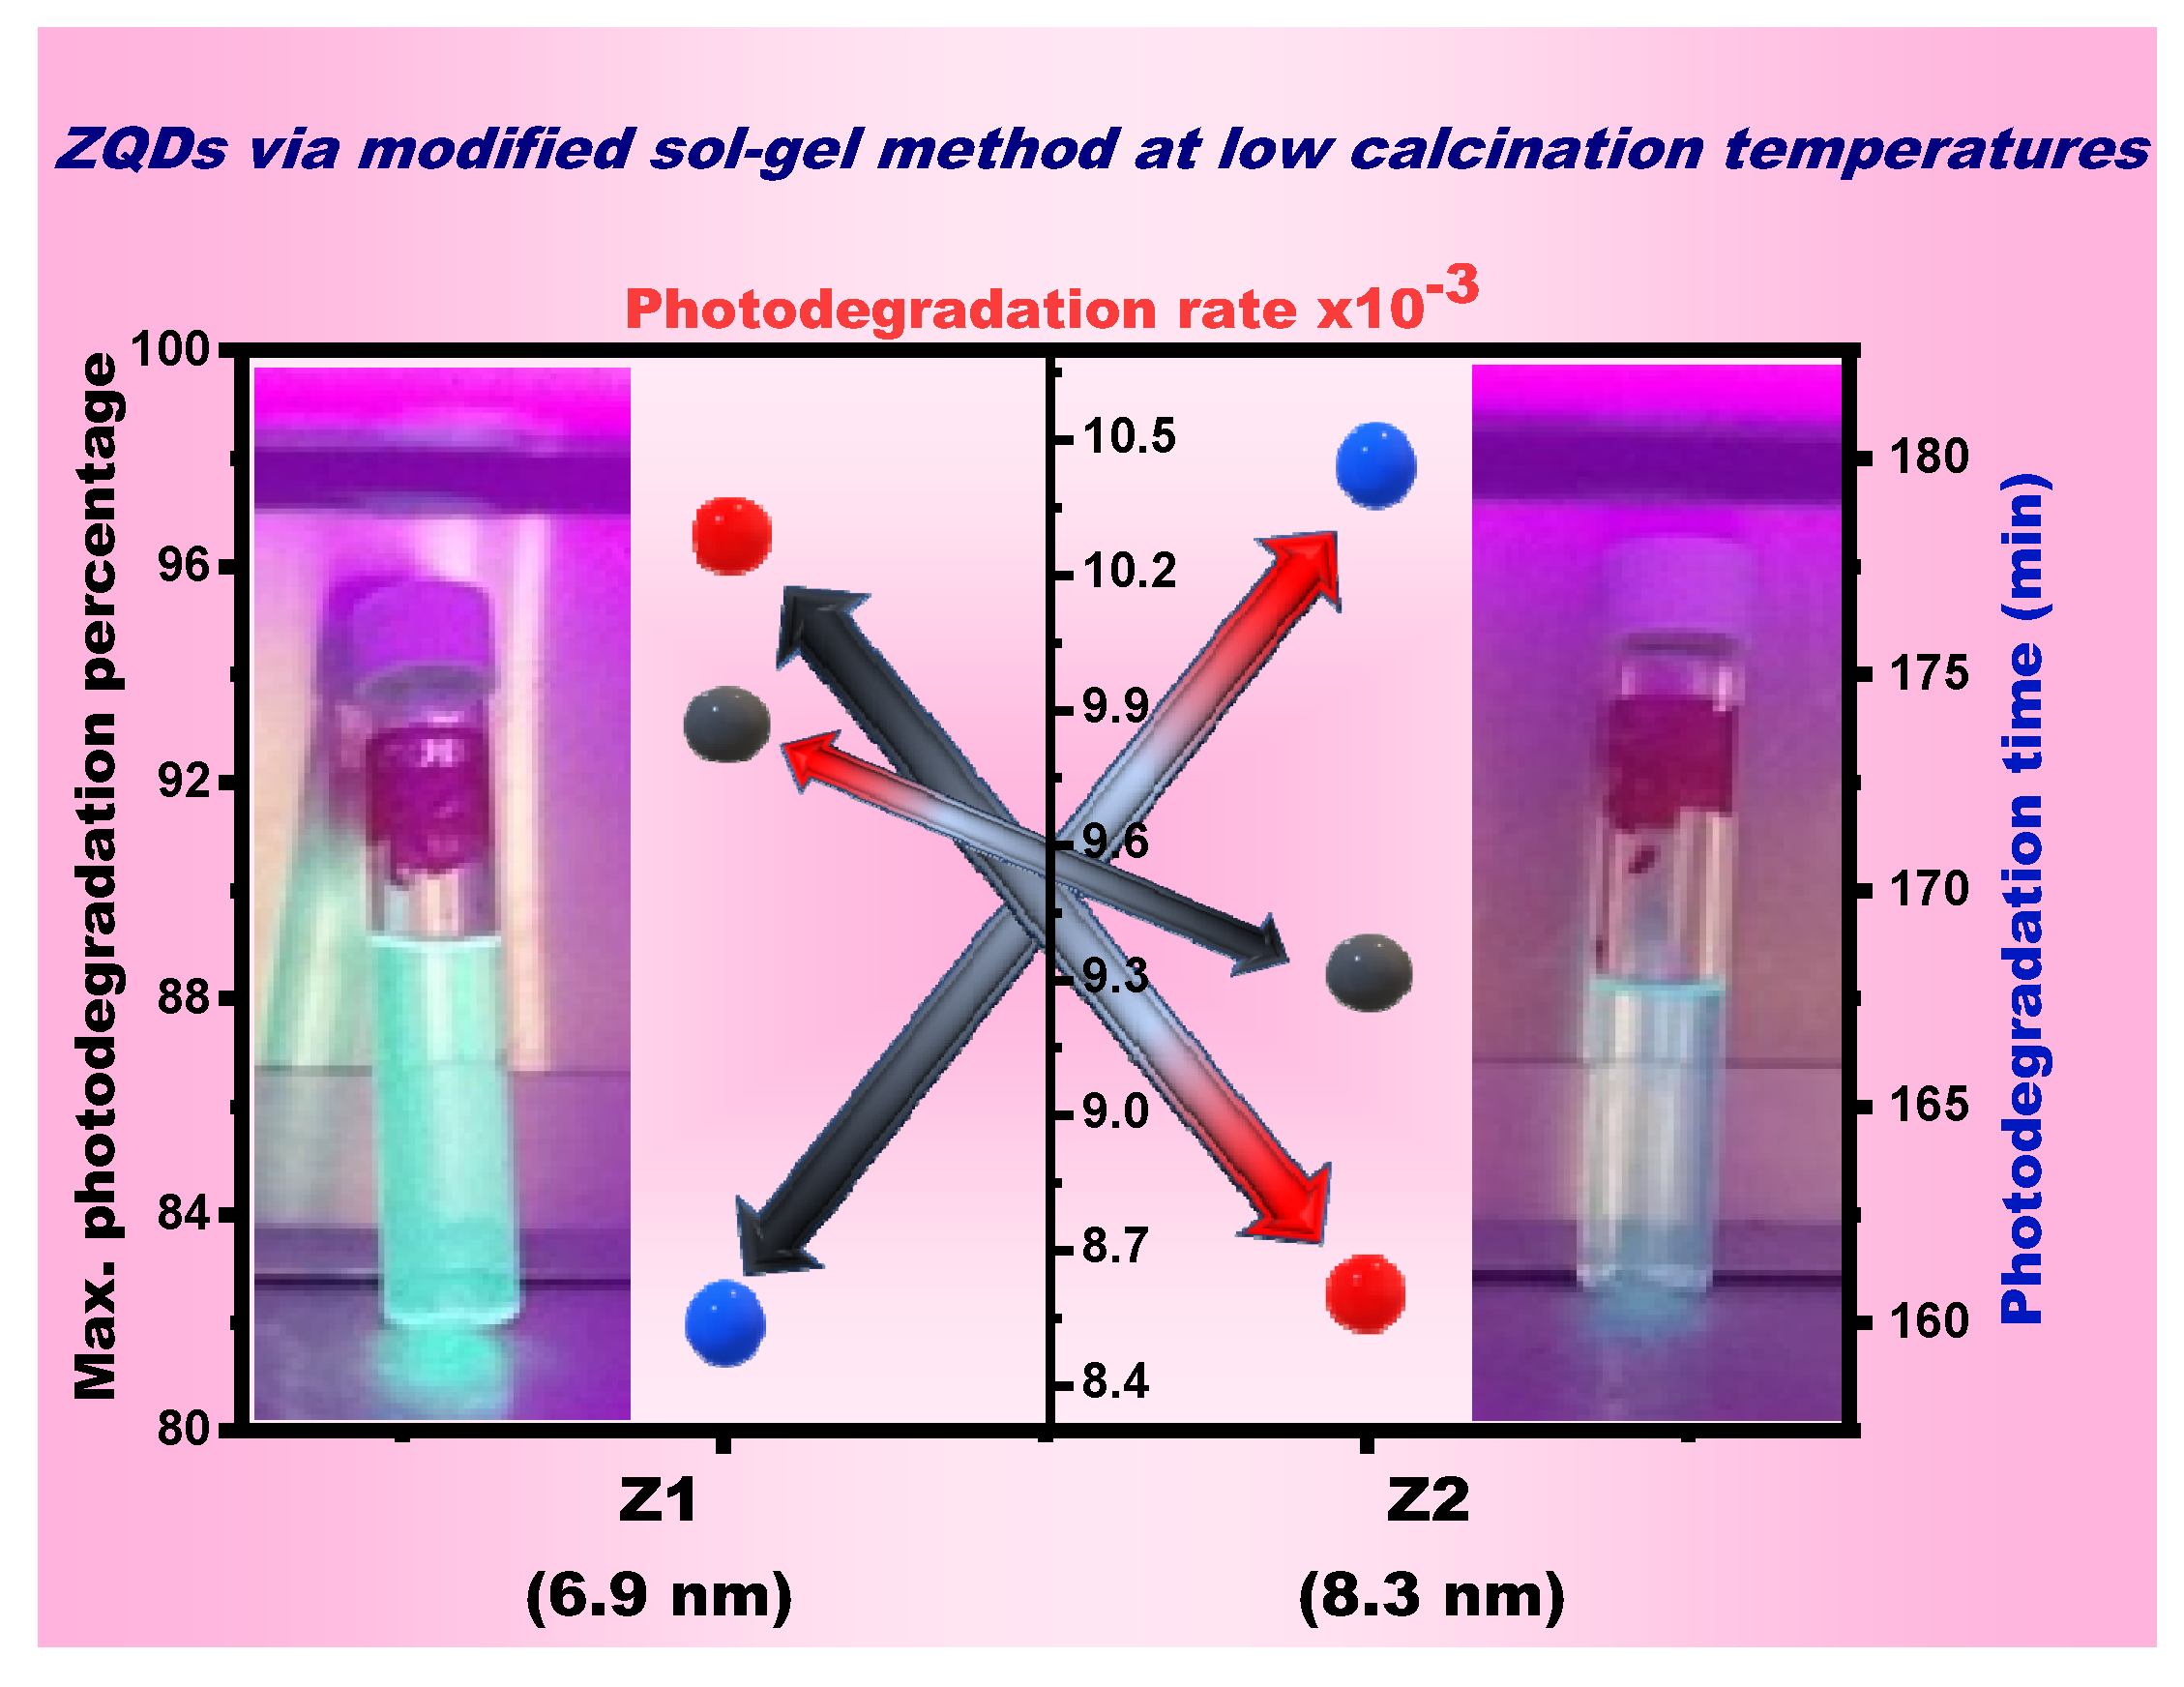
3.4. Photocatalytic Activity by Spectrophotometrically Method
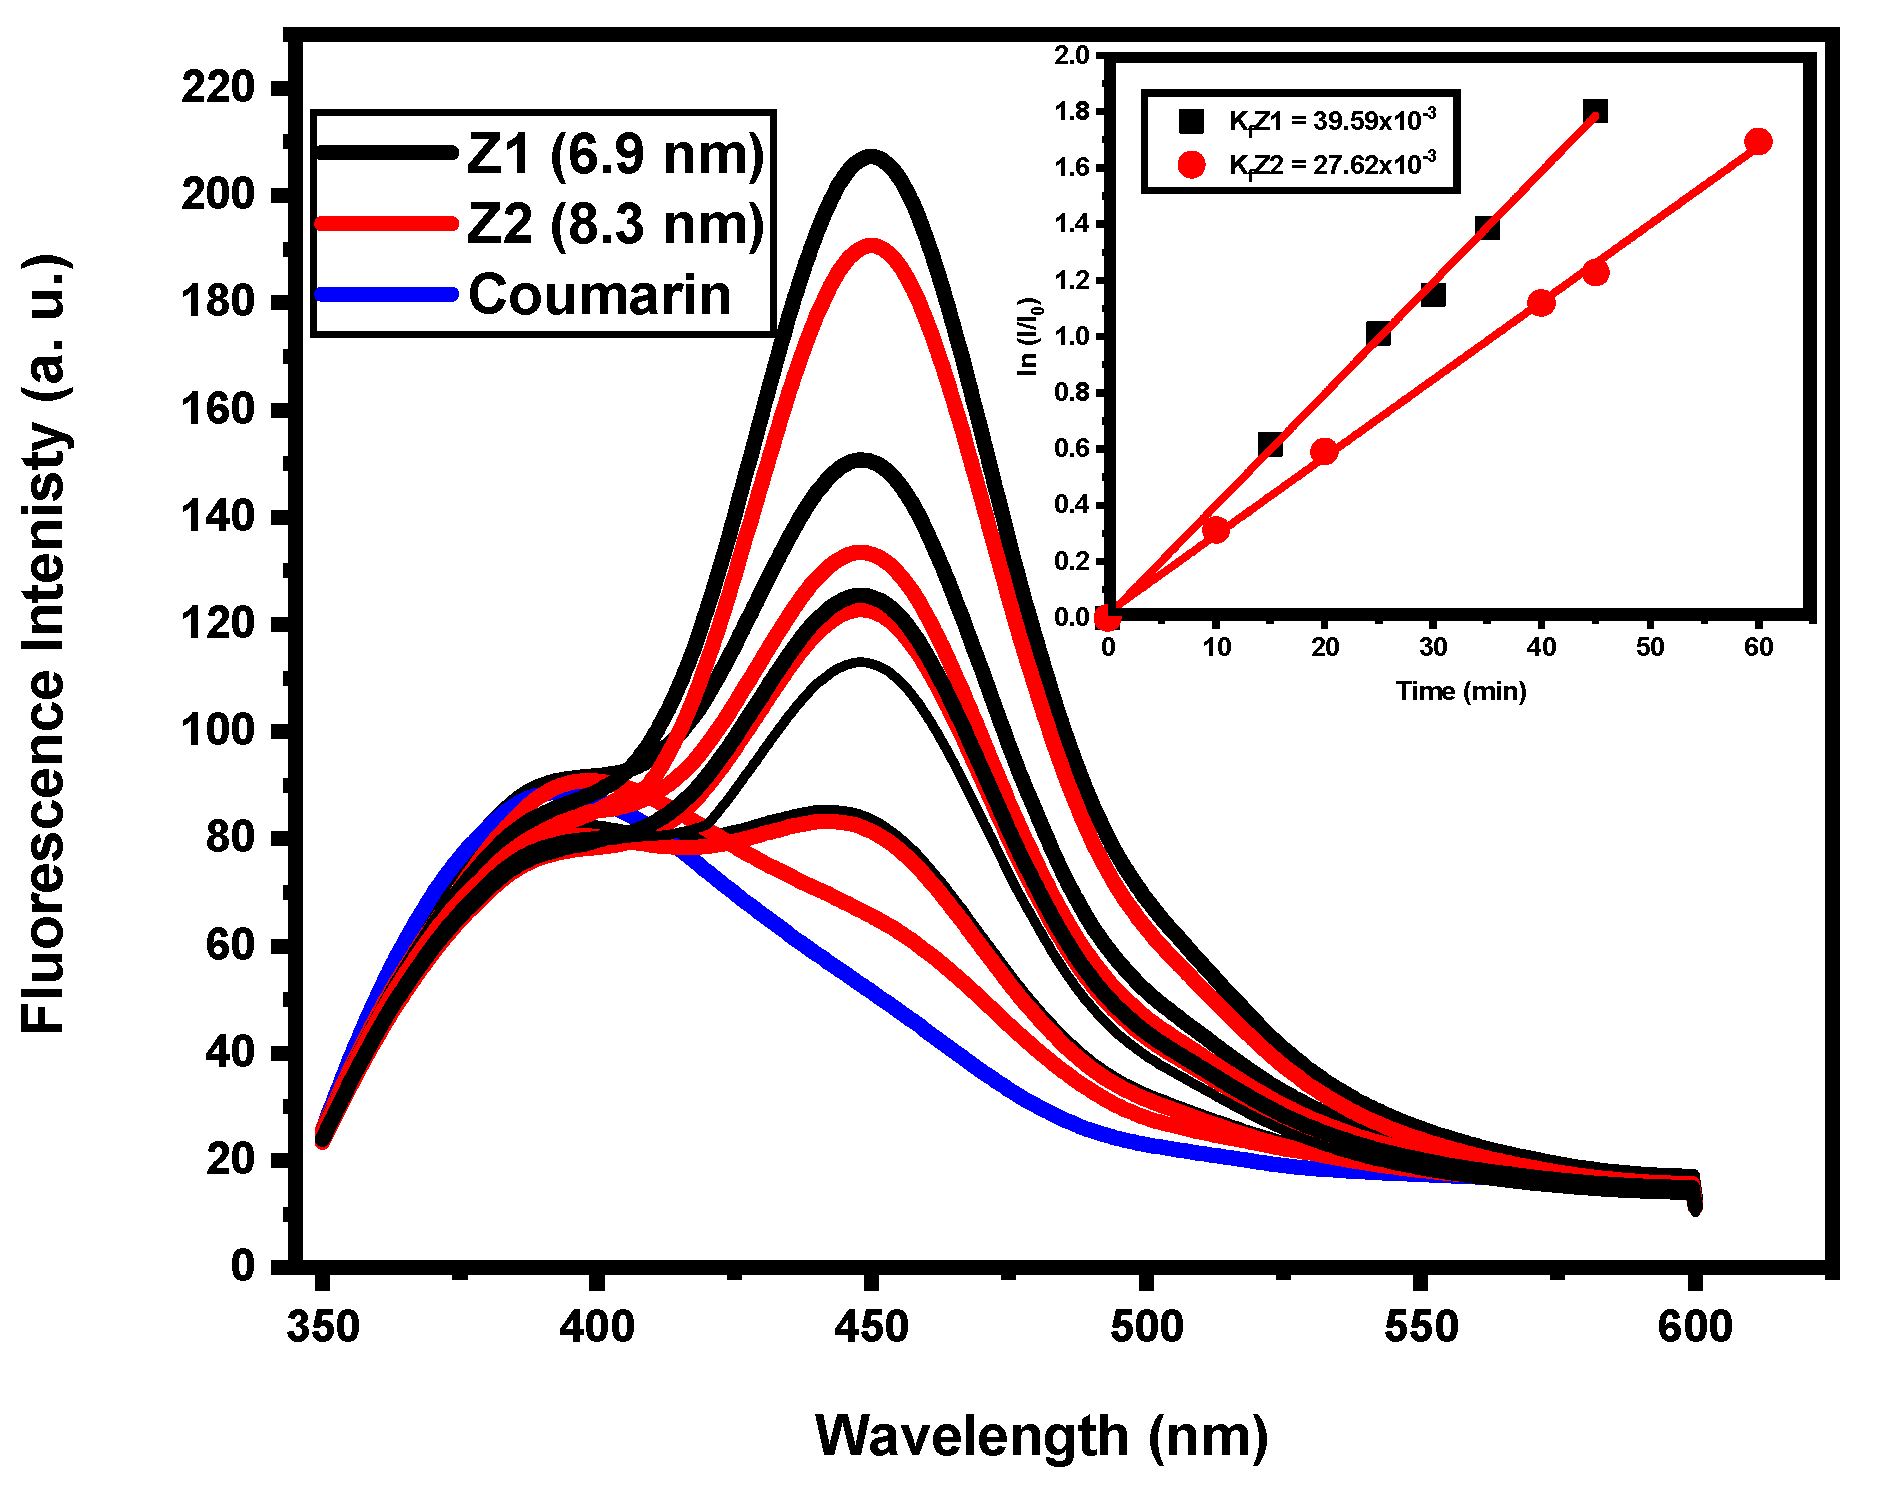
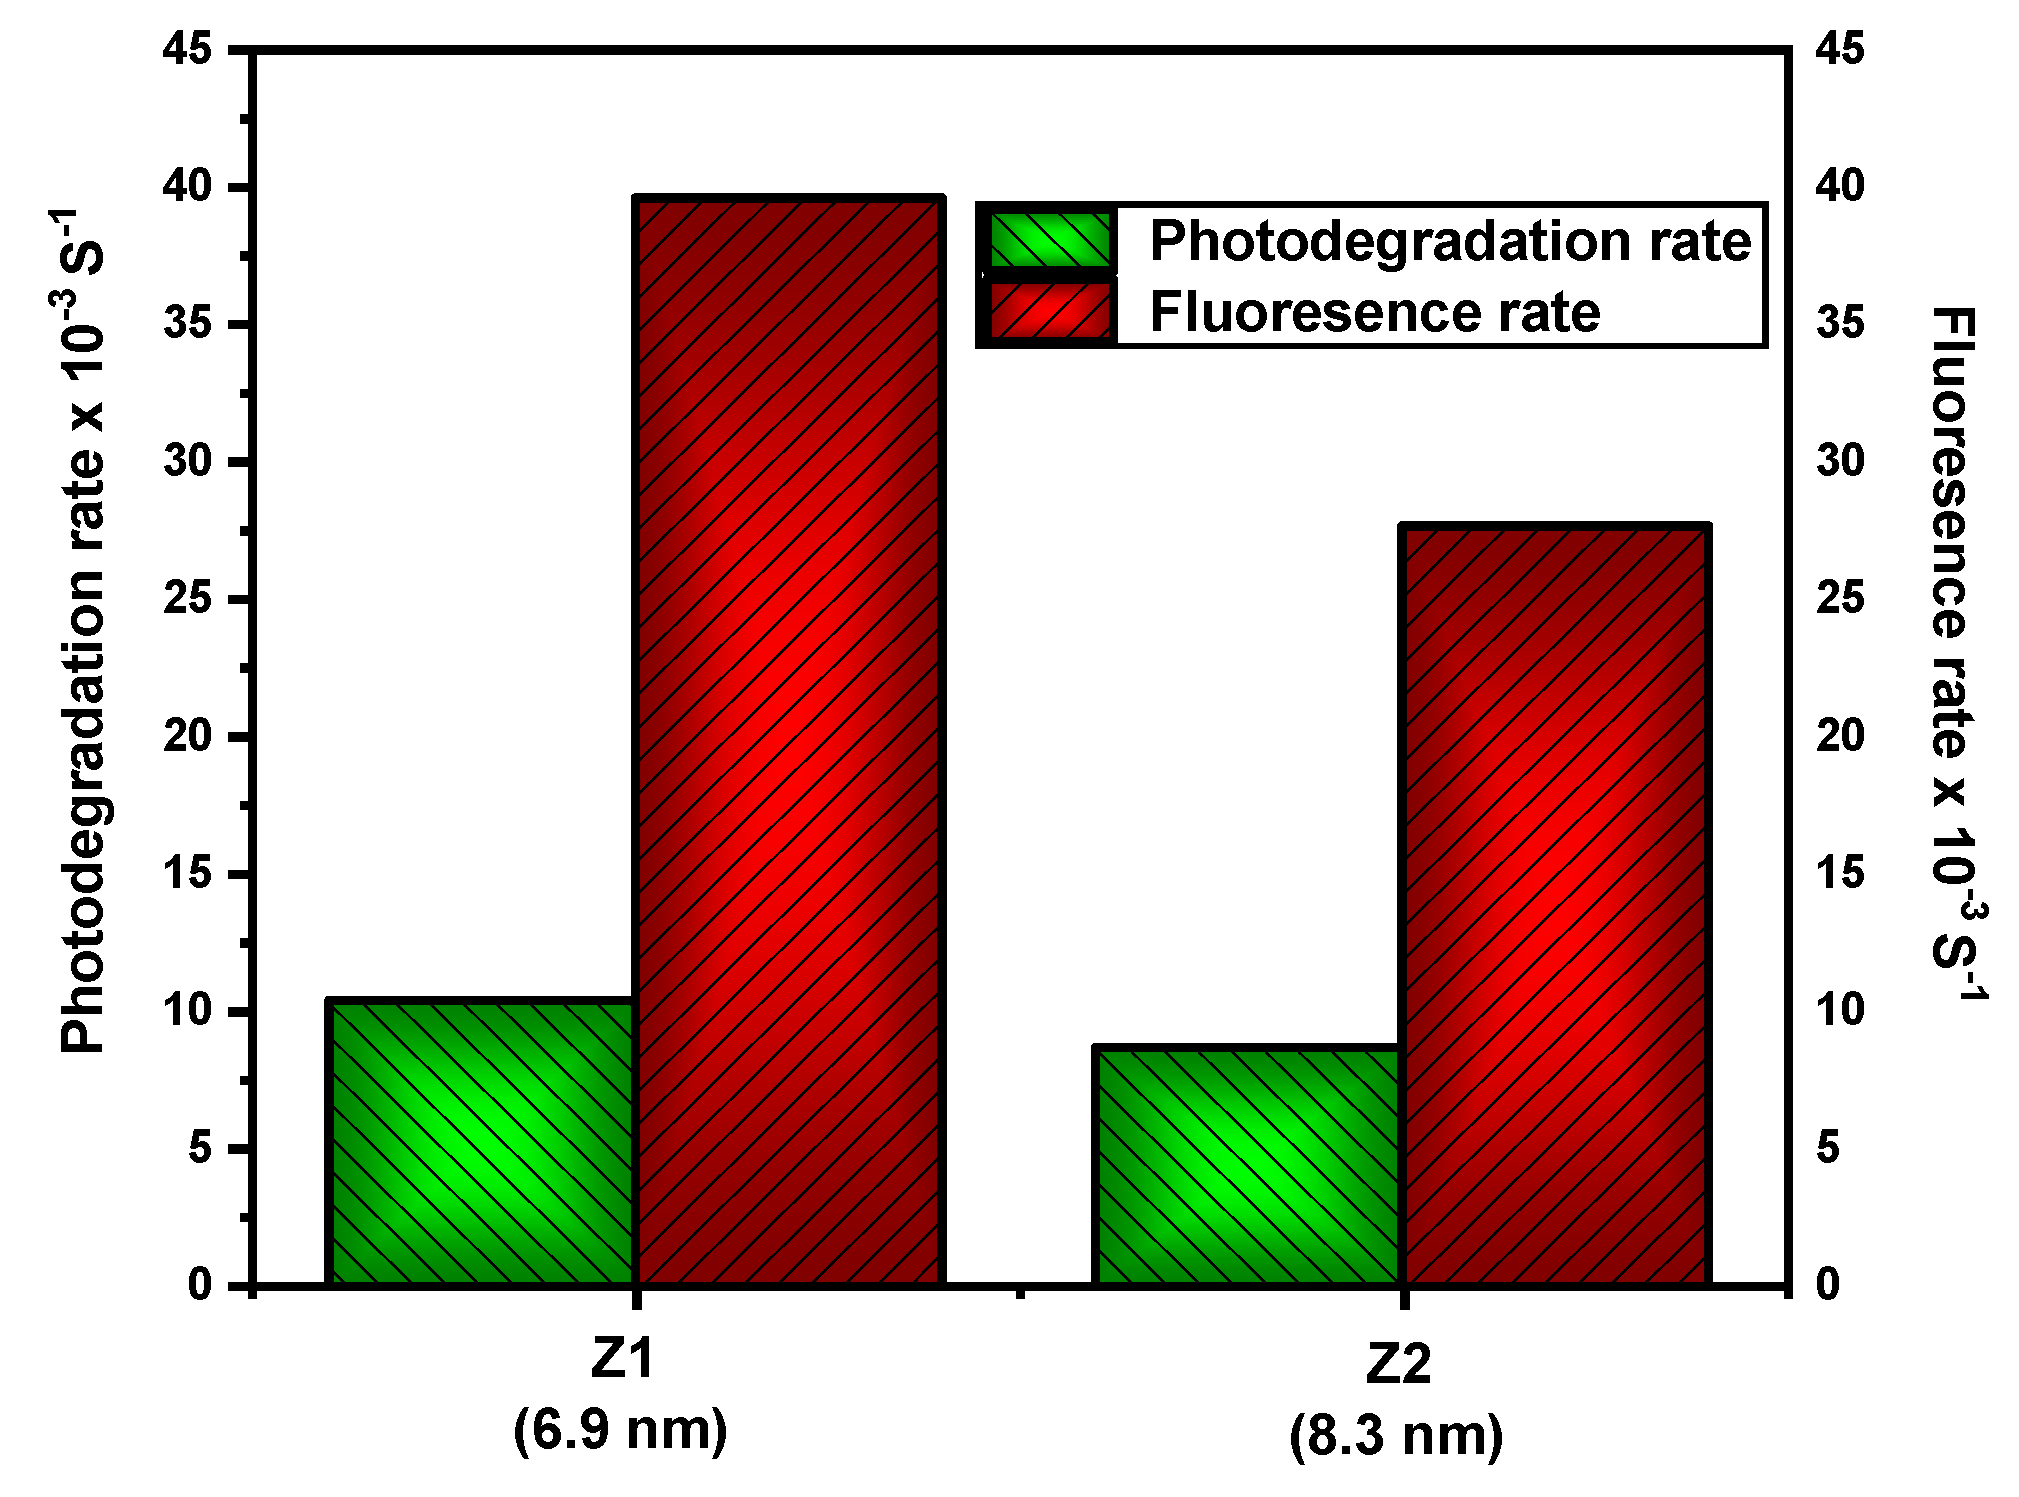
3.5. Photocatalytic Activity by Fluorescent Probe Method
3.6. Solar Photocatalytic of Real Industrial Wastewater (Application)
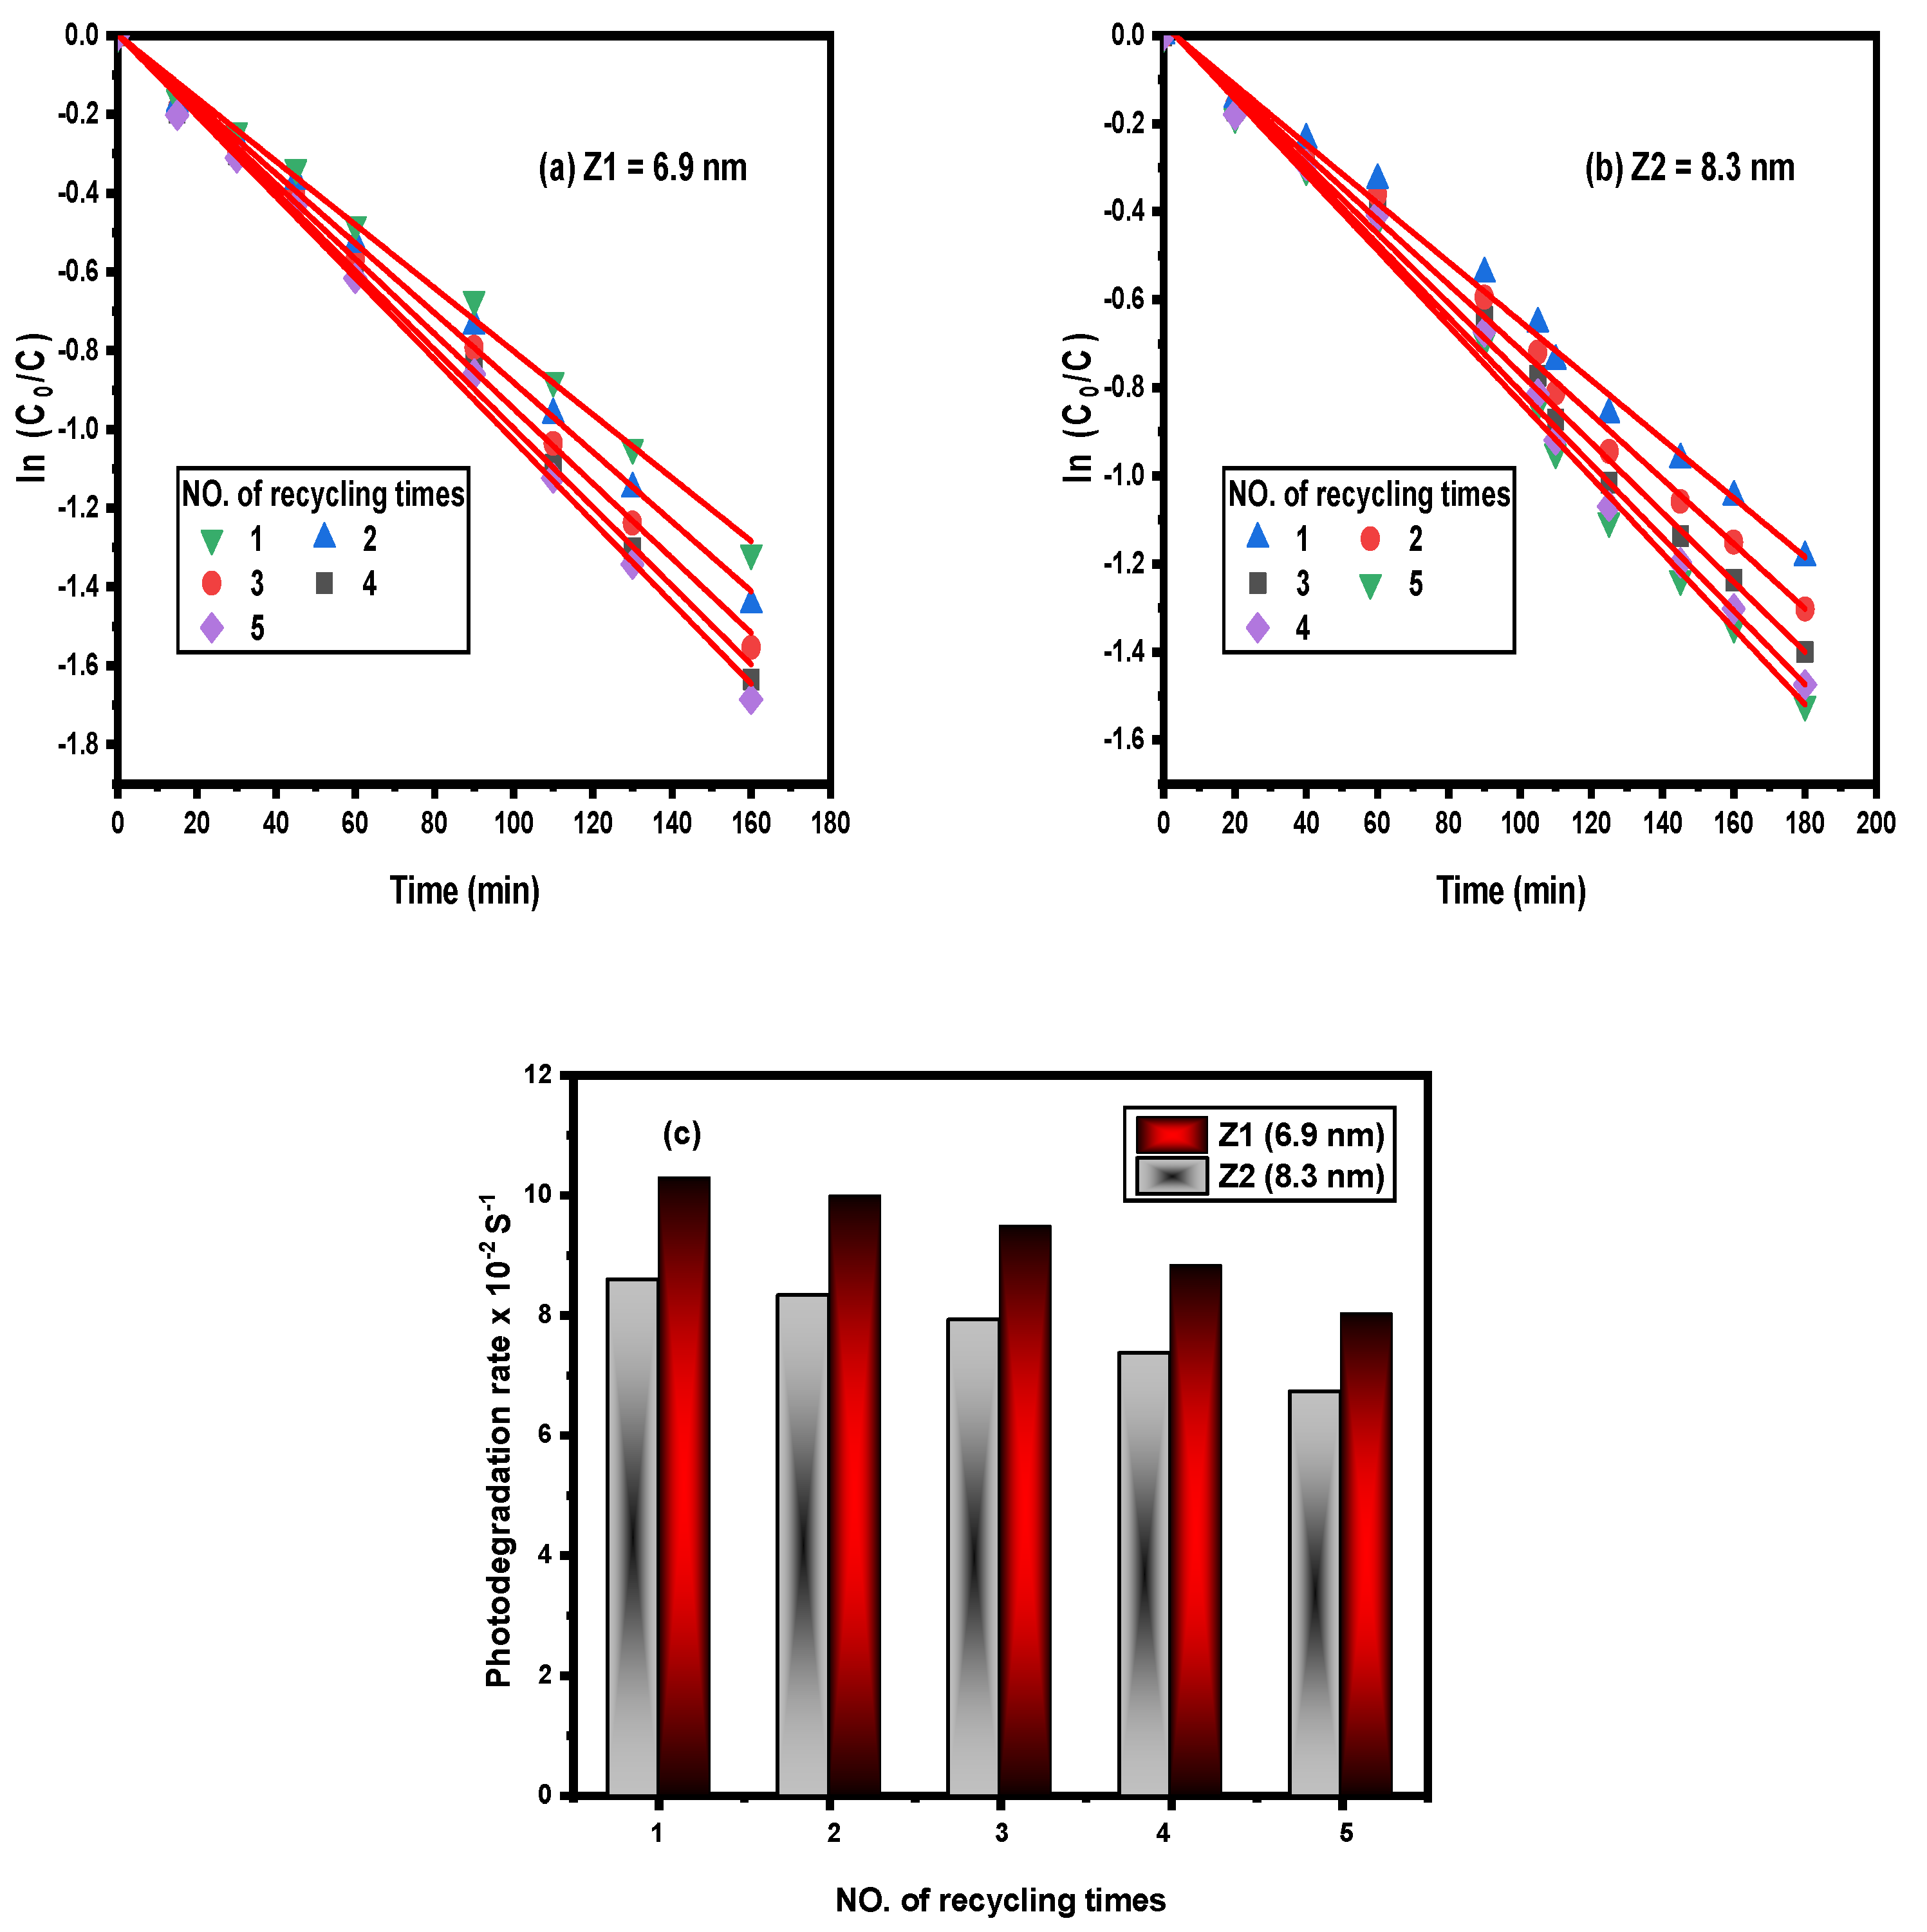
3.7. Recycling Processes
3.7.1. Recycling ZQDs during Decontamination of Reactive Yellow Dye
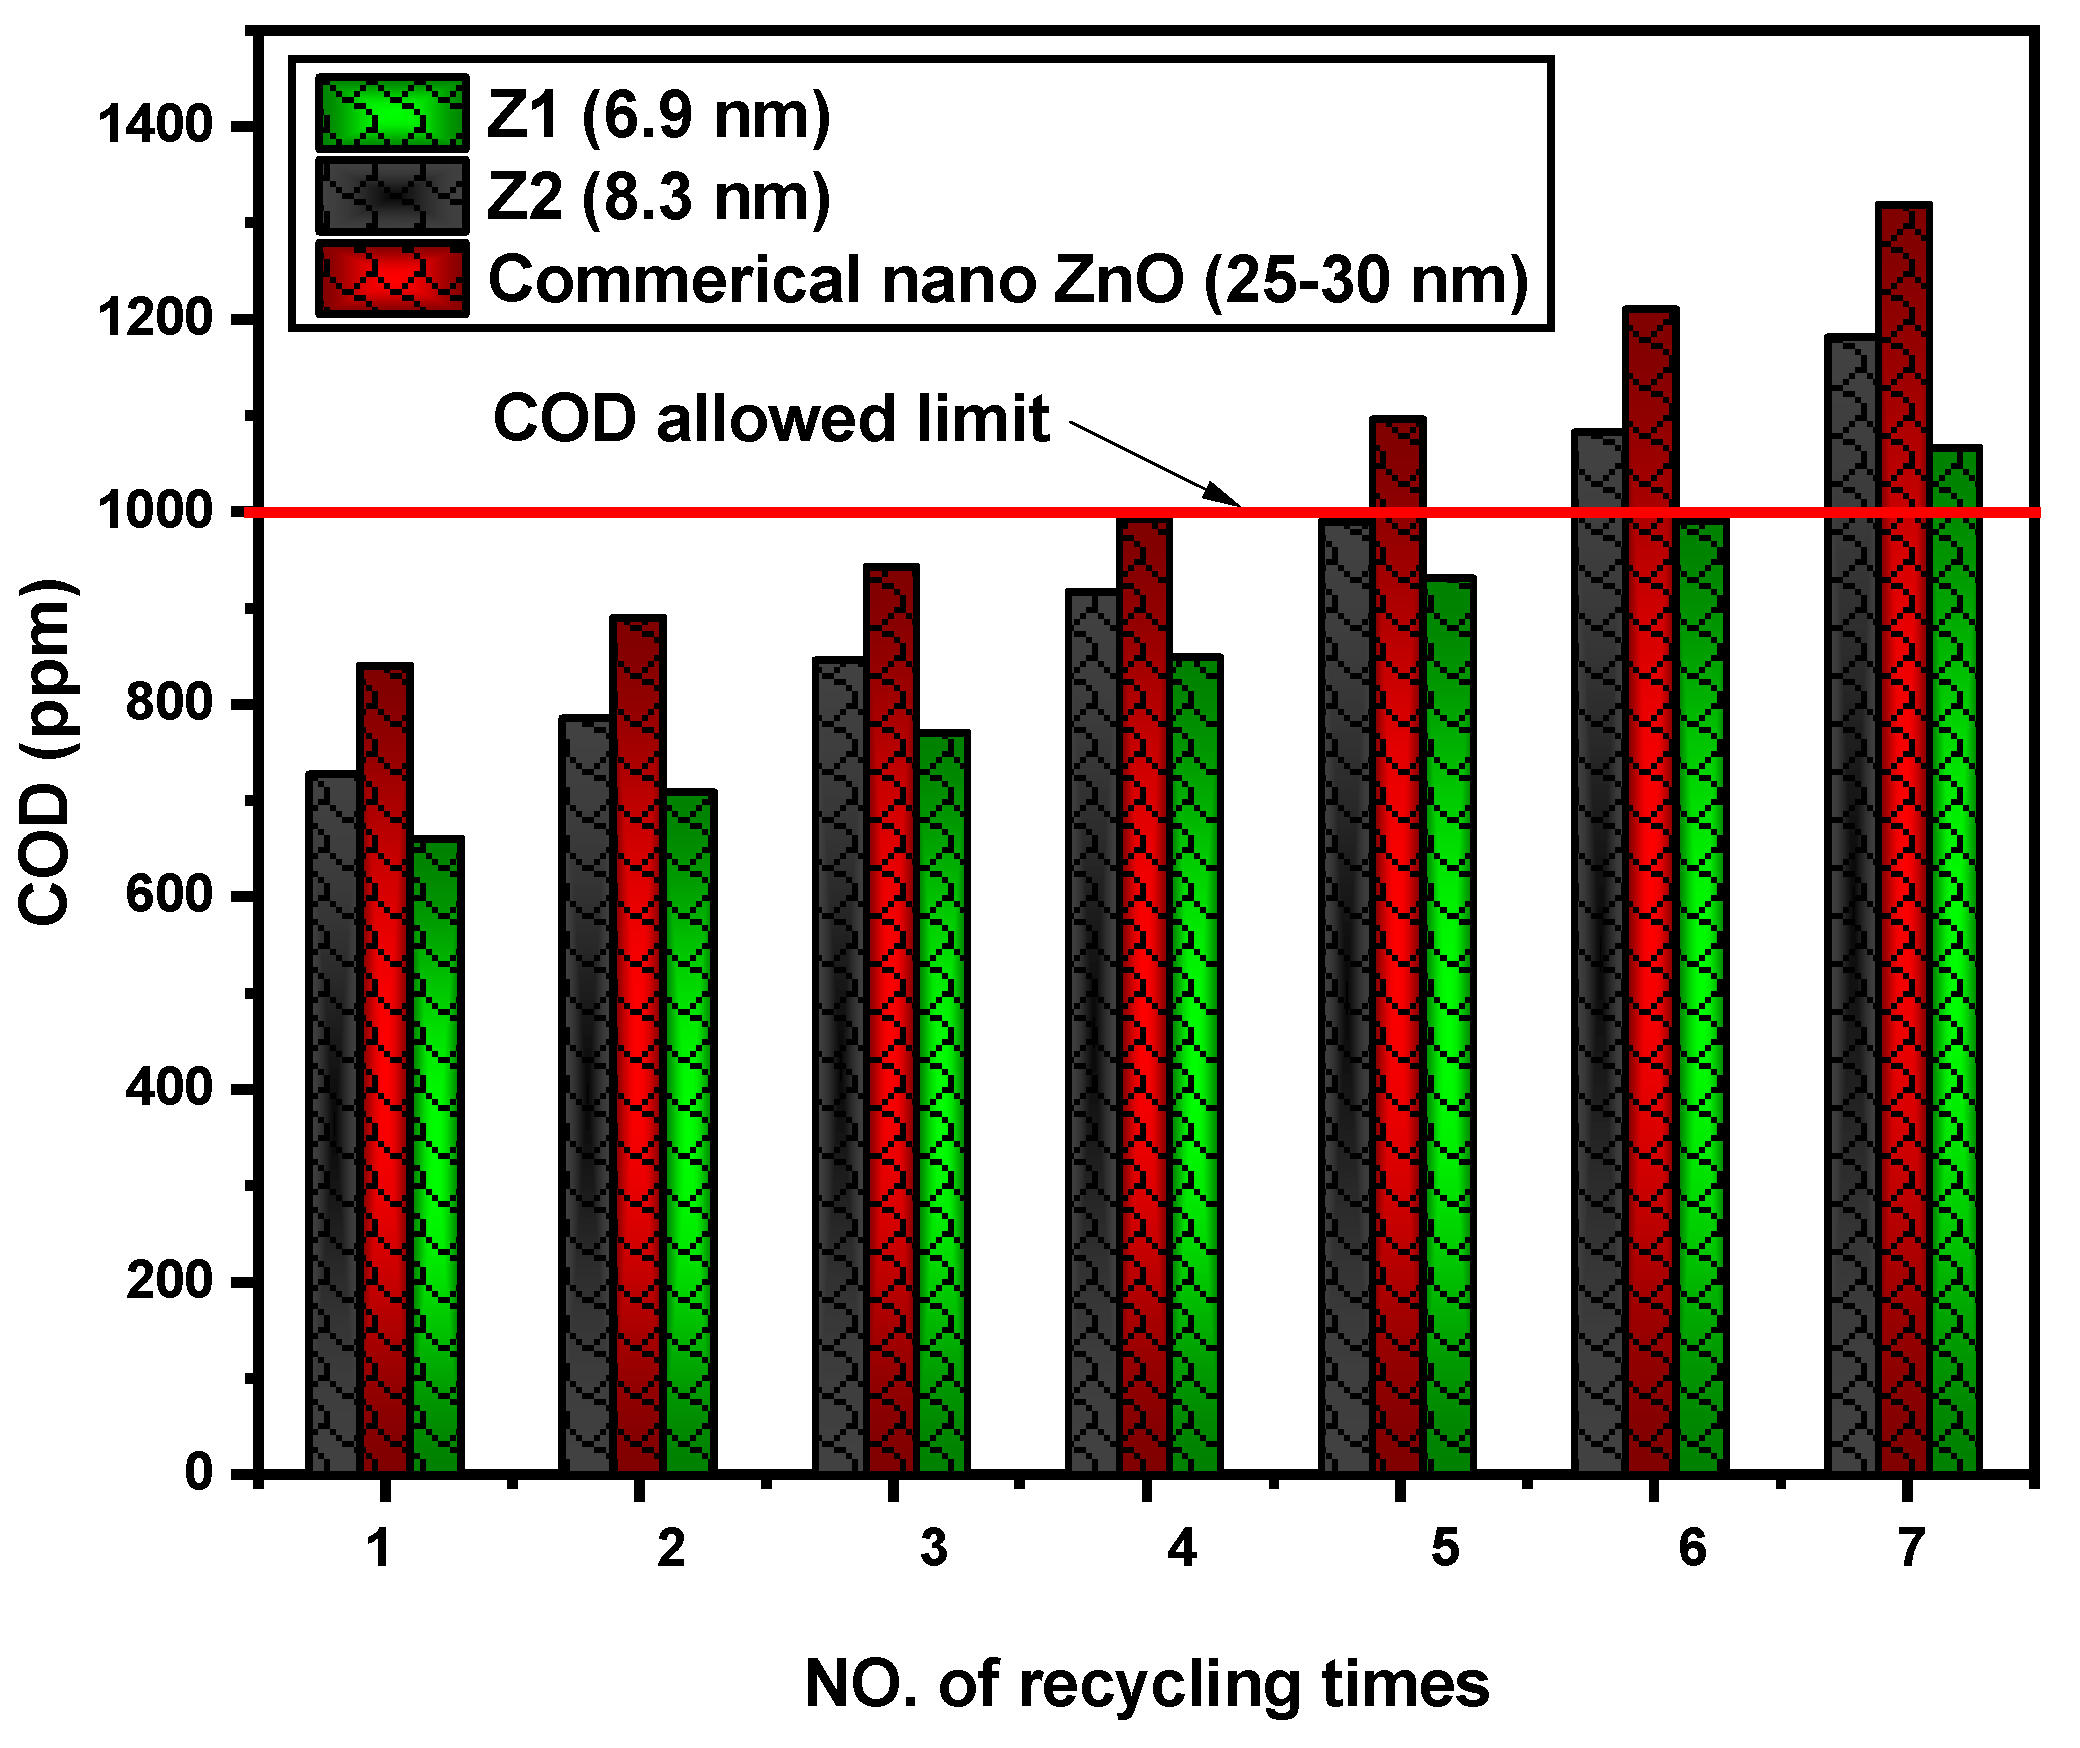
3.7.2. Recycling of ZQDs during Real Industrial Wastewater
4. Conclusions
Supplementary Materials
Author Contributions
Funding
Data Availability Statement
Conflicts of Interest
References
- Muralikrishna, I.V.; Manickam, V. Industrial Wastewater Treatment Technologies, Recycling, and Reuse. In Environmental Management; Elsevier: Amsterdam, The Netherlands, 2017; pp. 295–336. [Google Scholar] [CrossRef]
- Mohamed, W.A.A.; Handal, H.T.; Ibrahem, I.A.; Galal, H.R.; Mousa, H.A.; Labib, A.A. Recycling for solar photocatalytic activity of Dianix blue dye and real industrial wastewater treatment process by zinc oxide quantum dots synthesized by solvothermal method. J. Hazard. Mater. 2021, 404, 123962. [Google Scholar] [CrossRef]
- Li, L.; Zhang, J.; Wang, A. Removal of Organic Pollutants from Water Using Superwetting Materials. Chem. Rec. 2017, 18, 118–136. [Google Scholar] [CrossRef] [PubMed]
- Dhayagude, A.C.; Nikam, S.V.; Kapoor, S.; Joshi, S.S. Effect of electrolytic media on the photophysical properties and photocatalytic activity of zinc oxide nanoparticles synthesized by simple electrochemical method. J. Mol. Liq. 2017, 232, 290–303. [Google Scholar] [CrossRef]
- Vaez, Z.; Javanbakht, V. Synthesis, characterization and photocatalytic activity of ZSM-5/ZnO nanocomposite modified by Ag nanoparticles for methyl orange degradation. J. Photochem. Photobiol. A Chem. 2020, 388, 112064. [Google Scholar] [CrossRef]
- Wahba, M.A.; Yakout, S.M.; Mohamed, W.A.A.; Galal, H.R. Remarkable photocatalytic activity of Zr doped ZnO and ZrO2/ZnO nanocomposites: Structural, morphological and photoluminescence properties. Mater. Chem. Phys. 2020, 256, 123754. [Google Scholar] [CrossRef]
- El-Mekkawi, D.M.; Abdelwahab, N.A.; Mohamed, W.A.A.; Taha, N.A.; Abdel-Mottaleb, M.S.A. Solar photocatalytic treatment of industrial wastewater utilizing recycled polymeric disposals as TiO2 supports. J. Clean. Prod. 2020, 249, 119430. [Google Scholar] [CrossRef]
- Wahba, M.A.; Mohamed, W.A.A.; Hanna, A.A. Sol-gel synthesis, characterization of Fe/ZrO2 nanocomposites and their photodegradation activity on indigo carmine and methylene blue textile dyes. Int. J. ChemTech Res. 2016, 9, 914–925. [Google Scholar]
- El-Mekkawi, D.M.; Labib, A.A.; Mousa, H.A.; Galal, H.R.; Mohamed, W.A.A. Preparation and Characterization of Nano Titanium Dioxide Photocatalysts Via Sol Gel Method over Narrow Ranges of Varying Parameters. Orient. J. Chem. 2017, 33, 41–51. [Google Scholar] [CrossRef] [Green Version]
- Hanna, A.A.; Mohamed, W.A.A.; Galal, H.R.; Labib, A.A. Synthesis, Characterization and Electrical Properties of Zr doped ZnO Nanoparticles and its Effect on Photodegradation of Methyl Orange. Res. J. Pharm. Biol. Chem. Sci. 2016, 7, 213–224. [Google Scholar]
- Hanna, A.A.; Mohamed, W.A.A.; Ibrahim, I.A. Studies on Photodegradation of Methylene Blue (MB) by Nano-sized Titanium Oxide. Egypt. J. Chem. 2014, 57, 315–325. [Google Scholar] [CrossRef] [Green Version]
- Zhou, Z.; Lan, C.; Wei, R.; Ho, J.C. Transparent metal-oxide nanowires and their applications in harsh electronics. J. Mater. Chem. C 2019, 7, 202–217. [Google Scholar] [CrossRef]
- Illiberi, A.; Poodt, P.; Bolt, P.-J.; Roozeboom, F. Recent Advances in Atmospheric Vapor-Phase Deposition of Transparent and Conductive Zinc Oxide. Chem. Vap. Depos. 2014, 20, 234–242. [Google Scholar] [CrossRef]
- Rosli, N.N.; Ibrahim, M.A.; Ahmad Ludin, N.; Mat Teridi, M.A.; Sopian, K. A review of graphene based transparent conducting films for use in solar photovoltaic applications. Renew. Sustain. Energy Rev. 2019, 99, 83–99. [Google Scholar] [CrossRef]
- Bouhssira, N.; Abed, S.; Tomasella, E.; Cellier, J.; Mosbah, A.; Aida, M.S.; Jacquet, M. Influence of annealing temperature on the properties of ZnO thin films deposited by thermal evaporation. Appl. Surf. Sci. 2006, 252, 5594–5597. [Google Scholar] [CrossRef]
- Minami, T.; Ohtani, Y.; Miyata, T.; Kuboi, T. Transparent conducting Al-doped ZnO thin films prepared by magnetron sputtering with dc and rf powers applied in combination. J. Vac. Sci. Technol. A Vac. Surf. Film. 2007, 25, 1172–1177. [Google Scholar] [CrossRef]
- Liu, Y.; Lian, J. Optical and electrical properties of aluminum-doped ZnO thin films grown by pulsed laser deposition. Appl. Surf. Sci. 2007, 253, 3727–3730. [Google Scholar] [CrossRef]
- Kirchner, C.; Gruber, T.; Reuß, F.; Thonke, K.; Waag, A.; Gießen, C.; Heuken, M. MOVPE growth of ZnO using various oxygen precursors. J. Cryst. Growth 2003, 248, 20–24. [Google Scholar] [CrossRef]
- Shirahata, T.; Kawaharamura, T.; Fujita, S.; Orita, H. Transparent conductive zinc-oxide-based films grown at low temperature by mist chemical vapor deposition. Thin Solid Film. 2015, 597, 30–38. [Google Scholar] [CrossRef]
- Raoufi, D.; Raoufi, T. The effect of heat treatment on the physical properties of sol–gel derived ZnO thin films. Appl. Surf. Sci. 2009, 255, 5812–5817. [Google Scholar] [CrossRef]
- He, Y.; Yanagida, T.; Nagashima, K.; Zhuge, F.; Meng, G.; Xu, B.; Klamchuen, A.; Rahong, S.; Kanai, M.; Li, X.; et al. Crystal-Plane Dependence of Critical Concentration for Nucleation on Hydrothermal ZnO Nanowires. J. Phys. Chem. C 2013, 117, 1197–1203. [Google Scholar] [CrossRef]
- Liu, J.; Nagashima, K.; Yamashita, H.; Mizukami, W.; Uzuhashi, J.; Hosomi, T.; Kanai, M.; Zhao, X.; Miura, Y.; Zhang, G.; et al. Face-selective tungstate ions drive zinc oxide nanowire growth direction and dopant incorporation. Commun. Mater. 2020, 1, 58. [Google Scholar] [CrossRef]
- Nomoto, J.; Makino, H.; Nakajima, T.; Tsuchiya, T.; Yamamoto, T. Improvement of the Properties of Direct-Current Magnetron-Sputtered Al-Doped ZnO Polycrystalline Films Containing Retained Ar Atoms Using 10-nm-Thick Buffer Layers. ACS Omega 2019, 4, 14526–14536. [Google Scholar] [CrossRef] [PubMed] [Green Version]
- Mohamed, W.A.A.; Ibrahem, I.A.; El-Sayed, A.M.; Galal, H.R.; Handal, H.; Mousa, H.A.; Labib, A.A. Zinc oxide quantum dots for textile dyes and real industrial wastewater treatment: Solar photocatalytic activity, photoluminescence properties and recycling process. Adv. Powder Technol. 2020, 31, 2555–2565. [Google Scholar] [CrossRef]
- Liang, H.; Tai, X.; Du, Z.; Yin, Y. Enhanced photocatalytic activity of ZnO sensitized by carbon quantum dots and application in phenol wastewater. Opt. Mater. 2020, 100, 109674. [Google Scholar] [CrossRef]
- Rani, G.; Sahare, P.D. Structural and Spectroscopic Characterizations of ZnO Quantum Dots Annealed at Different Temperatures. J. Mater. Sci. Technol. 2013, 29, 1035–1039. [Google Scholar] [CrossRef]
- Muşat, V.; Tăbăcaru, A.; Vasile, B.Ş.; Surdu, V.-A. Size-dependent photoluminescence of zinc oxide quantum dots through organosilane functionalization. RSC Adv. 2014, 4, 63128–63136. [Google Scholar] [CrossRef]
- Singh, S.; Kumar, V.; Romero, R.; Sharma, K.; Singh, J. Applications of Nanoparticles in Wastewater Treatment. In Nanobiotechnology in Bioformulations; Springer: Cham, Switzerland, 2019; pp. 395–418. [Google Scholar] [CrossRef]
- Bisht, G.; Rayamajhi, S. ZnO Nanoparticles: A Promising Anticancer Agent. Nanobiomedicine 2016, 3, 9. [Google Scholar] [CrossRef] [PubMed]
- Valsalakumari, J.; Baby, J.; Bijin, E.; Constantine, I.; Manjila, S.; Pramod, K. Novel gene delivery systems. Int. J. Pharm. Investig. 2013, 3, 1. [Google Scholar] [CrossRef] [PubMed] [Green Version]
- Yong, H.E.; Krishnamoorthy, K.; Hyun, K.T.; Kim, S.J. Preparation of ZnO nanopaint for marine antifouling applications. J. Ind. Eng. Chem. 2015, 29, 39–42. [Google Scholar] [CrossRef]
- Du, J.; Du, Z.; Hu, J.-S.; Pan, Z.; Shen, Q.; Sun, J.; Long, D.; Dong, H.; Sun, L.; Zhong, X.; et al. Zn–Cu–In–Se Quantum Dot Solar Cells with a Certified Power Conversion Efficiency of 11.6%. J. Am. Chem. Soc. 2016, 138, 4201–4209. [Google Scholar] [CrossRef]
- Zhao, K.; Pan, Z.; Mora-Seró, I.; Cánovas, E.; Wang, H.; Song, Y.; Gong, X.; Wang, J.; Bonn, M.; Bisquert, J.; et al. Boosting Power Conversion Efficiencies of Quantum-Dot-Sensitized Solar Cells Beyond 8% by Recombination Control. J. Am. Chem. Soc. 2015, 137, 5602–5609. [Google Scholar] [CrossRef] [PubMed]
- Ma, J.; Bai, H.; Zhang, J.; Yuan, Y.; Ni, J.; Zhang, K. Size-controlled nc-Si:H/a-SiC:H quantum dots superlattice and its application to hydrogenated amorphous silicon solar cells. Sol. Energy Mater. Sol. Cells 2016, 157, 923–929. [Google Scholar] [CrossRef]
- Patterson, A.L. The Diffraction of X-Rays by Small Crystalline Particles. Phys. Rev. 1939, 56, 972–977. [Google Scholar] [CrossRef]
- Khan, R.; Hassan, M.S.; Jang, L.-W.; Hyeon Yun, J.; Ahn, H.-K.; Khil, M.-S.; Lee, I.-H. Low-temperature synthesis of ZnO quantum dots for photocatalytic degradation of methyl orange dye under UV irradiation. Ceram. Int. 2014, 40, 14827–14831. [Google Scholar] [CrossRef]
- Fan, F.; Feng, Y.; Bai, S.; Feng, J.; Chen, A.; Li, D. Synthesis and gas sensing properties to NO2 of ZnO nanoparticles. Sens. Actuators B Chem. 2013, 185, 377–382. [Google Scholar] [CrossRef]
- Yang, W.; Zhang, B.; Ding, N.; Ding, W.; Wang, L.; Yu, M.; Zhang, Q. Fast synthesize ZnO quantum dots via ultrasonic method. Ultrason. Sonochem 2016, 30, 103–112. [Google Scholar] [CrossRef] [PubMed]
- Klaumünzer, M.; Distaso, M.; Hübner, J.; Mačković, M.; Spiecker, E.; Kryschi, C.; Peukert, W. ZnO superstructures via oriented aggregation initiated in a block copolymer melt. CrystEngComm 2014, 16, 1502–1513. [Google Scholar] [CrossRef] [Green Version]
- Vidhya, K.; Saravanan, M.; Bhoopathi, G.; Devarajan, V.P.; Subanya, S. Structural and optical characterization of pure and starch-capped ZnO quantum dots and their photocatalytic activity. Appl. Nanosci. 2014, 5, 235–243. [Google Scholar] [CrossRef] [Green Version]
- Hirai, T.; Harada, Y.; Hashimoto, S.; Itoh, T.; Ohno, N. Luminescence of excitons in mesoscopic ZnO particles. J. Lumin. 2005, 112, 196–199. [Google Scholar] [CrossRef]
- Mursal; Irhamni; Bukhari; Jalil, Z. Structural and Optical Properties of Zinc Oxide (ZnO) based Thin Films Deposited by Sol-Gel Spin Coating Method. J. Phys. Conf. Ser. 2018, 1116, 032020. [Google Scholar] [CrossRef]
- Lee, K.M.; Lai, C.W.; Ngai, K.S.; Juan, J.C. Recent developments of zinc oxide based photocatalyst in water treatment technology: A review. Water Res. 2016, 88, 428–448. [Google Scholar] [CrossRef] [PubMed]
- Ashouri, R.; Ghasemipoor, P.; Rasekh, B.; Yazdian, F.; Mofradnia, S.R.; Fattahi, M. The effect of ZnO-based carbonaceous materials for degradation of benzoic pollutants: A review. Int. J. Environ. Sci. Technol. 2018, 16, 1729–1740. [Google Scholar] [CrossRef]
- Samadi, M.; Zirak, M.; Naseri, A.; Kheirabadi, M.; Ebrahimi, M.; Moshfegh, A.Z. Design and tailoring of one-dimensional ZnO nanomaterials for photocatalytic degradation of organic dyes: A review. Res. Chem. Intermed. 2019, 45, 2197–2254. [Google Scholar] [CrossRef]
- Samadi, M.; Zirak, M.; Naseri, A.; Khorashadizade, E.; Moshfegh, A.Z. Recent progress on doped ZnO nanostructures for visible-light photocatalysis. Thin Solid Film. 2016, 605, 2–19. [Google Scholar] [CrossRef] [Green Version]
- Raza, W.; Faisal, S.M.; Owais, M.; Bahnemann, D.; Muneer, M. Facile fabrication of highly efficient modified ZnO photocatalyst with enhanced photocatalytic, antibacterial and anticancer activity. RSC Adv. 2016, 6, 78335–78350. [Google Scholar] [CrossRef] [Green Version]
- Poongodi, G.; Anandan, P.; Kumar, R.M.; Jayavel, R. Studies on visible light photocatalytic and antibacterial activities of nanostructured cobalt doped ZnO thin films prepared by sol–gel spin coating method. Spectrochim. Acta Part A Mol. Biomol. Spectrosc. 2015, 148, 237–243. [Google Scholar] [CrossRef] [PubMed]
- Raizada, P.; Sudhaik, A.; Singh, P. Photocatalytic water decontamination using graphene and ZnO coupled photocatalysts: A review. Mater. Sci. Energy Technol. 2019, 2, 509–525. [Google Scholar] [CrossRef]
- Munawar, T.; Yasmeen, S.; Hasan, M.; Mahmood, K.; Hussain, A.; Ali, A.; Arshad, M.I.; Iqbal, F. Novel tri-phase heterostructured ZnO–Yb2O3–Pr2O3 nanocomposite; structural, optical, photocatalytic and antibacterial studies. Ceram. Int. 2020, 46, 11101–11114. [Google Scholar] [CrossRef]
- Pant, B.; Ojha, G.P.; Kuk, Y.S.; Kwon, O.H.; Park, Y.W.; Park, M. Synthesis and Characterization of ZnO-TiO2/Carbon Fiber Composite with Enhanced Photocatalytic Properties. Nanomaterials 2020, 10, 1960. [Google Scholar] [CrossRef]
- Jain, B.; Hashmi, A.; Sanwaria, S.; Singh, A.K.; Susan, M.A.B.H.; Singh, A. Zinc oxide nanoparticle incorporated on graphene oxide: An efficient and stable photocatalyst for water treatment through the Fenton process. Adv. Compos. Hybrid Mater. 2020, 3, 231–242. [Google Scholar] [CrossRef]
- The Egyptian Society of Environmental Changes. Environmental Change. In The Egyptian Journal of Environmental Change; The Egyptian Society of Environmental Changes: Alexandria, Egypt, 2009; Volume 1, pp. 1–2. [Google Scholar] [CrossRef]


| (Z1 = 6.9 nm) | (Z2 = 8.3 nm) | |
|---|---|---|
| Kf | 39.59 × 10⁻³ S−1 | 27.62 × 10⁻³ S−1 |
| Kapp | 10.30 × 10⁻³ S−1 | 8.59 × 10⁻³ S−1 |
| Sample Investigated Date | NO. of Recycling Process | COD Value (ppm) | ||
|---|---|---|---|---|
| Z1 (6.9 nm) | Z2 (8.3 nm) | Nano ZnO (25–30 nm) | ||
| 3 February 2021 | 1 | 658 | 725 | 838 |
| 4 February 2021 | 2 | 706 | 783 | 888 |
| 7 February 2021 | 3 | 768 | 844 | 941 |
| 8 February 2021 | 4 | 847 | 915 | 991 |
| 9 February 2021 | 5 | 929 | 988 | 1095 |
| 10 February 2021 | 6 | 989 | 1081 | 1209 |
| 11 February 2021 | 7 | 1065 | 1180 | 1318 |
Publisher’s Note: MDPI stays neutral with regard to jurisdictional claims in published maps and institutional affiliations. |
© 2022 by the authors. Licensee MDPI, Basel, Switzerland. This article is an open access article distributed under the terms and conditions of the Creative Commons Attribution (CC BY) license (https://creativecommons.org/licenses/by/4.0/).
Share and Cite
Mohamed, W.; El-Gawad, H.A.; Handal, H.; Galal, H.; Mousa, H.; El-Sayed, B.; Mekkey, S.; Ibrahem, I.; Labib, A. Remarkable Recycling Process of ZnO Quantum Dots for Photodegradation of Reactive Yellow Dye and Solar Photocatalytic Treatment Process of Industrial Wastewater. Nanomaterials 2022, 12, 2642. https://doi.org/10.3390/nano12152642
Mohamed W, El-Gawad HA, Handal H, Galal H, Mousa H, El-Sayed B, Mekkey S, Ibrahem I, Labib A. Remarkable Recycling Process of ZnO Quantum Dots for Photodegradation of Reactive Yellow Dye and Solar Photocatalytic Treatment Process of Industrial Wastewater. Nanomaterials. 2022; 12(15):2642. https://doi.org/10.3390/nano12152642
Chicago/Turabian StyleMohamed, Walied, Hala Abd El-Gawad, Hala Handal, Hoda Galal, Hanan Mousa, Badr El-Sayed, Saleh Mekkey, Ibrahem Ibrahem, and Ammar Labib. 2022. "Remarkable Recycling Process of ZnO Quantum Dots for Photodegradation of Reactive Yellow Dye and Solar Photocatalytic Treatment Process of Industrial Wastewater" Nanomaterials 12, no. 15: 2642. https://doi.org/10.3390/nano12152642