
Green-Synthesized Silver Nanoparticle–Assisted Radiofrequency Ablation for Improved Thermal Treatment Distribution

 ,
,  , , and
Abstract
:1. Introduction
2. Materials and Methods
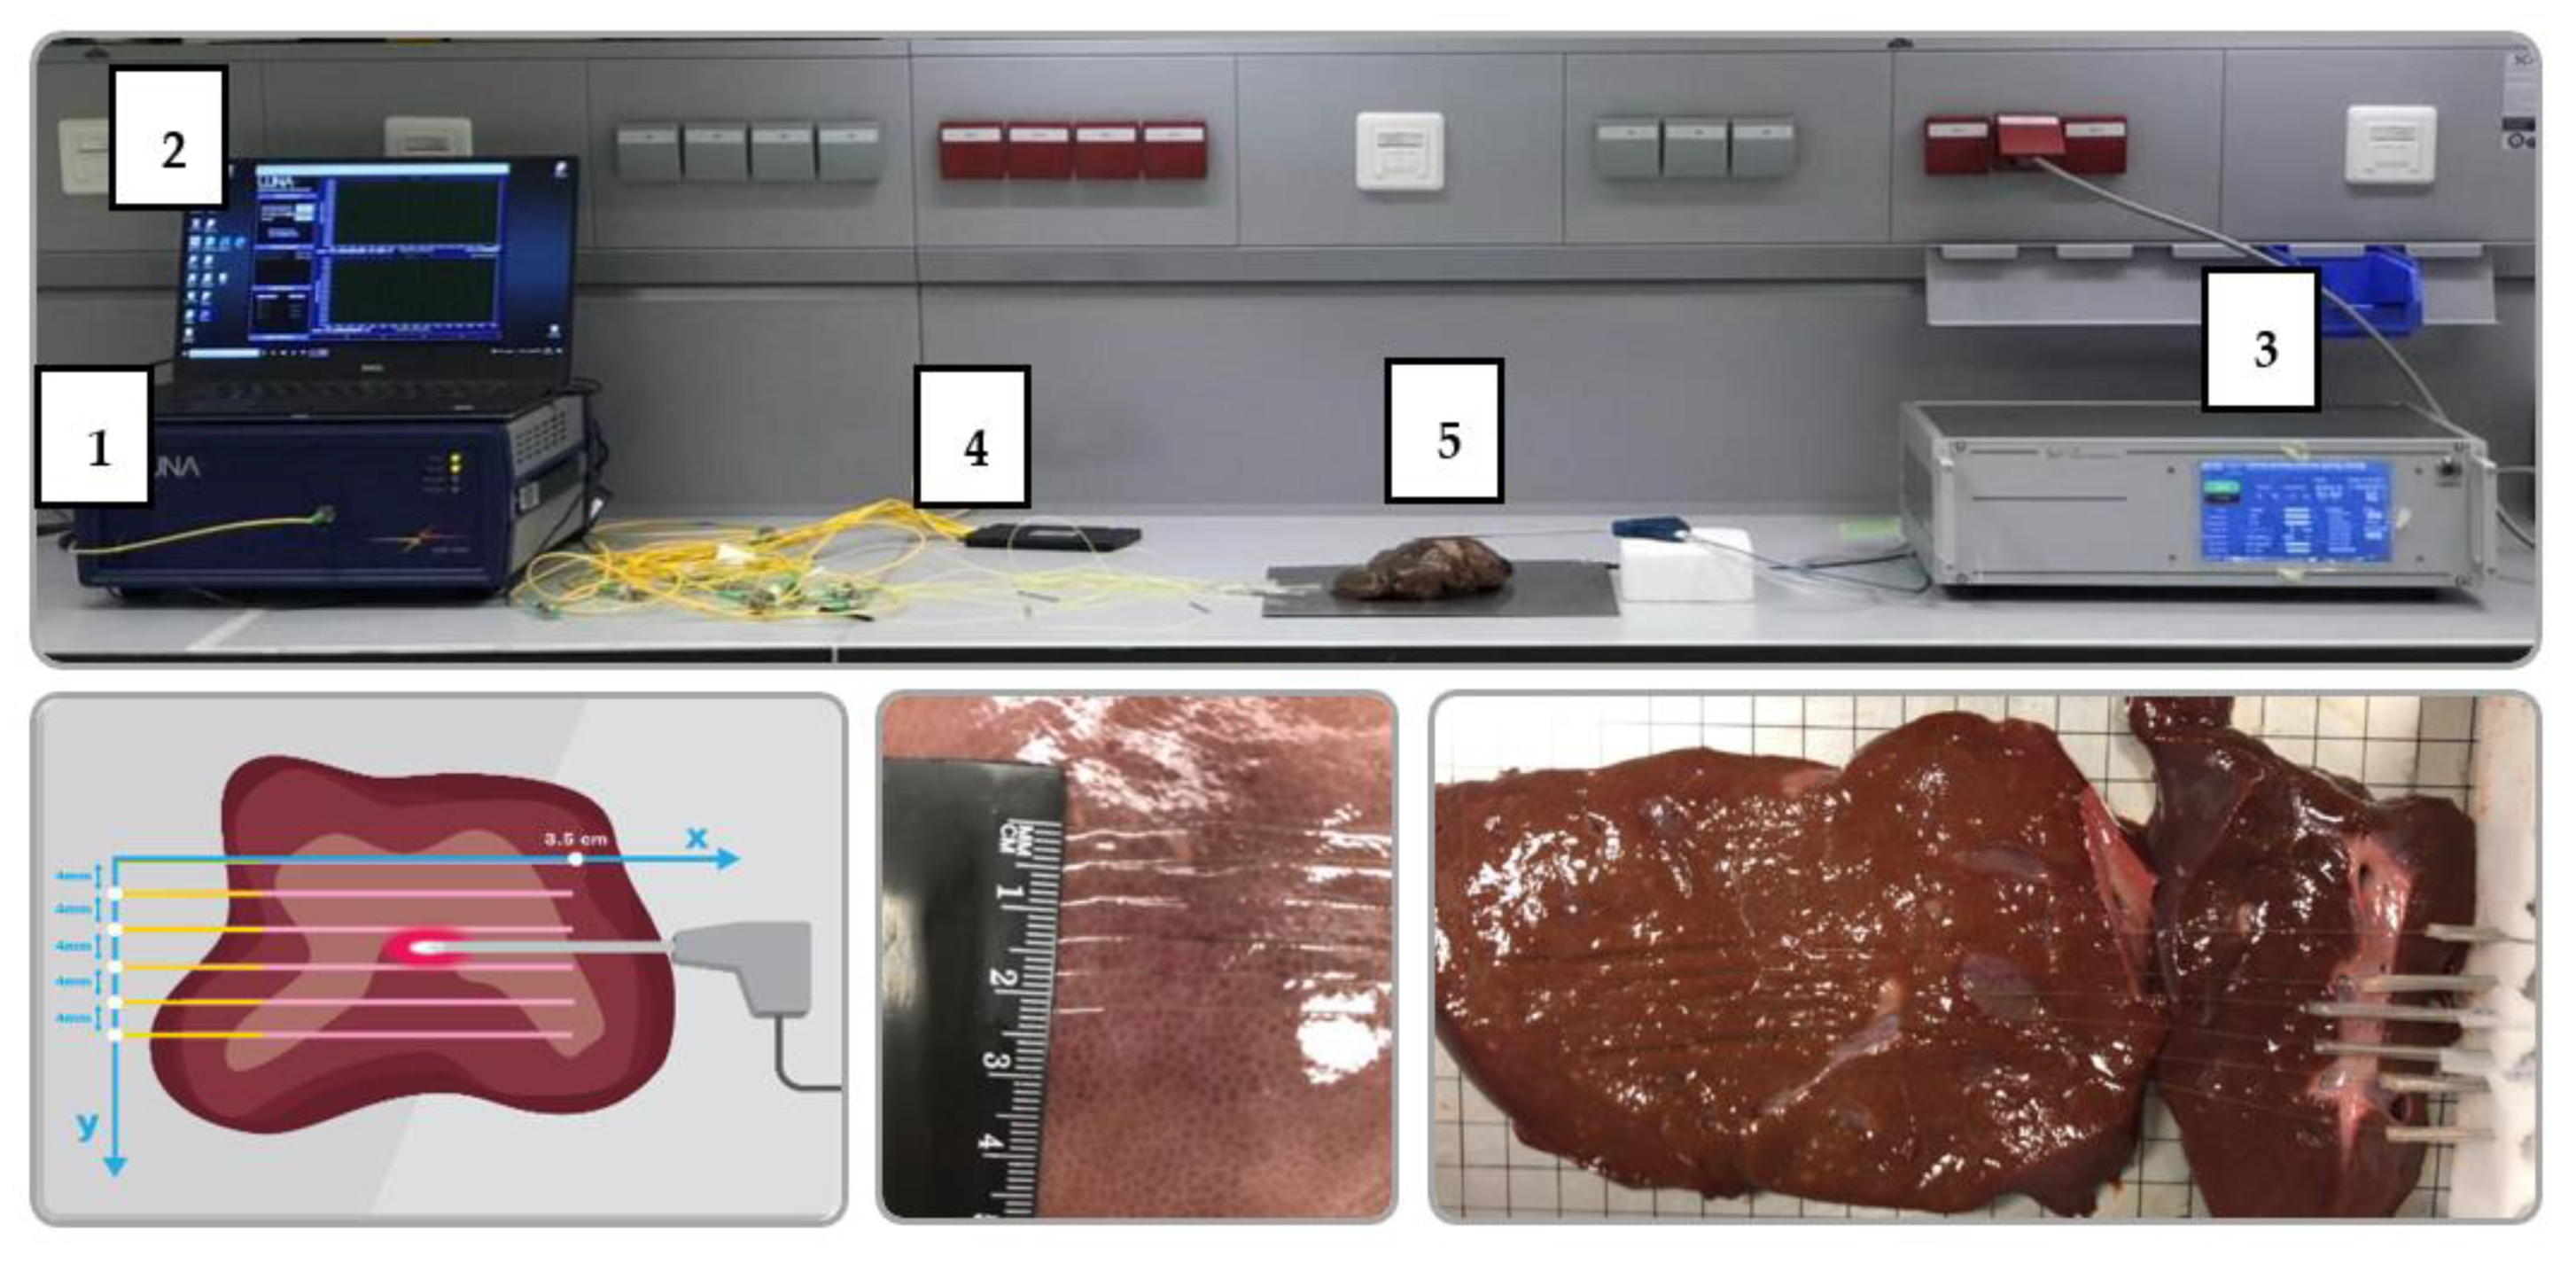
2.1. Experimental Setup
2.2. Data Acquisition and Processing
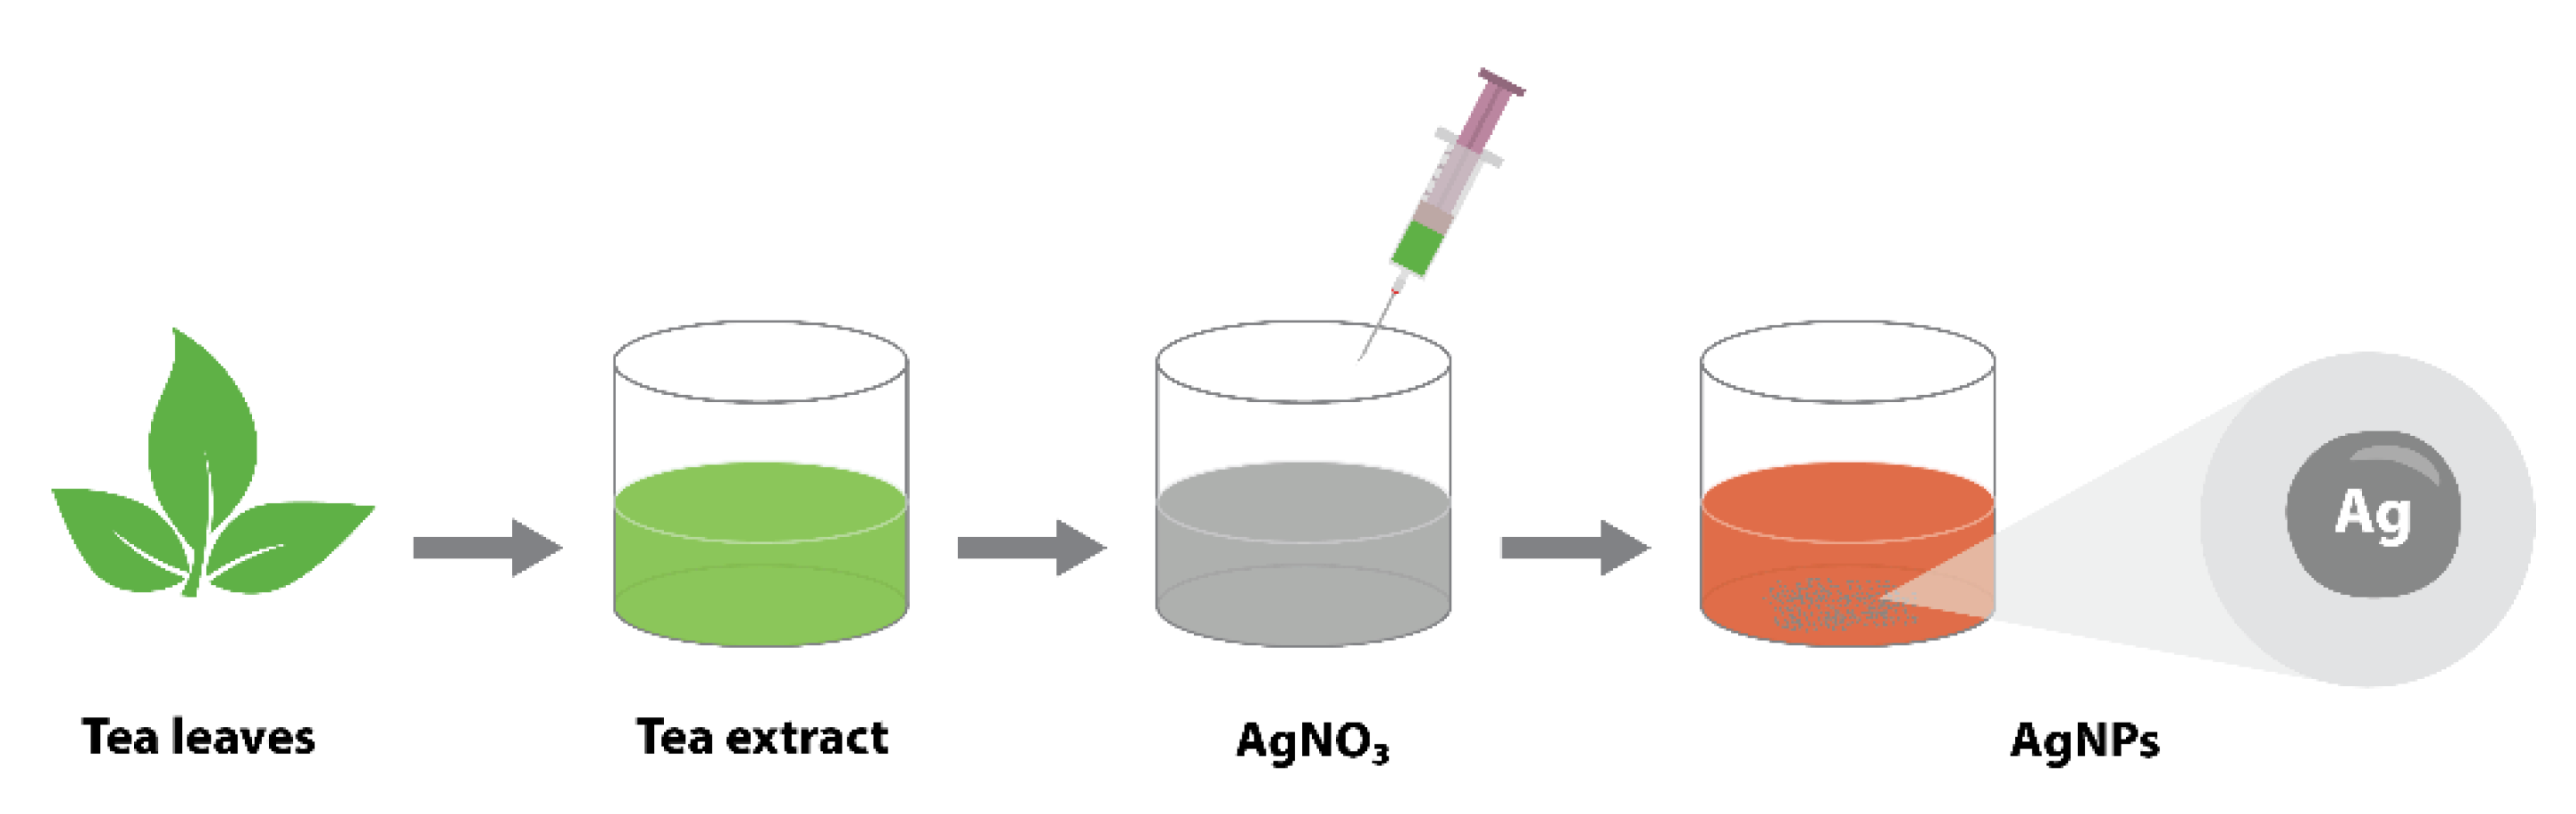
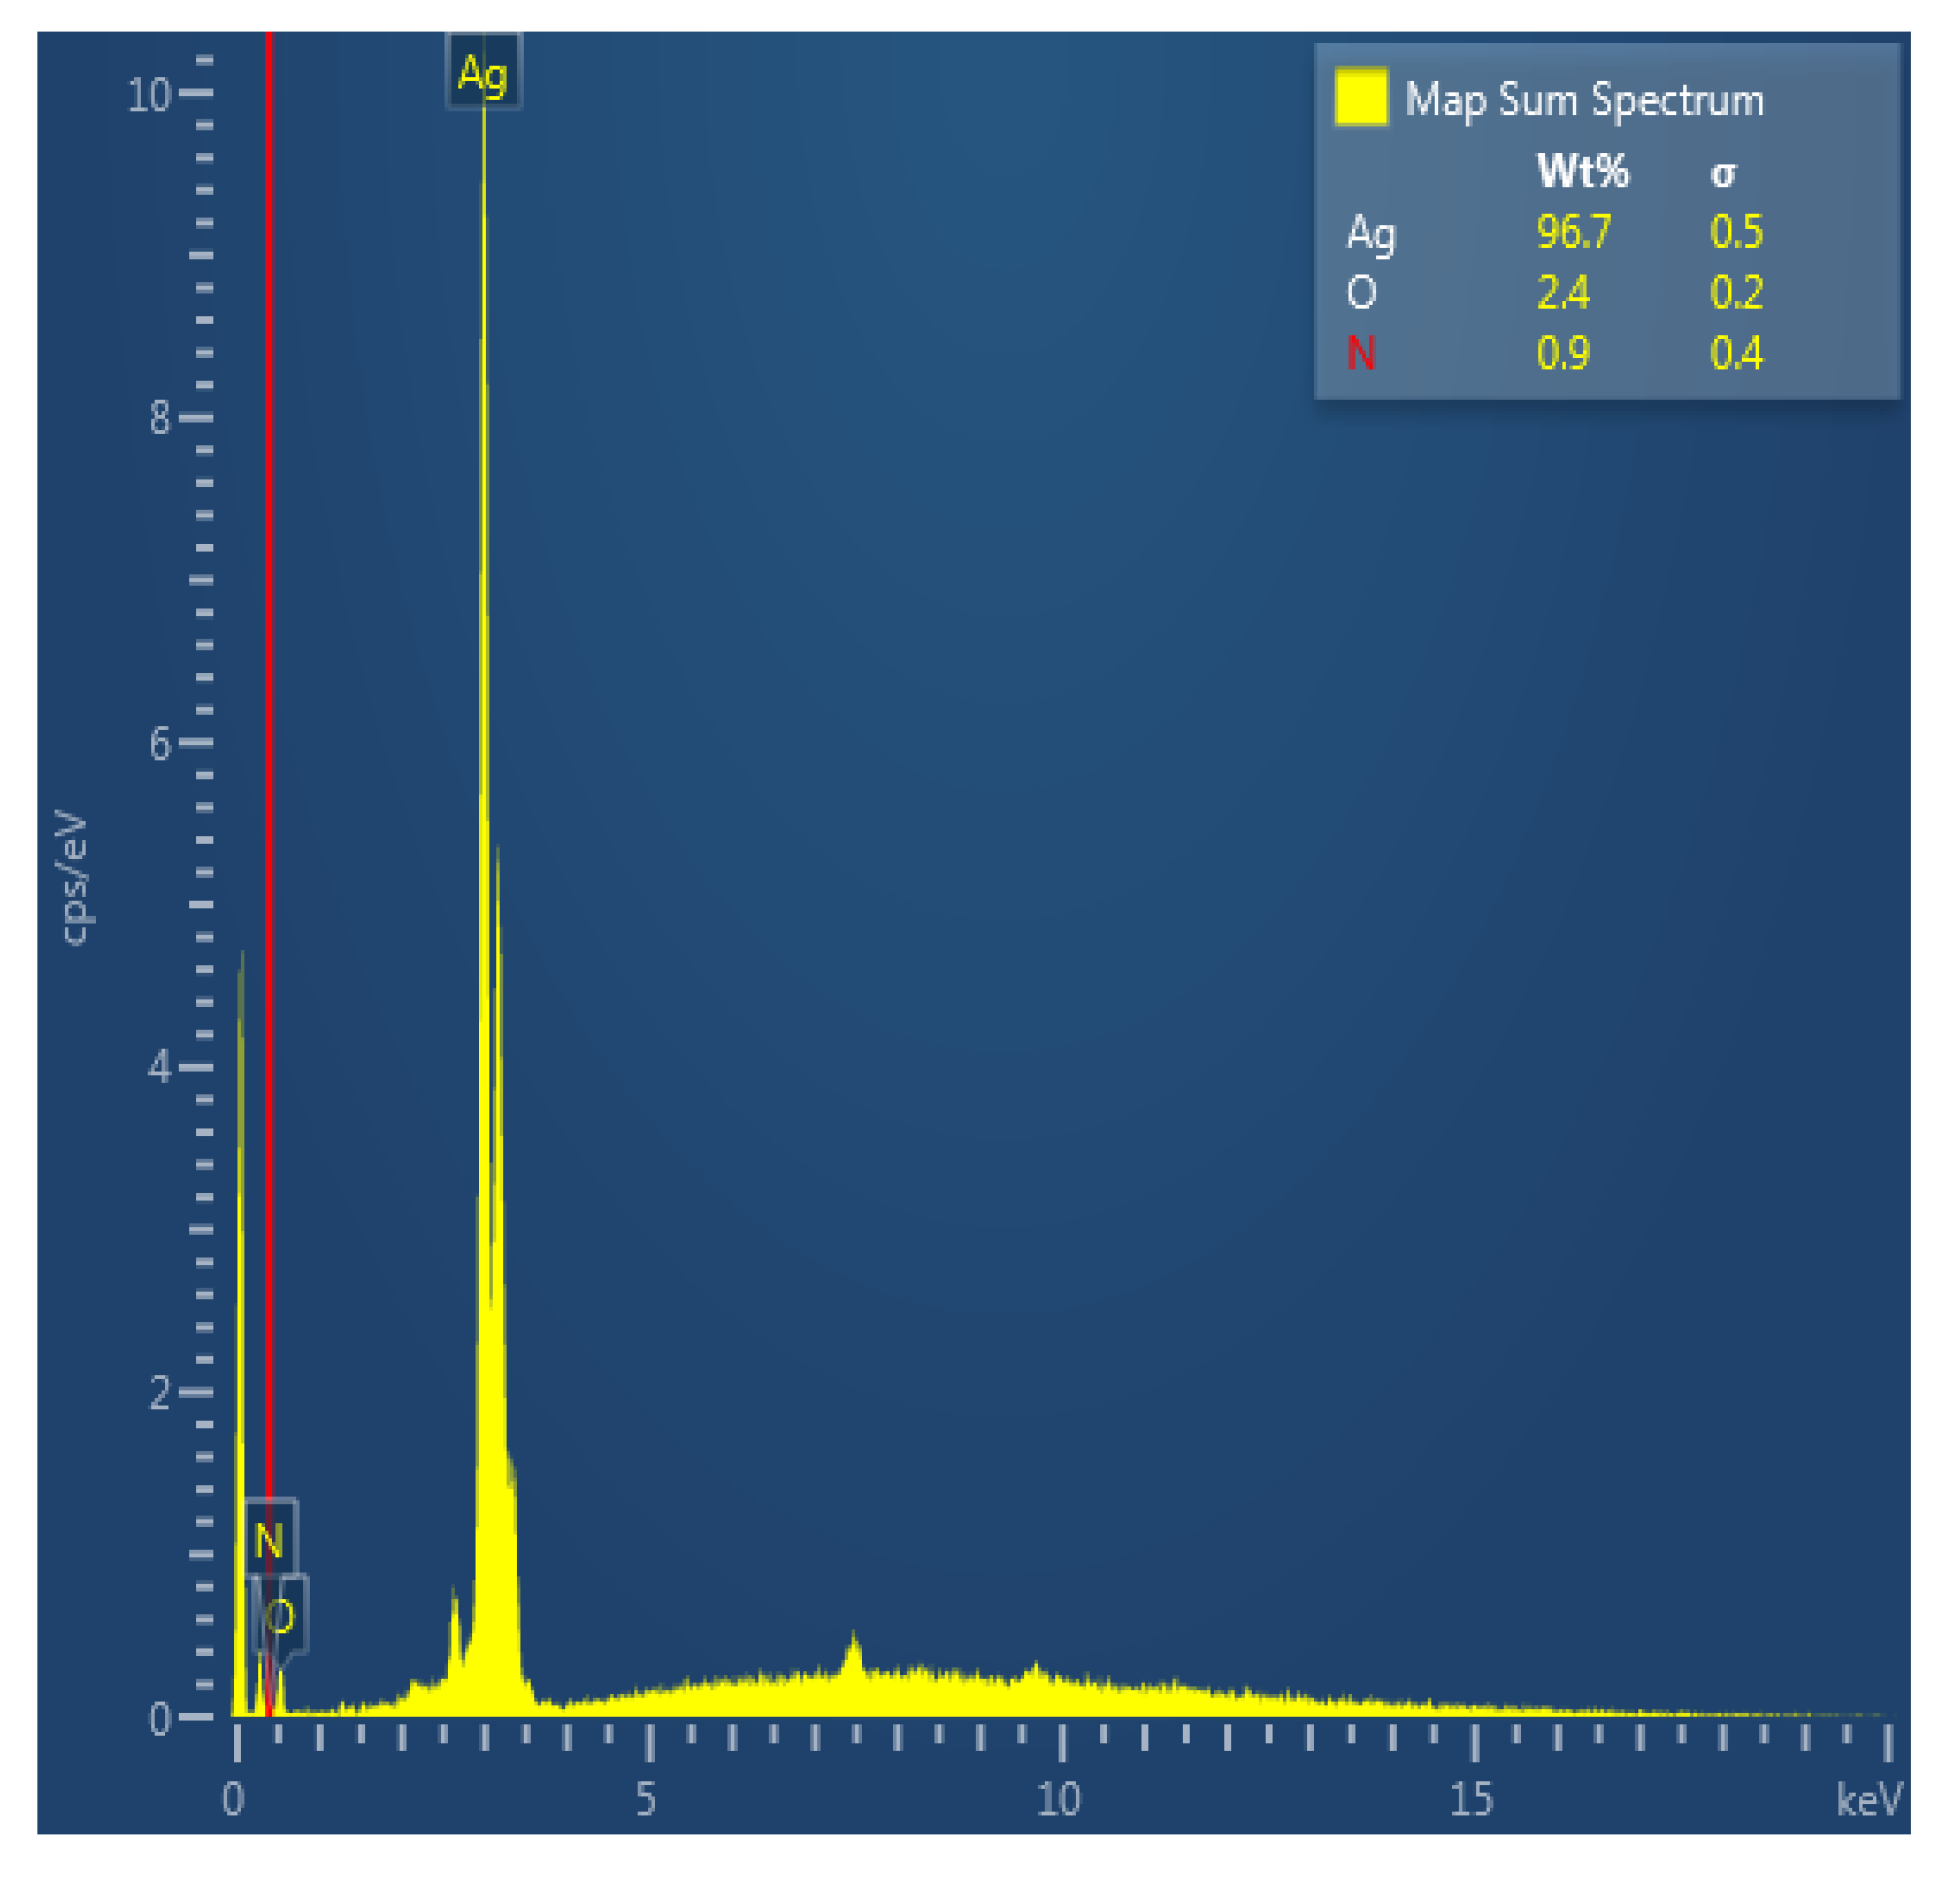
2.3. Synthesis and Characterization of Silver Nanoparticles
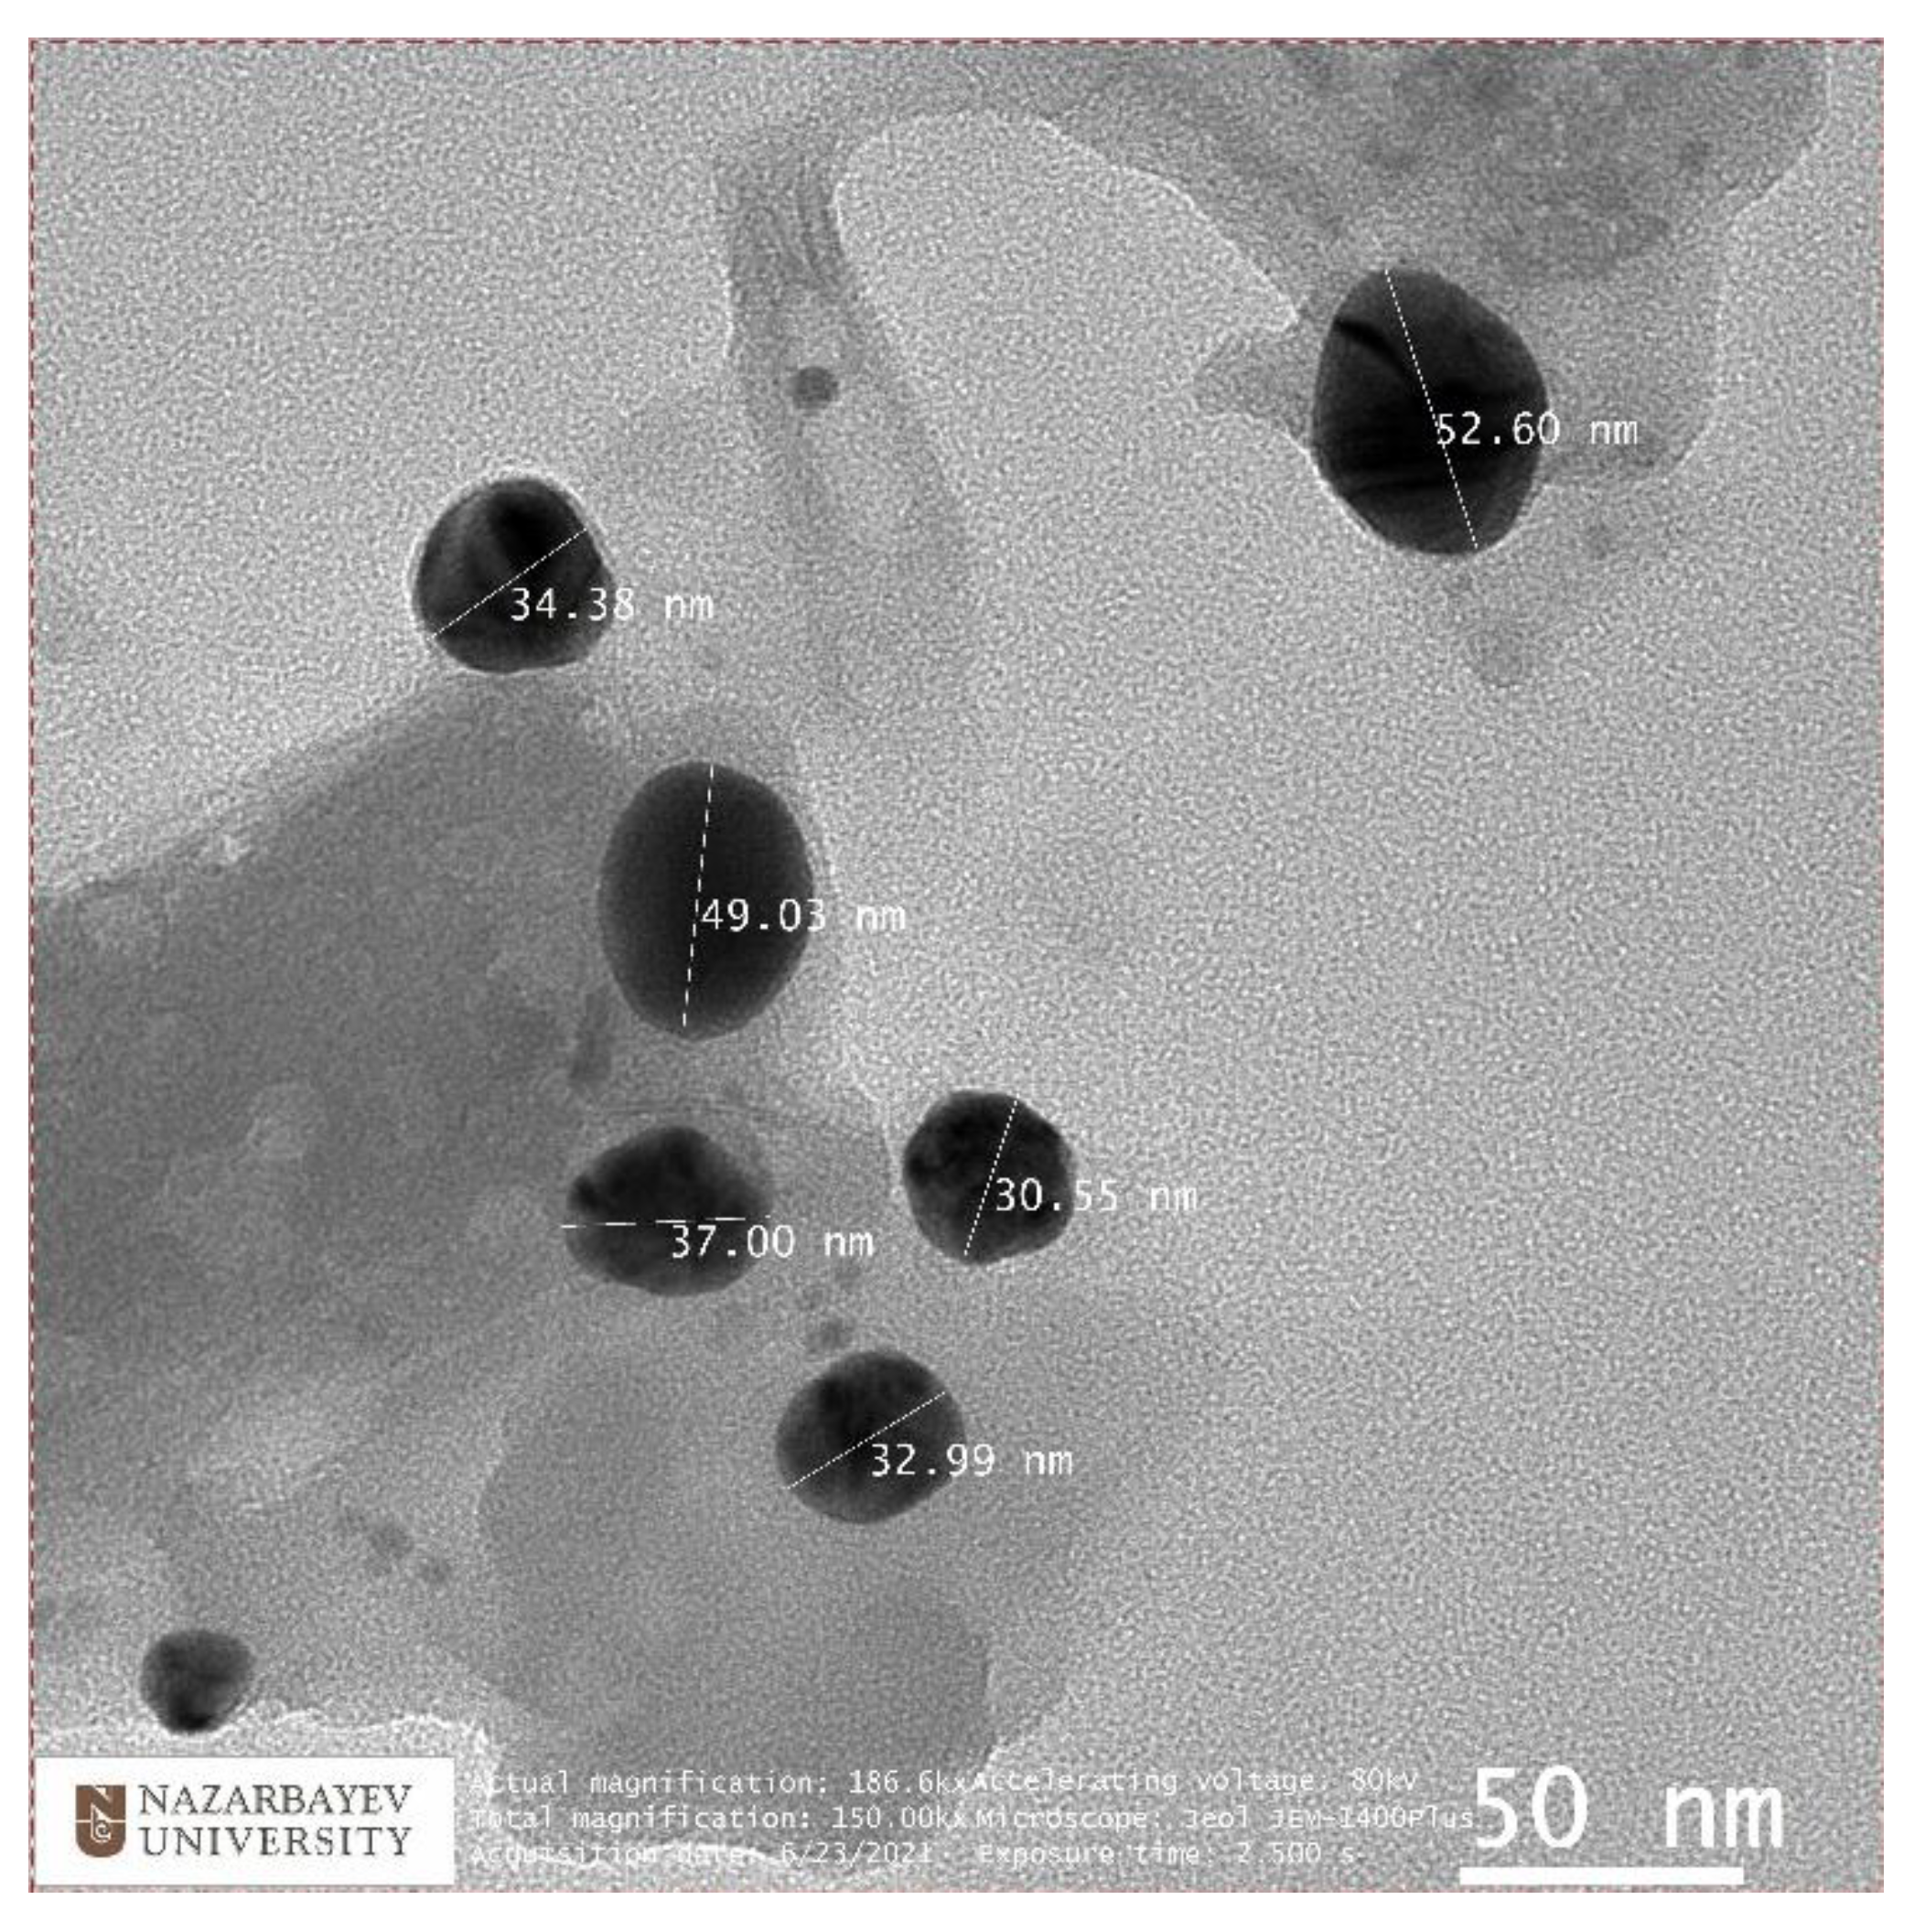
2.3.1. Transmission Electron Microscopy
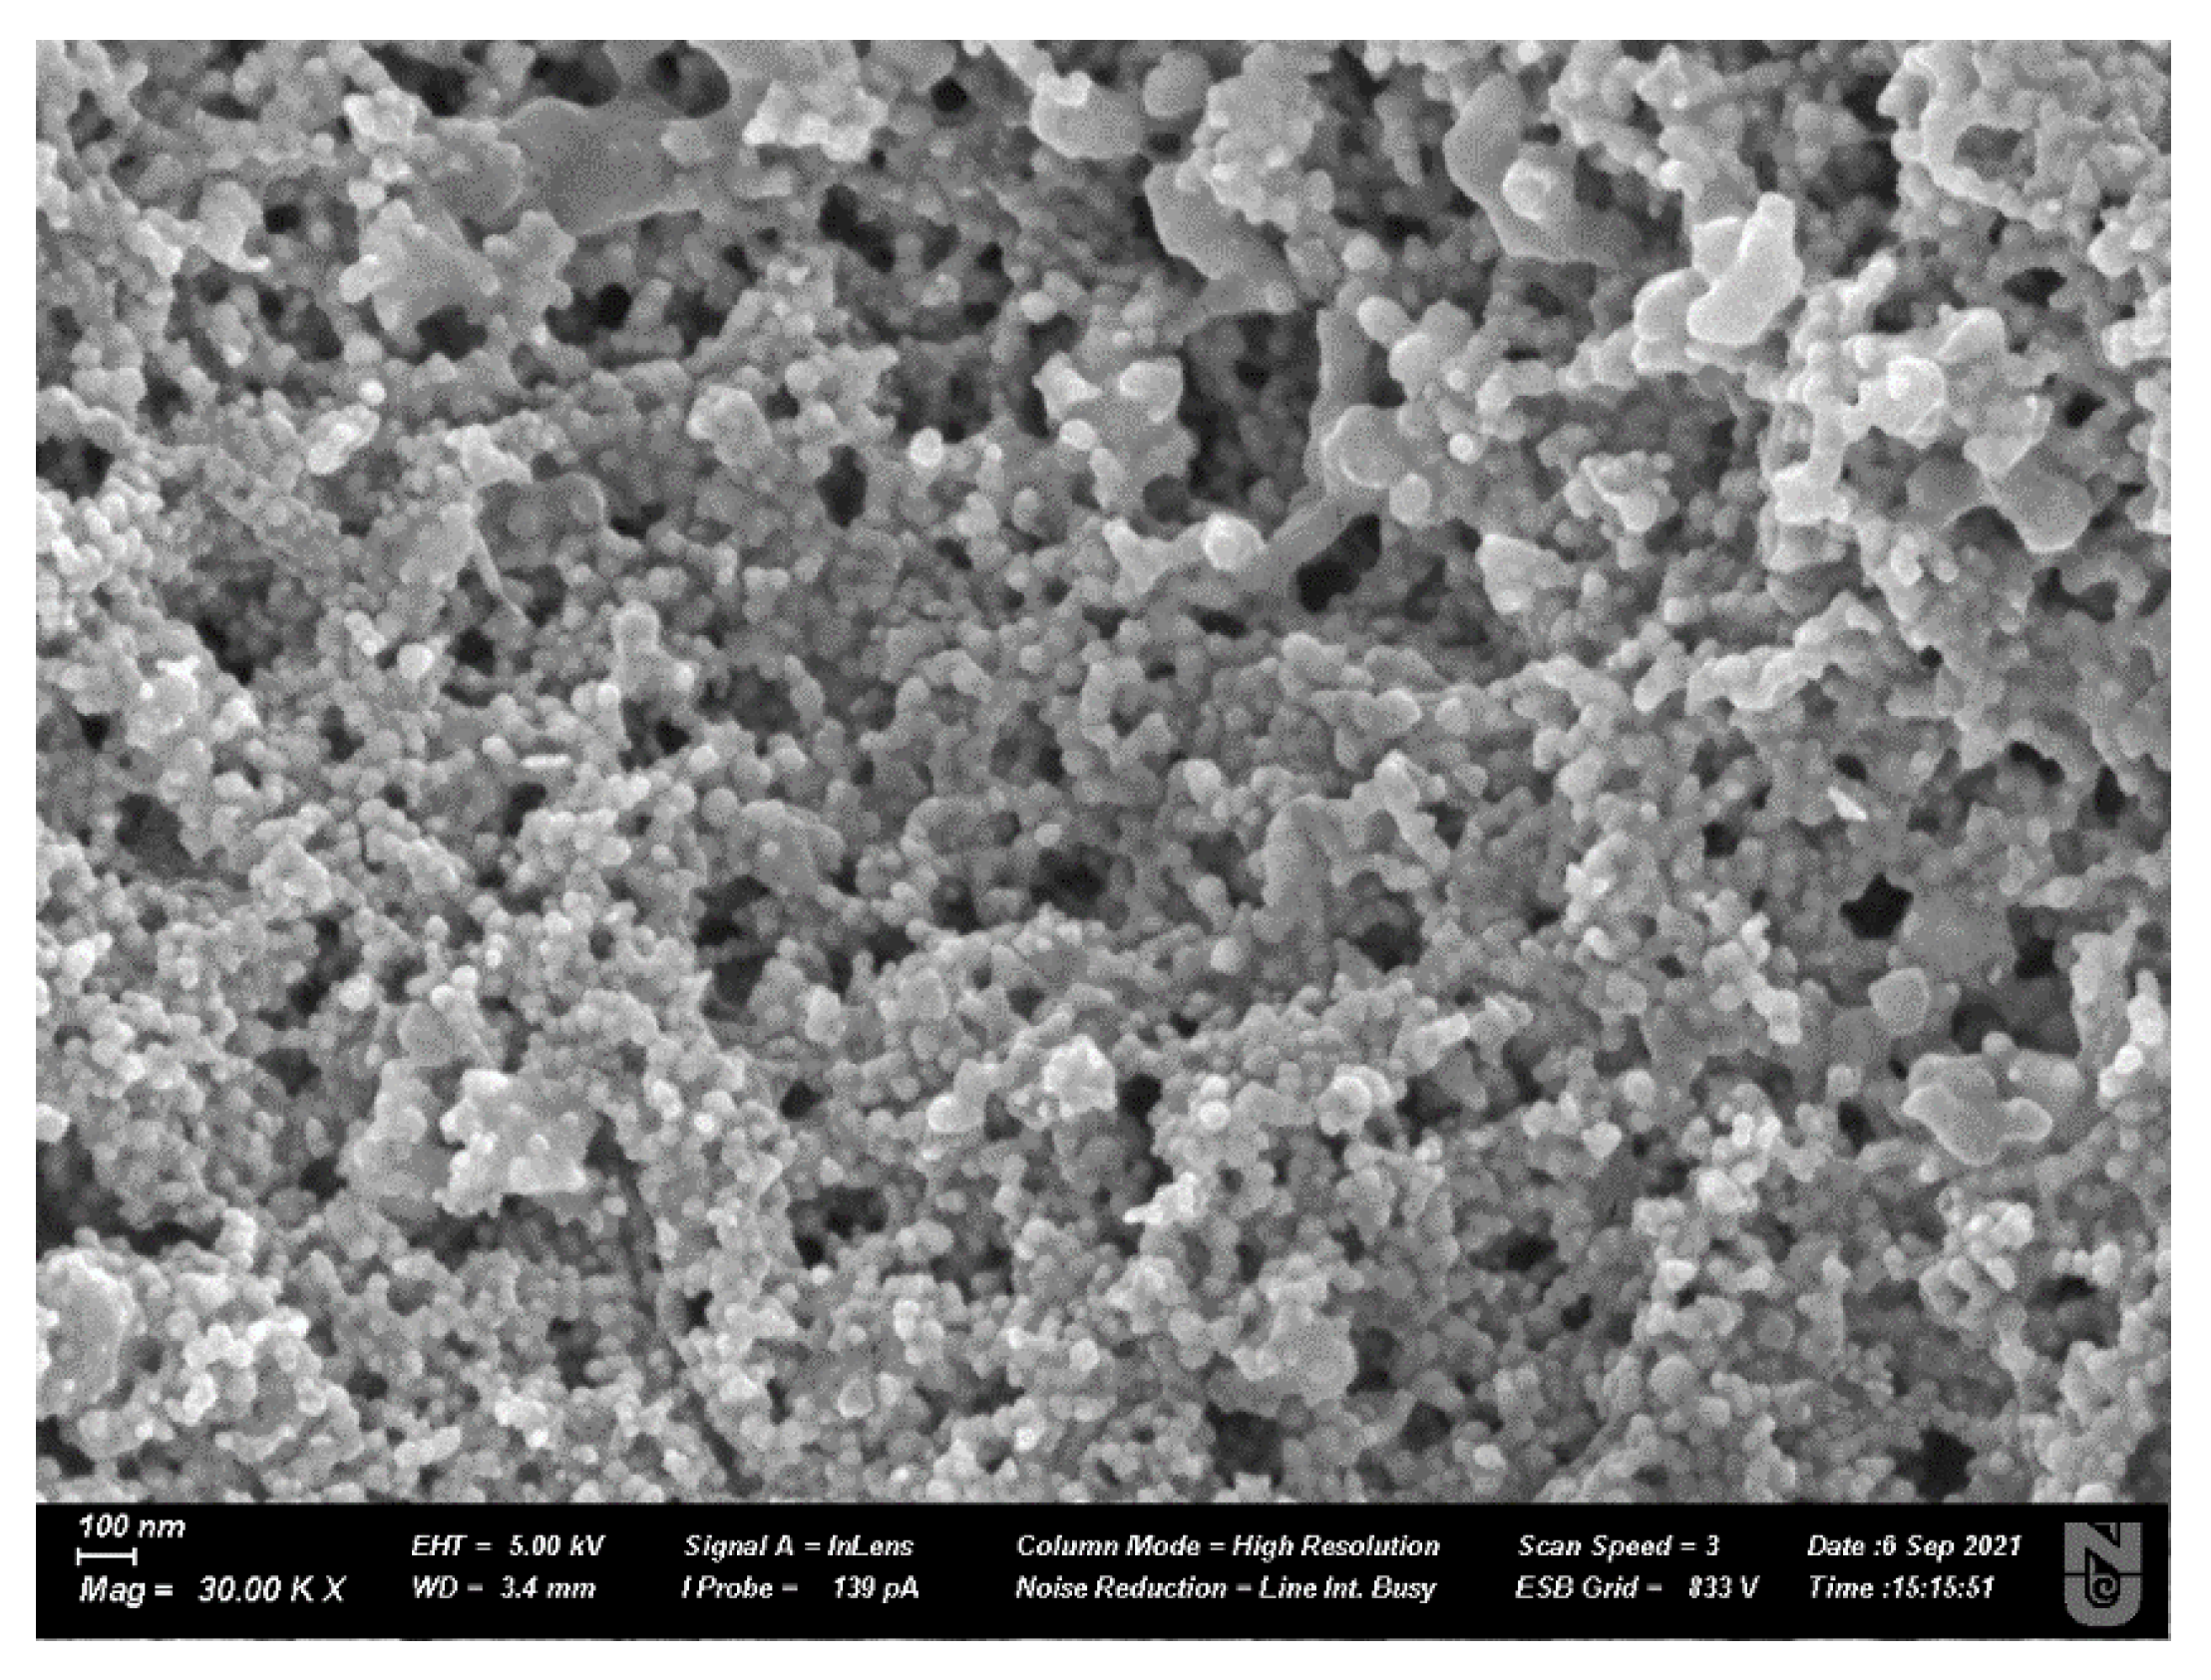
2.3.2. Scanning Electron Microscopy
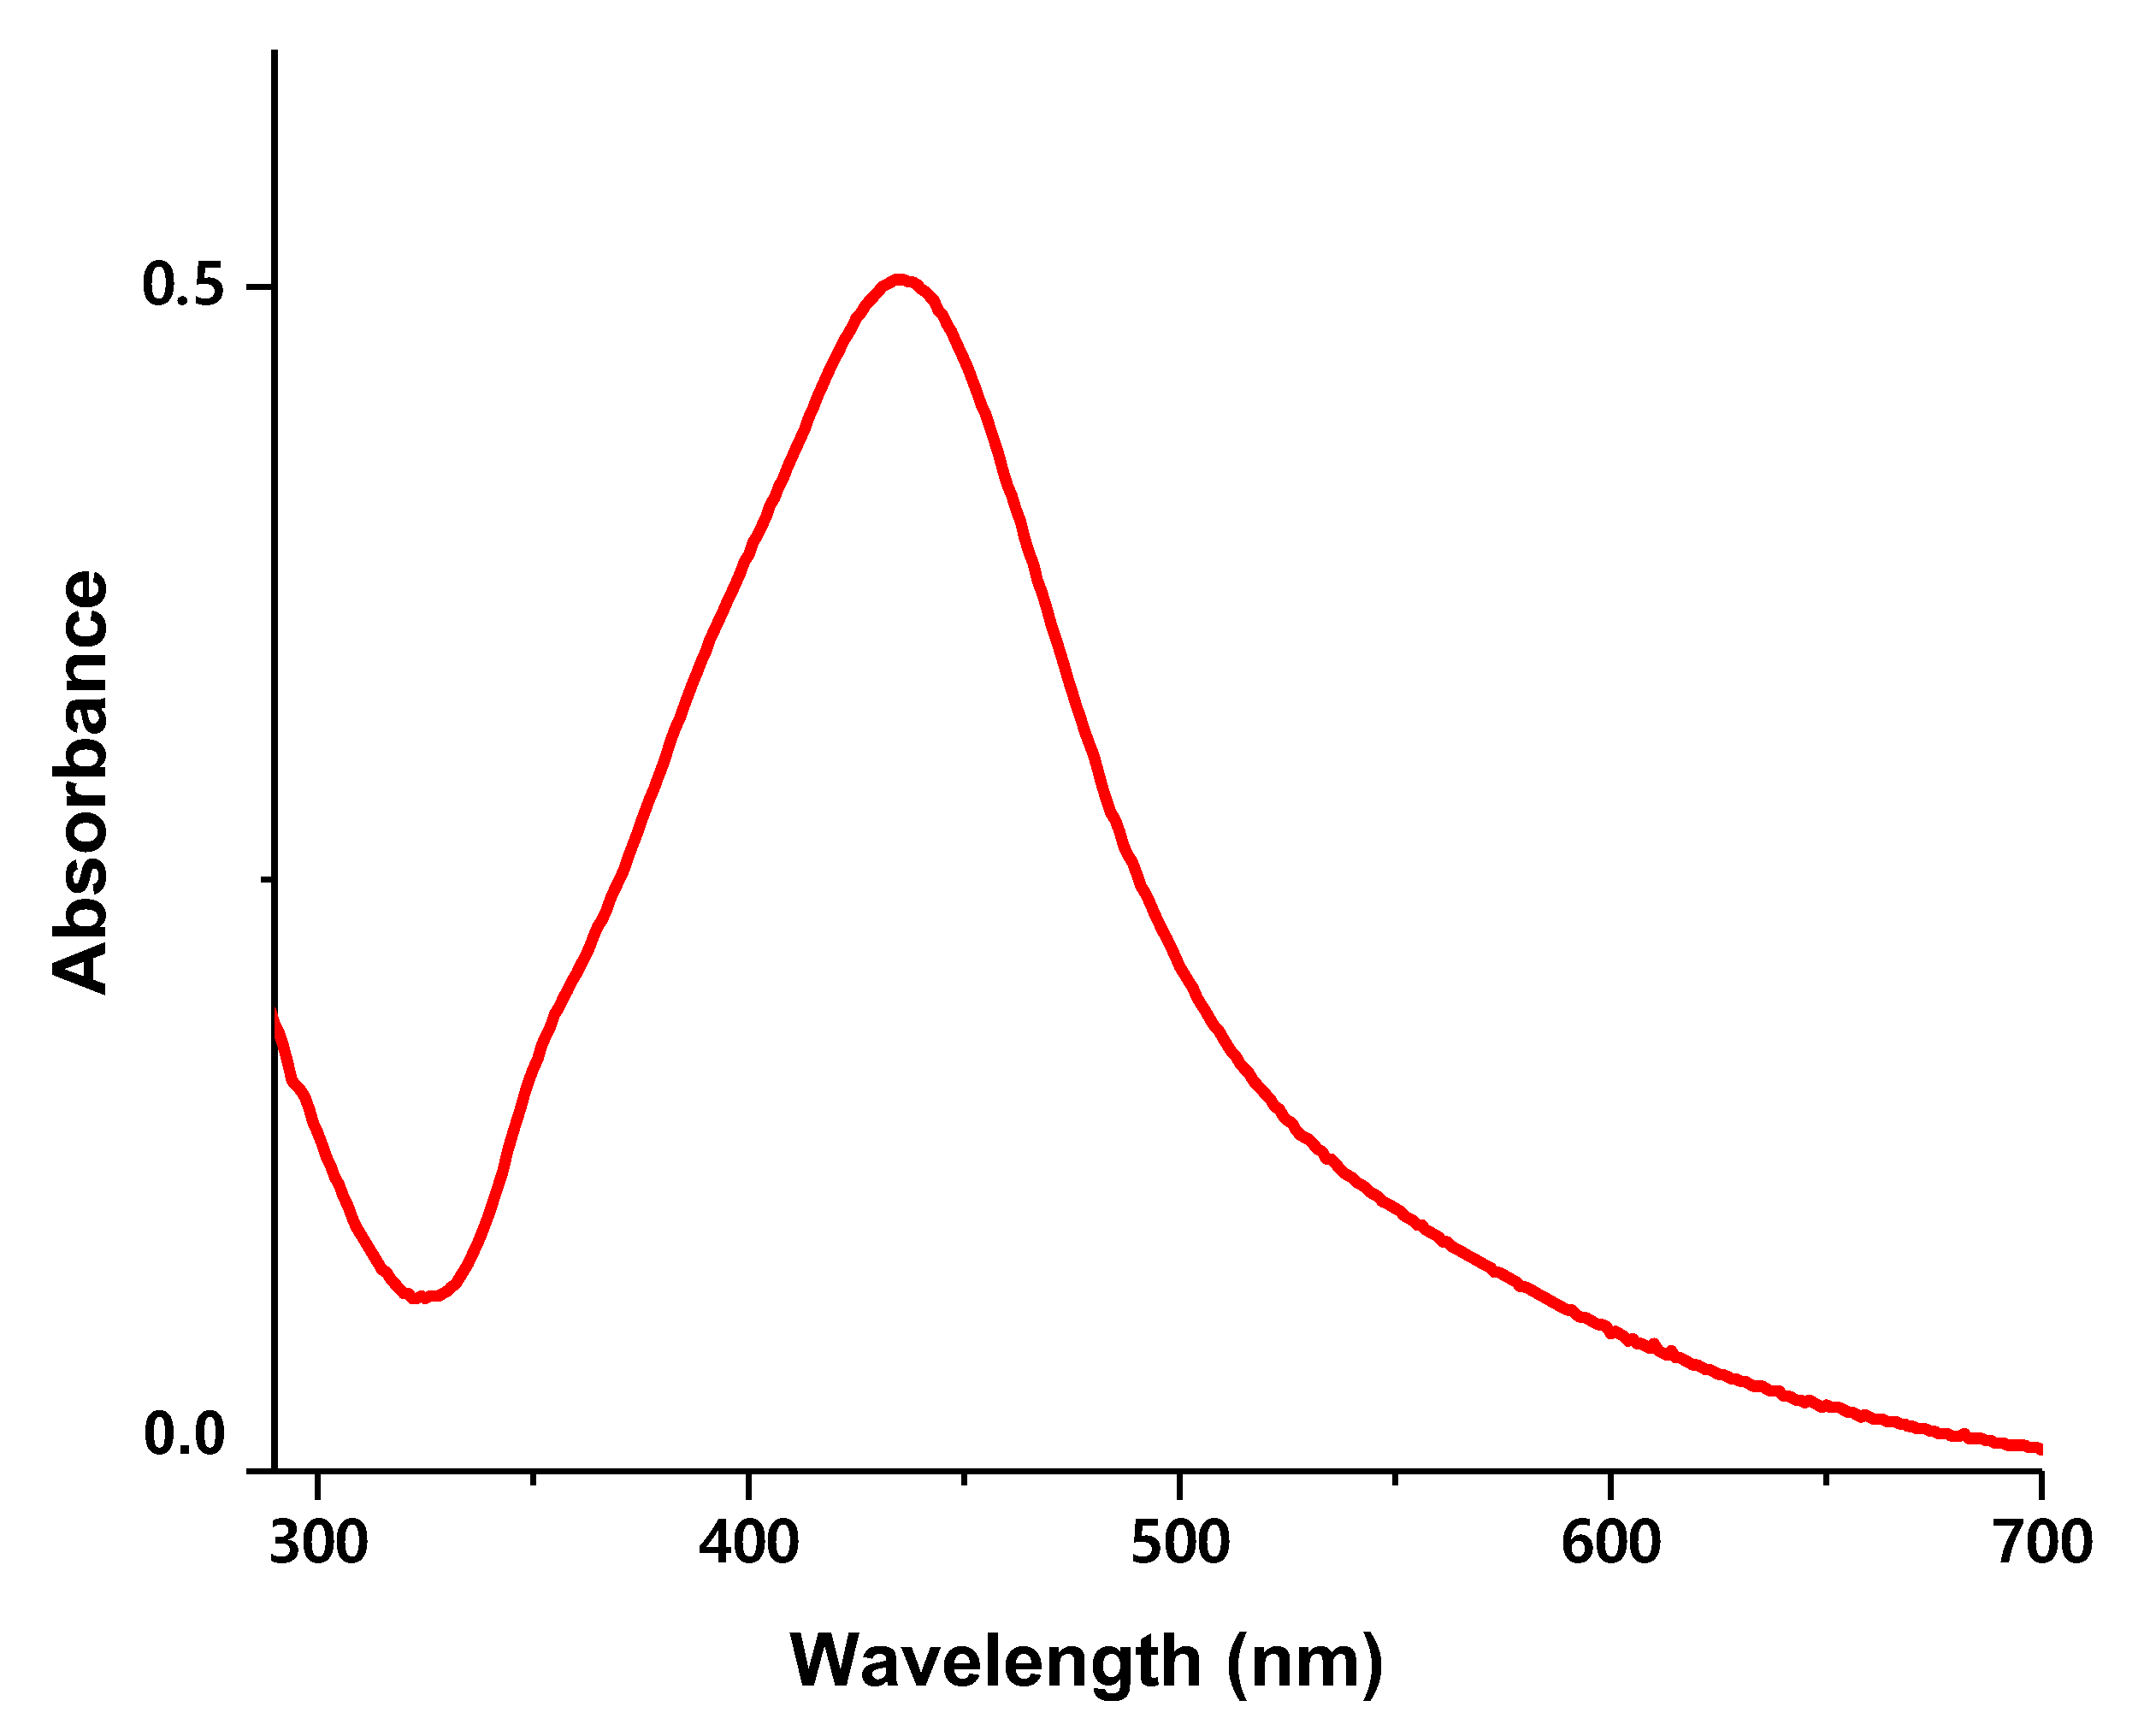
2.3.3. UV-VIS
2.3.4. Fourier-Transform Infrared Reflectometry (FTIR)
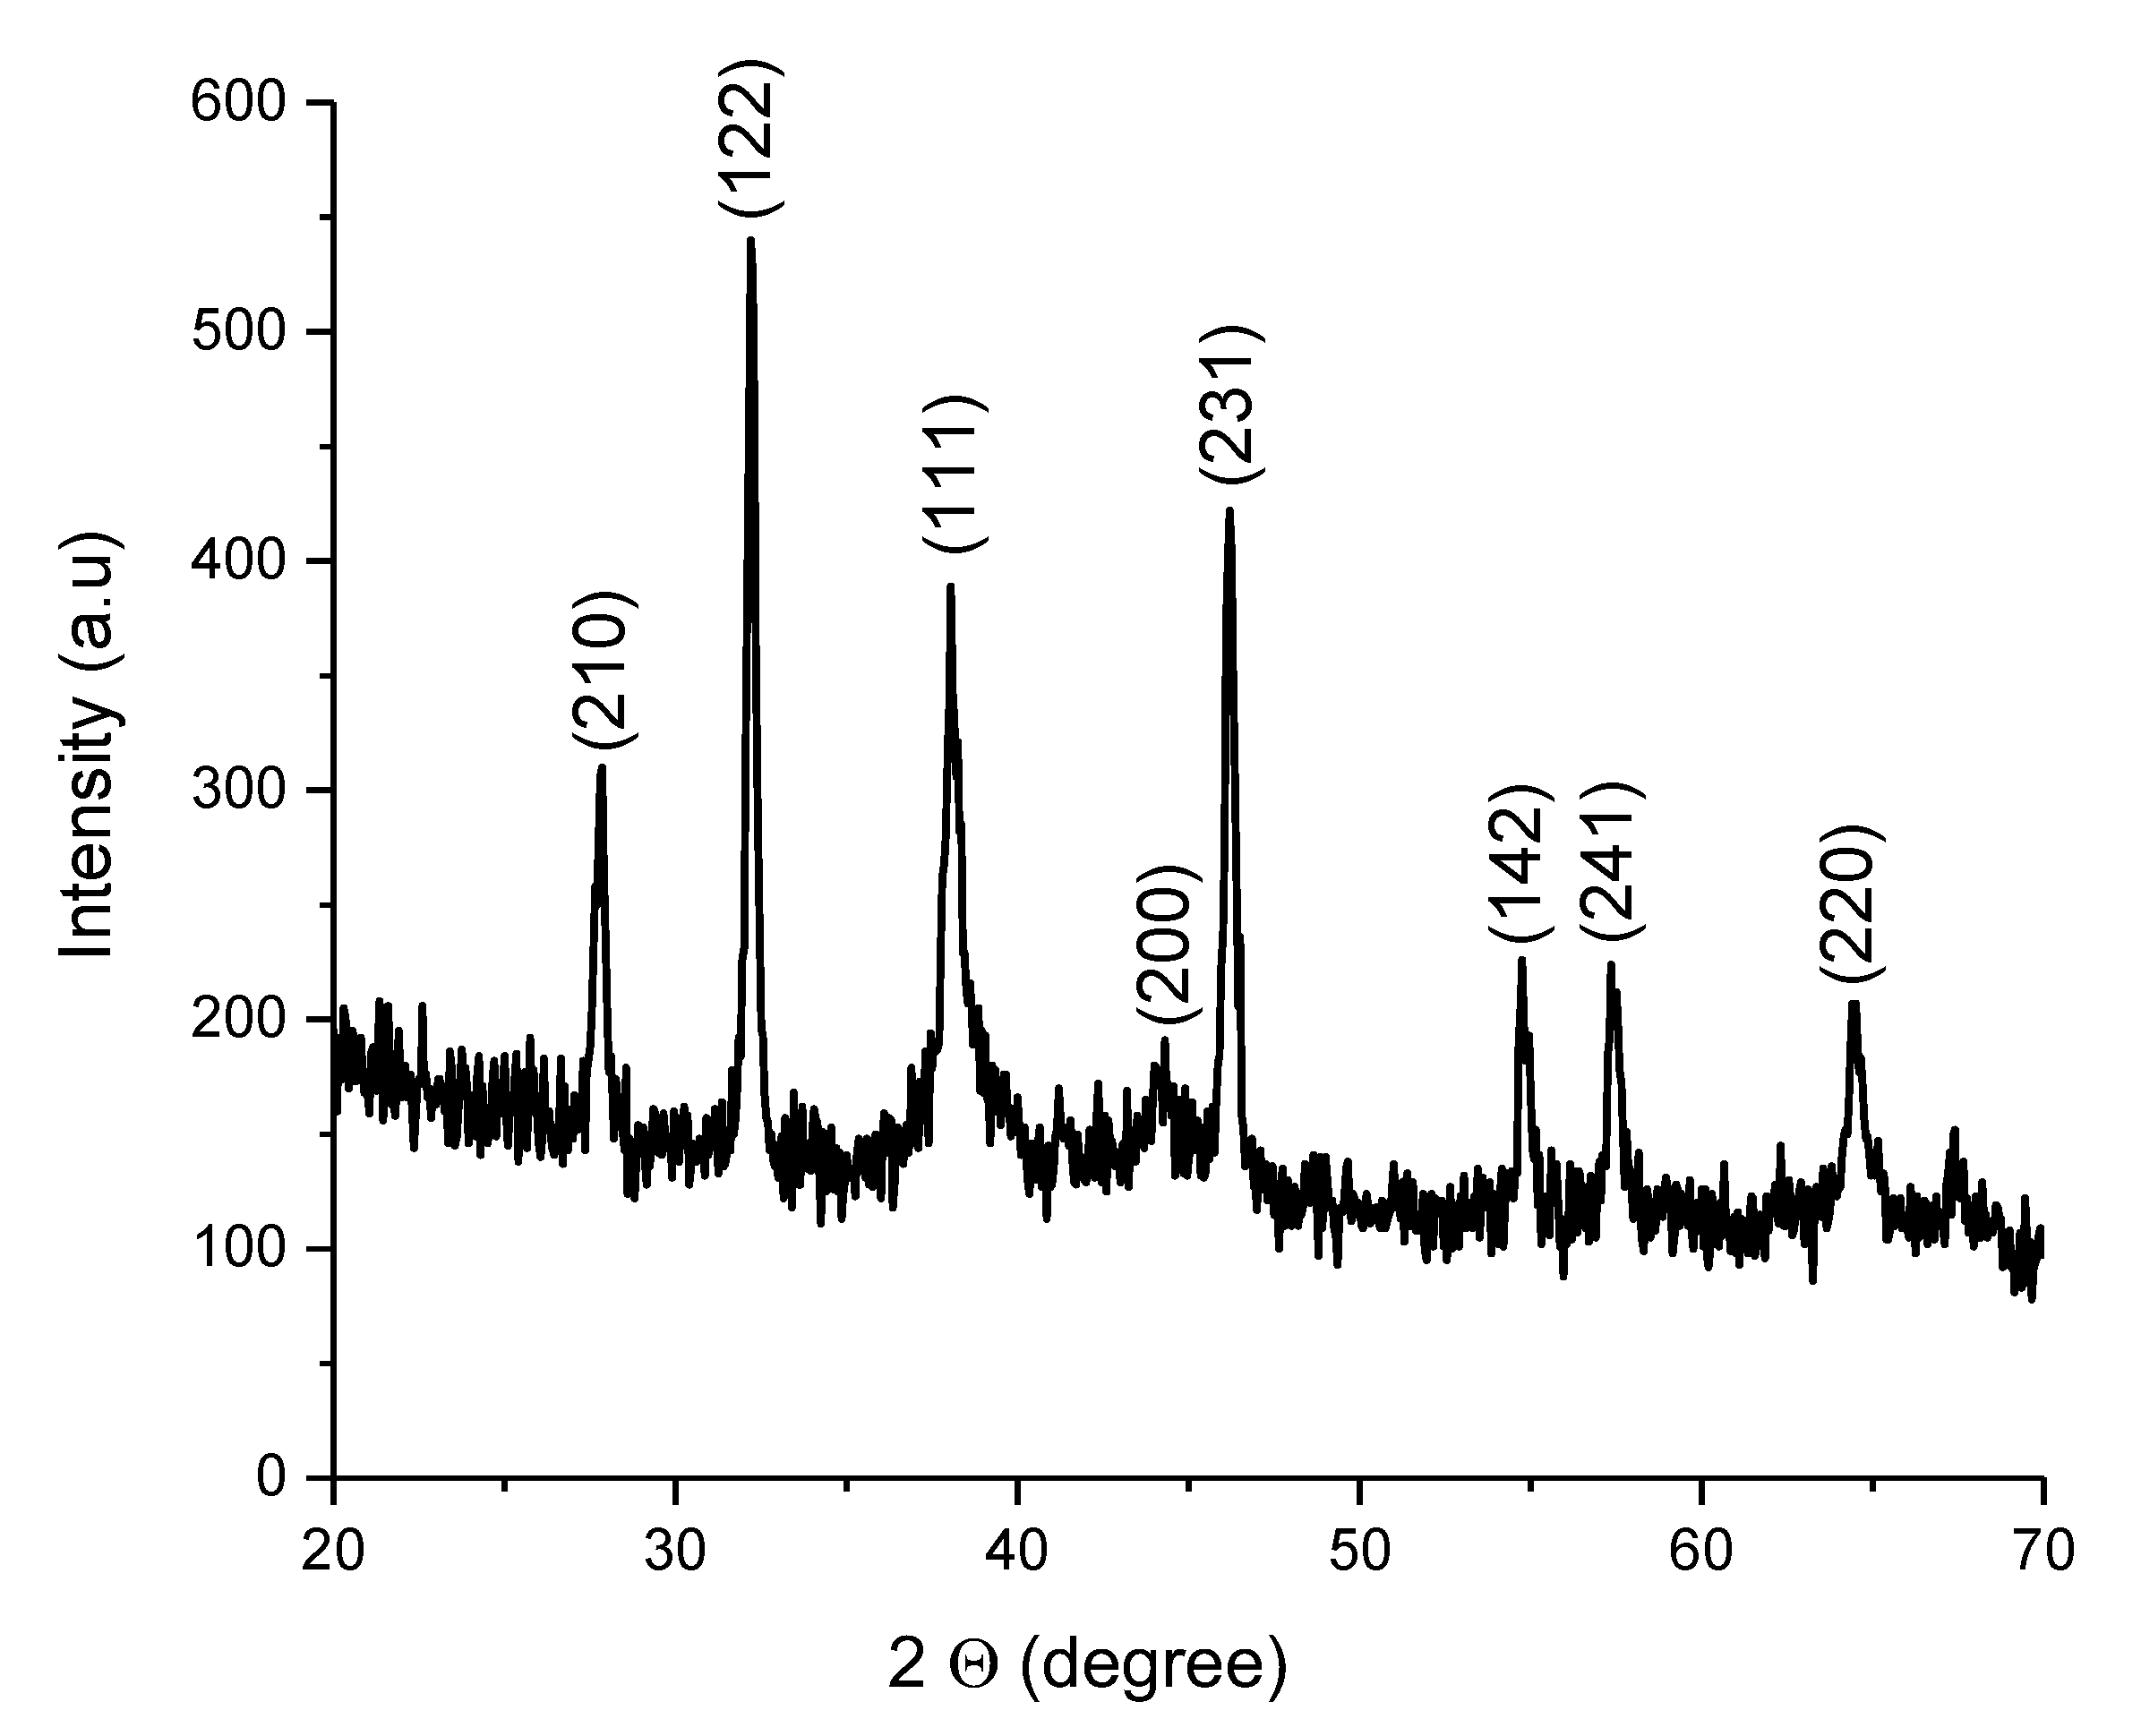
2.3.5. X-ray Diffraction (XRD)
3. Results
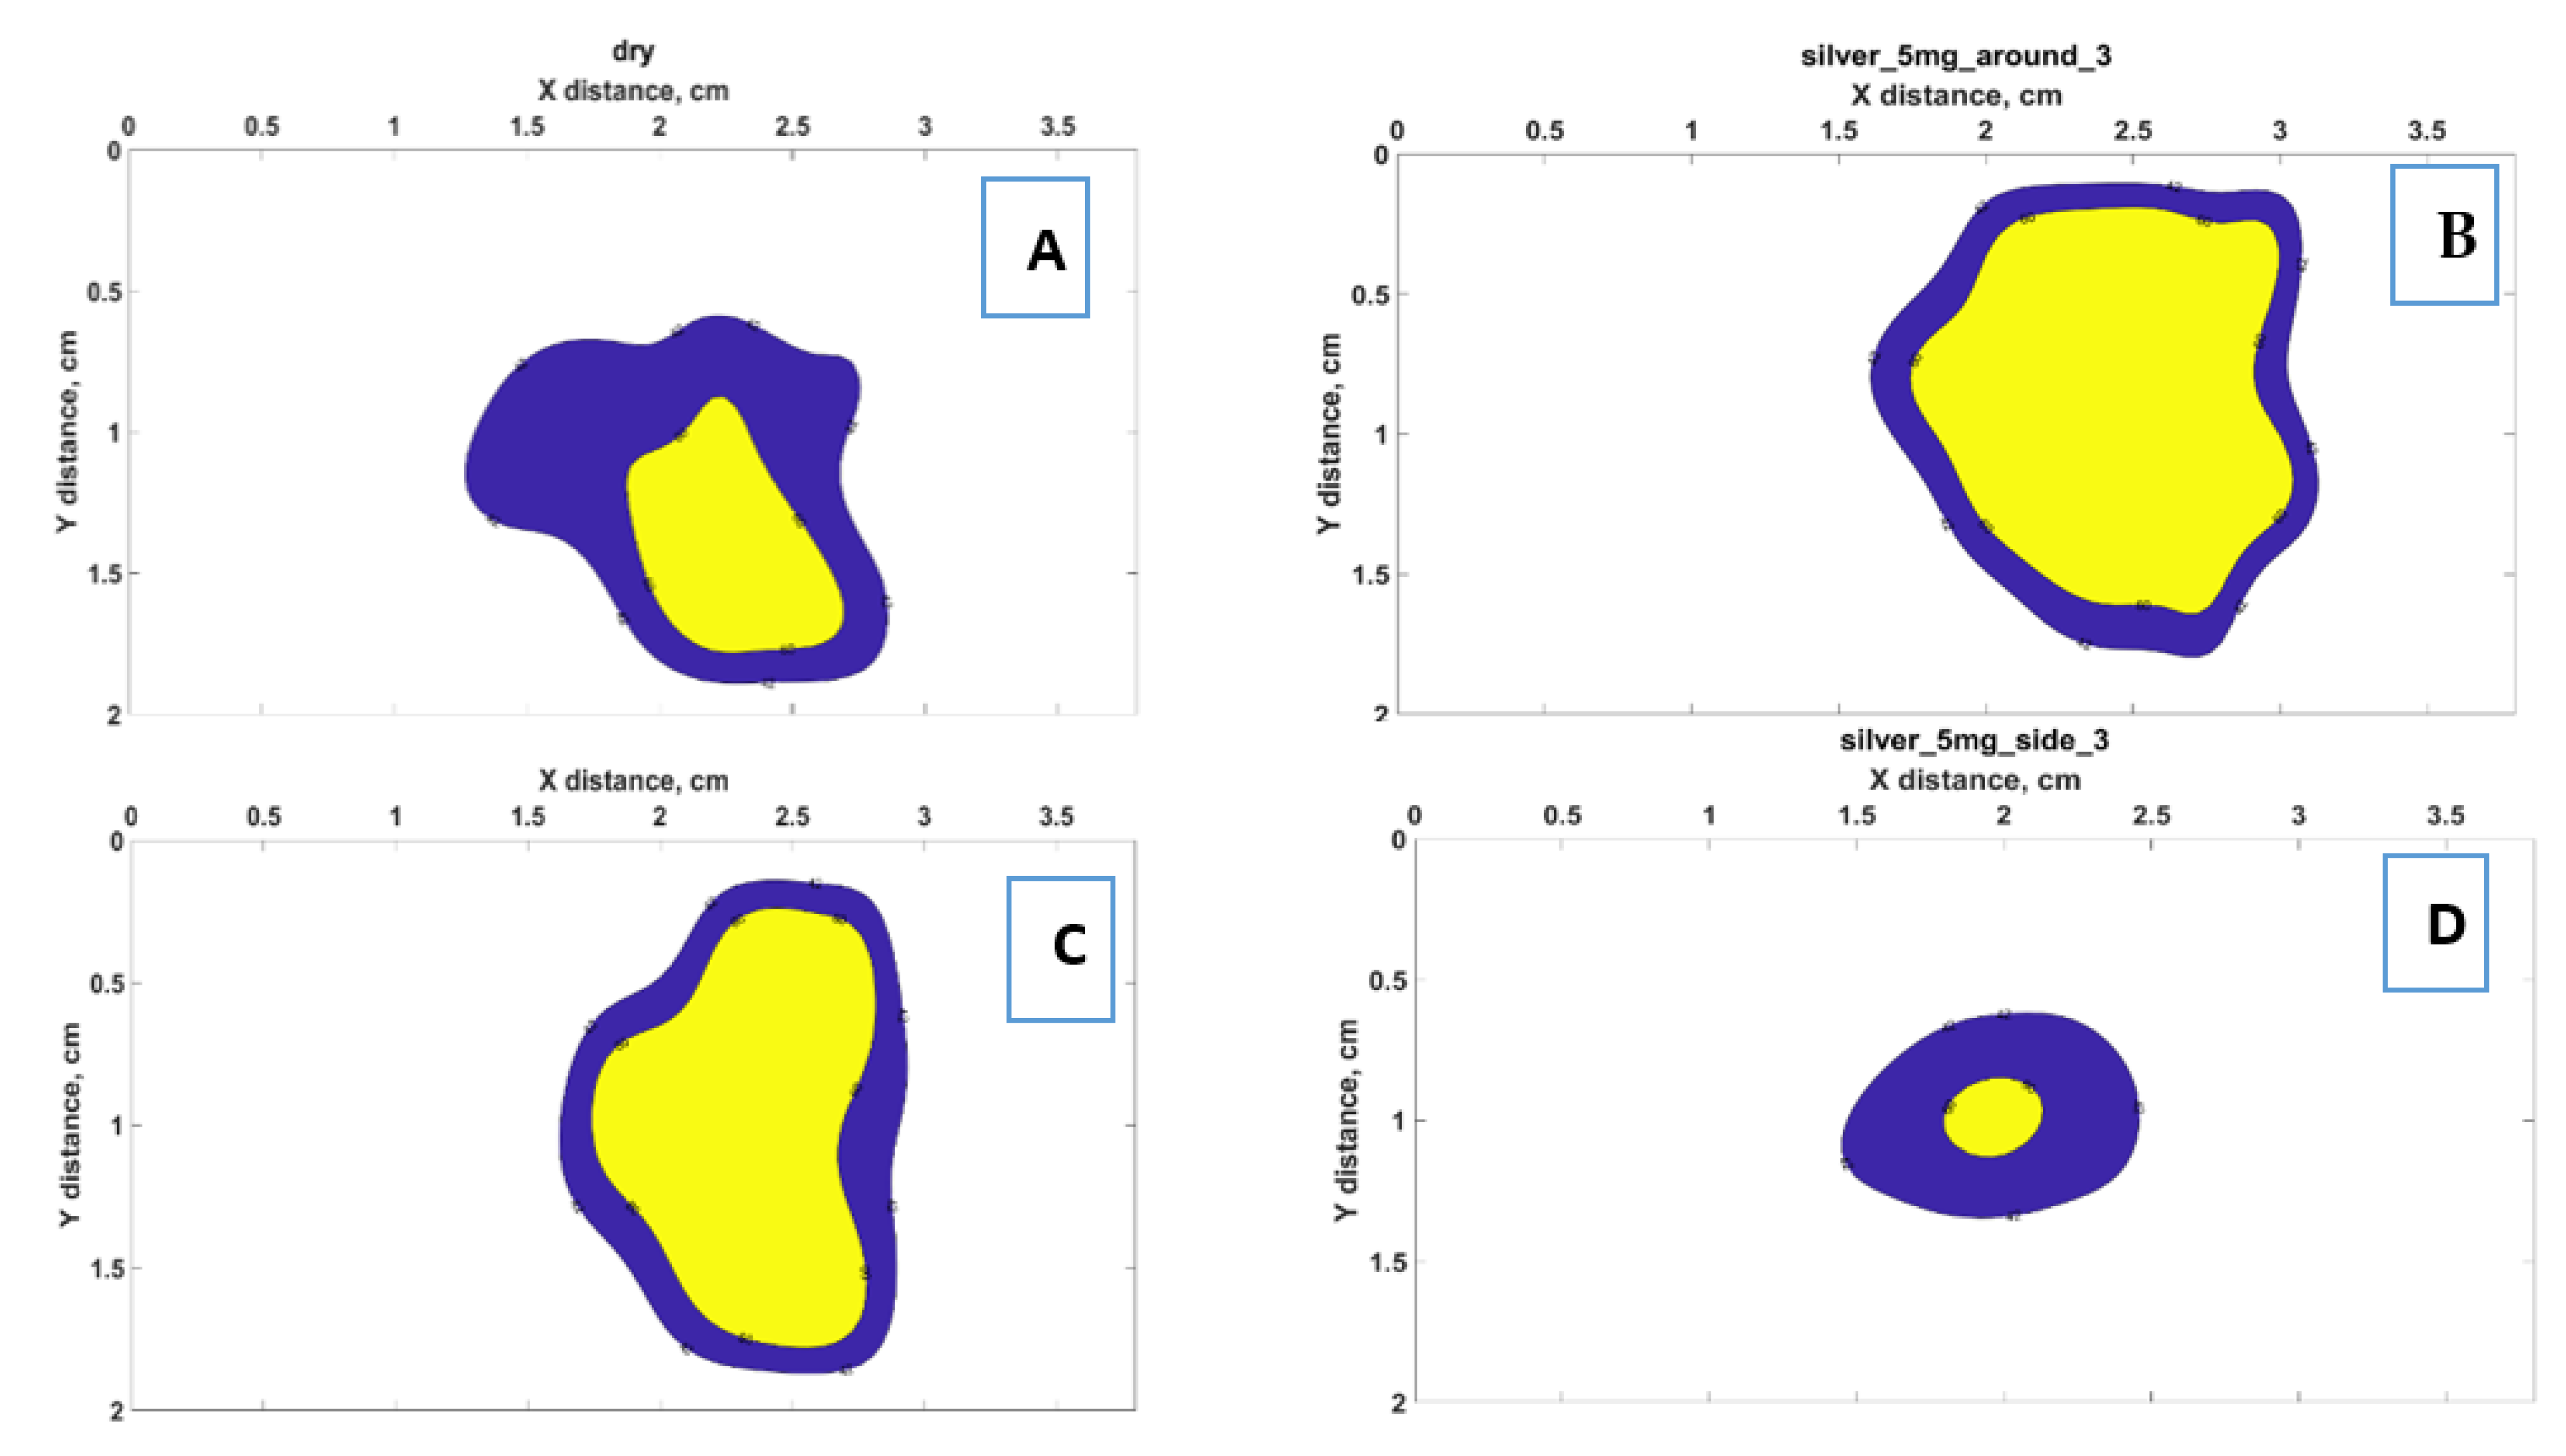
3.1. Thermal Maps
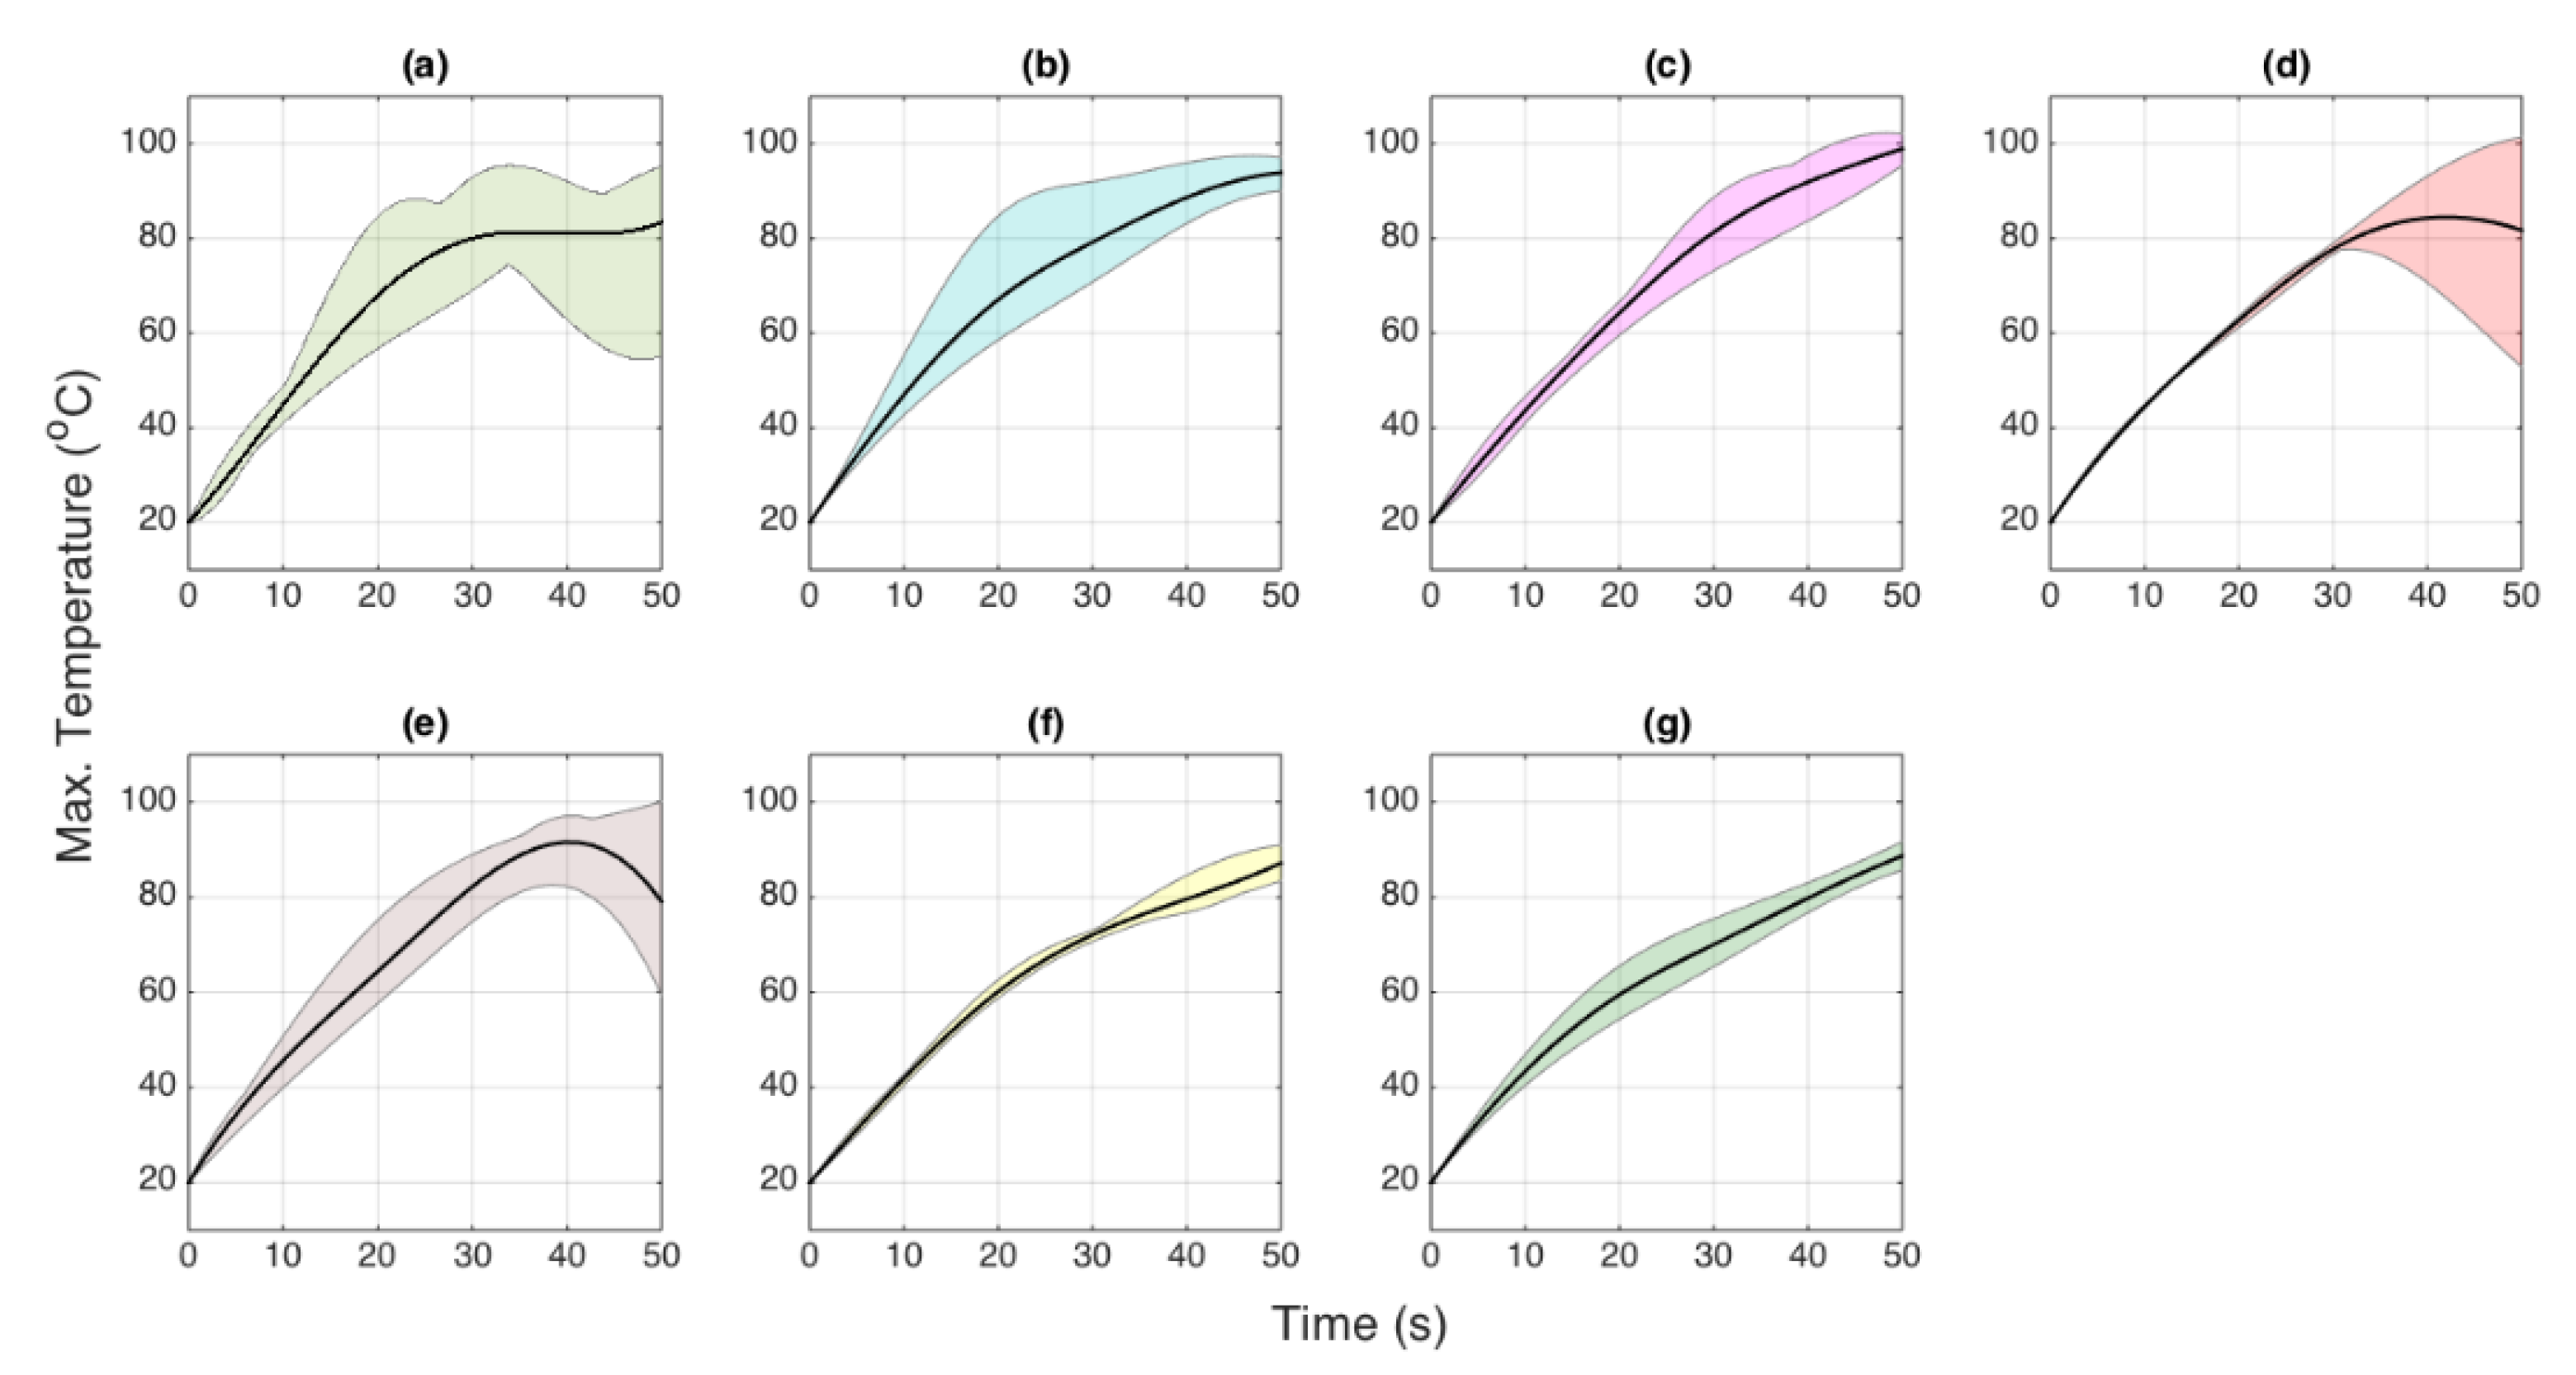
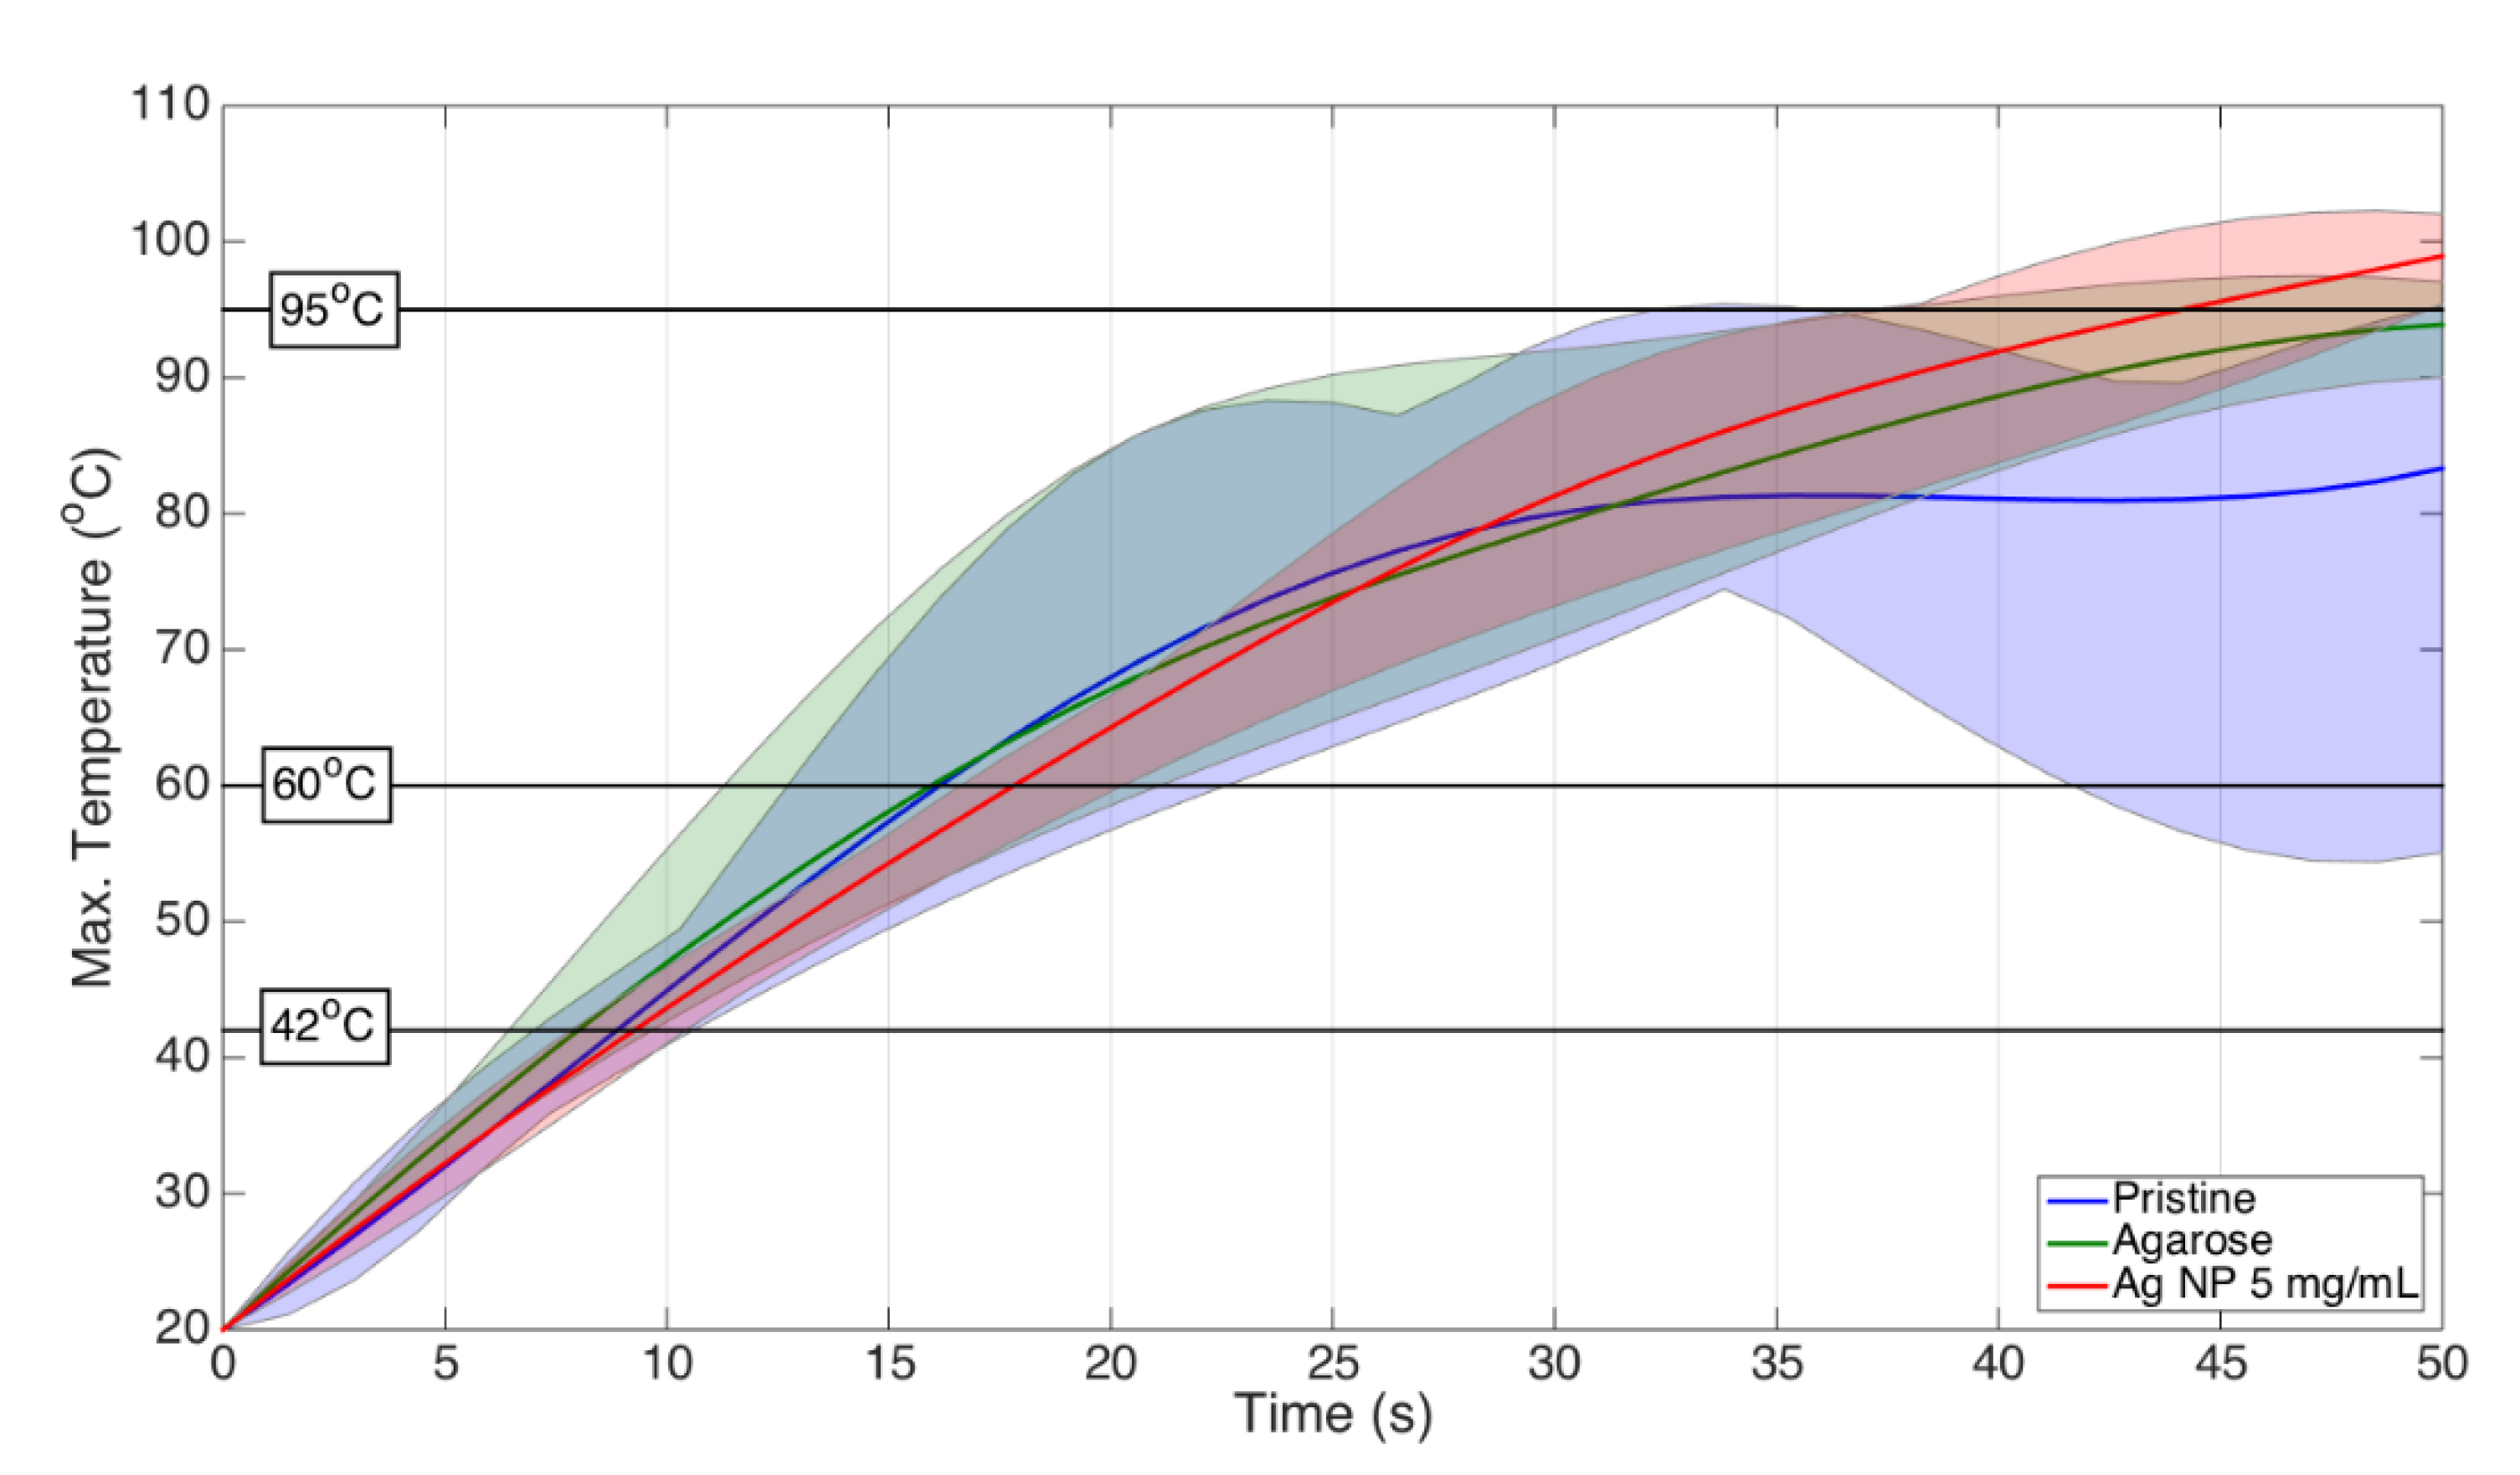
3.2. Temporal Evaluation
3.3. Heating Pattern
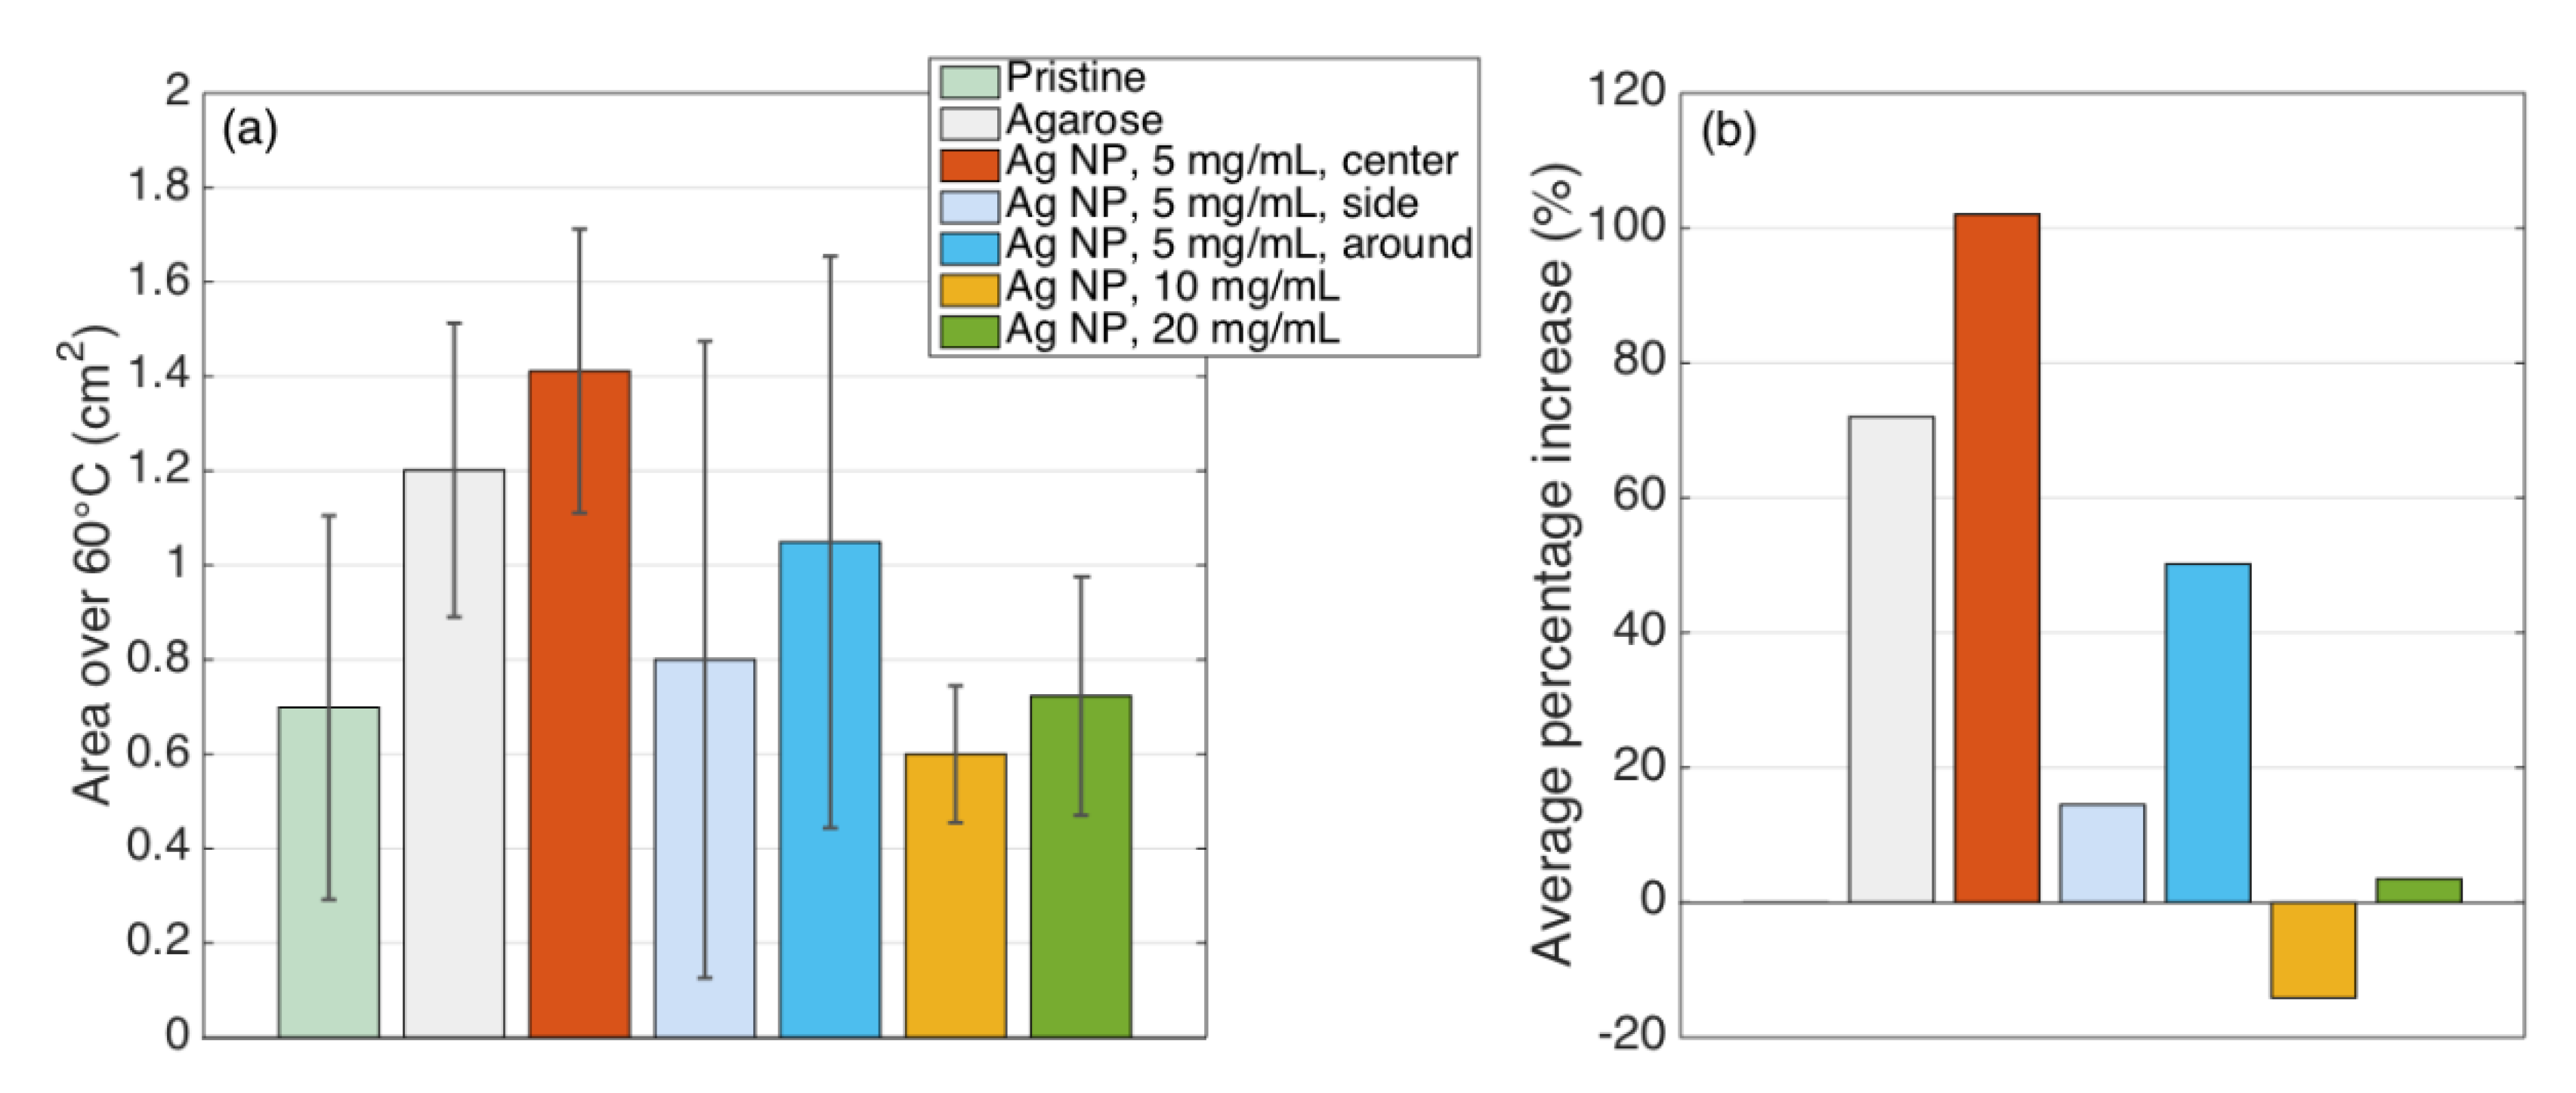
3.4. Ablated Area
4. Discussion
5. Conclusions
Supplementary Materials
Author Contributions
Funding
Data Availability Statement
Acknowledgments
Conflicts of Interest
References
- Froggatt, M. Distributed measurement of the complex modulation of a photoinduced Bragg grating in an optical fiber. Appl. Opt. 1996, 35, 5162–5164. [Google Scholar] [CrossRef] [PubMed]
- Brace, C. Thermal tumor ablation in clinical use. IEEE Pulse 2011, 2, 28–38. [Google Scholar] [CrossRef] [PubMed] [Green Version]
- Minami, Y.; Kudo, M. Radiofrequency ablation of hepatocellular carcinoma: Current status. World J. Radiol. 2010, 2, 417–424. [Google Scholar] [CrossRef] [PubMed]
- Jiang, K.; Zhang, W.; Liu, Y.; Su, M.; Zhao, X.; Dong, J.; Huang, Z. “One-Off” Complete Radiofrequency Ablation for Hepatocellular Carcinoma in a “High-Risk Location” Adjacent to the Major Bile Duct and Hepatic Blood Vessel. Cell Biochem. Biophys. 2014, 69, 605–617. [Google Scholar] [CrossRef] [PubMed]
- Chu, K.F.; Dupuy, D.E. Thermal ablation of tumours: Biological mechanisms and advances in therapy. Nat. Rev. Cancer 2014, 14, 199. [Google Scholar] [CrossRef] [PubMed]
- Hong, K.; Georgiades, C. Radiofrequency Ablation: Mechanism of Action and Devices. J. Vasc. Interv. Radiol. 2010, 21, S179–S186. [Google Scholar] [CrossRef] [PubMed]
- Carrafiello, G.; Laganà, D.; Mangini, M.; Fontana, F.; Dionigi, G.; Boni, L.; Rovera, F.; Cuffari, S.; Fugazzola, C. Microwave tumors ablation: Principles, clinical applications and review of preliminary experiences. Int. J. Surg. 2008, 6, S65–S69. [Google Scholar] [CrossRef] [PubMed] [Green Version]
- Christophi, C.; Muralidharan, V. Treatment of hepatocellular carcinoma by percutaneous laser hyperthermia. J. Gastroenterol. Hepatol. 2001, 16, 548–552. [Google Scholar] [CrossRef]
- Lang, B.H.; Wu, A.L.H. The efficacy and safety of high-intensity focused ultrasound ablation of benign thyroid nodules. Ultrasonography 2018, 37, 89–97. [Google Scholar] [CrossRef]
- Shiina, S.; Tateishi, R.; Arano, T.; Uchino, K.; Enooku, K.; Nakagawa, H.; Asaoka, Y.; Sato, T.; Masuzaki, R.; Kondo, Y.; et al. Radiofrequency ablation for hepatocellular carcinoma: 10-year outcome and prognostic factors. Am. J. Gastroenterol. 2012, 107, 569–577. [Google Scholar] [CrossRef] [Green Version]
- Tateishi, R.; Shiina, S.; Teratani, T.; Obi, S.; Sato, S.; Koike, Y.; Fujishima, T.; Yoshida, H.; Kawabe, T.; Omata, M. Percutaneous radiofrequency ablation for hepatocellular carcinoma. An analysis of 1000 cases. Cancer 2005, 103, 1201–1209. [Google Scholar] [CrossRef]
- Bosch, F.X.; Ribes, J.; Díaz, M.; Cléries, R. Primary liver cancer: Worldwide incidence and trends. Gastroenterology 2004, 127 (Suppl. S1), S5–S16. [Google Scholar] [CrossRef]
- Llovet, J.M. Systematic Review of Randomized Trials for Unresectable Hepatocellular Carcinoma: Chemoembolization Improves Survival. Hepatology 2002, 37, 429–442. [Google Scholar] [CrossRef]
- Lencioni, R.; Crocetti, L. Radiofrequency Ablation of Liver Cancer. Tech. Vasc. Interv. Radiol. 2007, 10, 38–46. [Google Scholar] [CrossRef]
- Macchi, E.G.; Tosi, D.; Braschi, G.; Gallati, M.; Cigada, A.; Busca, G.; Lewis, E. Optical fiber sensors-based temperature distribution measurement in ex vivo radiofrequency ablation with submillimeter resolution. J. Biomed. Opt. 2014, 19, 117004. [Google Scholar] [CrossRef]
- Lee, F.T.; Haemmerich, D.; Wright, A.S.; Mahvi, D.M.; Sampson, L.A.; Webster, J.G. Multiple Probe Radiofrequency Ablation: Pilot Study in an Animal Model. J. Vasc. Interv. Radiol. 2003, 14, 1437–1442. [Google Scholar] [CrossRef]
- Nakamuta, M.; Kohjima, M.; Morizono, S.; Yoshimoto, T.; Miyagi, Y.; Sakai, H.; Enjoji, M.; Kotoh, K. Comparison of tissue pressure and ablation time between the LeVeen and cool-tip needle methods. Comp. Hepatol. 2006, 5, 10. [Google Scholar] [CrossRef] [Green Version]
- Zhang, Y.; Chen, M. Role of radiofrequency ablation in the treatment of small hepatocellular carcinoma. World J. Hepatol. 2010, 2, 146–150. [Google Scholar] [CrossRef]
- Halimi, F.; Frank, R.; Tonet, J.; Fontaine, G. Role of power and temperature monitoring in radiofrequency ablation. Arch. Mal. Coeur Vaiss. 1996, 89, 243–248. [Google Scholar]
- Dinerman, J.A.Y.L.; Berger, R.D.; Calkins, H. Temperature Monitoring During Radiofrequency Ablation. J. Cardiovasc. Electrophysiol. 1996, 7, 163–173. [Google Scholar] [CrossRef]
- Schena, E.; Tosi, D.; Saccomandi, P.; Lewis, E.; Kim, T. Fiber optic sensors for temperature monitoring during thermal treatments: An overview. Sensors 2016, 16, 1144. [Google Scholar] [CrossRef]
- Beisenova, A.; Issatayeva, A.; Korganbayev, S.; Molardi, C.; Blanc, W.; Tosi, D. Simultaneous Distributed Sensing on Multiple MgO-Doped High Scattering Fibers by Means of Scattering-Level Multiplexing. J. Lightwave Technol. 2019, 37, 3413–3421. [Google Scholar] [CrossRef]
- Taffoni, F.; Formica, D.; Saccomandi, P.; Di Pino, G.; Schena, E. Optical Fiber-Based MR-Compatible Sensors for Medical Applications: An Overview. Sensors 2013, 13, 14105–14120. [Google Scholar] [CrossRef]
- Beisenova, A.; Issatayeva, A.; Ashikbayev, Z.; Jelbuldina, M.; Aitkulov, A.; Inglezakis, V.; Blanc, W.; Saccomandi, P.; Molardi, C.; Tosi, D. Distributed Sensing Network Enabled by High-Scattering MgO-Doped Optical Fibers for 3D Temperature Monitoring of Thermal Ablation in Liver Phantom. Sensors 2021, 21, 828. [Google Scholar] [CrossRef]
- Molardi, C.; Paixão, T.; Beisenova, A.; Min, R.; Antunes, P.; Marques, C.; Blanc, W.; Tosi, D. Fiber Bragg Grating (FBG) Sensors in a High-Scattering Optical Fiber Doped with MgO Nanoparticles for Polarization-Dependent Temperature Sensing. Appl. Sci. 2019, 9, 3107. [Google Scholar] [CrossRef] [Green Version]
- Ashikbayeva, Z.; Aitkulov, A.; Wolf, A.; Dostovalov, A.; Amantayeva, A.; Kurbanova, A.; Inglezakis, V.; Tosi, D. Investigation of Thermal Effects of Radiofrequency Ablation Mediated with Iron Oxide Nanoparticles Dispersed in Agarose and Chitosan Solvents. Appl. Sci. 2021, 11, 2437. [Google Scholar] [CrossRef]
- Tosi, D.; Schena, E.; Molardi, C.; Korganbayev, S. Optical Fiber Technology Fiber optic sensors for sub-centimeter spatially resolved measurements: Review and biomedical applications. Opt. Fiber Technol. 2018, 43, 6–19. [Google Scholar] [CrossRef]
- Froggatt, M.; Moore, J. High-spatial-resolution distributed strain measurement in optical fiber with rayleigh scatter. Appl. Opt. 1998, 37, 1735–1740. [Google Scholar] [CrossRef]
- Manthe, R.L.; Foy, S.P.; Krishnamurthy, N.; Sharma, B.; Labhasetwar, V. Tumor ablation and nanotechnology. Mol. Pharm. 2010, 7, 1880–1898. [Google Scholar] [CrossRef] [Green Version]
- Rossi, S.; Garbagnati, F.; Lencioni, R.; Allgaier, H.-P.; Marchianò, A.; Fornari, F.; Quaretti, P.; Di Tolla, G.; Ambrosi, C.; Mazzaferro, V.; et al. Percutaneous Radio-frequency Thermal Ablation of Nonresectable Hepatocellular Carcinoma after Occlusion of Tumor Blood Supply. Radiology 2000, 217, 119–126. [Google Scholar] [CrossRef]
- Moulton, M.C.; Braydich-Stolle, L.K.; Nadagouda, M.N.; Kunzelman, S.; Hussain, S.M.; Varma, R.S. Synthesis, characterization and biocompatibility of “green” synthesized silver nanoparticles using tea polyphenols. Nanoscale 2010, 2, 763–770. [Google Scholar] [CrossRef] [PubMed]
- Wypij, M.; Jędrzejewski, T.; Trzcińska-Wencel, J.; Ostrowski, M.; Rai, M.; Golińska, P. Green Synthesized Silver Nanoparticles: Antibacterial and Anticancer Activities, Biocompatibility, and Analyses of Surface-Attached Proteins. Front. Microbiol. 2021, 12, 888. [Google Scholar] [CrossRef] [PubMed]
- Lokina, S.; Stephen, A.; Kaviyarasan, V.; Arulvasu, C.; Narayanan, V. Cytotoxicity and antimicrobial activities of green synthesized silver nanoparticles. Eur. J. Med. Chem. 2014, 76, 256–263. [Google Scholar] [CrossRef] [PubMed]
- Rónavári, A.; Kovács, D.; Igaz, N.; Vágvölgyi, C.; Boros, I.M.; Kónya, Z.; Pfeiffer, I.; Kiricsi, M. Biological activity of green-synthesized silver nanoparticles depends on the applied natural extracts: A comprehensive study. Int. J. Nanomed. 2017, 12, 871–883. [Google Scholar] [CrossRef] [Green Version]
- Balachandran, Y.L.; Girija, S.; Selvakumar, R.; Tongpim, S.; Gutleb, A.C.; Suriyanarayanan, S. Differently Environment Stable Bio-Silver Nanoparticles: Study on Their Optical Enhancing and Antibacterial Properties. PLoS ONE 2013, 8, e77043. [Google Scholar] [CrossRef]
- Anees Ahmad, S.; Sachi Das, S.; Khatoon, A.; Tahir Ansari, M.; Afzal, M.; Saquib Hasnain, M.; Kumar Nayak, A. Bactericidal activity of silver nanoparticles: A mechanistic review. Mater. Sci. Energy Technol. 2020, 3, 756–769. [Google Scholar] [CrossRef]
- Ihtisham, M.; Noori, A.; Yadav, S.; Sarraf, M.; Kumari, P.; Brestic, M.; Imran, M.; Jiang, F.; Yan, X.; Rastogi, A. Silver Nanoparticle’s Toxicological Effects and Phytoremediation. Nanomaterials 2021, 11, 2164. [Google Scholar] [CrossRef]
- Ferdous, Z.; Nemmar, A. Health Impact of Silver Nanoparticles: A Review of the Biodistribution and Toxicity Following Various Routes of Exposure. Int. J. Mol. Sci. 2020, 21, 2375. [Google Scholar] [CrossRef] [Green Version]
- Kohl, Y.; Kaiser, C.; Bost, W.; Stracke, F.; Fournelle, M.; Wischke, C.; Thielecke, H.; Lendlein, A.; Kratz, K.; Lemor, R. Preparation and biological evaluation of multifunctional PLGA-nanoparticles designed for photoacoustic imaging. Nanomed. Nanotechnol. Biol. Med. 2011, 7, 228–237. [Google Scholar] [CrossRef]
- Tian, J.; Wong, K.K.; Ho, C.M.; Lok, C.N.; Yu, W.Y.; Che, C.M.; Chiu, J.F.; Tam, P.K.H. Topical Delivery of Silver Nanoparticles Promotes Wound Healing. ChemMedChem Chem. Enabling Drug Discov. 2007, 2, 129–136. [Google Scholar] [CrossRef]
- Sanpui, P.; Chattopadhyay, A.; Ghosh, S.S. Induction of Apoptosis in Cancer Cells at Low Silver Nanoparticle Concentrations using Chitosan Nanocarrier. ACS Appl. Mater. Interfaces 2011, 3, 218–228. [Google Scholar] [CrossRef]
- Uboldi, C. Targeted delivery of silver nanoparticles and alisertib: In vitro and in vivo synergistic effect against glioblastoma. Nanomedicine 2014, 9, 839–849. [Google Scholar]
- Wei, X.; Li, H.; Li, Z.; Vuki, M.; Fan, Y.; Zhong, W.; Xu, D. Metal-enhanced fluorescent probes based on silver nanoparticles and its application in IgE detection. Anal. Bioanal. Chem. 2012, 402, 1057–1063. [Google Scholar] [CrossRef]
- Gengan, R.M.; Anand, K.; Phulukdaree, A.; Chuturgoon, A. A549 lung cell line activity of biosynthesized silver nanoparticles using Albizia adianthifolia leaf. Colloids Surf. B Biointerfaces 2013, 105, 87–91. [Google Scholar] [CrossRef]
- Sukirtha, R.; Priyanka, K.M.; Antony, J.J.; Kamalakkannan, S.; Thangam, R.; Gunasekaran, P.; Krishnan, M.; Achiraman, S. Cytotoxic effect of Green synthesized silver nanoparticles using Melia azedarach against in vitro HeLa cell lines and lymphoma mice model. Process Biochem. 2012, 47, 273–279. [Google Scholar] [CrossRef]
- He, Y.; Du, Z.; Ma, S.; Liu, Y.; Li, D.; Huang, H.; Jiang, S.; Cheng, S.; Wu, W.; Zhang, K.; et al. Effects of green-synthesized silver nanoparticles on lung cancer cells in vitro and grown as xenograft tumors in vivo. Int. J. Nanomed. 2016, 11, 1879–1887. [Google Scholar] [CrossRef] [Green Version]
- Al-Sheddi, E.S.; Farshori, N.N.; Al-Oqail, M.M.; Al-Massarani, S.M.; Saquib, Q.; Wahab, R.; Musarrat, J.; Al-Khedhairy, A.A.; Siddiqui, M.A. Anticancer Potential of Green Synthesized Silver Nanoparticles Using Extract of Nepeta deflersiana against Human Cervical Cancer Cells (HeLA). Bioinorg. Chem. Appl. 2018, 2018, 9390784. [Google Scholar] [CrossRef] [Green Version]
- Firdhouse, J.; Lalitha, P. Apoptotic efficacy of biogenic silver nanoparticles on human breast cancer MCF-7 cell lines. Prog. Biomater. 2015, 4, 113–121. [Google Scholar] [CrossRef] [Green Version]
- Zhang, X.; Xiao, C. Biofabrication of silver nanoparticles and their combined effect with low intensity ultrasound for treatment of lung cancer. J. Photochem. Photobiol. B Biol. 2018, 181, 122–126. [Google Scholar] [CrossRef]
- Thompson, E.A.; Graham, E.; Macneill, C.M.; Young, M.; Donati, G.; Wailes, E.M.; Jones, B.T.; Levi-Polyachenko, N.H. Differential response of MCF7, MDA-MB-231, and MCF 10A cells to hyperthermia, silver nanoparticles and silver nanoparticle-induced photothermal therapy. Int. J. Hyperth. 2014, 30, 312–323. [Google Scholar] [CrossRef]
- Blanc, W.; Mauroy, V.; Nguyen, L.; Shivakiran Bhaktha, B.N.; Sebbah, P.; Pal, B.P.; Dussardier, B. Fabrication of rare earth-doped transparent glass ceramic optical fibers by modified chemical vapor deposition. J. Am. Ceram. Soc. 2011, 94, 2315–2318. [Google Scholar] [CrossRef] [Green Version]
- Blanc, W.; Martin, I.; Francois-Saint-Cyr, H.; Bidault, X.; Chaussedent, S.; Hombourger, C.; Lacomme, S.; Coustumer, P.L.; Neuville, D.R.; Larson, D.J.; et al. Compositional Changes at the Early Stages of Nanoparticles Growth in Glasses. J. Phys. Chem. C 2019, 123, 29008–29014. [Google Scholar] [CrossRef]
- Beisenova, A.; Issatayeva, A.; Sovetov, S.; Korganbayev, S.; Jelbuldina, M.; Ashikbayeva, Z.; Blanc, W.; Schena, E.; Sales, S.; Molardi, C.; et al. Multi-fiber distributed thermal profiling of minimally invasive thermal ablation with scattering-level multiplexing in MgO-doped fibers. Biomed. Opt. Express 2019, 10, 1282. [Google Scholar] [CrossRef] [PubMed]
- Ashikbayeva, Z.; Aitkulov, A.; Jelbuldina, M.; Issatayeva, A.; Beisenova, A.; Molardi, C.; Saccomandi, P.; Blanc, W.; Inglezakis, V.J.; Tosi, D. Distributed 2D temperature sensing during nanoparticles assisted laser ablation by means of high—Scattering fiber sensors. Sci. Rep. 2020, 10, 12593. [Google Scholar] [CrossRef] [PubMed]
- Sharifi-rad, M.; Pohl, P. Phytofabrication of Silver Nanoparticles (AgNPs) with Pharmaceutical Capabilities Using Otostegia persica (Burm.) Boiss. Leaf Extract. Nanomaterials 2021, 11, 1045. [Google Scholar] [CrossRef]
- Mohammadi, F.; Yousefi, M.; Ghahremanzadeh, R. Green Synthesis, Characterization and Antimicrobial Activity of Silver Nanoparticles (AgNps) Using Leaves and Stems Extract of Some Plants. Adv. J. Chem. -Sect. A 2019, 2, 266–275. [Google Scholar] [CrossRef]
- Meng, Y. A Sustainable Approach to Fabricating Ag Nanoparticles/PVA Hybrid Nanofiber and Its Catalytic Activity. Nanomaterials 2015, 5, 1124–1135. [Google Scholar] [CrossRef] [Green Version]
- da Fonseca, R.D.; Santos, P.R.; Monteiro, M.S.; Fernandes, L.A.; Campos, A.H.; Borges, D.L.; Rosa, S.D.S.R.F. Parametric evaluation of impedance curve in radiofrequency ablation: A quantitative description of the asymmetry and dynamic variation of impedance in bovine ex vivo model. PLoS ONE 2021, 16, e0245145. [Google Scholar] [CrossRef]
- Ahmed, M.; Brace, C.L.; Lee, F.T.; Goldberg, S.N. Principles of and Advances in Percutaneous Ablation. Radiology 2011, 258, 351–369. [Google Scholar] [CrossRef]
- Jelbuldina, M.; Korobeinyk, A.V.; Korganbayev, S.; Inglezakis, V.J.; Tosi, D. Fiber Bragg grating based temperature profiling in ferromagnetic nanoparticles-enhanced radiofrequency ablation. Opt. Fiber Technol. 2018, 43, 145–152. [Google Scholar] [CrossRef]
- Castro-López, D.L.; Berjano, E.; Romero-Mendez, R. Radiofrequency ablation combined with conductive fluid-based dopants (saline normal and colloidal gold): Computer modeling and ex vivo experiments. Biomed. Eng. Online 2021, 20, 4. [Google Scholar] [CrossRef]


| Condition | Area 42 °C (cm2) | % Increase Over Pristine | Area 60 °C (cm2) | % Increase Over Pristine | ||
|---|---|---|---|---|---|---|
| Average | Standard Deviation | Average | Standard Deviation | |||
| Pristine | 1.283 | 0.460 | 0.0 | 0.699 | 0.406 | 0.0 |
| Agarose | 2.021 | 0.333 | 57.6 | 1.201 | 0.311 | 72.0 |
| Ag NP, 5 mg/mL, center | 2.150 | 0.341 | 67.6 | 1.411 | 0.301 | 102.0 |
| Ag NP, 5 mg/mL, side | 1.499 | 0.920 | 16.8 | 0.800 | 0.675 | 14.5 |
| Ag NP, 5 mg/mL, around | 1.621 | 0.605 | 26.3 | 1.049 | 0.606 | 50.2 |
| Ag NP, 10 mg/mL | 1.583 | 0.066 | 23.4 | 0.600 | 0.145 | −14.1 |
| Ag NP, 20 mg/mL | 1.678 | 0.182 | 30.8 | 0.723 | 0.253 | 3.5 |
Publisher’s Note: MDPI stays neutral with regard to jurisdictional claims in published maps and institutional affiliations. |
© 2022 by the authors. Licensee MDPI, Basel, Switzerland. This article is an open access article distributed under the terms and conditions of the Creative Commons Attribution (CC BY) license (https://creativecommons.org/licenses/by/4.0/).
Share and Cite
Ashikbayeva, Z.; Aitkulov, A.; Atabaev, T.S.; Blanc, W.; Inglezakis, V.J.; Tosi, D. Green-Synthesized Silver Nanoparticle–Assisted Radiofrequency Ablation for Improved Thermal Treatment Distribution. Nanomaterials 2022, 12, 426. https://doi.org/10.3390/nano12030426
Ashikbayeva Z, Aitkulov A, Atabaev TS, Blanc W, Inglezakis VJ, Tosi D. Green-Synthesized Silver Nanoparticle–Assisted Radiofrequency Ablation for Improved Thermal Treatment Distribution. Nanomaterials. 2022; 12(3):426. https://doi.org/10.3390/nano12030426
Chicago/Turabian StyleAshikbayeva, Zhannat, Arman Aitkulov, Timur Sh. Atabaev, Wilfried Blanc, Vassilis J. Inglezakis, and Daniele Tosi. 2022. "Green-Synthesized Silver Nanoparticle–Assisted Radiofrequency Ablation for Improved Thermal Treatment Distribution" Nanomaterials 12, no. 3: 426. https://doi.org/10.3390/nano12030426