Article

The Photocatalytic Performance of Nd2O3 Doped CuO Nanoparticles with Enhanced Methylene Blue Degradation: Synthesis, Characterization and Comparative Study

by
Fatma El-Sayed
1,
Mai S. A. Hussien
1,2,
Mervat I. Mohammed
1,
Vanga Ganesh
3,*,
Thekrayat H. AlAbdulaal
3,
Heba Y. Zahran
3,4,5,
Ibrahim S. Yahia
3,4,5,
Hosam H. Hegazy
3,6,
Mohamed Sh. Abdel-wahab
7,
Mohd. Shkir
3,
Santiyagu Valarasu
8 and
Medhat A. Ibrahim
9,10
1
Nanoscience Laboratory for Environmental and Bio-Medical Applications (NLEBA), Metallurgical Lab.1, Department of Physics, Faculty of Education, Ain Shams University, Roxy, Cairo 11757, Egypt
2
Department of Chemistry, Faculty of Education, Ain Shams University, Roxy, Cairo 11757, Egypt
3
Laboratory of Nano-Smart Materials for Science and Technology (LNSMST), Department of Physics, Faculty of Science, King Khalid University, P.O. Box 9004, Abha 61413, Saudi Arabia
4
Research Center for Advanced Materials Science (RCAMS), King Khalid University, P.O. Box 9004, Abha 61413, Saudi Arabia
5
Semiconductor Laboratory, Department of Physics, Faculty of Education, Ain Shams University, Roxy, Cairo 11757, Egypt
6
Department of Physics, Faculty of Science, Al-Azhar University, Assiut 71524, Egypt
7
Materials Science and Nanotechnology Department, Faculty of Postgraduate Studies for Advanced Sciences, Beni–Suef University, Beni–Suef 62511, Egypt
8
PG and Research Department of Physics, Arul Anandar College, Madurai 625514, India
9
Nanotechnology Research Centre (NTRC), The British University in Egypt (BUE), Suez Desert Road, El-Sherouk City, Cairo 11837, Egypt
10
Molecular Spectroscopy and Modeling Unit, Spectroscopy Department, National Research Centre, 33 El-Bohouth Street, Giza 12622, Egypt
*
Author to whom correspondence should be addressed.
Nanomaterials 2022, 12(7), 1060; https://doi.org/10.3390/nano12071060
Submission received: 13 February 2022 / Revised: 9 March 2022 / Accepted: 10 March 2022 / Published: 24 March 2022
(This article belongs to the Collection Metallic and Metal Oxide Nanohybrids and Their Applications)

Abstract

:
The growth of the textile industry results in a massive accumulation of dyes on water. This enormous rise in pigments is the primary source of water pollution, affecting the aquatic lives and our ecosystem balance. This study aims to notify the fabrication of neodymium incorporated copper oxide (Nd2O3 doped CuO) nanoparticles by combustion method for effective degradation of dye, methylene blue (MB). X-ray diffraction (XRD), Field emission Scanning electron microscopy (FESEM), Zeta potential have been applied for characterization. Photocatalyst validity has been evaluated for methylene blue degradation (MB). Test conditions such as time of contact, H2O2, pH, and photo-Fenton have been modified to identify optimal degradation conditions. Noticeably, 7.5% Nd2O3 doped CuO nanoparticle demonstrated the highest photocatalytic efficiency, up to 90.8% in 80 min, with a 0.0227 min−1 degradation rate. However, the photocatalytic efficiency at pH 10 becomes 99% with a rate constant of 0.082 min−1. Cyclic experiments showed the Nd2O3 doped CuO nanoparticle’s stability over repeated use. Scavenge hydroxyl radical species responsible for degradation using 7.5% Nd2O3 doped CuO nanoparticles have been investigated under visible irradiation.

Graphical Abstract

1. Introduction

Over the last decades, because of rapid industrialization, much toxic waste has been released into water bodies. Dyes are involved in various industries, including textile, plastic, skincare products, food processing, medicines, etc. [1]. The dye can negatively impact the aquatic environment due to reduced solar permeation. Furthermore, certain dyes may cause severe illnesses such as mutation and cancer [2]. Significant consequences are the lack of potable water, domestic use, agriculture, farming, etc. [3]. Methylene blue (MB) is a cationic thiazine dye, which forms a blue water solution (see Scheme 1). It is used for various applications, including colored paper, the temporary coloring of cotton, wool, and paper stock dyeing. MB leads to different toxic effects, including eye burning, skin irritation, and gastrointestinal tract. So, it is essential to remediate the dyestuffs wastewater to save water and the environment [4].
Consequently, water pollution must be eliminated [5]. Physical techniques such as adsorption and chemical techniques are employed to remove the textile dyes [6]. The advanced oxidation process includes heterogeneous photocatalysis, low-cost and sustainable technology for water purification that takes place on photocatalyst particles in the presence of photons, causing them to be mineralized [7].
Reusable photocatalysts are used to degrade organic contaminants in photocatalysis. As particle size is reduced, the photocatalyst’s surface area increases. As a result, the number of activating sites has increased, resulting in a higher reactivity. After the absorption of light, the electron has been excited, generating a hole, O 2 and OH .   has been formed due to the reaction between e with O2 and h+ with OH or H2O [8]. Many researchers have examined the degradation of various reactive dyes with visible light-assisted Fenton (H2O2/Fe2+ or Fe3+) and photo-Fenton (UV-Vis/H2O2/Fe2+ or Fe3+) reactions [4]. Both the mechanism and kinetics of the response have been widely explored [9]. Fenton’s reagent, the mixture of H2O2 and ferrous iron, produces hydroxyl radicals with the ferrous (Fe2+) ions, which initiate and catalyze H2O2 decomposition.
Metal oxide nanoparticles (NPs) such as ZnO, CoO, TiO2, SnO2, and CuO represent one strategy to lower aqueous organic dyes. In particular, CuO NPs have significant potential because of their low cost, low toxicity, easy availability, optical, catalytic, and antimicrobial characteristics. In addition, copper oxide nanoparticles are noteworthy because of their surface area and increased adsorbed oxygen capacity, leading its bandgap to be ranged from 1.35 to 3.5 eV [10,11]. The strong ability of CuO-NPs for molecular oxygen absorption has a significant impact on the electron-hole pair rearrangement and the removal of the photogenerated electron [12]. Nd2O3 is rare earth oxide that improves the efficiency of CuO photocatalysis for MB photodegradation in the presence of light with a lower cost [13]. The preparation and characterization of Nd2O3 NPs have drawn much attention to be studied because of their nano-size structure and surface.
In this work, we synthesized CuO and Nd2O3 doped CuO photocatalysts with different concentrations of neodymium oxide (Nd2O3) and characterized by various experimental techniques such as XRD, FESEM, EDX, and DLS. Methylene blue was degraded to examine the photocatalytic activity of the samples. Experiments were performed to enhance the conditions, such as the percentage of Nd2O3 incorporating CuO, H2O2, pH, and Photo-Fenton.

2. Experimental Techniques

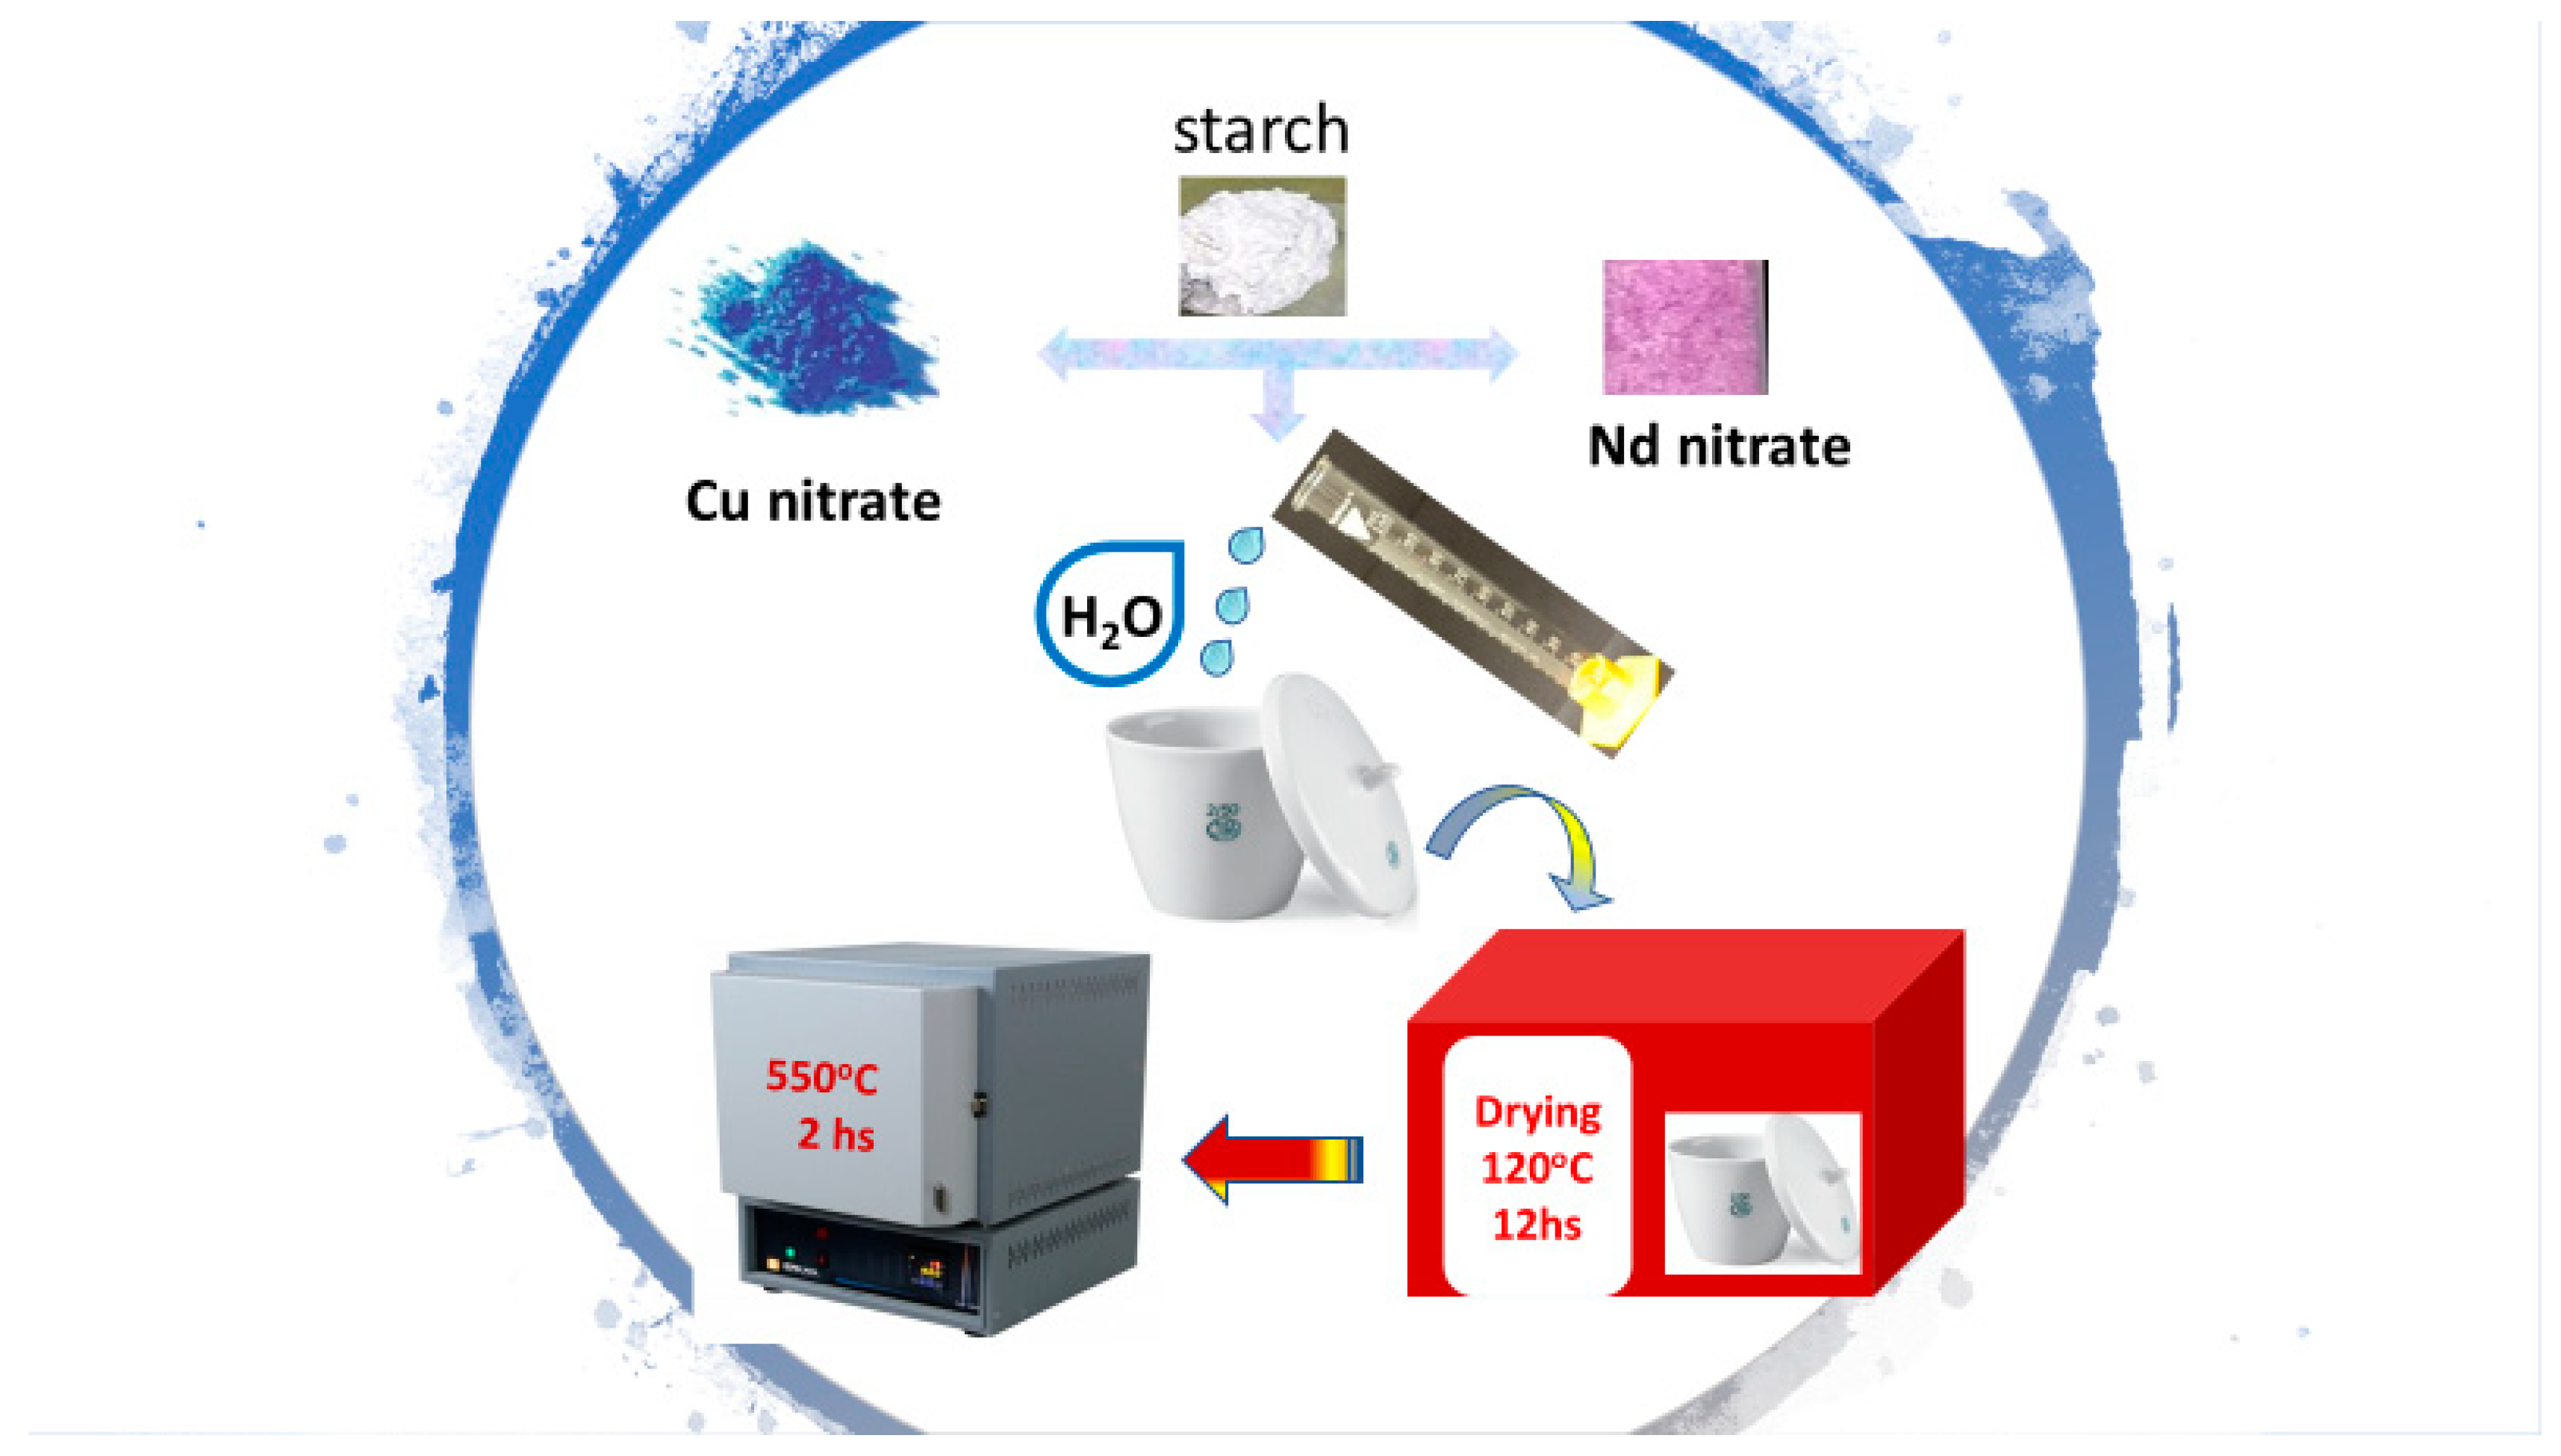
2.1. Synthesis of Nd2O3 Doped CuO Nanostructured

The Nd2O3 doped CuO nanoparticles were prepared by the combustion method. First, 5 g of Copper nitrate (Sigma-Aldrich company, Burlington, MA, USA) has been taken, neodymium nitrate(Sigma-Aldrich company, Burlington, MA, USA) with different weights (0.11, 0.28, 0.58, 0.89, 1.21 g), for (1, 2.5, 5, 7.5, 10%) then 10 g starch and 30 mL distilled water in 6 crucibles and mixed well. Then the crucibles were dried in an oven at 120 °C for 12 h and calcined at 550 °C for 2 h to obtain the proper catalyst, as illustrated in Scheme 2.

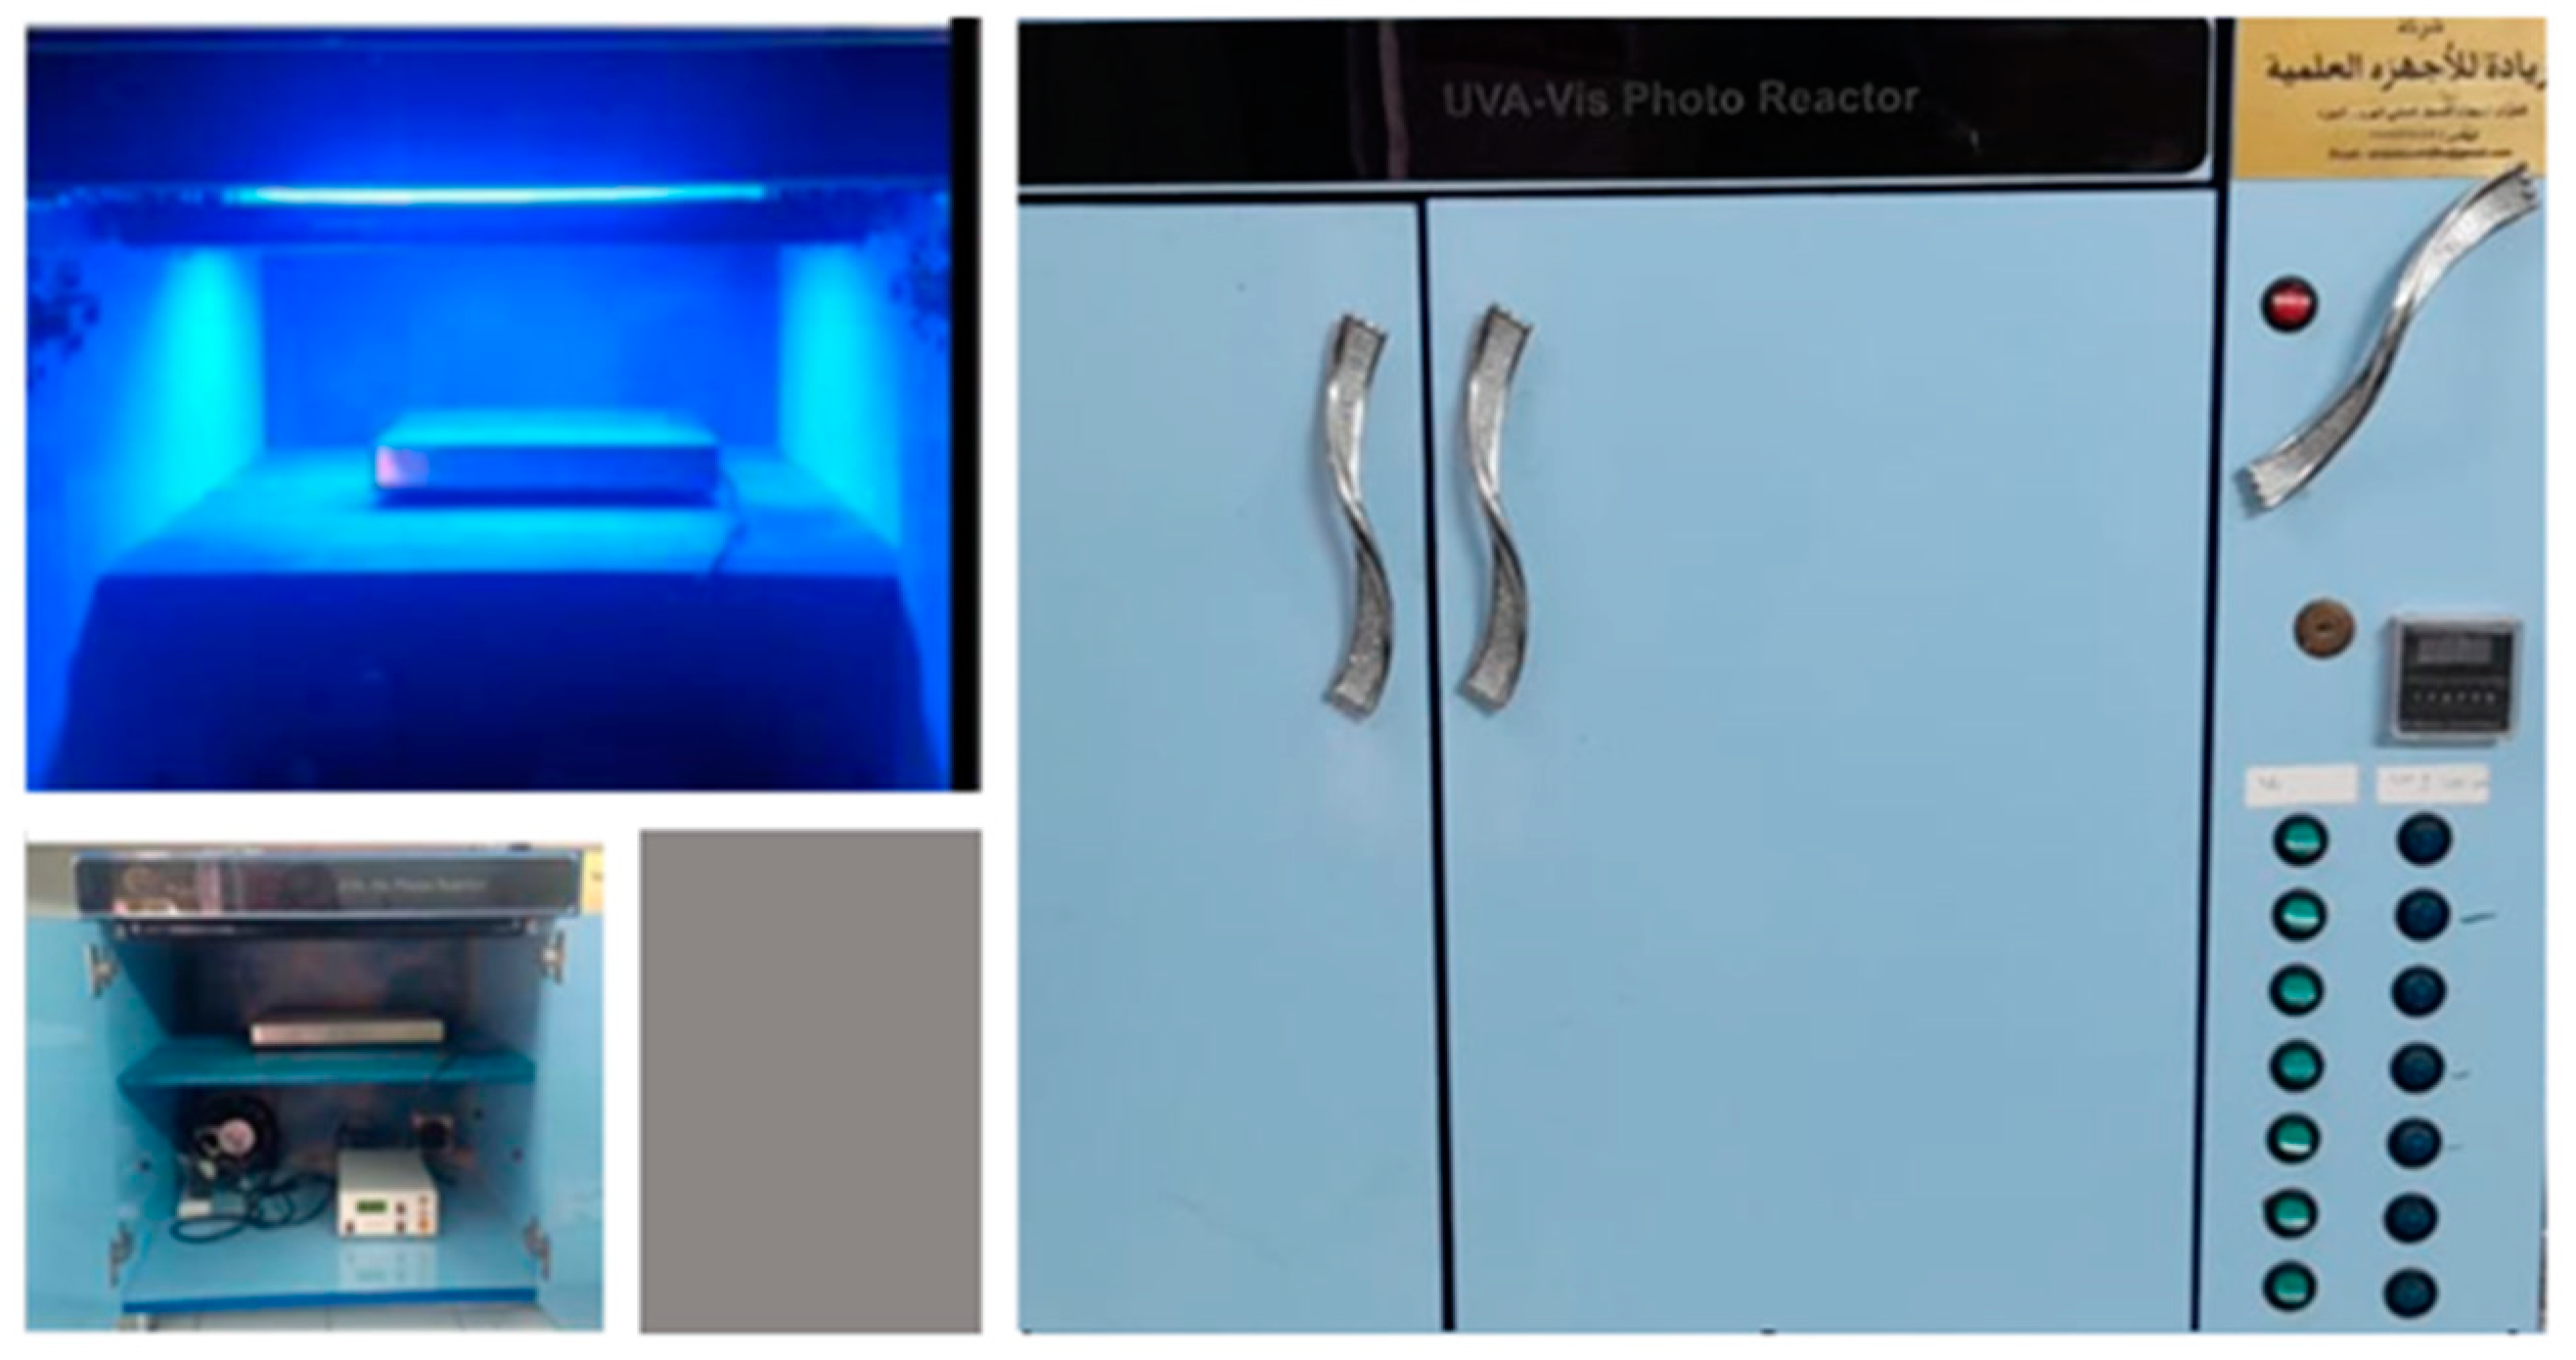
2.2. Characterization Techniques and Devices

The structure of The Nd2O3 doped CuO NPs was obtained by a PAN analytical X’Pert PRO, (Philips, Eindhoven, Netherlands) Philips X-ray diffractometer with monochromatic CuKα operating radiation at 40 kV and 40 mA.
Field emission scanning electron microscopy (FESEM) of The Nd2O3 doped CuO nanoparticles have been examined by HR-SEM, QUANTA FEG 250, USA (FEI, Hillsboro, OR, USA), to identify their surface morphology.
A Nano Series, Zeta sizer(Malvern Panalytical comapny, MALVERN, UK), has been used to determine the surface potentials. The samples have been suspended at 25 °C into the water to determine the average zeta potential (ζav, mV). In addition, dynamic light scattering (DLS) (Malvern Panalytical comapny, MALVERN, UK), has been used to measure conductivity. The XRD, FE-SEM, and DLS devices are located in the Egyptian Petroleum Research Institute, Naser City, Egypt.

2.3. Photocatalytic Performance of Nd2O3 Doped CuO Nanopowders

The photocatalytic validity of all prepared samples has been assessed through a wood photoreactor. The photoreactor at NLEBA, Ain Shams University (ASU), was developed by I.S. Yahia and his team [14] (see Figure 1). It stands 100 cm tall and 65 cm broad from the outside. Each of the white and blue bulbs has an output of 18 watts. A 15-point, 500 rpm multi-position magnetic stirrer was used to stir the mixture of Nd2O3 doped CuO nanopowders and MB solution (Sigma-Aldrich company) at room temperature, allowing us to evaluate many samples at once.
A 100 mg of Nd2O3 doped CuO NPS was inserted in 50 mL of MB solution. Agitation in darkness results in adsorption-desorption equilibrium. The last step included turning on the white light to shine the prepared samples. The deteriorated solution was taken and centrifuged at ten-minute intervals to remove any nanopowders. To finish, the (LISCO-GmbH) UV–Visible spectrophotometer was used to evaluate the deteriorated solution alongside MB’s stock solution. All operating parameters stay stable during photocatalytic processing.
The degradation of MB dye using white light assisted photo-Fenton reaction was investigated in the presence and absence of 7.5% Nd2O3 doped CuO catalyst. The photo-Fenton degradation rate was 0.00813 min−1 at 0.1 g of Fe+2-ions in the presence of 7.5% Nd2O3 doped CuO, while the rate was 0.00276 min−1 at 0.05 g of Fe+2-ions in the absence of 7.5% Nd2O3 doped CuO. This result means that the presence of catalyst enhanced the photo-Fenton degradation rate.

3. Results and Discussion

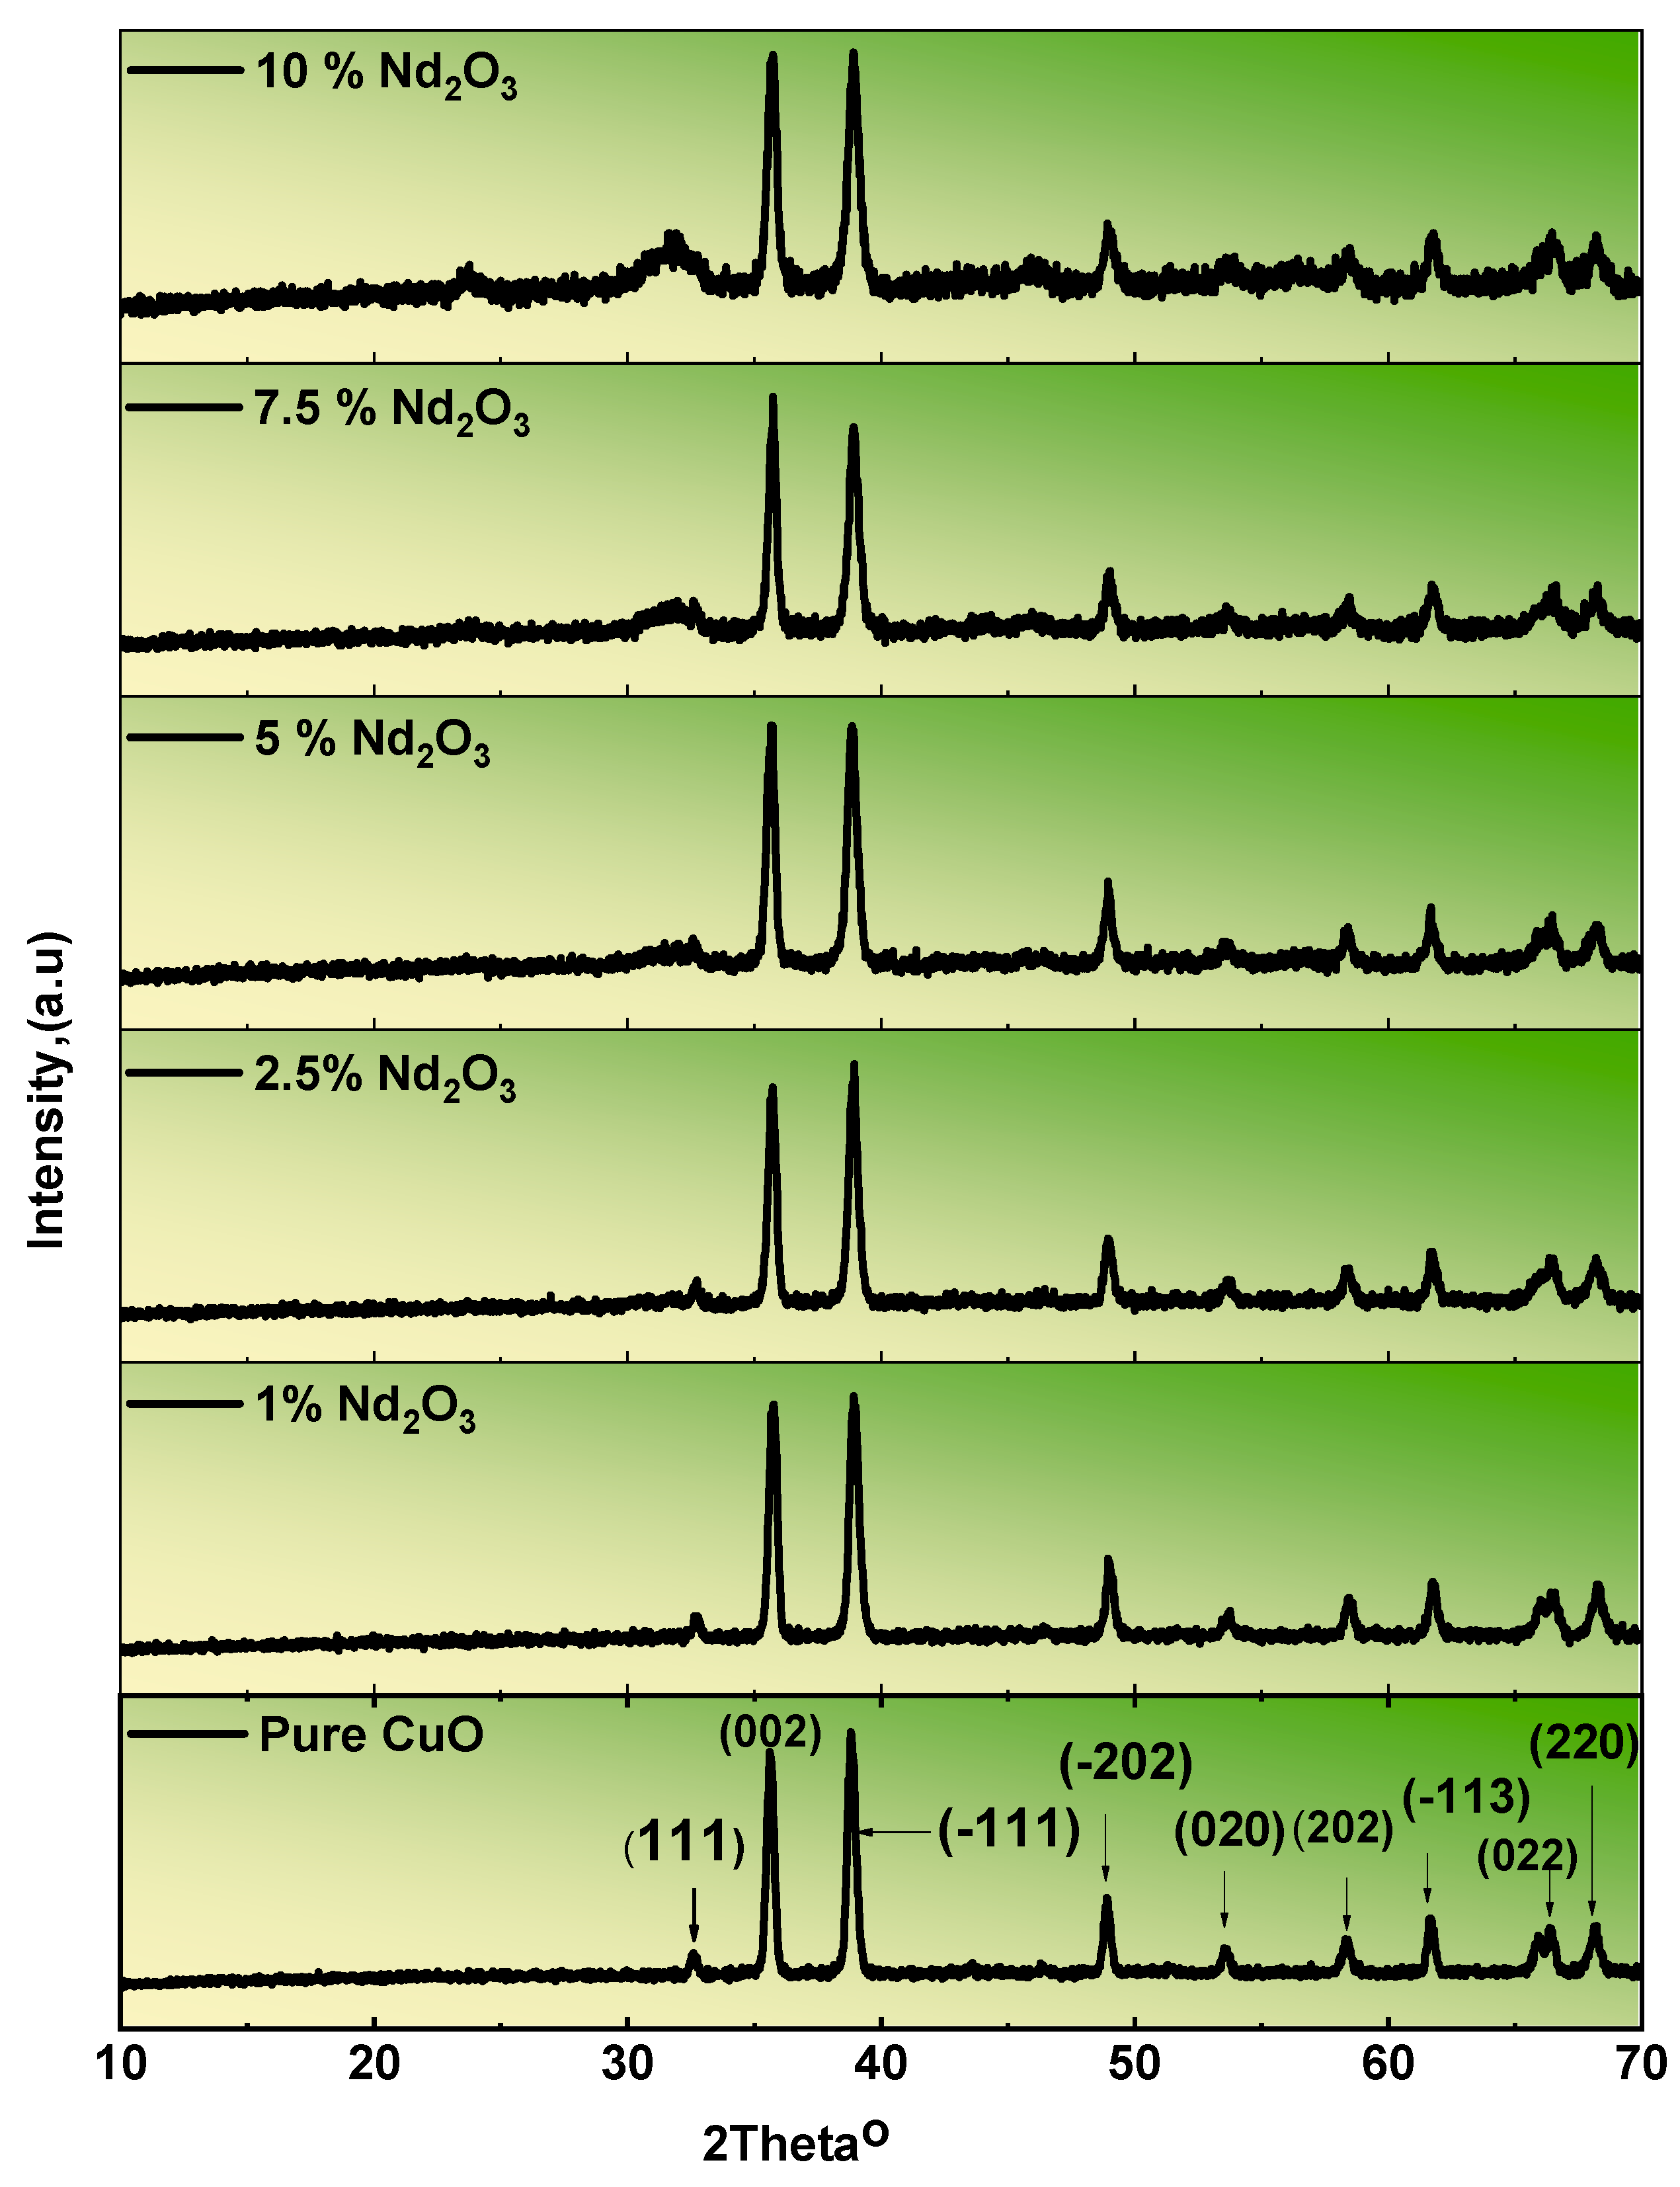
3.1. XRD of the Prepared Nanostructured Nd2O3 Doped CuO

XRD is the most successful approach for recognizing structural information of Nd2O3 doped CuO nanoparticles, and it investigated the crystallinity of nanomaterials. The XRD patterns for pure CuO and Nd2O3 doped CuO nanostructured are shown in Figure 2. The diffraction peaks of pure CuO have been indexed through the characteristic 32.67° (111), 35.63° (002), 38.90° (−111), 48.83° (−202), 53.60° (020), 58.24° (202), 61.59° (−113), 66.5° (022) and 68.19° (220) reflections of the monoclinic phase of CuO [15,16]. The values of diffraction peaks of the as-prepared NPs were tabulated in Table 1.
The intensities and positions of the diffraction peaks for the CuO NPs agree with the reported data (JCPDS 048-1548). Indexes the peaks of the studied samples, and no peaks of impurities are found in the XRD pattern. It could be observed that the Nd2O3 doped CuO NPs had the same XRD design as the CuO, indicating the crystalline structure of the photocatalyst. The excellent dispersion of Nd2O3 via CuO, which acts as the host crystal, has also been confirmed. A small secondary phase appeared due to incorporating Nd2O3 with different percentages (1, 2.5, 5, 7.5, and 10%) into the CuO matrix. Two crystalline peaks appeared at 2-theta: 23°, and 32° with hkl = [110] and [011]. They correspond to the peaks of Nd2O3 as hexagonal phase (JCPDS card No. 01-074-2139). These two peaks strongly appeared at 10% Nd2O3 doped CuO nanoparticles [13,17]. The equation of Scherrer was used to compute crystallite size [18].
D = 0.9 λ β   cos θ ,
In this case, D represents the crystallite size and X-ray wavelength (λ); FWHM represents the full width at half maximum (FWHM). The lattice strain (ε) was determined using the following method [18]:
ε = β cos θ 4 ,
Dislocation density (δ) has been achieved by [18,19]:
δ = 1 D 2
Moreover, where the diffraction peak angle is θ. The calculated mean values of the grain size (D) are tabulated in Table 2. The first phase’s average crystallite domain size ranges from 22.0 to 30.1 nm, while the second phase ranges from 27.1 to 36.7 nm.
The value of (D) for CuO is found in the range of 20–30 nm. It was found that (D) of Nd2O3 sample with Scherrer formula is about 35 nm. The ε and δ were calculated and tabulated in Table 2. It was found that Nd2O3 and CuO atoms bond with O atoms by increasing Nd2O3 content. Lattice strain (ε) arises from the slight variation in the atomic radii of Nd2+- and Cu2+- beside Nd2O3 content, where Cu2+ is replaced with Nd2+ in the host lattice. The decrease in lattice strain (1.2 × 10⁻³) at 7.5% Nd2O3 doped CuO nanoparticle (Table 2) because of atomic radii and dopant concentration reduces local distortion of the crystal lattice. The crystallite size (30.1 nm) of the 7.5% of Nd-CuO sample was increased because of a decrease in δ (1.4 × 10⁻³ nm2) and intrinsic micro-strain [20].

3.2. FESEM Analysis of Nd2O3 Doped CuO Nanostructured

The efficiency and activity of photocatalysts depend on the morphological parameters [21]. Therefore, the morphology characterization of the CuO nanoparticles was investigated by FESEM, as shown in Figure 3A. The nanoparticles have a uniform size, spherical shape, and appropriate separation [22,23]. Figure 3B–F exhibit the FESEM images of Nd2O3 doped CuO NPs at various concentration of Nd2O3. It is evident that the particles had quasi-spherical shapes and aggregated homogeneously. Empty spaces between the particles are pores arising from the inter-aggregation of particles [15]. From the FESEM result, the average crystalline size of the prepared nanocomposite materials was found in the range of 17–39 nm. As shown in the Table 3, 7.5%Nd2O3 doped CuO has the smallest value of particle size (17 nm), which means that increasing surface area of catalyst thereby, the improvement of photodegradation efficiency of catalyst [15].
EDX image depicts the peaks of CuO and Nd2O3 beside atomic percentage of elements (see inset of Figure 3G) contained in 7.5% Nd2O3 doped CuO nanoparticle, where it verified the production of Nd2O3 doped CuO nanoparticle by homogeneous chemical structure.

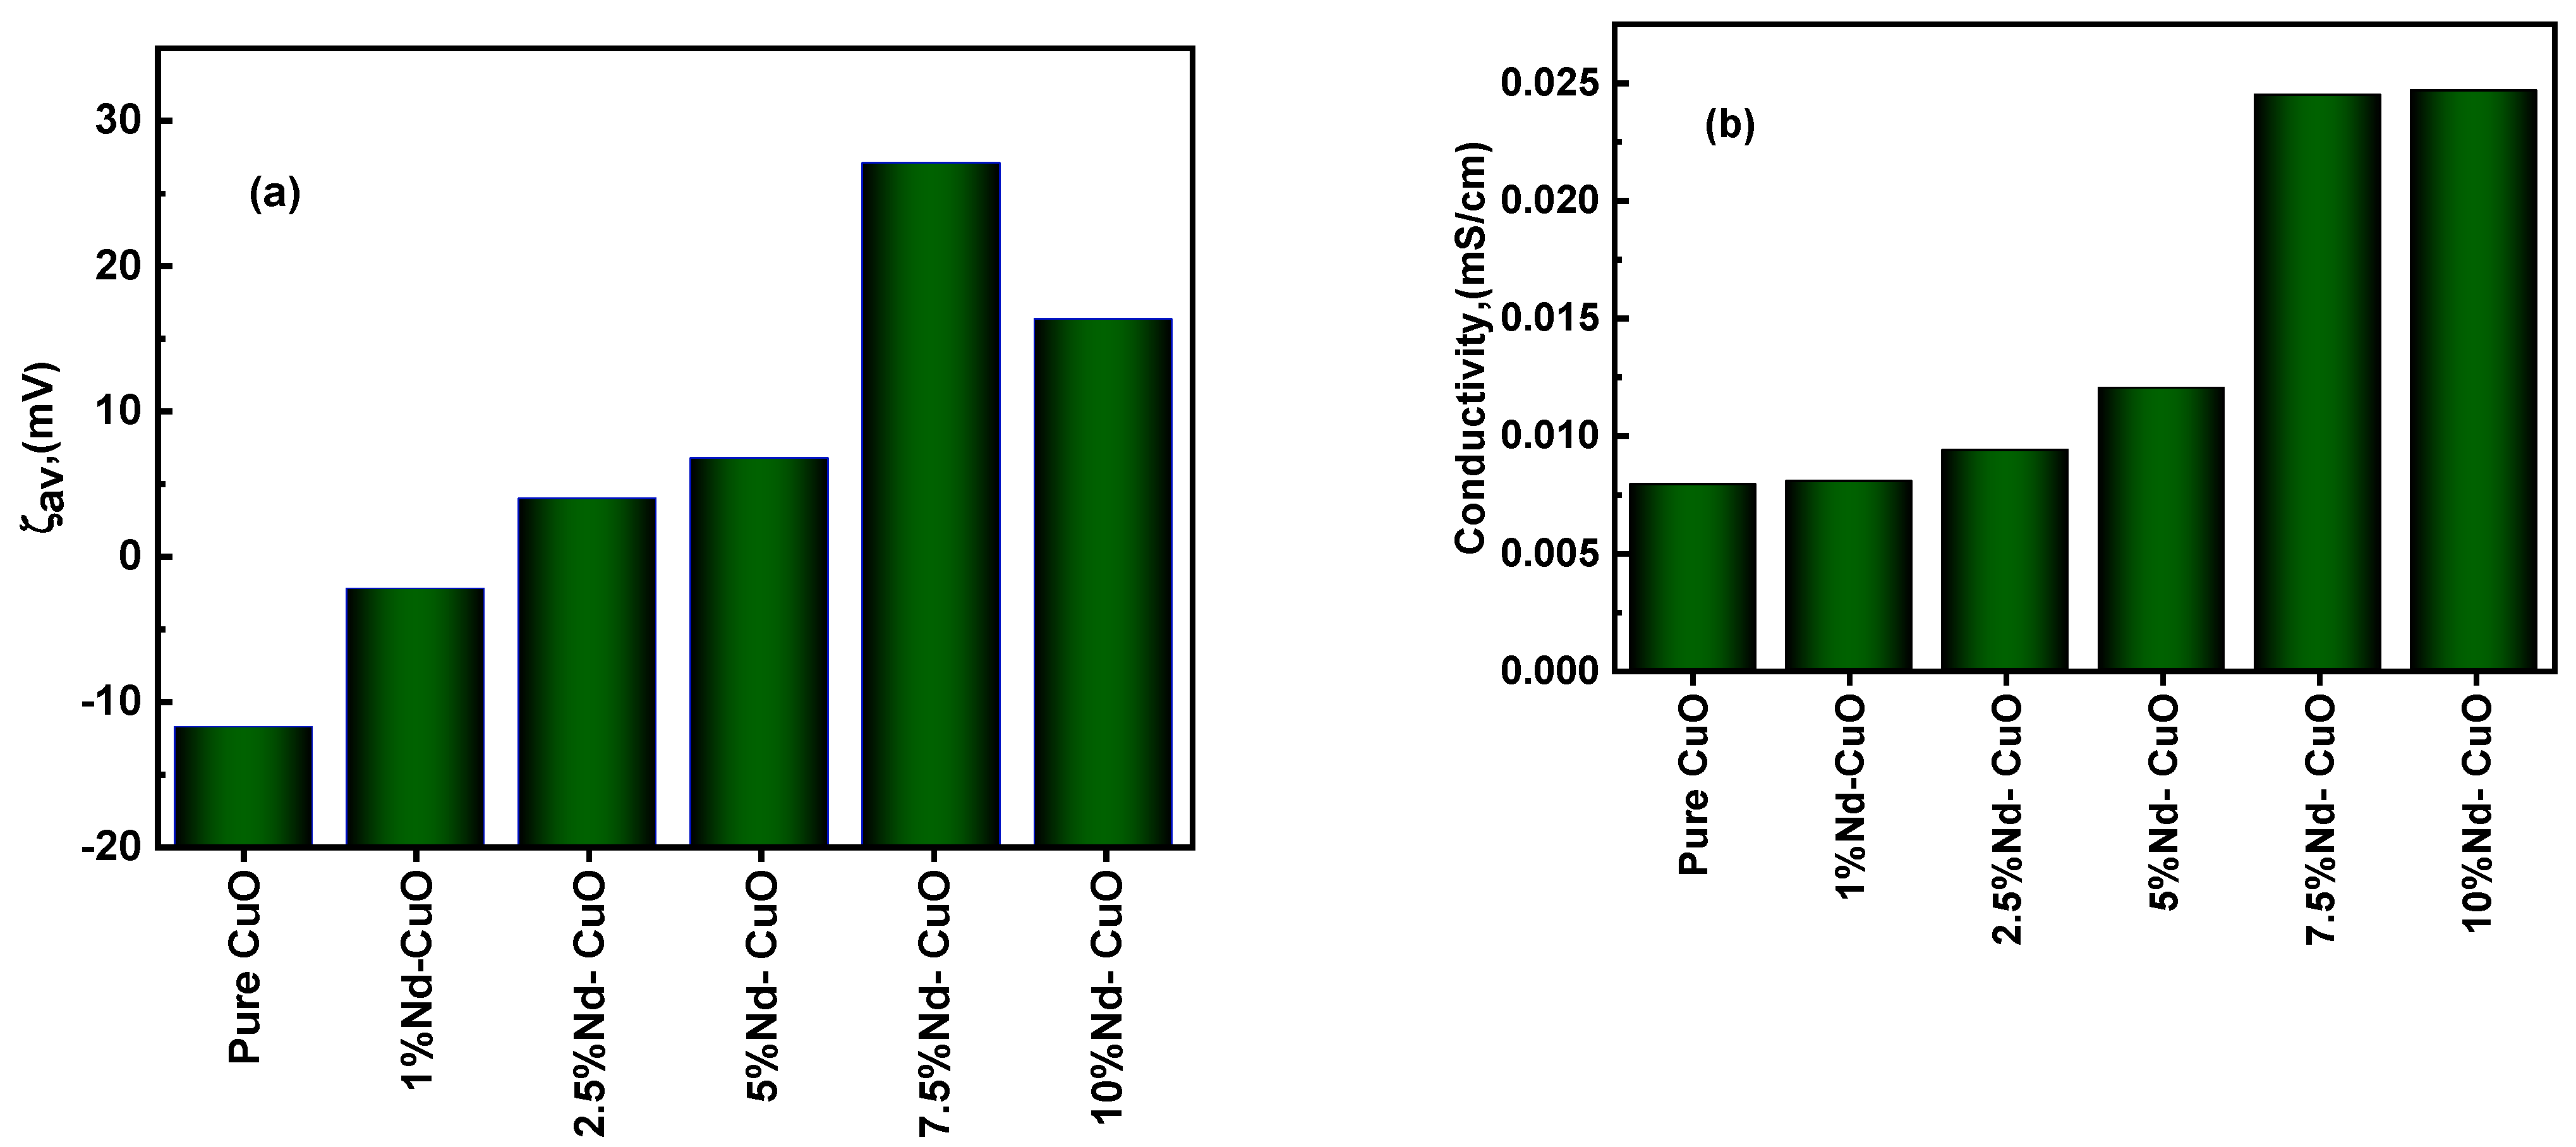
3.3. DLS of Nanostructured Nd2O3 Doped CuO

Figure 4a,b depicts the average ζav and conductivity obtained from % Nd2O3 doped CuO nanoparticles. As shown in Figure 4a, ζav-potential increased by increasing percentage Nd till 7.5% Nd2O3 doped CuO nanoparticle reaching ~27 mV, which it can attribute to the deformation in the CuO crystal lattice by increasing content of Nd2O3. Figure 4b depicts the conductivity enhancement by increasing Nd2O3 content, which was 0.025 mS/cm at 7.5% Nd2O3 doped CuO nanoparticle. Enhancement of conductivity can be attributed to an increase of ζav-potential value where Photocatalytic activity increases up to 7.5 percent with the increasing mobility of holes causing a photocatalytic activity enhancement [21].

3.4. Photocatalysis Using Nanostructured Nd2O3 Doped CuO

3.4.1. Effect of Nd+3 Doping

The as-prepared nanomaterials (100 mg) have been subjected to visible (80 min irradiation) photodegradation of MB dye. Figure 5 illustrates the MB absorption spectra in the presence of visible illumination with pure CuO and Nd2O3 doped CuO nanoparticles. The λmax of MB is 664 nm. It is obvious from Figure 5 that the intensity of all samples decreases with increasing time, which means that the dye’s photodegradation rate increased with time. The results revealed that the pure CuO catalyst achieved 87% degradation of MB, while 7.5% Nd2O3 doped CuO catalyst achieved the highest photocatalytic efficiency, up to 90.8% within 80 min under visible light irradiation. The rate of MB degradation k (min−1) was achieved by [24]:
ln ( A A o ) = kt
where absorption at 0 min illumination is Ao (mg.L−1), and absorption at irradiation time t (min), is A. The k values for CuO and Nd2O3 doped CuO nanoparticles are depicted in Figure 6. The higher the doping level, the higher the rate of deterioration up to 7.5% Nd2O3 doped CuO nanoparticle, while at 10% Nd2O3 doped CuO nanoparticle, the degradation begins to decrease, which means that 7.5% Nd2O3 doped CuO nanoparticle has the highest degradation rate constant of 0.02274 min−1 (as seen in Table 4).

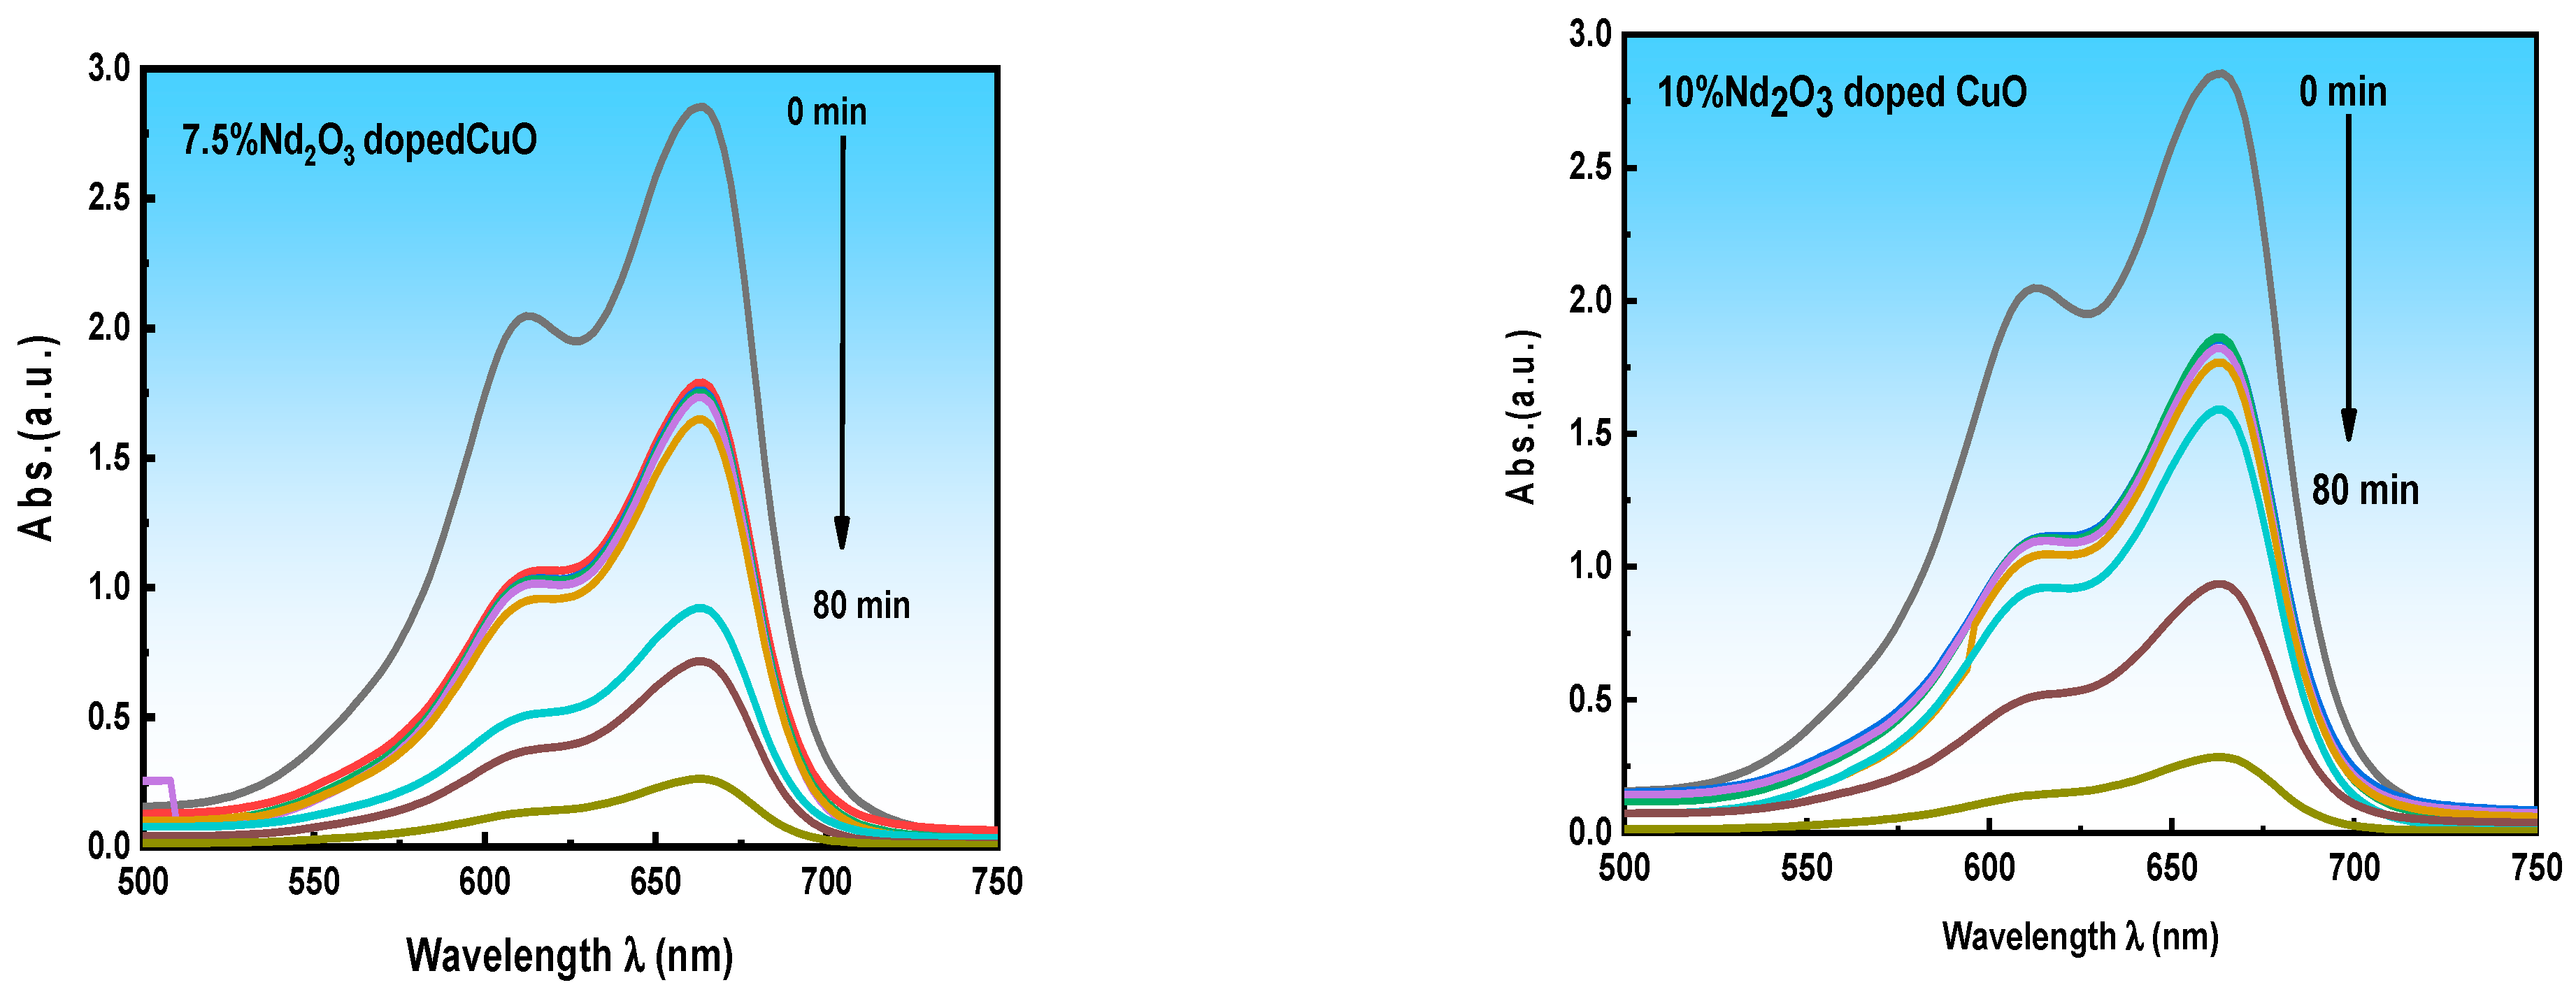
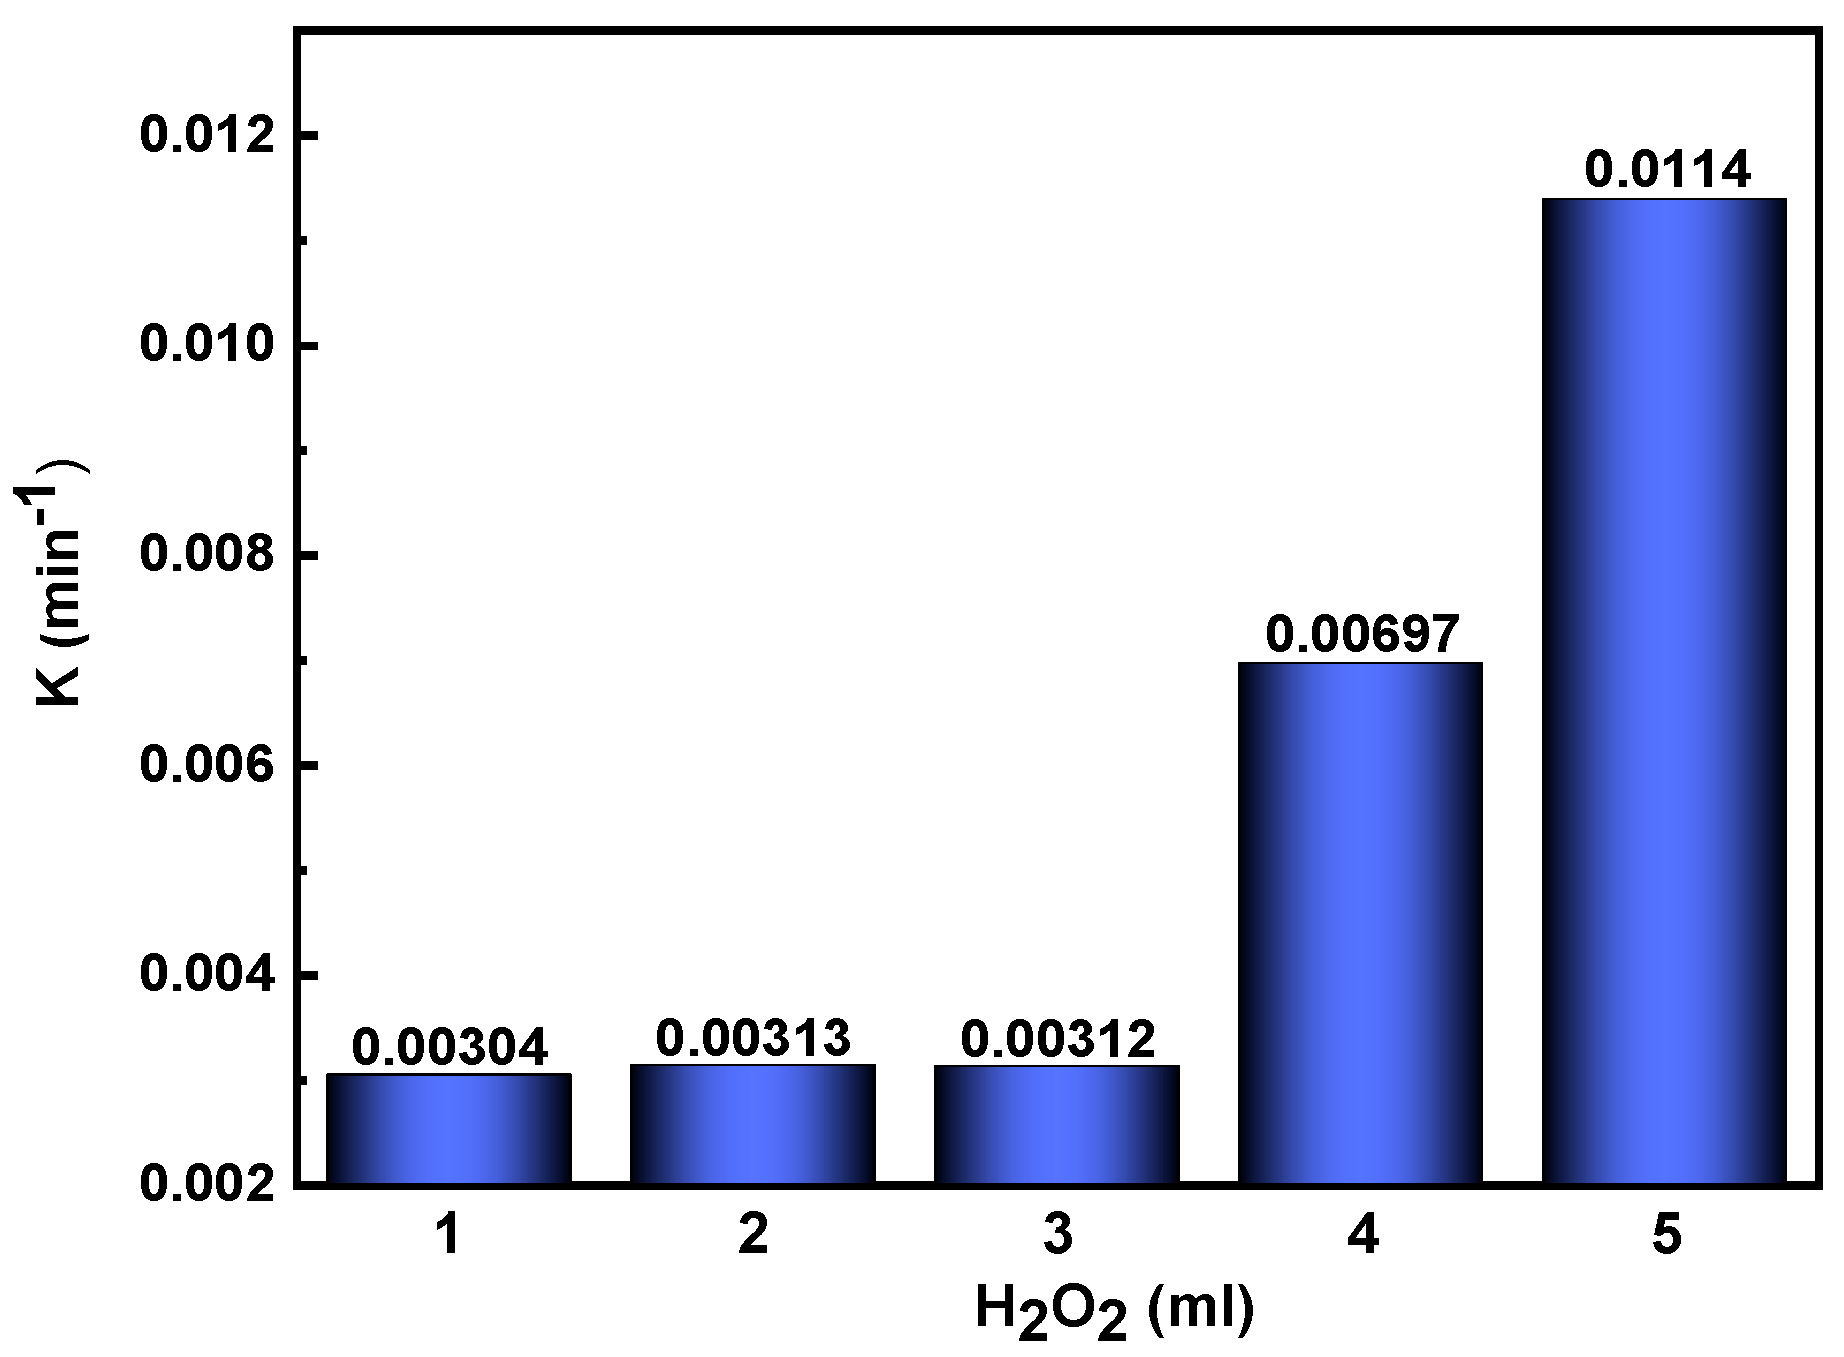
3.4.2. Influence of H2O2 Concentration of 7.5% Nd2O3 Doped CuO Nanoparticle

The synthesis of HO is based on H2O2, one of the cleanest and optimal oxidants for the dye’s degradation and organic pollutants in wastewater [24]. In this investigation, five different concentrations were utilized of H2O2 (1, 2, 3, 4 and 5 mL) in the presence of 0.1 g of 7.5% Nd2O3 doped CuO nanoparticle for visible photodegradation of each one of MB dye. Figure 7 depicts the effect of H2O2 concentration on photodegradation. As can be seen, the photodegradation rate increases with increasing H2O2 concentration until it reaches its maximum at 5 mL (as shown in Table 4). According to Equation (5), the greater reaction rates following the addition of H2O2 are due to an increase in the concentration of hydroxyl radical [25]:
H 2 O 2 + OH HO 2 +   H 2 O ,
As a result, adding hydrogen peroxide at the required quantities can speed up the photodegradation of MB dye.

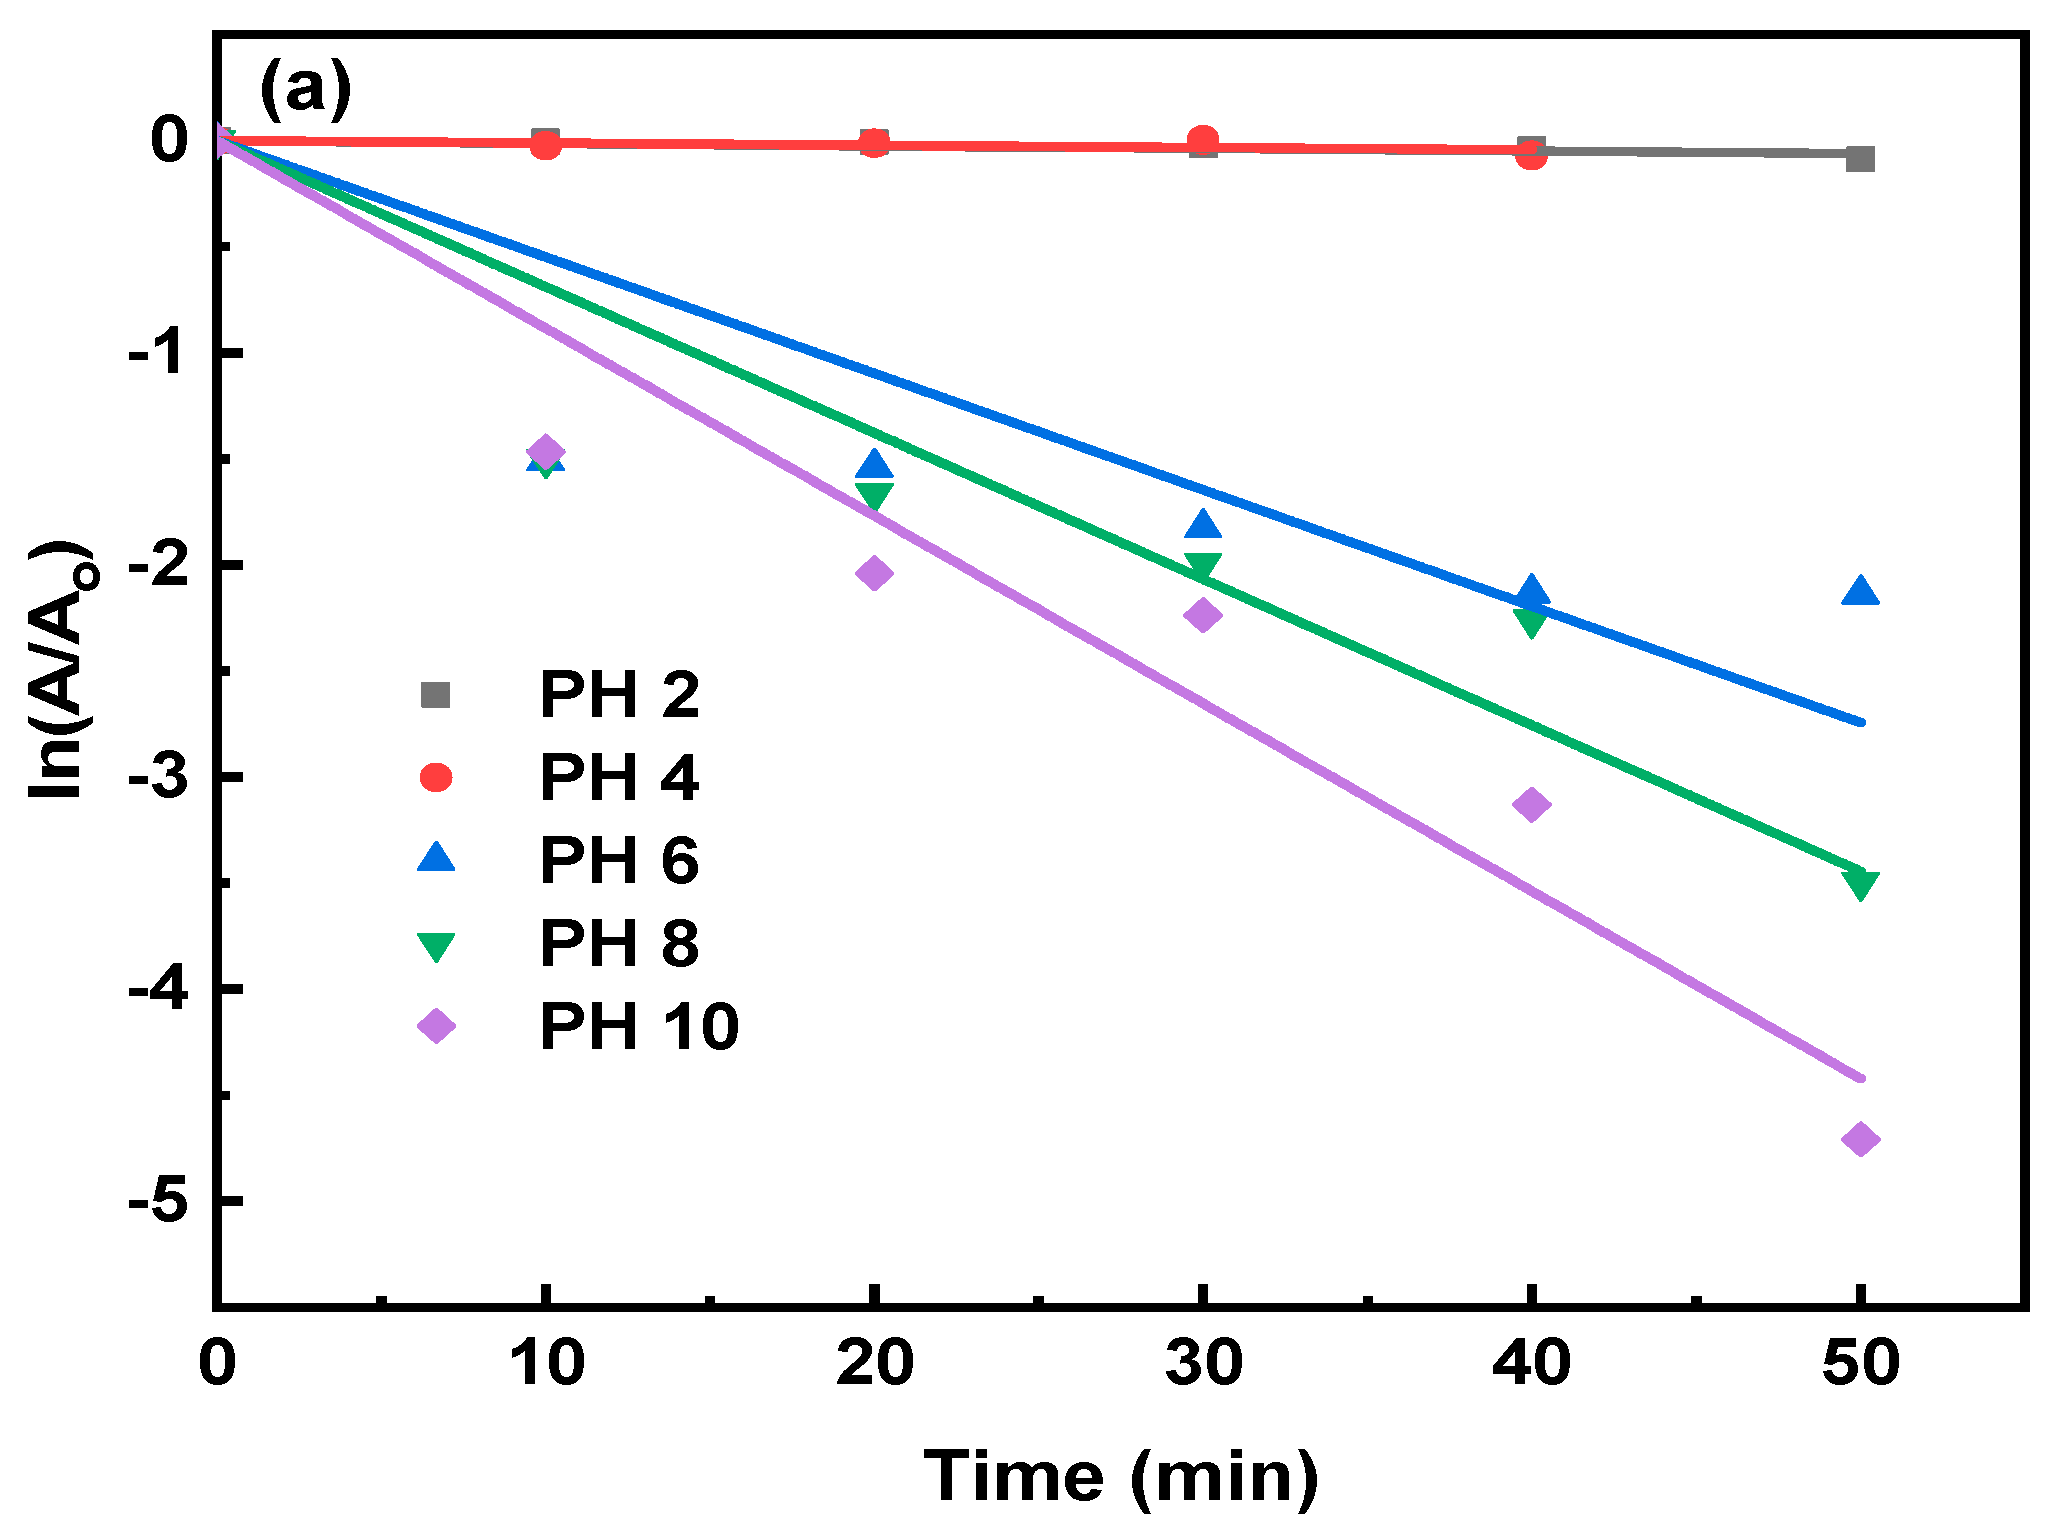
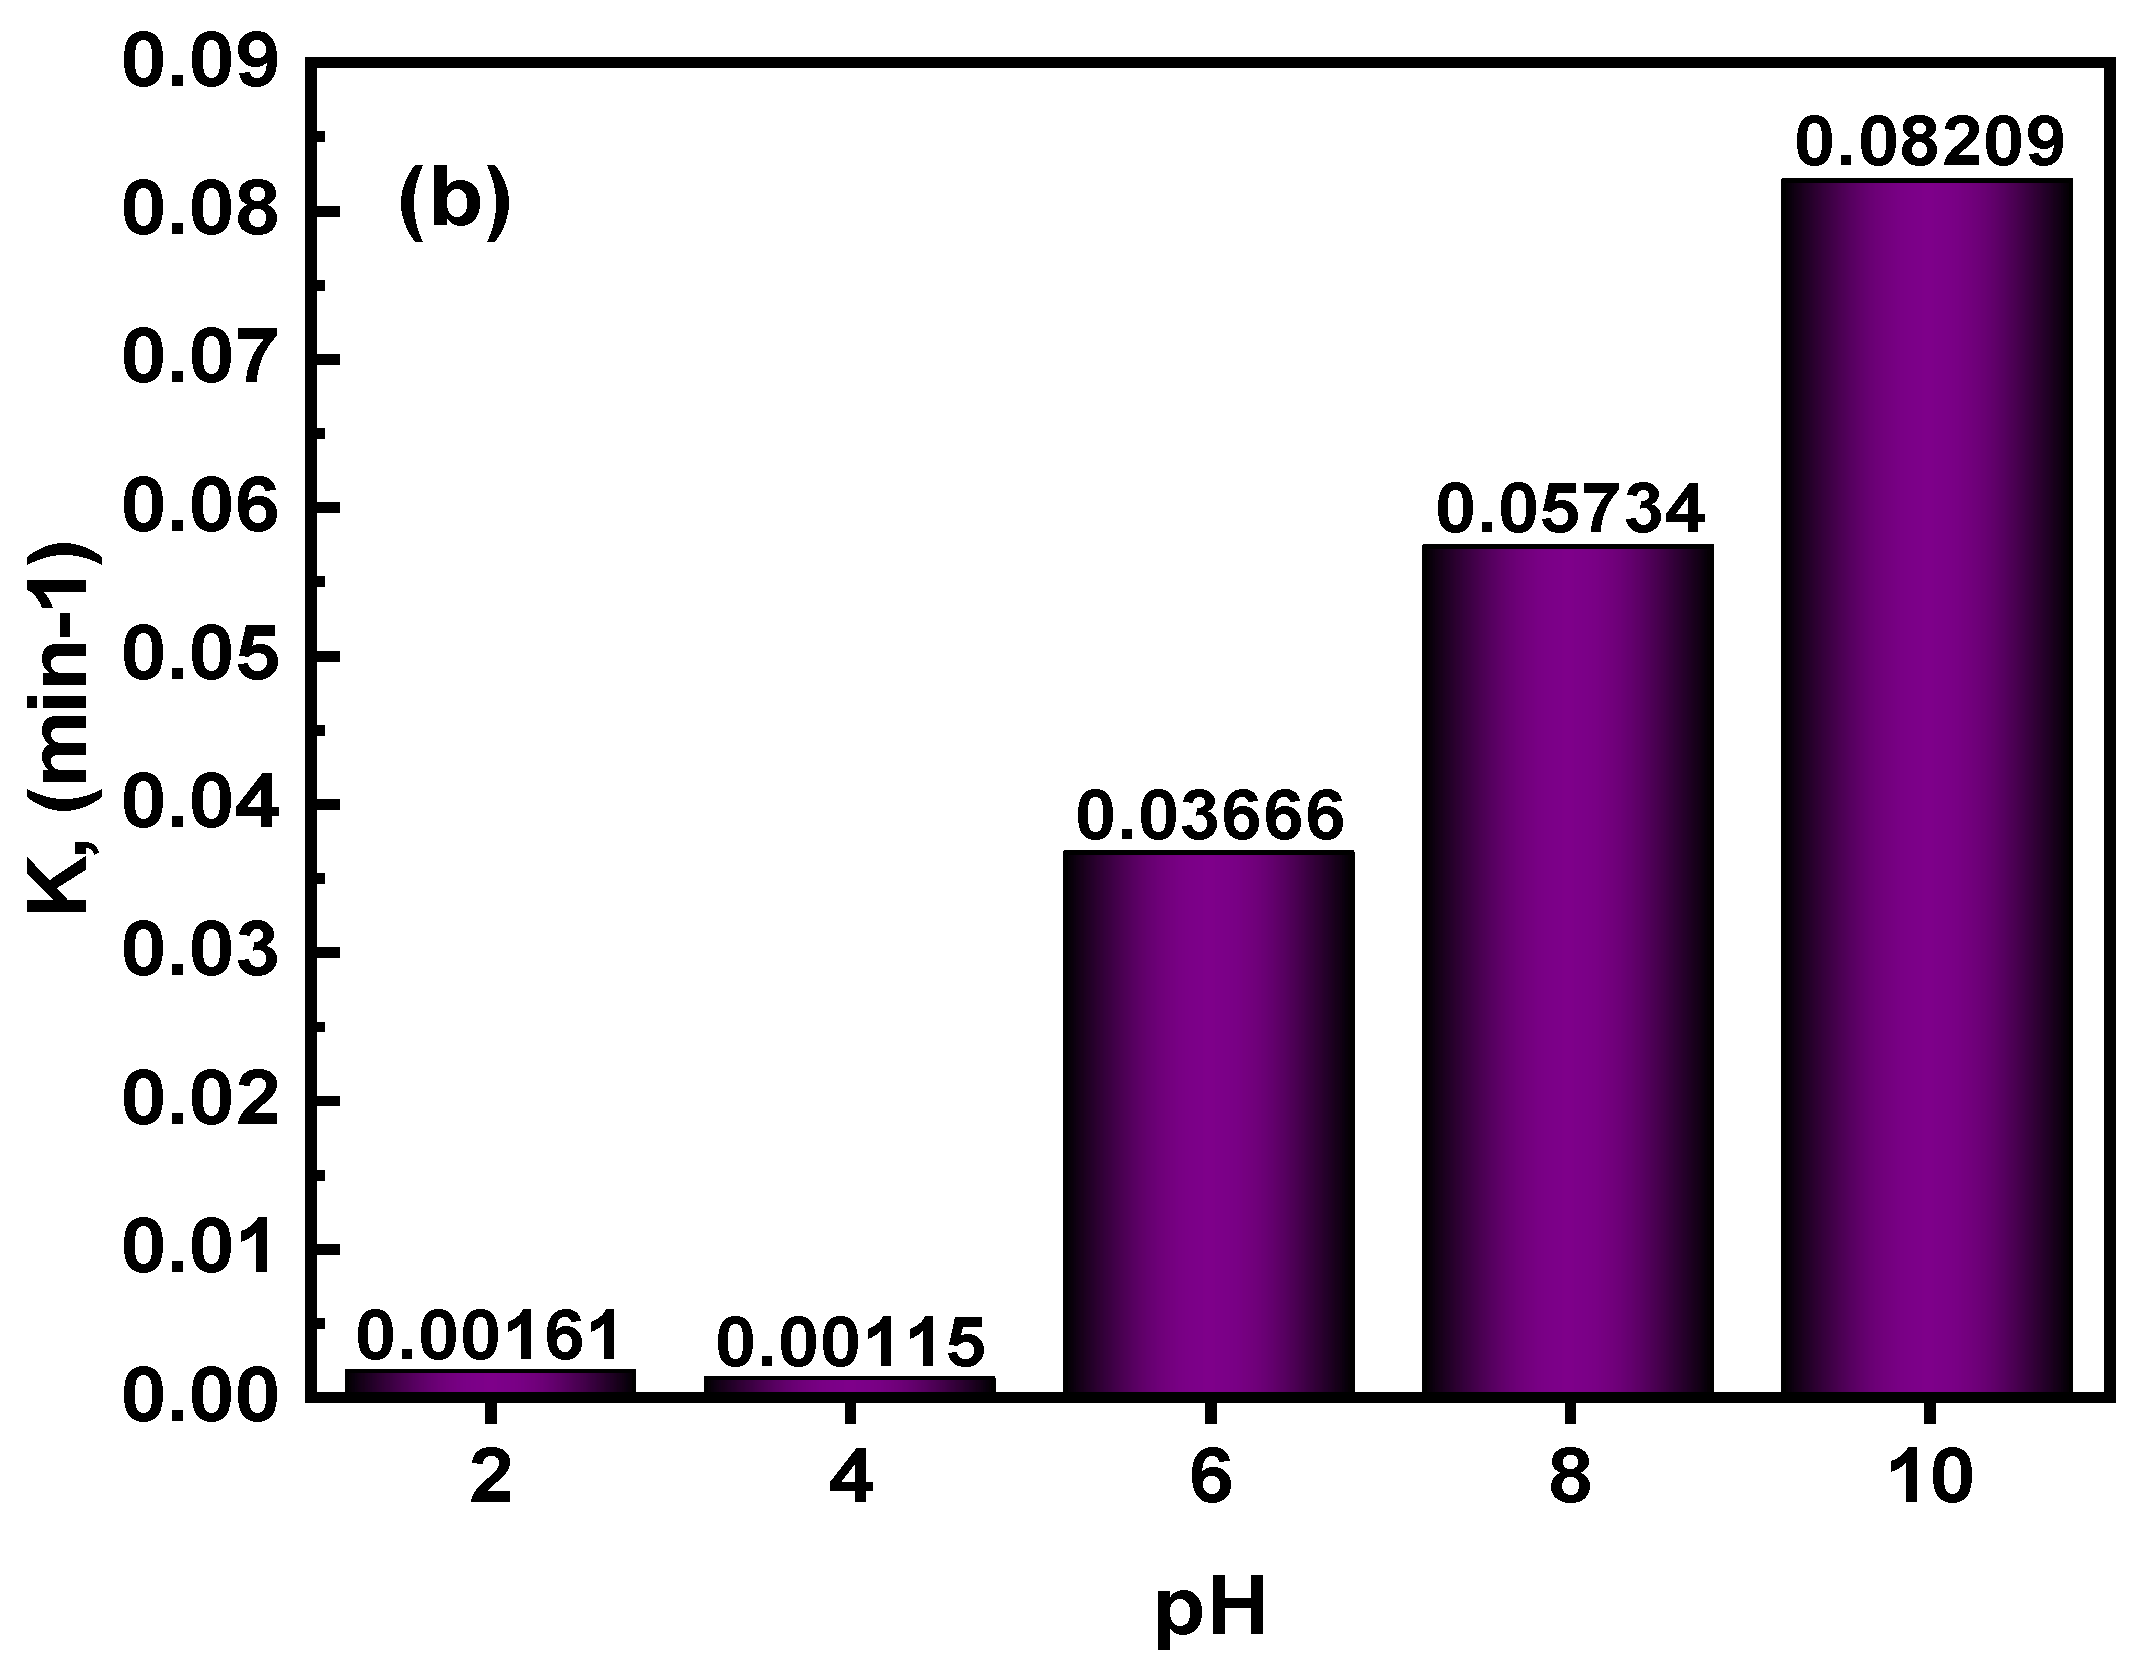
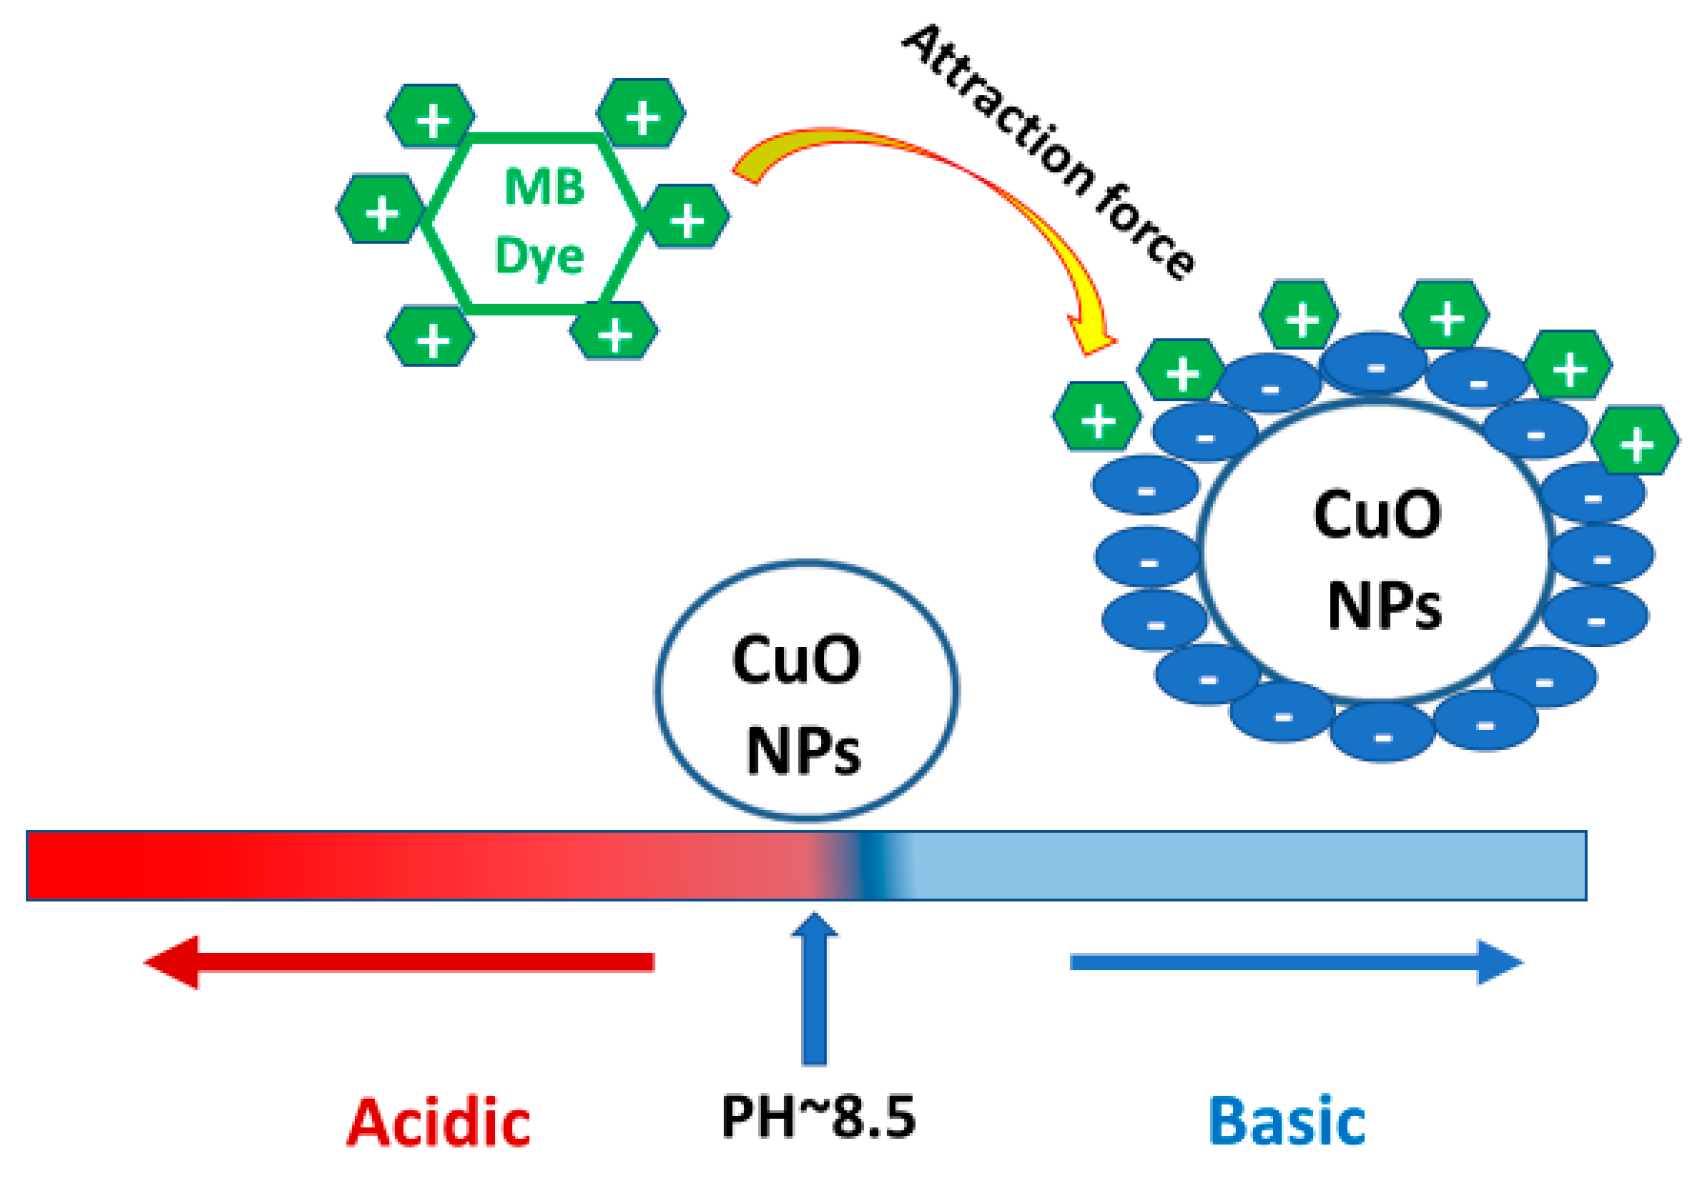
3.4.3. Effect of pH on 7.5% Nd2O3 Doped CuO Nanoparticle

Due to the high pH dependency of certain aspects, such as semiconductor surface charge state and dissociation of chemicals in the solution, the pH of the solution impacts photodegradation processes. Therefore, photodegradation was studied in ideal circumstances with a pH range of 2 to 10 to evaluate the impact of pH on the photodegradation process. Figure 8a,b represents kinetic study and the rate constant (k) of photodegradation of MB at different pH values in the presence of 7.5% Nd2O3 doped CuO nanoparticle as a catalyst.
The result exhibited a maximum efficiency (99%) at pH 10 after 50 min from the start of irradiation (as seen in Table 4). Several techniques were utilized to calculate the pH of the CuO NPs’ point of zero charges (pHpzc), which was between 8.5 and 9.5 [26,27]. The charge on the photocatalyst surface was positive and negative, below and above pHpzc, respectively. When the pH is less than pHpzc, repulsion between the positively charged 7.5% Nd2O3 doped CuO catalyst and cationic dye reduces photodegradation efficiency [27]. Scheme 3 depicts the impact of CuO NPs’ pHpzc on cationic dye degradation. Moondeep et al. [26] At greater pH, the CuO NP surface is charged negatively, which improves its interaction with cationic dye (VB). Meanwhile, the CuO NP surface is charged positively at lower pH, enhancing its interaction with anionic dye.

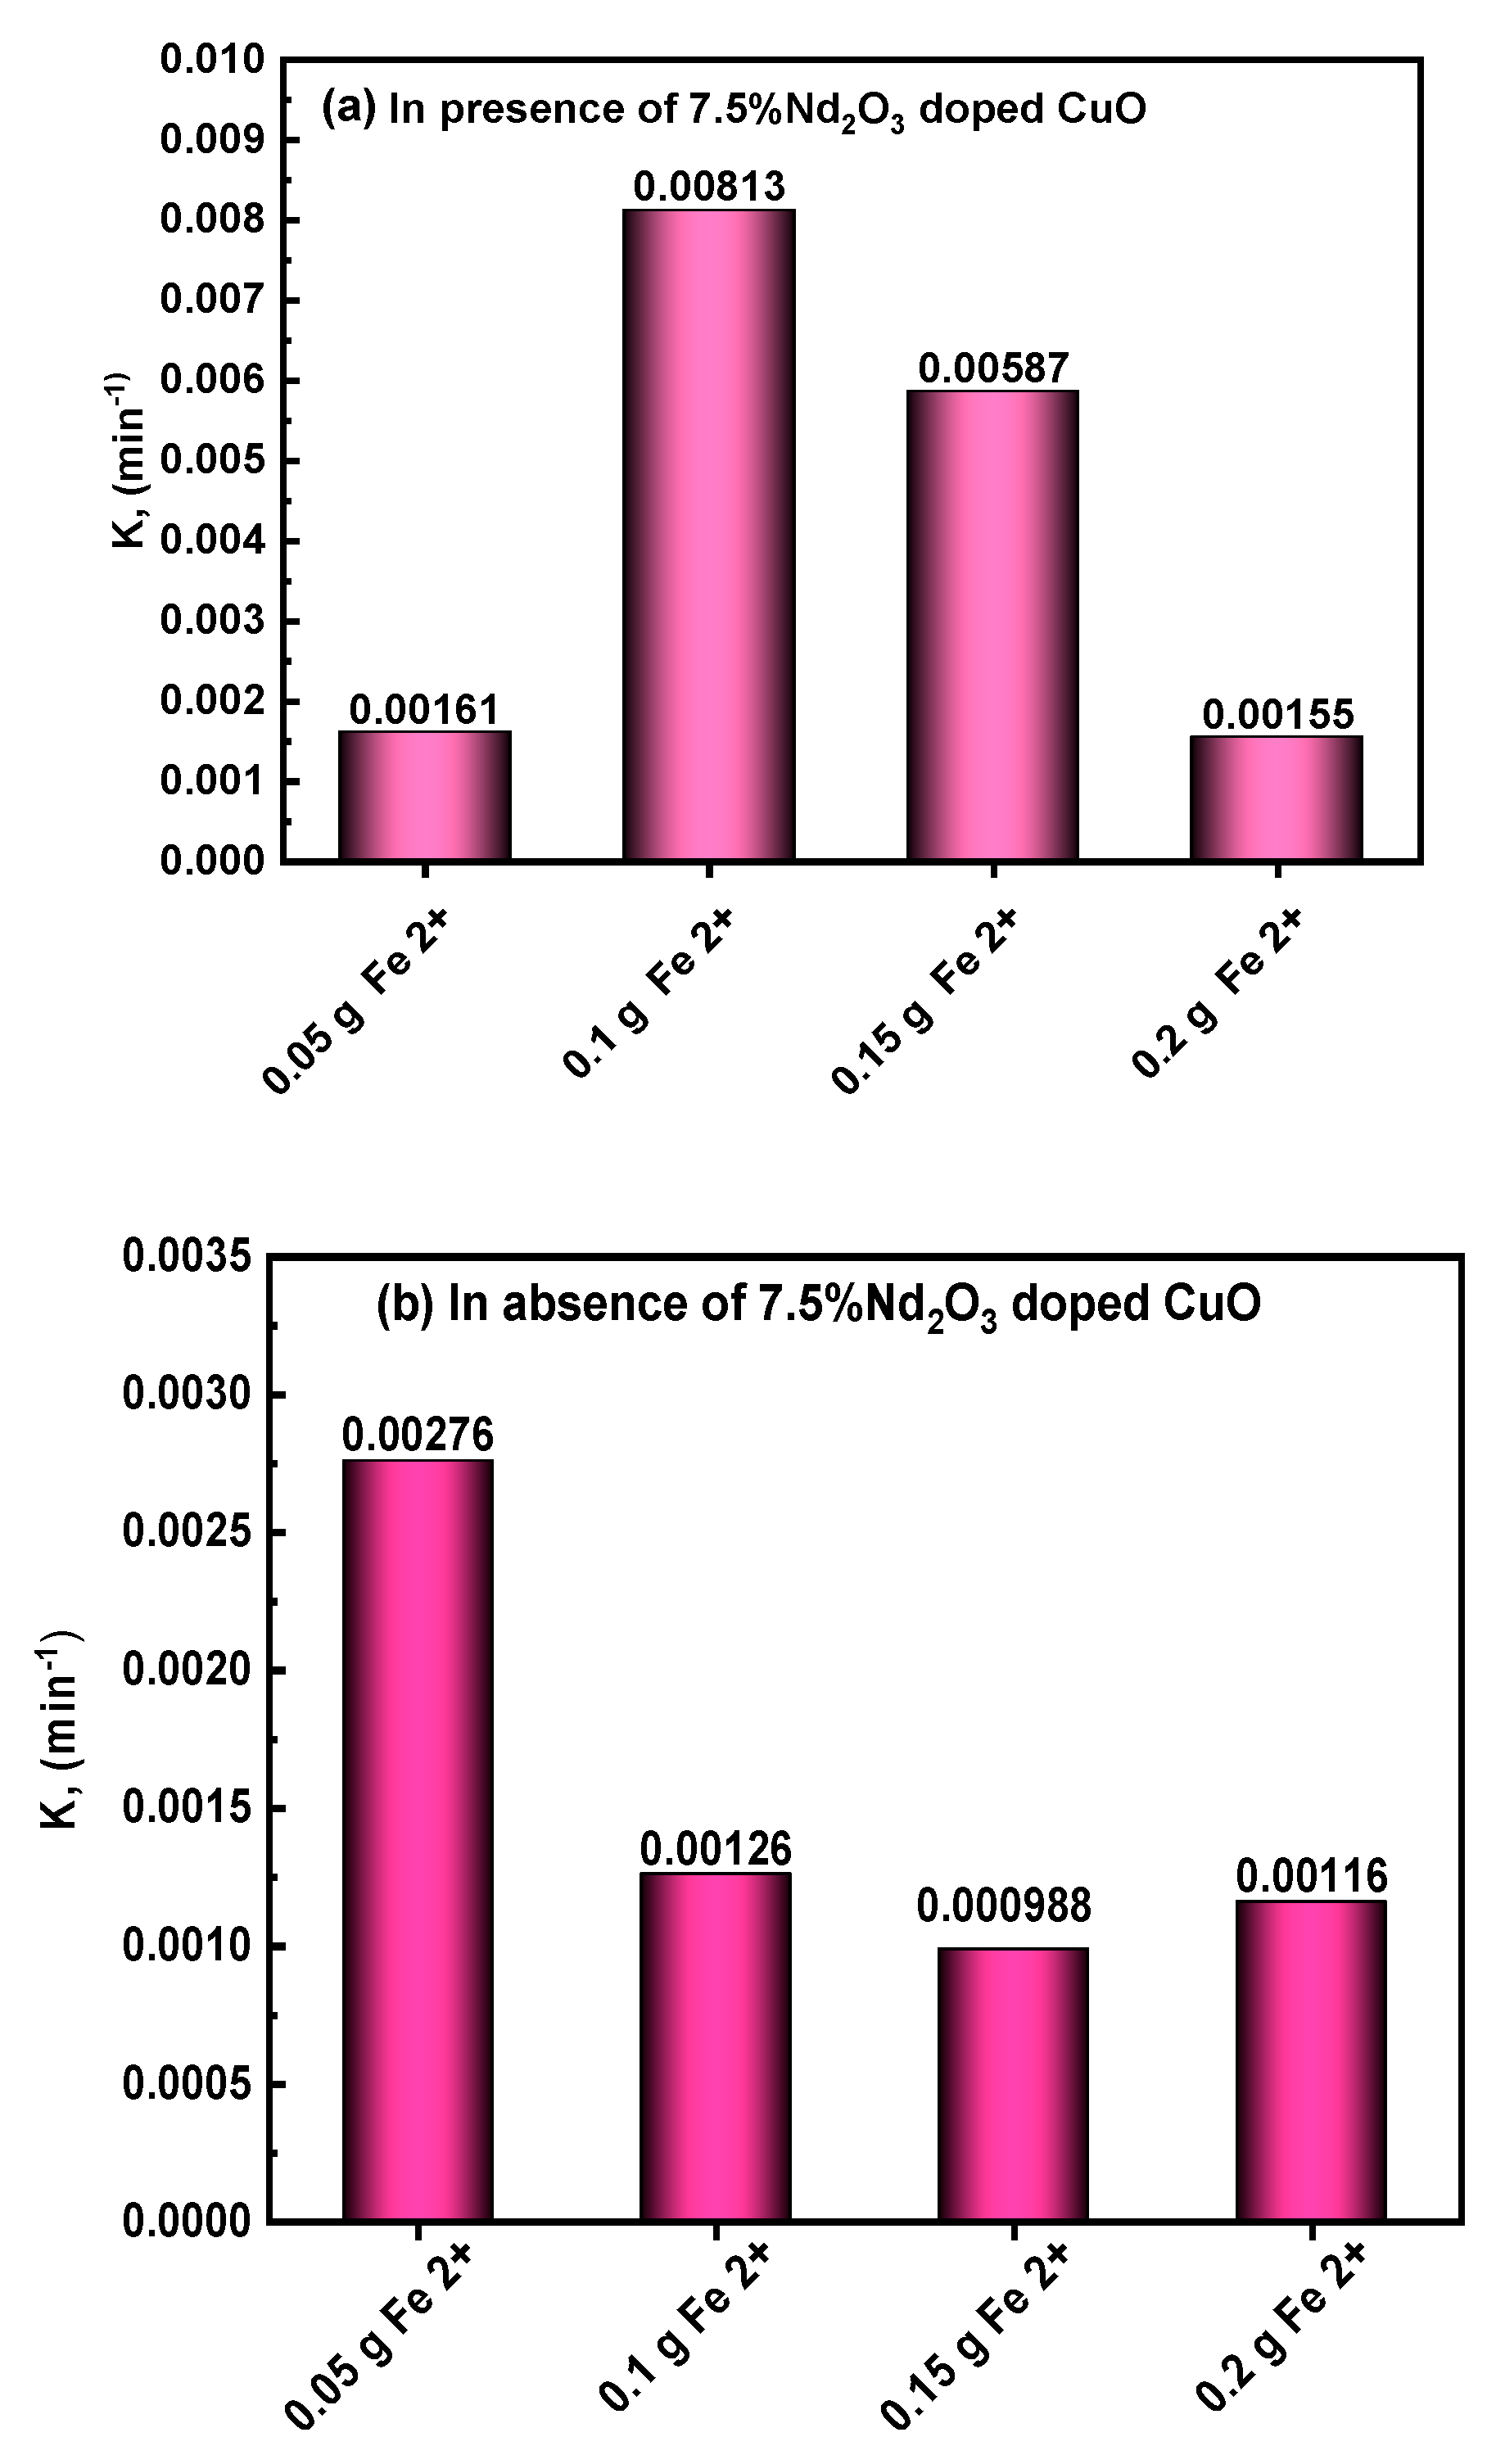
3.4.4. Effect of Fenton and Photo-Fenton on MB Photodegradation

Fenton and Photo-Fenton processes have been demonstrated to be the most promising strategies for wastewater treatment. These techniques contribute to improving the environment through a reduction in the pollution resulting from complicated dye molecules and other organic substances as a green chemical and ecological method [9]. The current study investigates photochemical degradation of MB dye by photo-Fenton reaction in the presence and absence of 7.5% Nd2O3 doped CuO catalyst. Figure 9a shows the effect of ferrous sulfate concentration [0.05 to 0.2 g Fe+2-ions] on the rate of photochemical degradation in the presence of 7.5% Nd2O3 doped CuO catalyst, maintaining all other parameters constant. The findings displayed in Figure 9a enhance the photo-Fenton degradation rate by increasing the content of Fe+2-ions up to 0.1 g by a continuous rate of 0.00813 min−1. Increasing the number of Fe+2-ions up to this specific Fe+2 concentration improves OH radical production and increases the photochemical degradation rate. In addition, the reaction rate was reported to be lowered with increasing Fe+2-ions concentration. Figure 9b shows the effect of Ferrous sulfate concentration [0.05 to 0.2 g Fe+2-ions] on the rate of photochemical degradation in the absence of 7.5% Nd2O3 doped CuO catalyst.
The result showed that the optimum rate constant was 0.00276 min−1 at 0.05 g of Fe+2 ions concentration without a catalyst. The constant rate in the presence of a catalyst is higher than the absence of them. The rate constant (k) values and degradation (%) at different Nd2O3 concentrations, H2O2, and pH were calculated and tabulated in Table 4.
The reaction in Fenton was initially identified by H.J. Fenton [28] and is classified as an improved oxidative potential for H2O2 in acidic media when iron (Fe) is a catalyst. The reactions included in Fenton processes are [29]:
Fe 2 + + H 2 O 2 Fe 3 + + OH . + OH ,
H 2 O 2 HO 2 . + H + ,
Fe 2 + + OH . Fe 3 + + OH ,
Fe 3 + + HO 2 . Fe 2 + + O 2 + H +
OH . + OH . H 2 O 2 ,
  MB   Dye + OH .   Degraded   Product

3.4.5. Comparison of the Photocatalytic Activity of Several Compounds Based on CuO

In the present work, 7.5% Nd2O3 doped CuO nanocomposite exhibited the highest photocatalytic efficiency, up to 90.8% in 80 min, with a 0.0227 min−1 degradation rate. At pH 4, the degradation efficiency reaches its maximum value to be 99%. When comparing the data acquired with other research, the capacity to study, evaluate and contrast outcomes may be demonstrated. Table 5 indicates the comparison of photocatalytic degradation of MB and other dyes in the presence of Nd-doped metal oxide with different previous work samples. M. Arunpandian et al. [30] found that 0.3 wt% of Nd2O3-doped ZnO was the highest active, showing high photocatalytic activity for the degradation of MB dye. Arun Pandian M. et al. [16] It was shown that MB degradation was by Ag/Nd2O3-ZnO Nanocomposite within 30 min with a 98.12 percent efficiency under visible light. Dhanya et al. [31] Including Nd3+ in the SnO2 lattice decreases bandgap and inhibits the electron-hole recombination. Thus, visible light can excite electrons from the valence band to the conduction band. Samuel et al. [32] Nd–ZnO showed good photocatalytic activity. In comparison to ZnO, nanocomposite [Nd–ZnO–GO (0.3% of Nd)] demonstrated higher photocatalytic efficiency and could be regarded for promise as a photocatalyst in organic wastewater treatment. Samuel Osei-Bonsu Oppong et al. [33] The photodegradation efficiency of indigo carmine solutions exposed to simulated solar light for 3 h with Nd–TiO2–GO (0.6 percent Nd) nanocomposites was found to be 92 percent. Umair Alam et al. [34] showed that the Nd-doped ZnO is the best activity with 98% degradation efficiency compared used other rare earth metals. Sonali et al. [35] The optimum photocatalytic activity for MB degradation was ob-served for 3.0 mol. Percent Ce-CuO, which led to 98 percent degradation in 180 min. Xia Shao et al. [36] When the ratio of Nd to TiO2 is 3–4 wt%, the highest activity is reached, and MB is degraded by UV- light in 160 min. Reda M. Mohamed et al. [37] For 2 h, the photocatalytic efficiency of mesoporous 3 percent Nd2O3/ZnO for TC degradation reached 100%. Moondeep et al. [26] under diverse energy sources, such as UV-visible irradiation and UV radiations, the degradation efficiency of CuO NPs on cationic (VB) and anionic (DR) dyes were measured.

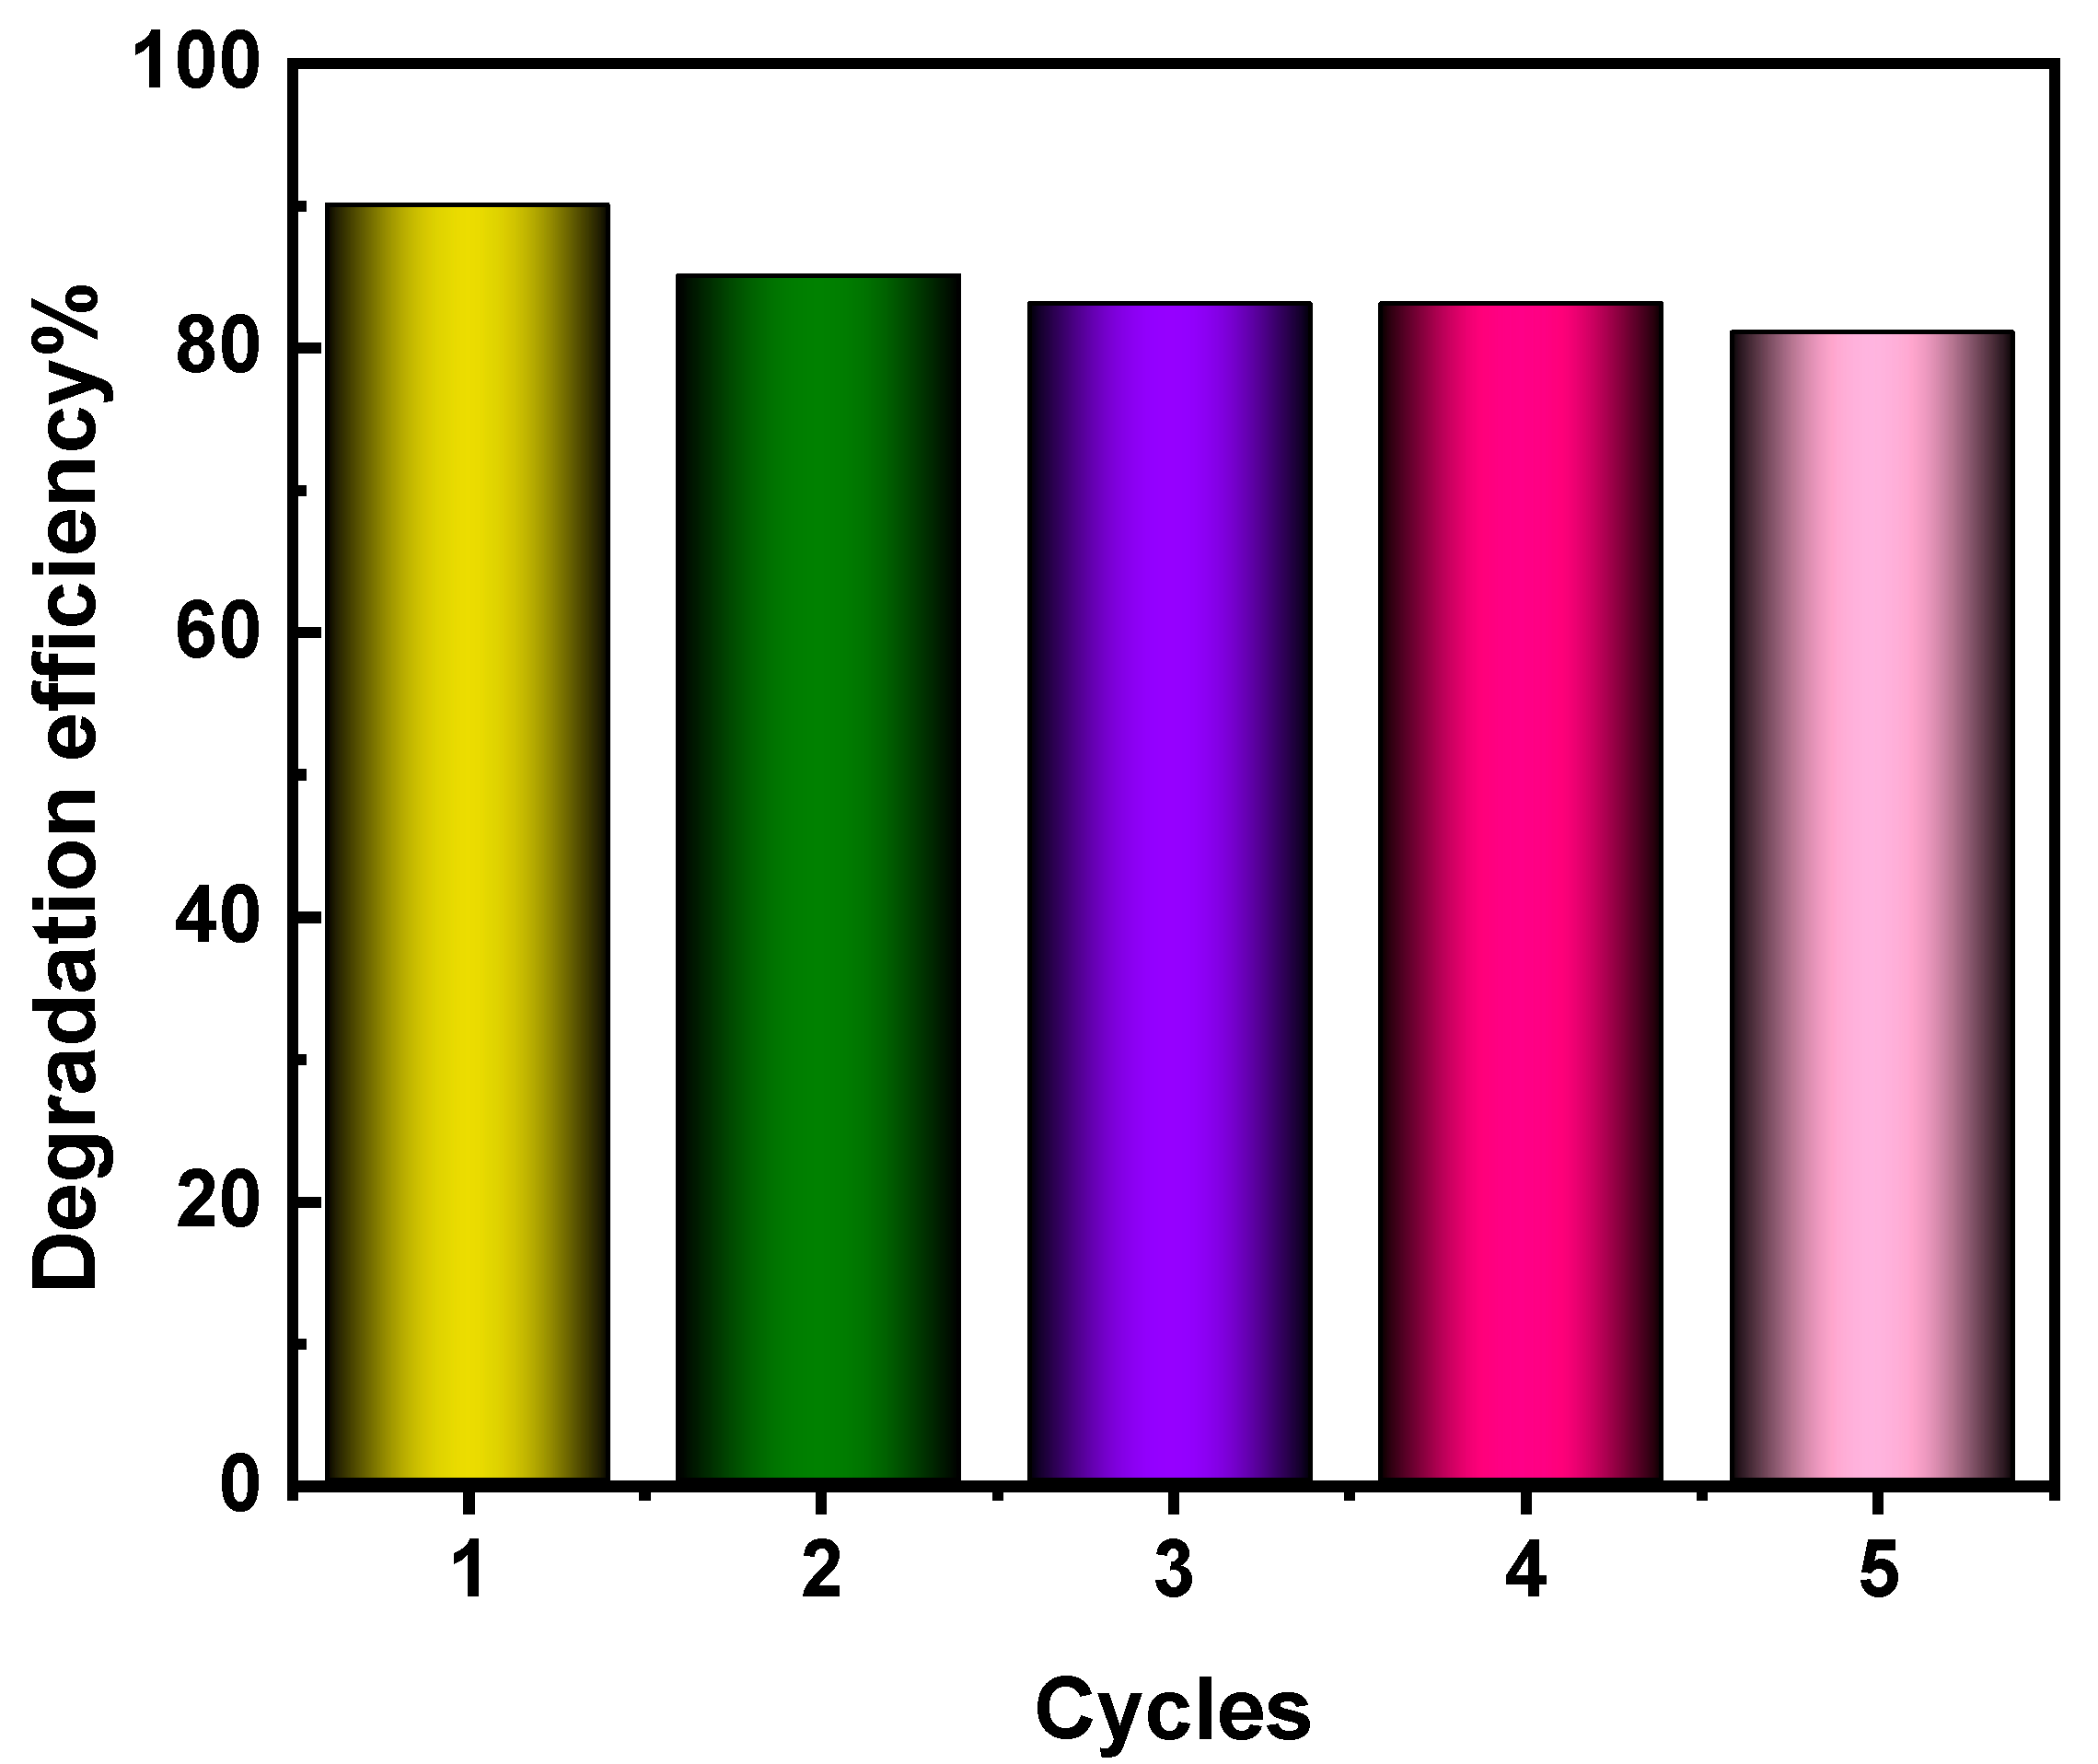
3.4.6. Reusability and Stability

In practical applications, the photostability of a photocatalyst is an essential feature. The synthesized Nd2O3 doped CuO photocatalyst was exposed to five photocatalytic trial runs to determine its photostability by adding the reused photocatalyst to new MB solutions under the same experimental conditions. The photocatalyst was reused after centrifugation without regeneration. Figure 10 depicts the recycling of 7.5% Nd2O3 doped CuO nanostructured. It was found that, in five successive experimental runs, photocatalyst activity reached 88% of MB degradation, which promotes the prepared samples for its photocatalytic performance in environmental treatment.

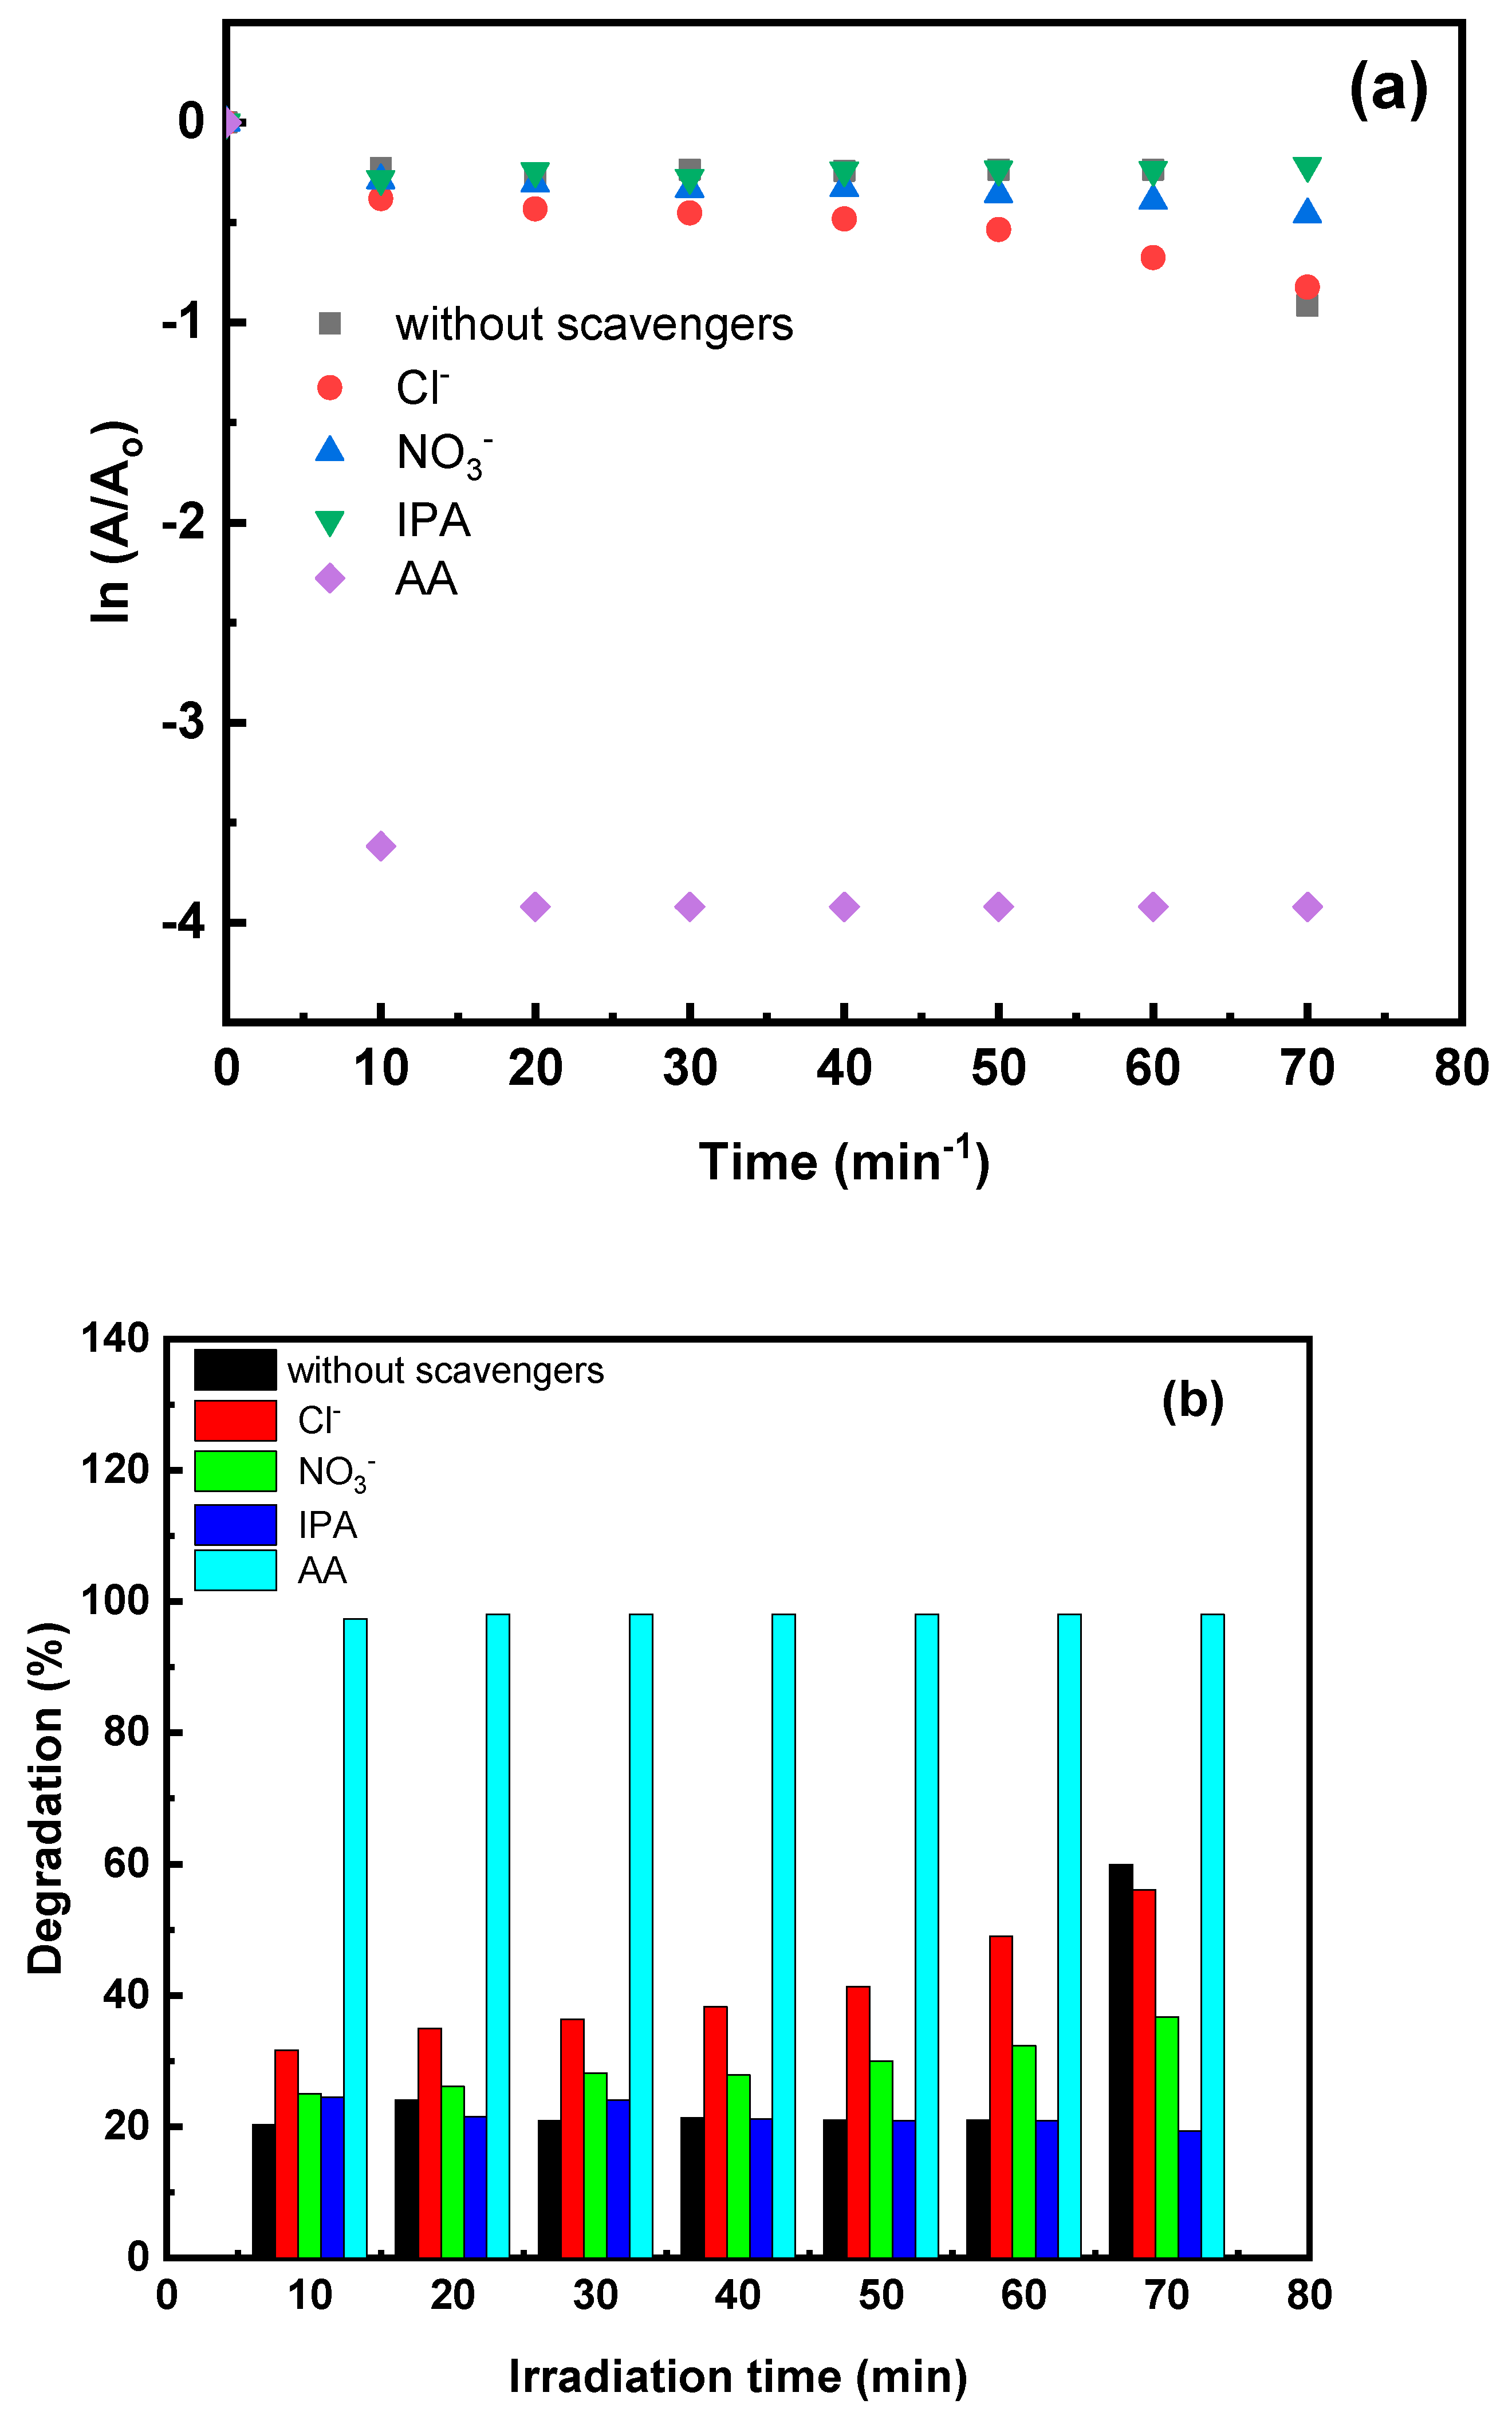
3.4.7. Influence of Radicals’ Scavengers on Photocatalytic Activity

The photocatalytic reaction occurs in 3 stages: absorption of light, generation and separation of electron-hole, and oxidation-reduction response on the photocatalyst’s surface. e and h+ are extremely recombined so, the trapping and transfer of surface charges are limited. Therefore, it is vital to eliminate the recombination of surface charge and promote charge transfer to the surface-active sites to boost the carriers’ dynamics and photocatalytic activity. There have thus been significant attempts to increase the effectiveness of photocatalysts [21].
The scavenging of active characters responsible for photodegradation in the presence of 7.5% Nd2O3 doped CuO nanoparticle is examined as demonstrated in Figure 11a. The scavengers applied such as NaCl for h+, NaNO3 for e, IPA for OH. and Ascorbic acid for O 2 . . From the data shown in Figure 11b, the use of NaCl, NaNO3, IPA, and Ascorbic acid as scavengers is responsible for eliminating MB contaminants of around 56, 36.7, 19.4, and 98 percent. The most efficient agent in eliminating pollutants may be regarded as hydroxy radicals. Sahar Zinatloo et al. [38] reported that in the presence of Nd2O3-SiO2, hydroxyl radicals were the most efficient agent for the degradation of methyl violet.

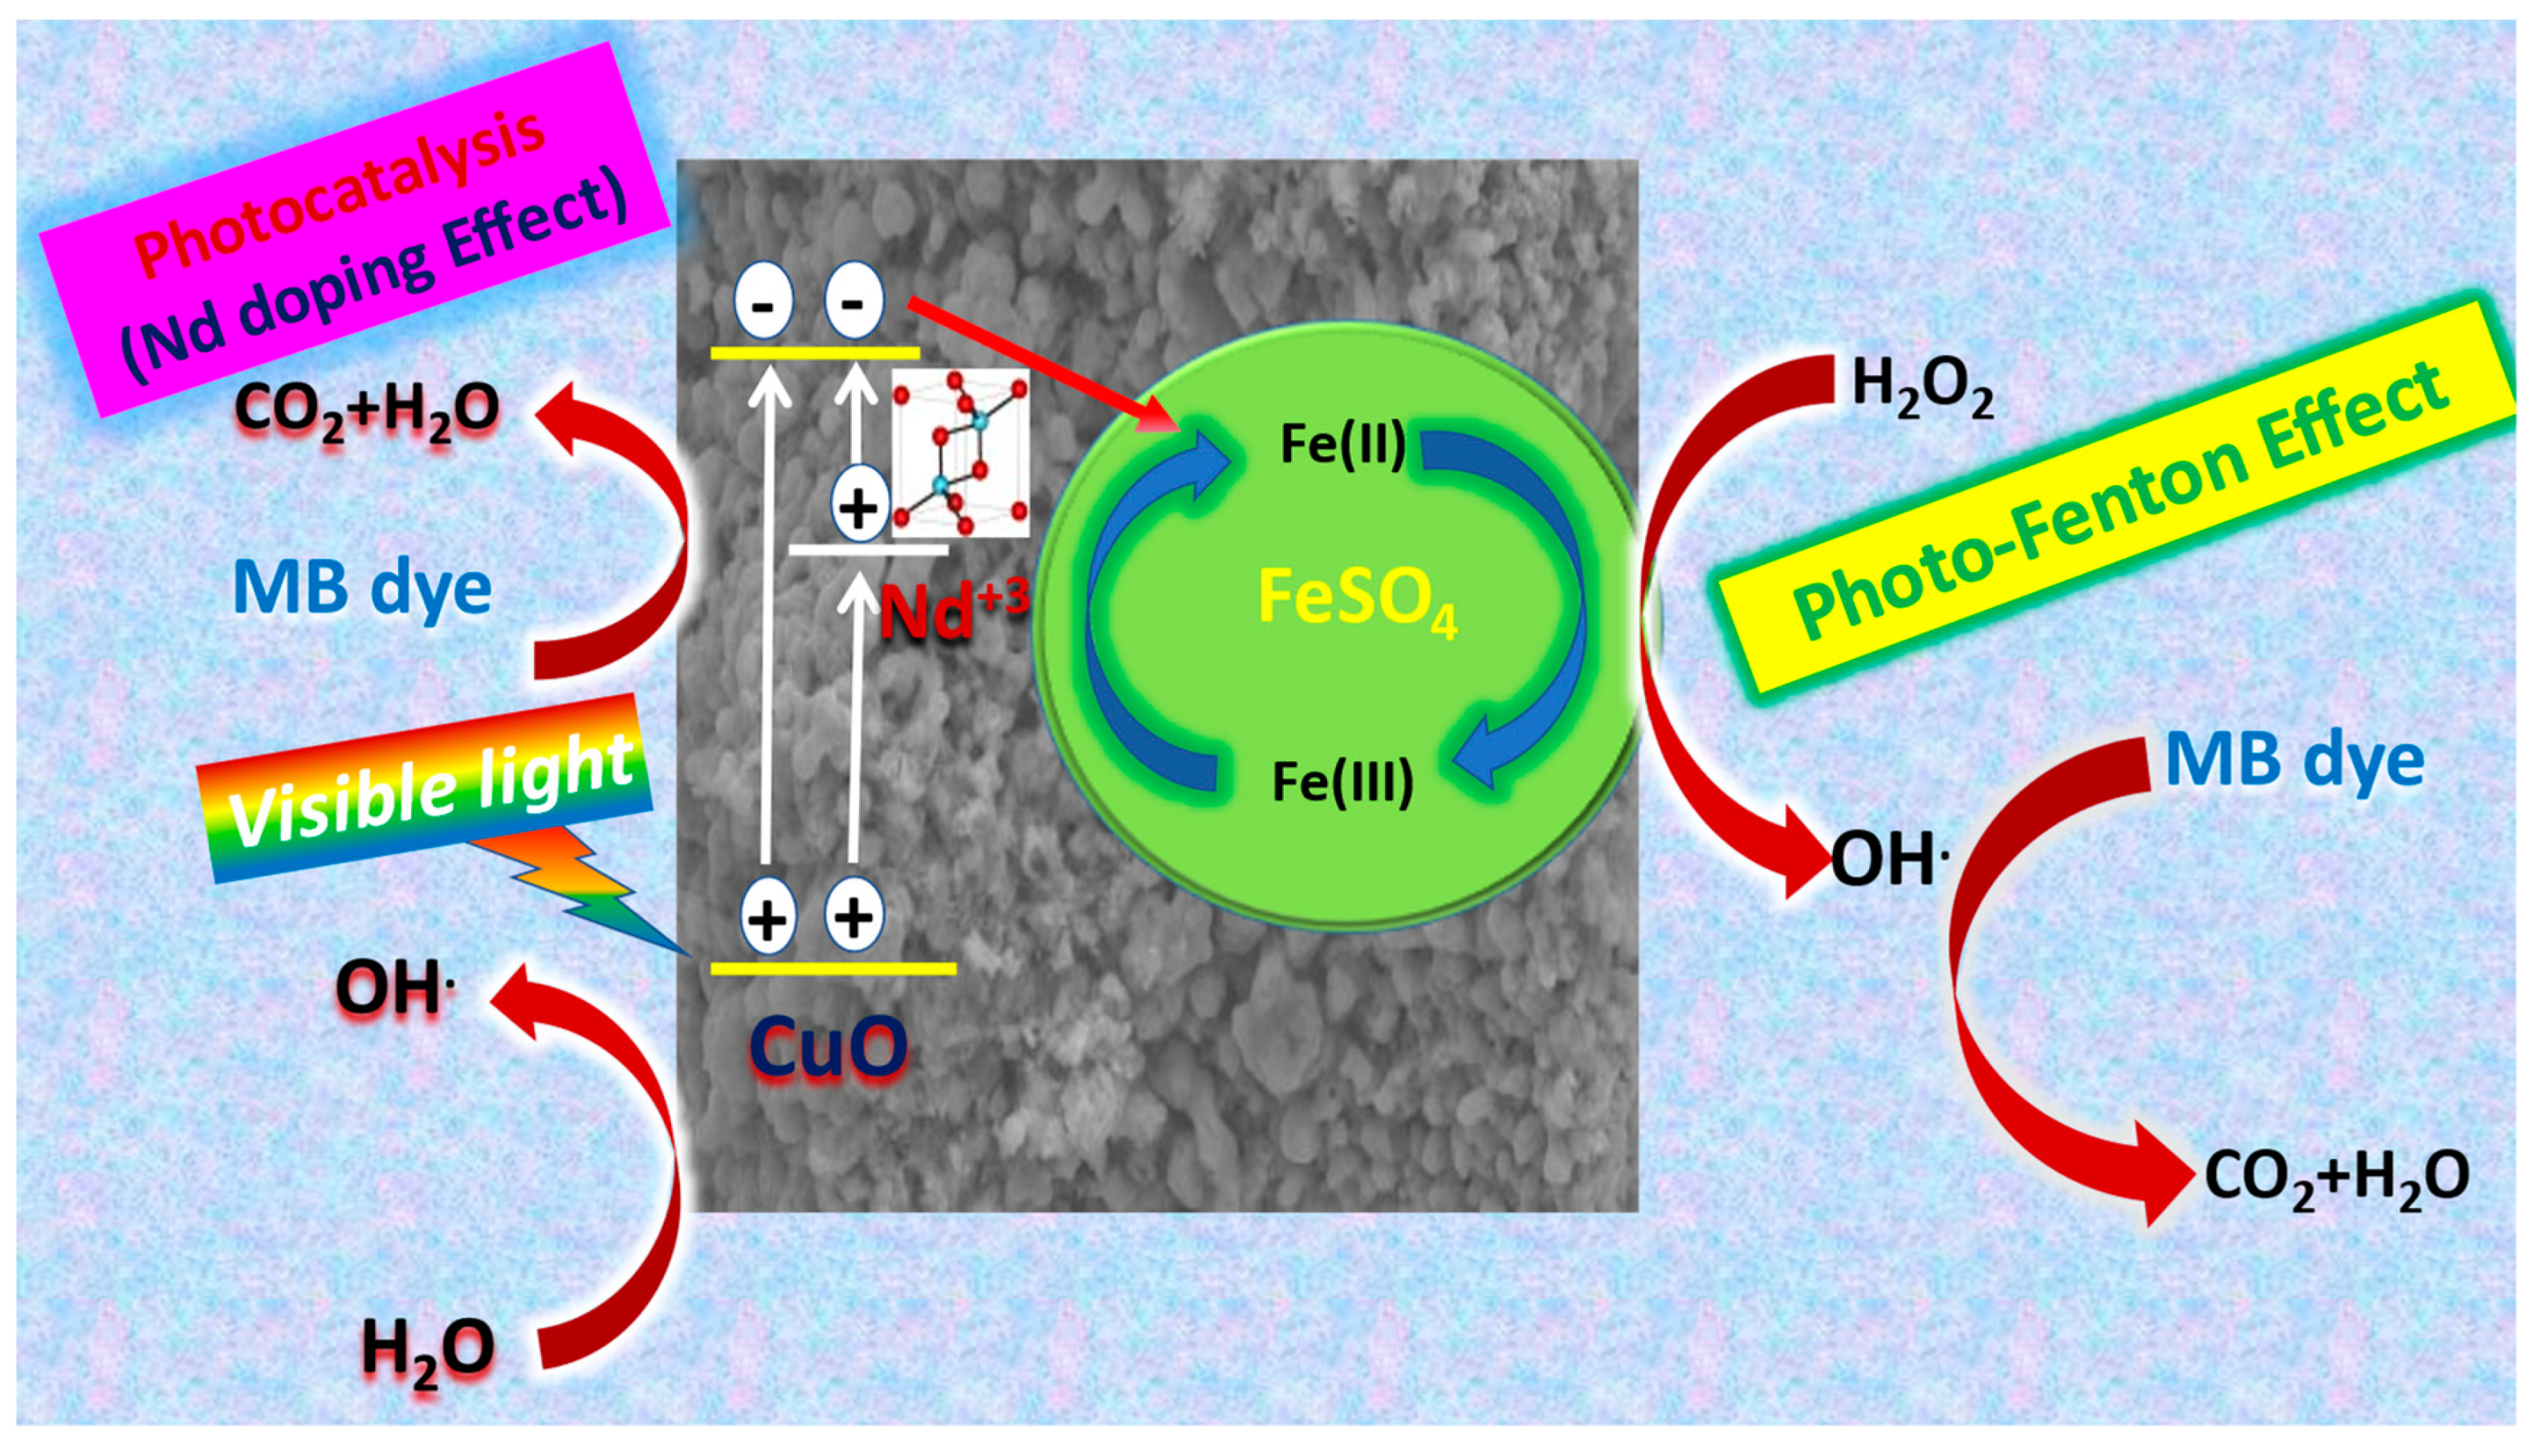
3.4.8. Mechanism of Photocatalysis for Nd2O3 Doped CuO Nanostructured

Photocatalysis and the photo-Fenton procedure are responsible for MB degradation. During the reaction produced hydroxyl radicals that are represented in Scheme 4. After irradiation, an electron has been excited, and holes are generated to react with H2O and dissolved O2, producing OH . radicals that cause MB degradation [39,40]. The proposed degradation process for MB pollutants can be represented as:
MB + h υ MB   ( e + h + ) ,
h + + H 2 O OH . + H + ,  
2 h + + 2 H 2 O H 2 O 2 + 2 H +
H 2 O 2 2 OH . ,
e + O 2   O 2 . ,
O 2 . + H 2 O + H + H 2 O 2 + O 2 ,  
H 2 O 2 2 OH . ,
OH . + MB   contaminant   Degradation   products ,  

4. Conclusions

The combustion method was applied to synthesize pure CuO, and different concentrations of Nd2O3 incorporated CuO nanocomposites. The addition of neodymium to CuO improved its structural and morphological characteristics and improved the photocatalytic activities for the apparent photodegradation of MB dye. The crystallinity of the synthesized samples was shown through XRD analysis. The first phase’s average crystallite domain size ranges from 22.081 to 30.109 nm, while the second phase ranges from 27.180 to 36.744 nm. In addition, ε and δ have been calculated. SEM investigation indicated that particles are aggregated homogenously with almost spherical forms. ζav-potentials data-enhanced via rising Nd2O3 content up to 7.5% Nd2O3 doped CuO nanoparticle reaching ~27.0 mV with the conductivity of 0.024 mS/cm. The as-prepared 7.5% Nd2O3 doped CuO nanoparticle exhibits the optimum photocatalytic efficiency comes 90.8% within 80 min with a degradation rate of 0.02274 min−1 for MB dye. In comparison, the photocatalytic efficiency was 87% within 80 min with the rate of 0.01683 min−1 for MB by CuO.
The degradation efficiency enhances at pH 10 to be 99% with a rate of degradation of 0.082 min−1. The stability of the Nd2O3 doped CuO nanoparticle has been examined through recycling. The results of trapping experiments were indications that the hydroxyl radicals are responsible for the elimination of pollutants. Finally, Nd2O3-doped CuO nanostructured was a promising material under visible light to treat vast quantities of wastewater.

Author Contributions

All authors contributed to the study conception and design. Material preparation, data collection and analysis were performed by Conceptualization, F.E.-S., M.S.A.H. and M.I.M.; methodology, V.G., T.H.A. and H.Y.Z.; software, I.S.Y., H.H.H. and M.S.A.-w.; validation, M.S., S.V. and M.A.I.; formal analysis, F.E.-S., M.S.A.H. and M.I.M.; investigation, V.G., T.H.A. and H.Y.Z.; resources, V.G., T.H.A. and H.Y.Z.; data curation, V.G., T.H.A. and H.Y.Z.; writing—original draft preparation, F.E.-S., M.S.A.H., V.G. and M.I.M.; writing—review and editing, I.S.Y., H.H.H. and M.S.A.-w.; visualization, I.S.Y., H.H.H. and M.S.A.-w.; supervision, M.S., S.V. and M.A.I.; project administration, V.G.; funding acquisition, V.G. All authors have read and agreed to the published version of the manuscript.

Funding

The authors extend their appreciation to the Deputyship for Research & Innovation, Ministry of Education in Saudi Arabia for funding this research work the project number: IFP-KKU-2020/6.

Informed Consent Statement

Not applicable.

Data Availability Statement

The data supporting this study’s findings are available from the corresponding author upon reasonable request.

Conflicts of Interest

The authors declare no conflict of interest.

References

  1. Ansari, M.O.; Khan, M.M.; Ansari, S.A.; Cho, M.H. Polythiophene nanocomposites for photodegradation applications: Past, present and future. J. Saudi Chem. Soc. 2015, 19, 494–504. [Google Scholar] [CrossRef] [Green Version]
  2. Kumar, M.; Sivakumar, V.; Tamilarasan, R. Adsorption of Victoria blue by carbon/Ba/Alignate beads: Kinetics, Thermodynamics and Isotherm studies. Carbohydr. Polym. 2013, 98, 505–513. [Google Scholar] [CrossRef] [PubMed]
  3. Radhakrishnan, A.; Rejani, P.; Bhaskaran, B. CuO/polypyrrole nanocomposites as a marker of toxic lead ions for ecological remediation in contrast with CuO and polypyrrole. Main Group Met. Chem. 2015, 38, 133–143. [Google Scholar] [CrossRef]
  4. Vinuth, M.; Bhojya Naik, H.S.; Mahadevaswamy, M.M.; Prabhakara, M.C. Environmentally benign Fe(III)– montmorillonite for rapid adsorption of methylene blue dye in aqueous medium under ambient conditions. Fash. Text. 2017, 4, 8. [Google Scholar] [CrossRef] [Green Version]
  5. Pourmortazavi, S.M.; Rahimi-Nasrabadi, M.; Aghazadeh, M.; Ganjali, M.R.; Karimi, M.S.; Norouzi, P. Synthesis, characterization and photocatalytic activity of neodymium carbonate and neodymium oxide nanoparticles. J. Mol. Struct. 2017, 1150, 411–418. [Google Scholar] [CrossRef]
  6. Chennakesavulu, K.; Madhusudhana Reddy, M.; Ramanjaneya Reddy, G.; Rabel, A.M.; Brijitta, J.; Vinita, V. Synthesis, Characterization and Photo catalytic studies of the composites by Tantalum oxide and Zinc oxide Nanorods. J. Mol. Struct. 2015, 1091, 49–56. [Google Scholar] [CrossRef]
  7. Nagaveni, K.; Sivalingam, G.; Hegde, M.S.; Madras, G. Solar photocatalytic degradation of dyes high activity of combustion synthesized Nano-TiO2. Appl. Catal. B Environ. 2004, 48, 83–93. [Google Scholar] [CrossRef]
  8. Jamal, N.; Radhakrishnan, A.; Raghavan, R.; Bhaskaran, B. Efficient photocatalytic degradation of organic dye from aqueous solutions over zinc oxide incorporated nanocellulose under visible light irradiation. Main Group Metal Chem. 2020, 43, 84–91. [Google Scholar] [CrossRef]
  9. Abhilasha, J.; Ashma, A.; Marazban, K. A greener approach for the degradation of dye methylene blue by organic additive catalysed photo-fenton process. J. Chil. Chem. Soc. 2016, 61, 3043–3048. [Google Scholar] [CrossRef] [Green Version]
  10. Muthuvel, A.; Jothibas, M.; Manoharan, C. Synthesis of copper oxide nanoparticles by chemical and biogenic methods: Photocatalytic degradation and in vitro antioxidant activity. Nanotechnol. Environ. Eng. 2020, 5, 14. [Google Scholar] [CrossRef]
  11. Arunkumar, B.; Johnson Jeyakumar, S.; Jothibas, M. A sol gel approach to the synthesis of CuO nanoparticles using Lantana camara leaf extract and their photo catalytic activity. Optik 2019, 183, 698–705. [Google Scholar] [CrossRef]
  12. Vinothkumar, P.; Manoharan, C.; Shanmugapriya, B.; Bououdina, M. Effect of reaction time on structural, morphological, optical and photocatalytic properties of copper oxide (CuO) nanostructures. J. Mater. Sci. Mater. Electron. 2019, 30, 6249–6262. [Google Scholar] [CrossRef]
  13. Lembang, M.S.; Yulizar, Y.; Sudirman, S.; Apriandanu, D.O.B. A facile method for green synthesis of Nd2O3 nanoparticles using aqueous extract of Terminalia catappa leaf. AIP Conf. Proc. 2018, 2023, 020093. [Google Scholar] [CrossRef]
  14. Hussien, M.S.A.; Mohammed, M.I.; Yahia, I.S. Flexible photocatalytic membrane based on CdS/PMMA polymeric nanocomposite films: Multifunctional materials. Environ. Sci. Pollut. Res. Int. 2020, 27, 45225–45237. [Google Scholar] [CrossRef] [PubMed]
  15. Sarma, G.K.; Khan, A.; El-Toni, A.M.; Rashid, M.H. Shape-tunable CuO-Nd(OH)3 nanocomposites with excellent adsorption capacity in organic dye removal and regeneration of spent adsorbent to reduce secondary waste. J. Hazard. Mater. 2019, 380, 120838. [Google Scholar] [CrossRef]
  16. Shubha, L.N.; Kalpana, M.; Madhusudana Rao, P. Study of Chemically Synthesized Polyaniline/CopperOxide Nanocomposites. In Proceedings of the National Seminar on Frontiers in Chemical Research and Analysis, Hyderabad, India, 24–25 July 2015; pp. 1–4. [Google Scholar]
  17. Arunpandian, M.; Selvakumar, K.; Nagarajan, E.R.; Arunachalam, S. Ag/Nd2O3-Zno Nanocomposite: Visible Active Efficient Photocatalytic Degradation of Methylene Blue and Its Antibacterial Activity. Int. J. Innov. Technol. Explor. Eng. 2019, 9, 743–747. [Google Scholar] [CrossRef]
  18. Khan, Z.R.; Shkir, M.; Ganesh, V.; Yahia, I.S.; AlFaify, S. A facile synthesis of Au-nanoparticles decorated PbI2 single crystalline nanosheets for optoelectronic device applications. Sci. Rep. 2018, 8, 13806. [Google Scholar] [CrossRef] [Green Version]
  19. Zinatloo-Ajabshir, S.; Mortazavi-Derazkola, S.; Salavati-Niasari, M. Nd2O3 nanostructures: Simple synthesis, characterization and its photocatalytic degradation of methylene blue. J. Mol. Liq. 2017, 234, 430–436. [Google Scholar] [CrossRef] [Green Version]
  20. Hamdy, M.S.; Chandekar, K.V.; Shkir, M.; AlFaify, S.; Ibrahim, E.H.; Ahmad, Z.; Kilany, M.; Al-Shehri, B.M.; Al-Namshah, K.S. Novel Mg@ZnO nanoparticles synthesized by facile one-step combustion route for anti-microbial, cytotoxicity and photocatalysis applications. J. Nanostruct. Chem. 2021, 11, 147–163. [Google Scholar] [CrossRef]
  21. Hussien, M.S.A. Facile Synthesis of Nanostructured Mn-Doped Ag3PO4 for Visible Photodegradation of Emerging Pharmaceutical Contaminants: Streptomycin Photodegradation. J. Inorg. Organomet. Polym. Mater. 2021, 31, 945–959. [Google Scholar] [CrossRef]
  22. Davarpanah, S.J.; Karimian, R.; Goodarzi, V.; Piri, F. Synthesis of Copper (II) Oxide (CuO) Nanoparticles and Its Application as Gas Sensor. J. Appl. Biotechnol. Rep. 2015, 2, 329–332. [Google Scholar]
  23. Eslami, A.; Juibari, N.M.; Hosseini, S.G.; Abbasi, M. Synthesis and Characterization of CuO Nanoparticles by the Chemical Liquid Deposition Method and Investigation of Its Catalytic Effect on the Thermal Decomposition of Ammonium Perchlorate. Cent. Eur. J. Energetic Mater. 2017, 14, 152–168. [Google Scholar] [CrossRef]
  24. Hussien, M.S.; Yahia, I. Fabrication progress of selective and durable Ni2+-doped Ag3PO4 for visible-light degradation of various textile dyes. J. Photochem. Photobiol. A Chem. 2019, 368, 210–218. [Google Scholar] [CrossRef]
  25. Omima Adly, M.I.; Hussien, M.S.A. Photo-Removal of RB5 from Textile Industrial Waste by Zn (II) Complex Nano-Powder. J. Pharm. Appl. Chem. 2018, 4, 33–40. [Google Scholar] [CrossRef]
  26. Chauhan, M.; Kaur, N.; Bansal, P.; Kumar, R.; Srinivasan, S.; Chaudhary, G.R. Proficient Photocatalytic and Sonocatalytic Degradation of Organic Pollutants Using CuO Nanoparticles. J. Nanomater. 2020, 2020, 6123178. [Google Scholar] [CrossRef]
  27. Sohrabnezhad, S.; Takas, M.E. Synthesis and characterization of porous clay heterostructure intercalated with CuO nanoparticles as a visible light-driven photocatalyst. J. Iran. Chem. Soc. 2019, 16, 45–55. [Google Scholar] [CrossRef]
  28. Fenton, H. Oxidation of tartaric acid in the presence of iron. J. Chem. Soc. 1894, 65, 899–910. [Google Scholar]
  29. Haber, F.; Willstätter, R. Unparrigkit und radikalatten im reaktionsmechanismus organischer und enzymatischer vorgag. Chem. Europ. J. Inorg. Chem. 1931, 64, 2844–2856. [Google Scholar] [CrossRef]
  30. Arunpandian, M.; Selvakumar, K.; Raja, A.; Rajasekaran, P.; Thiruppathi, M.; Nagarajan, E.R.; Arunachalam, S. Fabrication of novel Nd2O3/ZnO-GO nanocomposite: An efficient photocatalyst for the degradation of organic pollutants. Colloids Surf. A 2019, 567, 213–227. [Google Scholar] [CrossRef]
  31. Chandran, D.; Nair, L.S.; Balachandran, S.; Babu, K.R.; Deepa, M. Band gap narrowing and photocatalytic studies of Nd3+ ion-doped SnO2 nanoparticles using solar energy. Bull. Mater. Sci. 2016, 39, 27–33. [Google Scholar]
  32. Samuel Oppong, O.B.; William Anku, W.; Sudheesh Shukla, K.; Penny Govender, P. Synthesis and characterisation of neodymium doped zinc oxide–graphene oxide nanocomposite as a highly efficient photocatalyst for enhanced degradation of indigo carmine in water under simulated solar light. Res. Chem. Intermed. 2017, 43, 481–501. [Google Scholar] [CrossRef]
  33. Oppong, S.O.-B.; Anku, W.W.; Shukla, S.K.; Agorku, E.S.; Govender, P.P. Photocatalytic degradation of indigo carmine using Nd-doped TiO2-decorated graphene oxide nanocomposites. J. Sol-Gel Sci. Technol. 2016, 80, 38–49. [Google Scholar] [CrossRef]
  34. Alam, U.; Khan, A.; Ali, D.; Bahnemann, D.; Muneer, M. Comparative photocatalytic activity of sol–gel derived rare earth metal (La, Nd, Sm and Dy)-doped ZnO photocatalysts for degradation of dyes. RSC Adv. 2018, 8, 17582–17594. [Google Scholar] [CrossRef] [Green Version]
  35. Sonali Chaudhari, P.; Anjali Bodade, B.; Prashant Jolhe, D.; Satish Meshram, P.; Gajanan Chaudhari, N. PEG-200 Assisted Sonochemical Synthesis of Cerium(Ce3+) Doped Copper Oxide (CuO) Nano-Composites and Their Photocatalytic Activities. Am. J. Mater. Synth. Proc. 2017, 2, 97–102. [Google Scholar] [CrossRef] [Green Version]
  36. Shao, X.; Pan, F.; Zheng, L.; Zhang, R.; Zhang, W.-Y. Nd -doped TiO2-C hybrid aerogels and their photocatalytic properties. New Carb. Mater. 2018, 33, 116–124. [Google Scholar] [CrossRef]
  37. Reda Mohamed, M.; Adel Ismail, A.; Mohammad Kadi, W.; Ajayb Alresheedi, S.; Ibraheem Mkhalid, A. Photocatalytic performance mesoporous Nd2O3 modified ZnO nanoparticles with enhanced degradation of tetracycline. Catal. Today 2020, 380, 259–267. [Google Scholar] [CrossRef]
  38. Zinatloo-Ajabshir, S.; Derazkolab, S.M.; Niasarib, M.S. Nd2O3-SiO2 nanocomposites: A simple sonochemical preparation, characterization and photocatalytic activity. Ultrason. Sonochem. 2018, 42, 171–182. [Google Scholar] [CrossRef]
  39. Li, K.; Lu, X.; Zhang, Y.; Liu, K.; Huanga, Y.; Liu, H. Bi3TaO7/Ti3C2 heterojunctions for enhanced photocatalytic removal of water-borne contaminant. Environ. Res. 2020, 185, 109409. [Google Scholar] [CrossRef]
  40. Huang, Y.; Xu, H.; Yang, H.; Lin, Y.; Liu, H.; Tong, Y. Efficient Charges Separation Using Advanced BiOI-Based Hollow Spheres Decorated with Palladium and Manganese Dioxide Nanoparticles. ACS Sustain. Chem. Eng. 2018, 6, 2751–2757. [Google Scholar] [CrossRef]
Scheme 1. Chemical structure of MB dye.
Nanomaterials 12 01060 sch001
Scheme 2. Schematic diagram of the synthesis of Nd2O3 doped CuO nanocomposites.
Nanomaterials 12 01060 sch002
Figure 1. Photoreactor design and operation in NLEBA, Ain Shams University, Cairo, Egypt.
Nanomaterials 12 01060 g001
Figure 2. X-ray diffraction patterns for pure CuO and Nd2O3 doped CuO nanostructured samples.
Nanomaterials 12 01060 g002
Figure 3. (AF): FE-SEM images of pure CuO and Nd2O3 doped CuO nanostructured samples, (G) EDAX spectrum of 7.5% Nd2O3 doped CuO nanostructured sample.
Nanomaterials 12 01060 g003
Figure 4. (a) Average zeta potential values, (b) conductivity of the samples.
Nanomaterials 12 01060 g004
Figure 5. Absorption spectra of MB dye under visible light irradiation with pure CuO and five different concentrations of nanostructured Nd-doping CuO.
Nanomaterials 12 01060 g005aNanomaterials 12 01060 g005b
Figure 6. Rate constant values of MB dye photodegradation reaction in the presence of pure CuO and Nd2O3 doped CuO NPs with different concentrations of Nd2O3.
Nanomaterials 12 01060 g006
Figure 7. The k versus H2O2 concentration of MB dye by 0.1 g of 7.5% Nd2O3 doped CuO NPs under visible irradiation.
Nanomaterials 12 01060 g007
Figure 8. The different pH concentrations using 0.1 g of 7.5% Nd2O3 doped CuO nanoparticle in the presence of MB dye under visible irradiation, (a) Kinetics (b) The rate constant.
Nanomaterials 12 01060 g008aNanomaterials 12 01060 g008b
Scheme 3. Role of zero-point charge of CuO NPs on the degradation of cationic dye.
Nanomaterials 12 01060 sch003
Figure 9. The rate constant Photo-Fenton, (a) with and (b) without 7.5% Nd2O3 doped CuO nanocomposites.
Nanomaterials 12 01060 g009
Figure 10. Recycling of 7.5% of nanostructured Nd2O3 doped CuO.
Nanomaterials 12 01060 g010
Figure 11. Trapping experiments of active species for the MB photocatalytic reaction using 7.5% Nd2O3 doped CuO under visible light irradiation using 200 mM scavengers, (a) kinetics, (b) Degradation efficiency.
Nanomaterials 12 01060 g011
Scheme 4. A suggested mechanism for the photocatalysis by (Nd2O3 doped CuO catalyst)and photo-Fenton by (FeSO4) degradation of MB.
Nanomaterials 12 01060 sch004
Table 1. The values of diffraction peaks of the as-prepared NPs.
SampleLinePosition, 2θ Intensity
(Counts)
LinePosition, 2θ Intensity
(Counts)
Pure CuO135.6901558.3152149
1% Nd2O3-doped CuO784119
2.5% Nd2O3-doped CuO58088
5% Nd2O3-doped CuO50764
7.5% Nd2O3-doped CuO36451
10% Nd2O3-doped CuO28640
Pure CuO238.7982661.6245
1% Nd2O3-doped CuO803197
2.5% Nd2O3-doped CuO624148
5% Nd2O3-doped CuO507121
7.5% Nd2O3-doped CuO35076
10% Nd2O3-doped CuO28167
Pure CuO348.8311766.3211
1% Nd2O3-doped CuO241152
2.5% Nd2O3-doped CuO182116
5% Nd2O3-doped CuO15690
7.5% Nd2O3-doped CuO9641
10% Nd2O3-doped CuO7253
Pure CuO453.5104868.0203
1% Nd2O3-doped CuO71158
2.5% Nd2O3-doped CuO47109
5% Nd2O3-doped CuO3277
7.5% Nd2O3-doped CuO2554
10% Nd2O3-doped CuO1052
Table 2. The computed mean values of the grain size, dislocation, and strain from the XRD spectra, for all prepared Nd2O3-CuO nanocomposites.
SamplesPhasesMean Values of the Grain Size, (nm)Mean Values of Dislocation Density, (nm)2Mean Values of Lattice Strain
Pure CuOPhase1, Pure CuO29.6871.262 × 10−31.213 × 10⁻³
1% Nd-doped CuOPhase1, Pure CuO22.0892.089 × 10−31.579 × 10⁻³
Phase 2, Nd2O336.7441.187 × 10−31.124 × 10⁻³
2.5% Nd-doped CuOPhase1, Pure CuO30.9691.582 × 10−31.305 × 10⁻³
Phase 2, Nd2O327.1801.636 × 10−31.356 × 10⁻³
5% Nd-doped CuOPhase1, Pure CuO26.8091.679 × 10−31.384 × 10⁻³
Phase 2, Nd2O335.5579.307 × 10−31.033 × 10⁻³
7.5% Nd-doped CuOPhase 1, Pure CuO30.1091.439 × 10−31.267 × 10⁻³
Phase 2, Nd2O330.1541.315 × 10−31.218 × 10⁻³
10% Nd-doped CuOPhase1, Pure CuO27.2952.141 × 10−31.522 × 10⁻³
Phase 2, Nd2O336.6091.518 × 10−31.208 × 10⁻³
Table 3. The average particle size of all prepared samples.
SampleParticle Size Average Value (nm)
CuO19
1%Nd2O322
2.5%Nd2O339
5%Nd2O336
7.5%Nd2O317
10%Nd2O326
Table 4. The rate constants (min−1) for all photodegradation.
SamplesK, (min−1)
Pure CuO0.01683
1% Nd2O3-CuO0.01743
2.5% Nd2O3-CuO0.02122
5% Nd2O3-CuO0.01672
7.5% Nd2O3-CuO0.02274
10% Nd2O3-CuO0.01935
7.5% Nd2O3-CuO, 1 mL H2O20.00304
7.5% Nd2O3-CuO, 2 mL H2O20.00313
7.5% Nd2O3-CuO, 3 mL H2O20.00312
7.5% Nd2O3-CuO, 4 mL H2O20.00697
7.5% Nd2O3-CuO, 5 mL H2O20.0114
7.5% Nd2O3-CuO, 2 mL H2O2, pH = 20.00161
7.5% Nd2O3-CuO, 2 mL H2O2, pH = 40.00115
7.5% Nd2O3-CuO, 2 mL H2O2, pH = 60.03666
7.5% Nd2O3-CuO, 2 mL H2O2, pH = 80.05734
7.5% Nd2O3-CuO, 2 mL H2O2, pH = 100.08209
Table 5. Comparison of photocatalytic degradation of MB and different dyes in the presence of Nd2O3-doped metal oxide with other previous work samples.
PhotocatalystsMethod of PreparationOrganic SolutionIrradiation TimeLamp Source% Degradationk, (min−1)Refs.
7.5% Nd-doped
CuO
CombustionMB80 minVisible light90.8%0.0227Present work
7.5% Nd-doped
CuO at pH 4
CombustionMB80 minVisible light99%0.082Present work
Nd2O3-doped ZnOHydrothermal
method
MB60 minUV-light96%0.3145[30]
Ag/Nd2O3-ZnOHydrothermal
method
MB30 minVisible-light98.12%-------[17]
Nd2O3-doped SnO2Sol gel methodMB4 hVisible-light93.1%0.615 h−1[31]
Nd2O3-doped ZnOCo-precipitationindigo carmine210 minVisible-light74%3.87 × 10⁻³[32]
Nd2O3-ZnO-GO
(0.3% Nd)
Co-precipitationindigo carmine210 minVisible-light95%1.36 × 10⁻²[32]
Nd–TiO2–GO
(0.6% Nd)
Sol gel methodindigo carmine180 minVisible-light92%13.42 × 10⁻³[33]
Nd-doped ZnOSol-gel methodMB25 minUV-light98%-------[34]
3 mol%Ce3+-doped CuOSonochemical
method
MB180 minVisible-light98%-------[35]
Nd-TiO2-CSol-gel and impregnation methodMB160 minUV-light100%--------[36]
Nd-doped ZnOsol-gel methodTC120 minVisible-light100%--------[37]
CuOMicrowaveVB(10−5 M)
DR(10−5 M)
-------UV-visible
irradiation
and US radiations
100%0.09861
0.10587
[26]
Publisher’s Note: MDPI stays neutral with regard to jurisdictional claims in published maps and institutional affiliations.

