
Potential of 3D Hierarchical Porous TiO2-Graphene Aerogel (TiO2-GA) as Electrocatalyst Support for Direct Methanol Fuel Cells

Abstract
:1. Introduction
2. Experimental Section
2.1. Materials
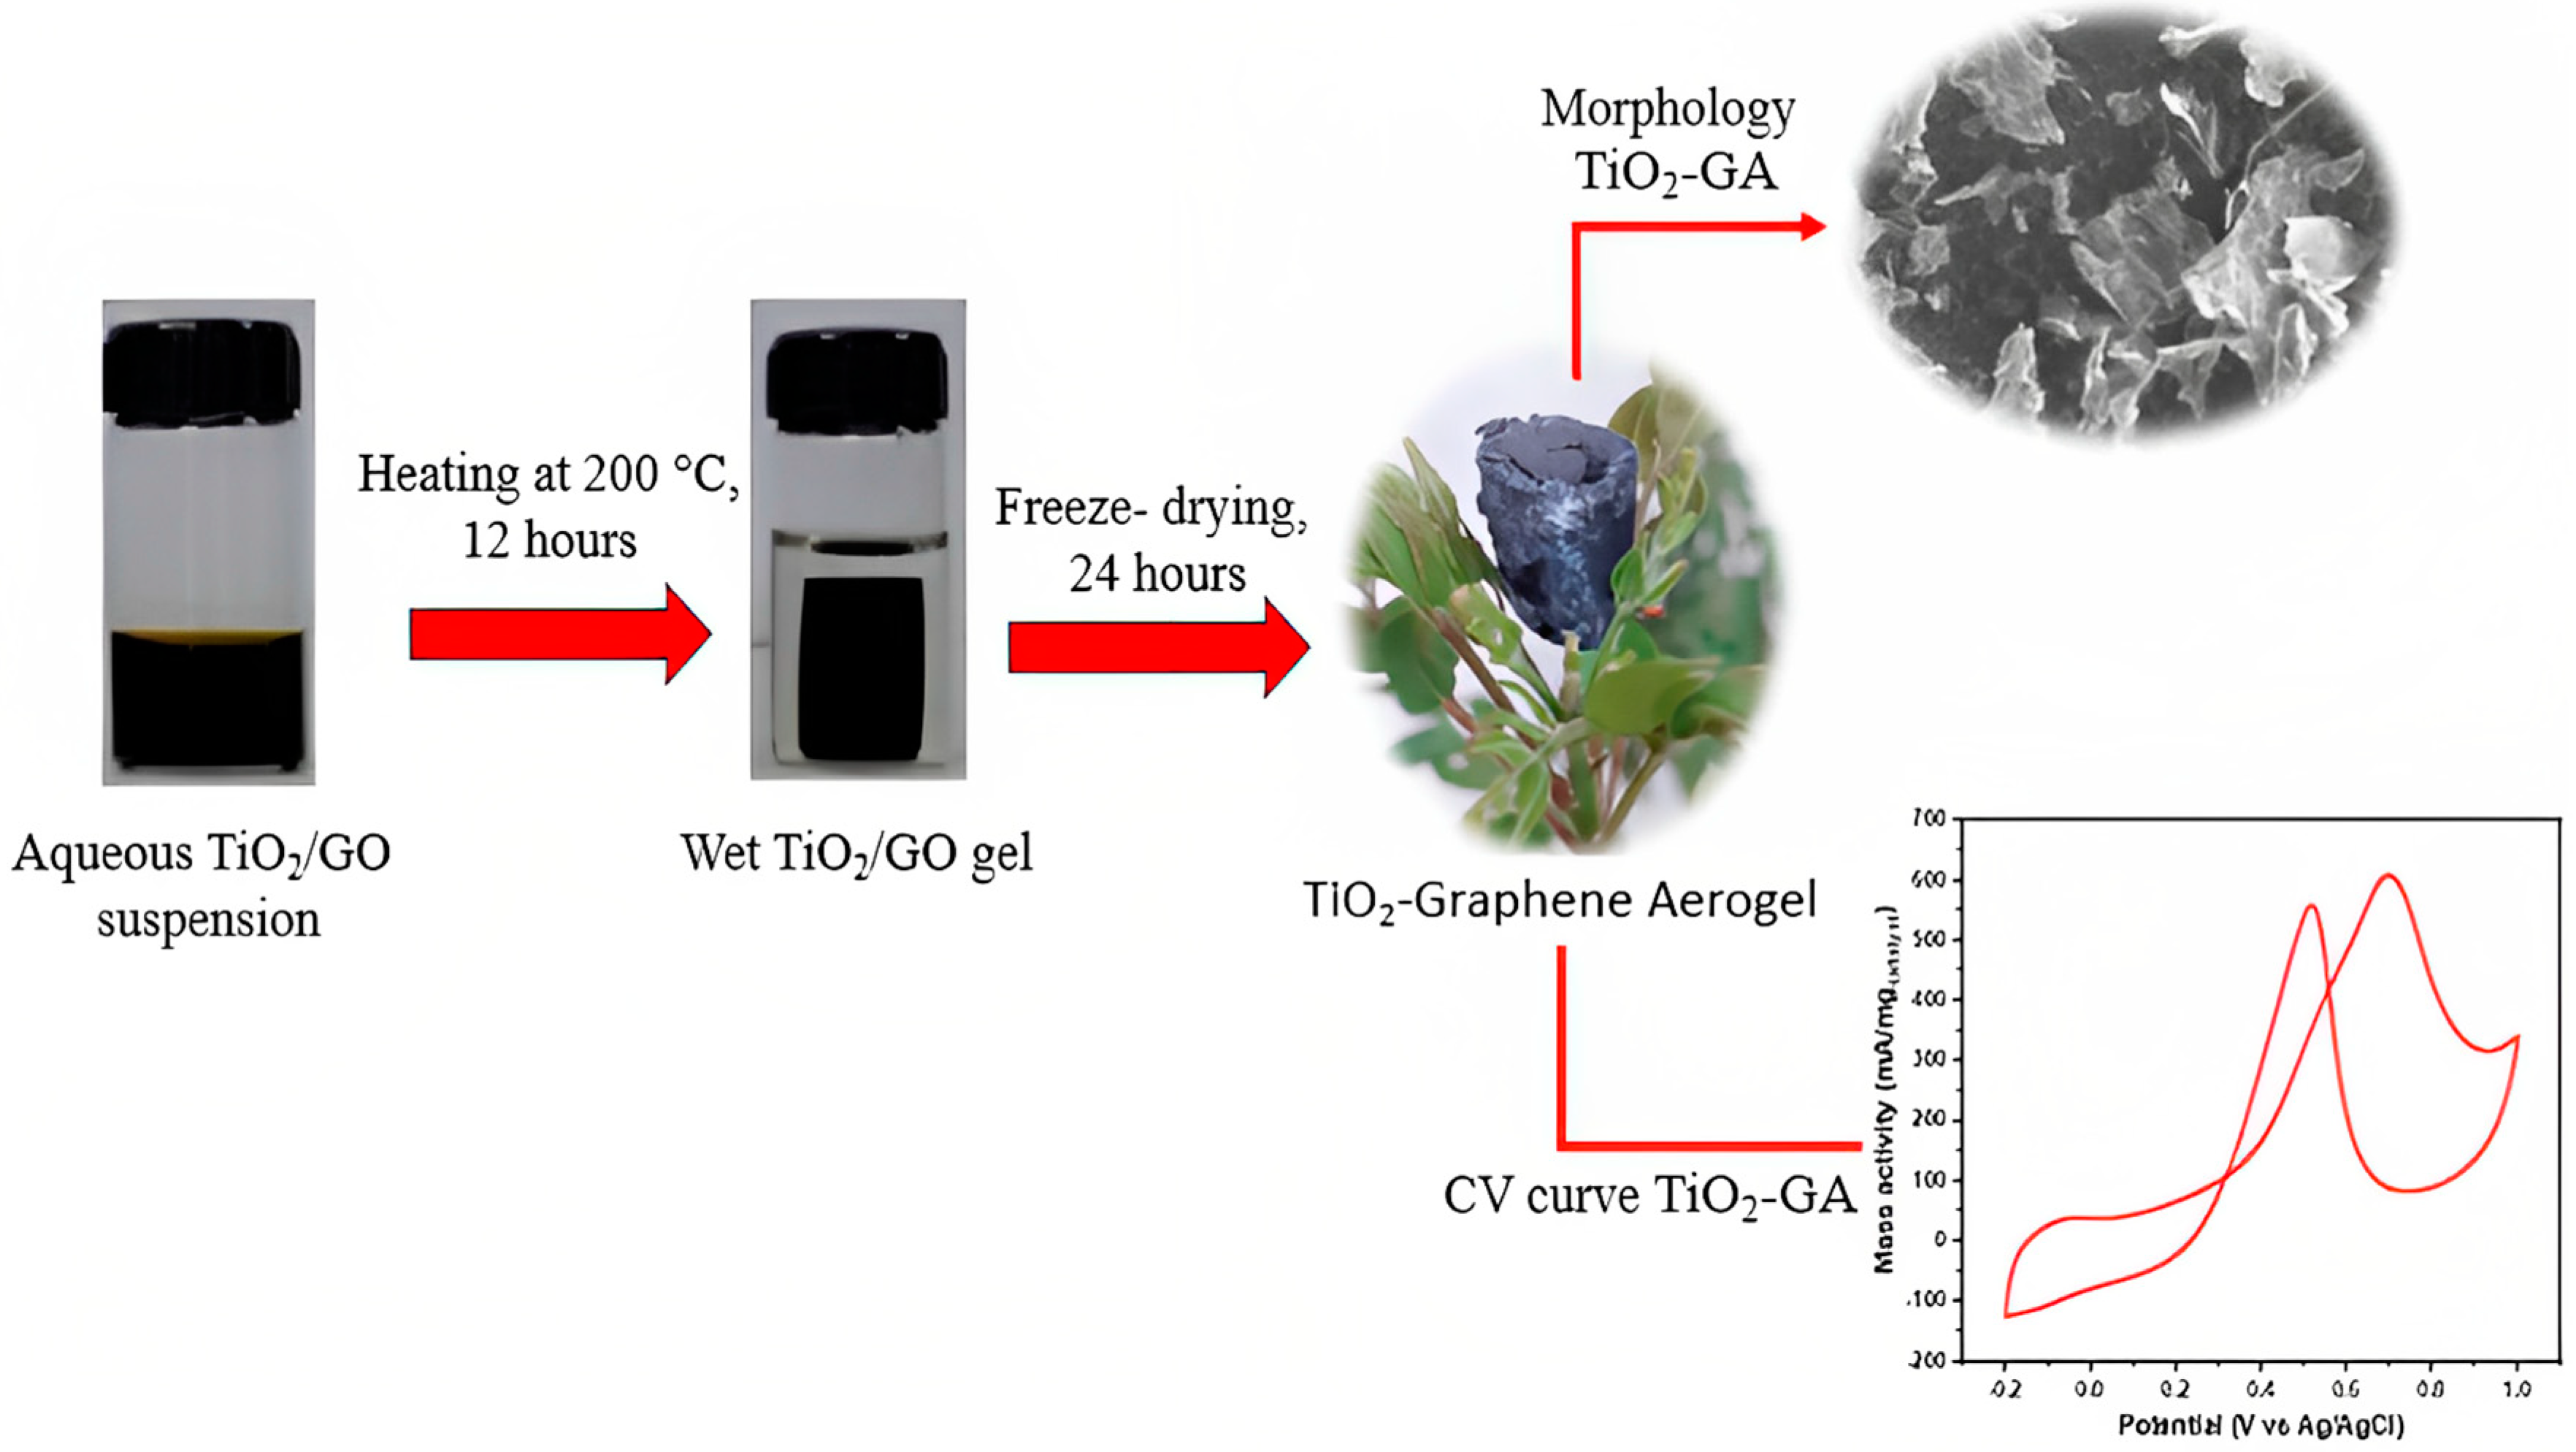
2.2. Preparation of TiO2-GA Composite
2.3. Preparation for the Synthesis of PtRu/TiO2-GA Catalyst
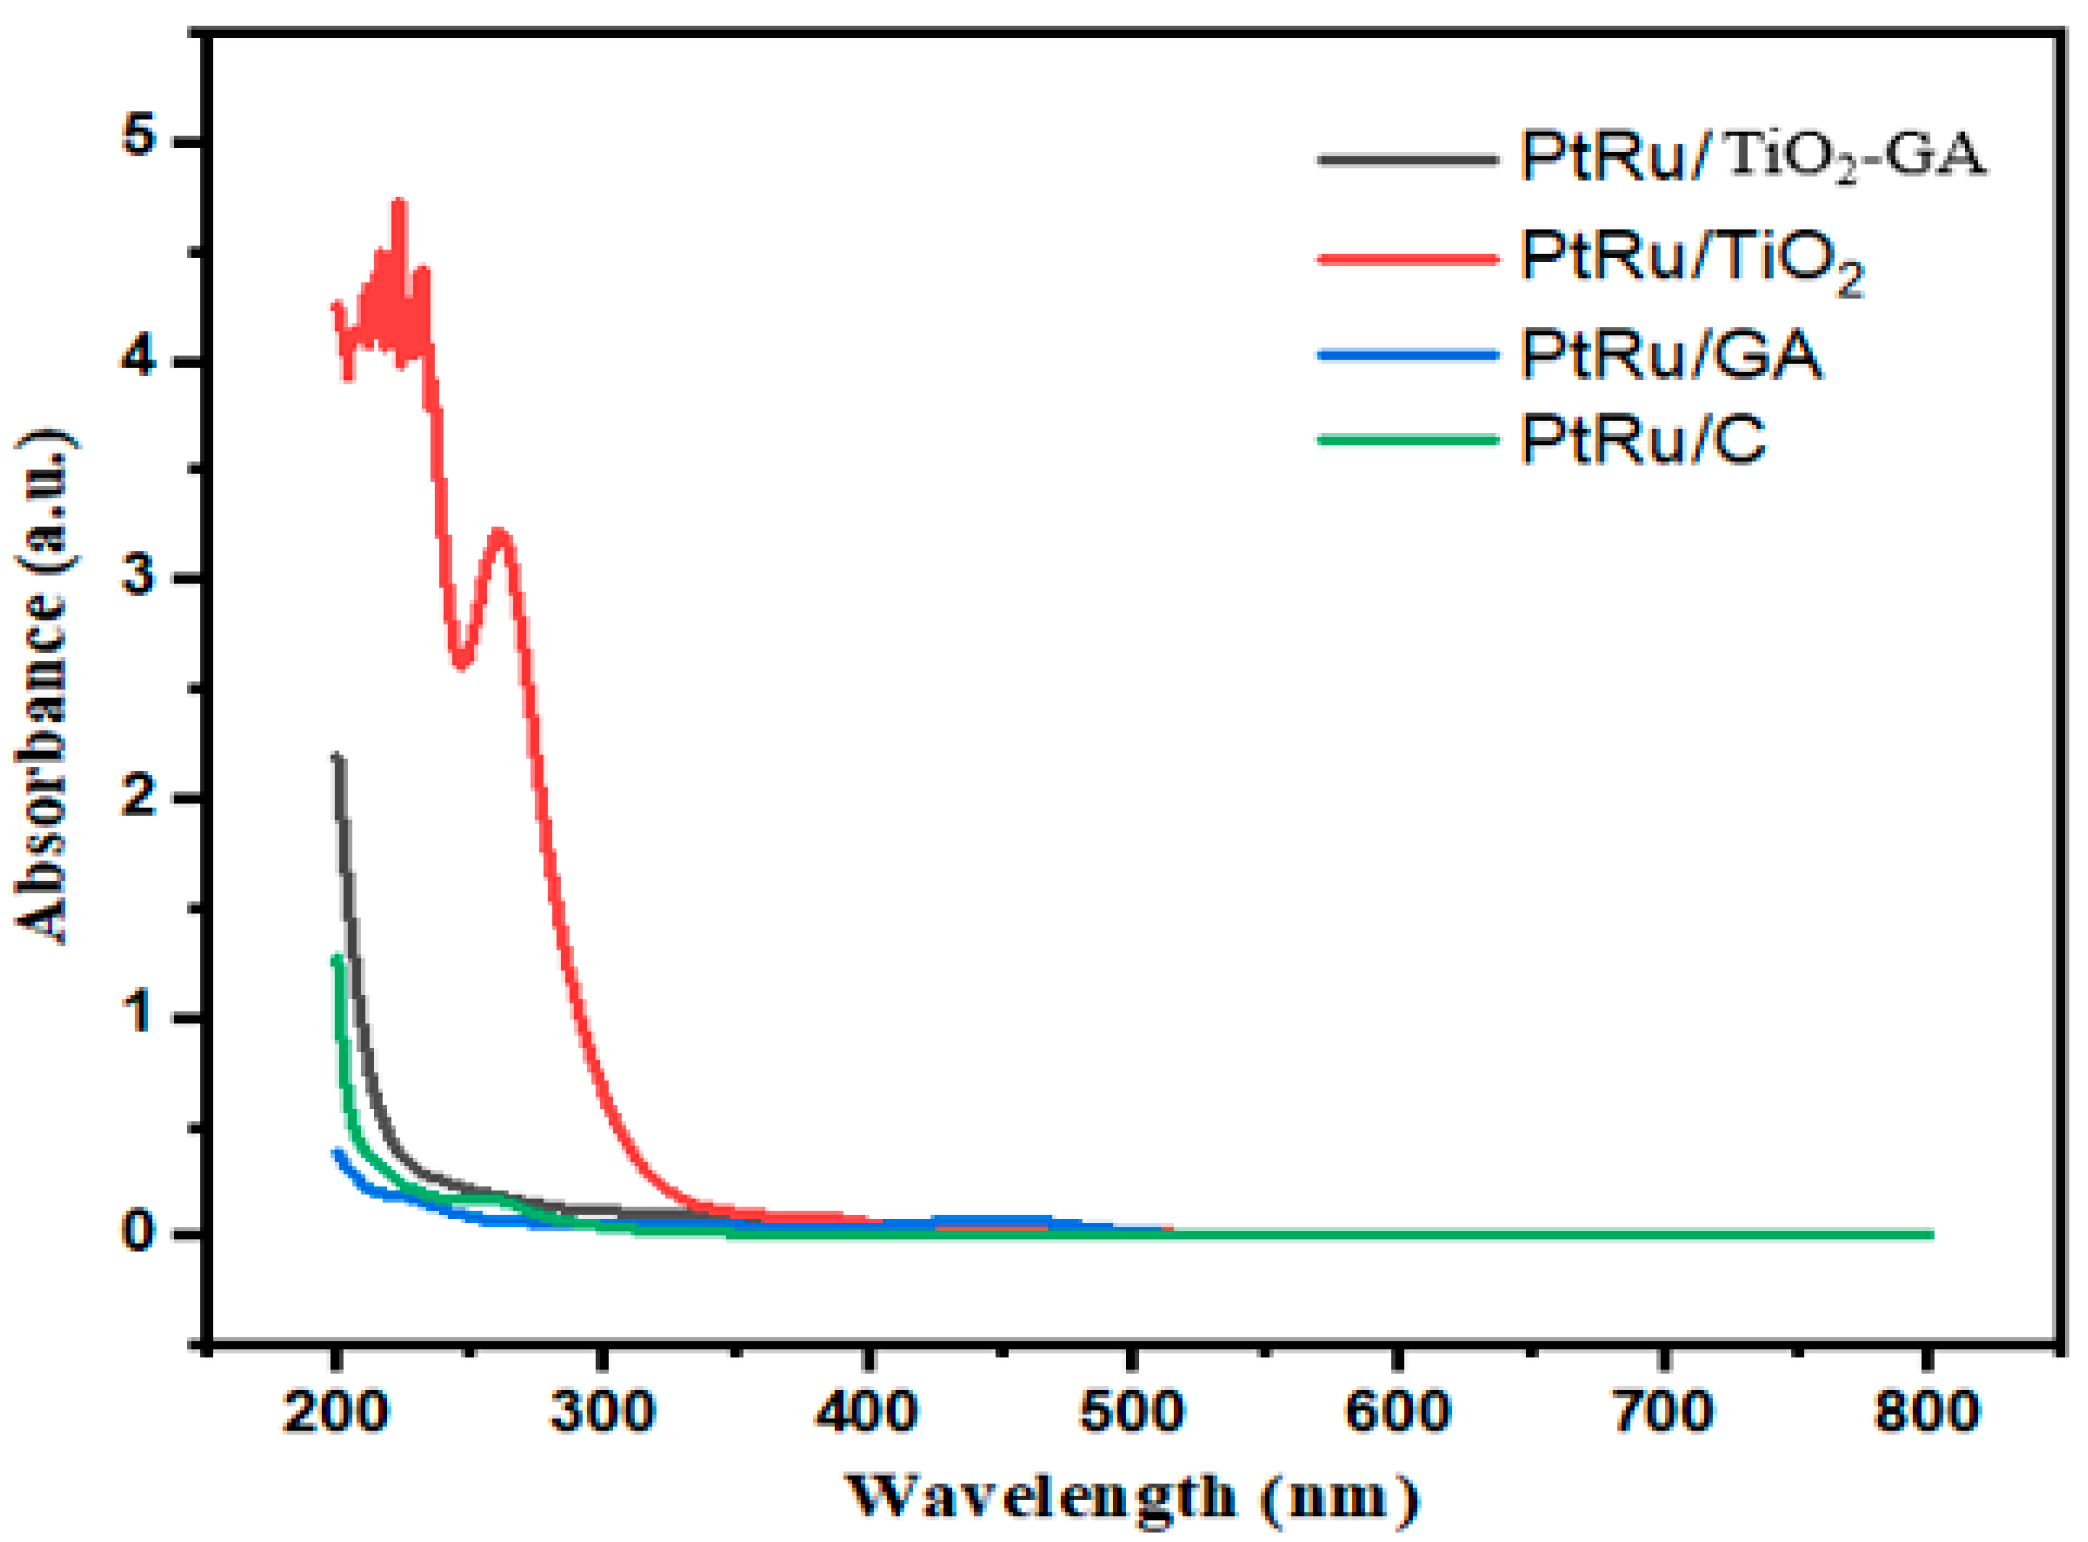
2.4. Physical Characterization
2.5. Electrochemical Measurements
2.6. Fabrication of MEA
2.7. DMFC Performance Test
3. Results and Discussion
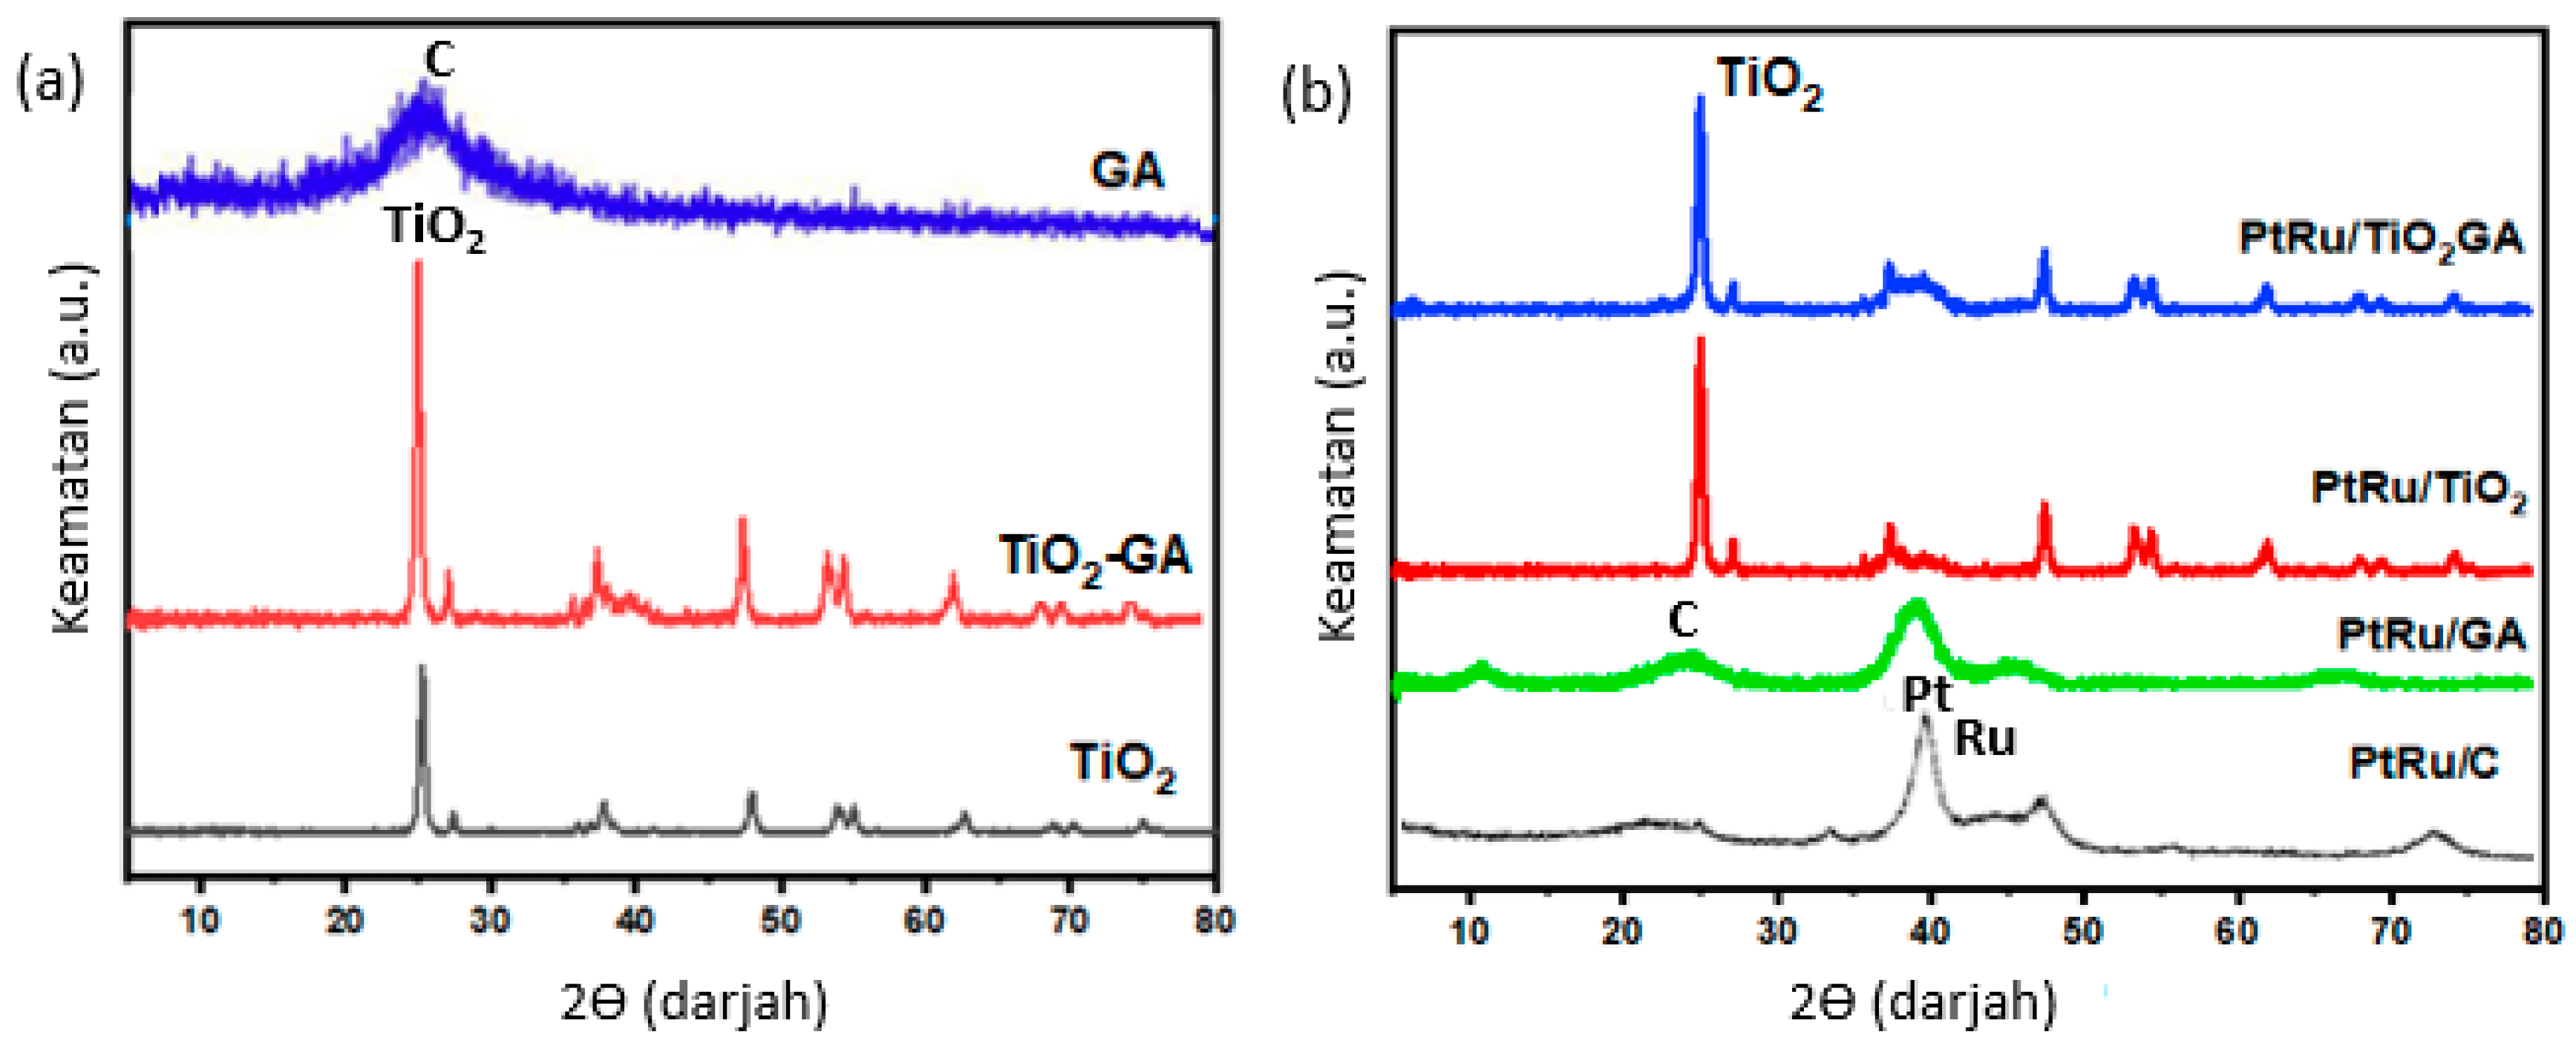
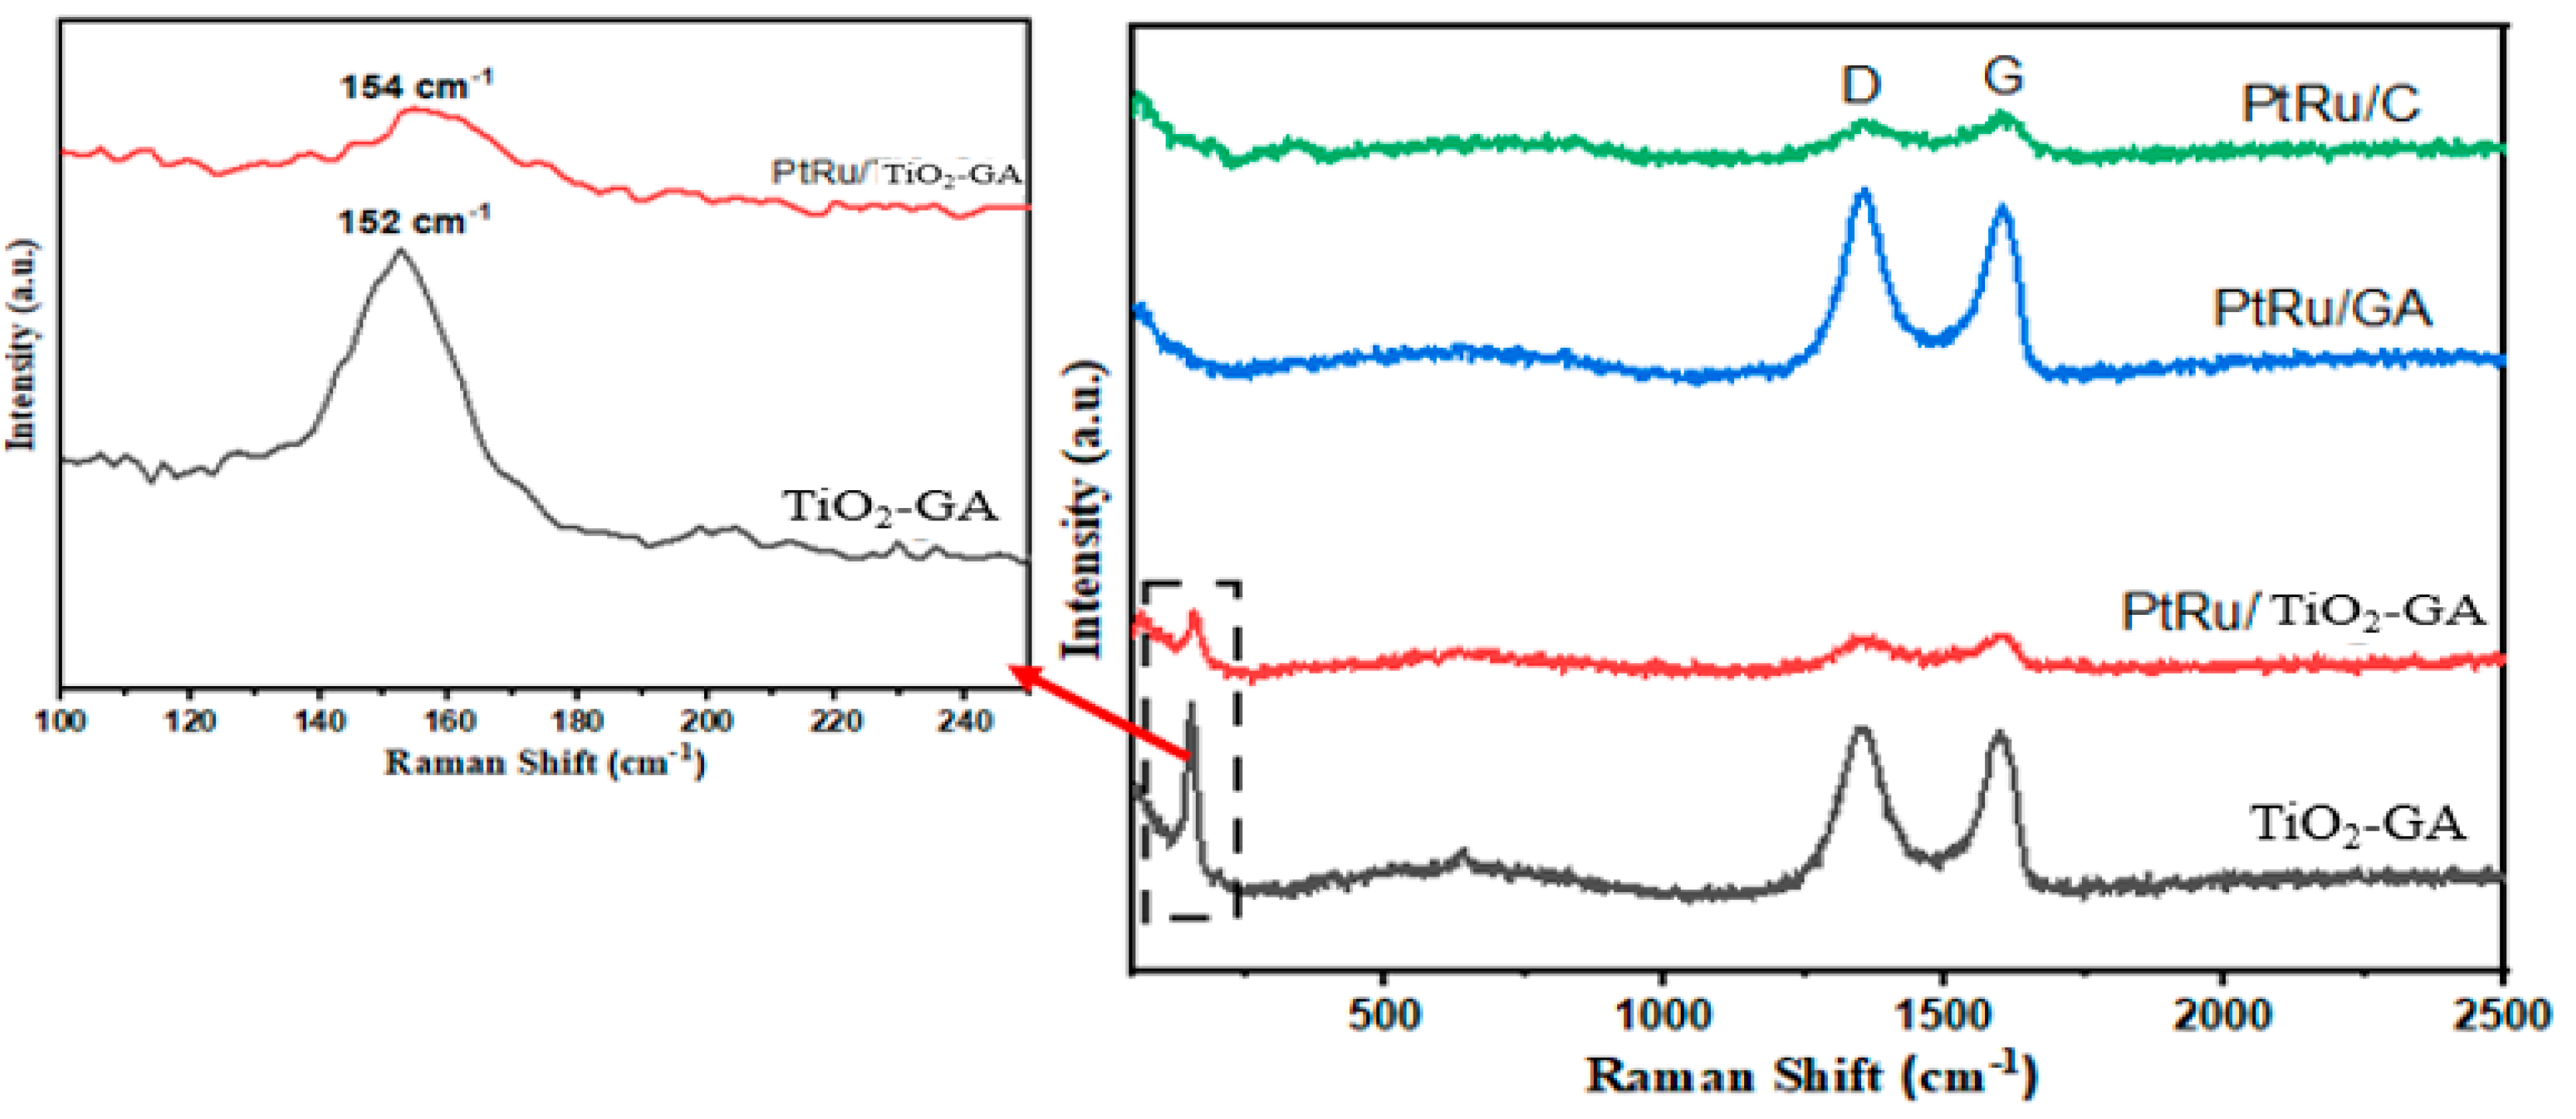
3.1. Electrocatalyst Physical Characterizations
3.2. Electrocatalytic Electrochemical Performance
3.2.1. Electrochemically Active Surface Area
3.2.2. Methanol Oxidation Reaction
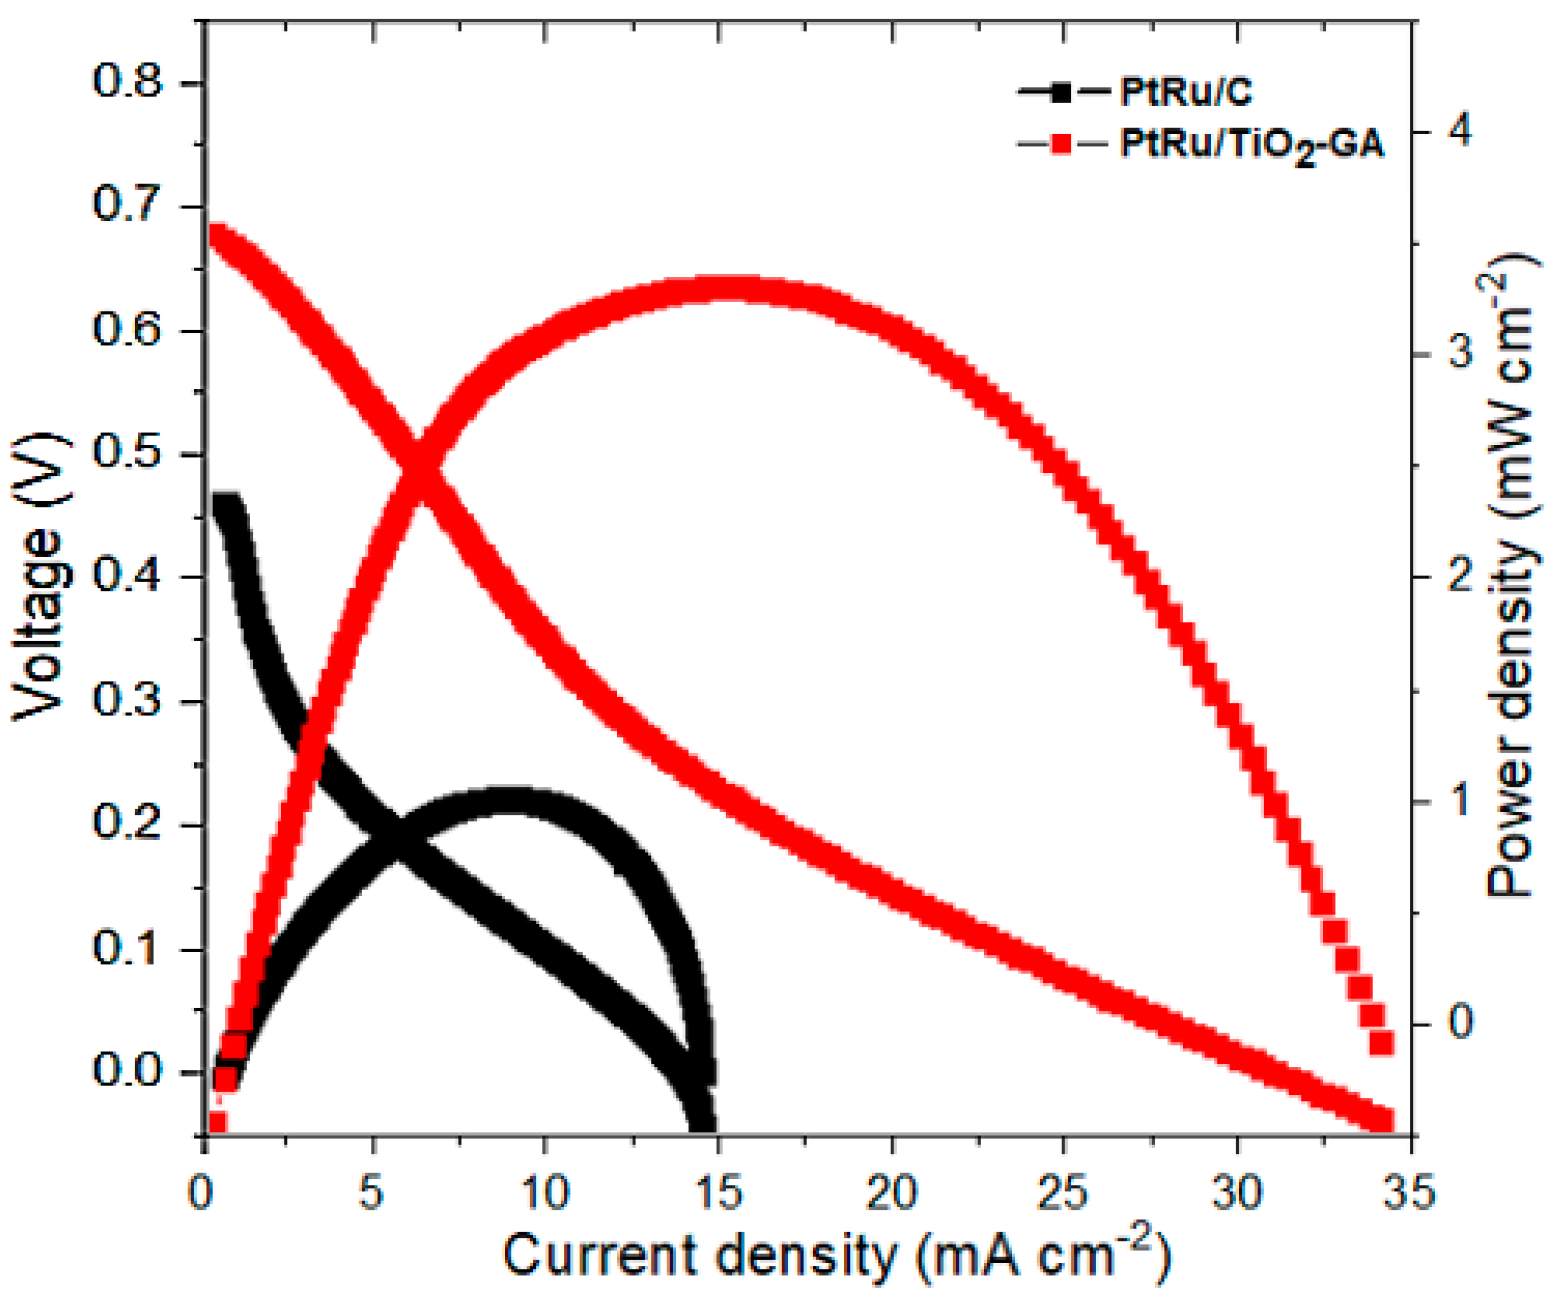
3.2.3. DMFC Single Cell Performance
4. Conclusions
Author Contributions
Funding
Acknowledgments
Conflicts of Interest
References
- Debe, M.K. Electrocatalyst approaches and challenges for automotive fuel cells. Nature 2012, 486, 43–51. [Google Scholar] [CrossRef]
- Kang, Y.; Xue, Q.; Jin, P.; Jiang, J.; Zeng, J.; Chen, Y. Rhodium Nanosheets-Reduced Graphene Oxide Hybrids: A Highly Active Platinum-Alternative Electrocatalyst for the Methanol Oxidation Reaction in Alkaline Media. ACS Sustain. Chem. Eng. 2017, 5, 10156–10162. [Google Scholar] [CrossRef]
- Cong, H.P.; Ren, X.C.; Yu, S.H. Controlled Synthesis of PtRu/Graphene Nanocatalysts with Enhanced Methanol Oxidation Activity for Fuel Cells. ChemCatChem 2012, 4, 1555–1559. [Google Scholar] [CrossRef]
- Kamarudin, S.K.; Achmad, F.; Daud, W.R.W.W. Overview on the application of direct methanol fuel cell (DMFC) for portable electronic devices. Int. J. Hydrog. Energy 2009, 34, 6902–6916. [Google Scholar] [CrossRef]
- Chen, T.Y.; Luo, T.J.M.; Yang, Y.W.; Wei, Y.C.; Wang, K.W.; Lin, T.L.; Wen, T.C.; Lee, C.H. Core dominated surface activity of core-shell nanocatalysts on methanol electrooxidation. J. Phys. Chem. C 2012, 116, 16969–16978. [Google Scholar] [CrossRef]
- Chrzanowski, W.; Wieckowski, A. Surface Structure Effects in Platinum/Ruthenium Methanol Oxidation Electrocatalysis. Langmuir 1998, 14, 1967–1970. [Google Scholar] [CrossRef]
- Basri, S.; Kamarudin, S.K.; Daud, W.R.W.; Yaakub, Z. Nanocatalyst for direct methanol fuel cell (DMFC). Int. J. Hydrog. Energy 2010, 35, 7957–7970. [Google Scholar] [CrossRef]
- Yang, Y.; Song, Y.; Sun, H.; Xiang, D.; Jiang, Q.; Lu, Z.; He, H.; Huang, H. Rh-Decorated Three-Dimensional Graphene Aerogel Networks as Highly-Efficient Electrocatalysts for Direct Methanol Fuel Cells. Front. Energy Res. 2020, 8, 60. [Google Scholar] [CrossRef] [Green Version]
- Miao, B.-Q.; Liu, Y.-C.; Ding, Y.; Jin, P.-J.; Chen, P.; Chen, Y. Rhodium nanodendrites catalyzed alkaline methanol oxidation reaction in direct methanol fuel cells. Sustain. Mater. Technol. 2022, 31, e00379. [Google Scholar] [CrossRef]
- Moura, A.S.; Fajín, J.L.C.C.; Mandado, M.; Cordeiro, M.N.D.S.S. Ruthenium-platinum catalysts and direct methanol fuel cells (DMFC): A review of theoretical and experimental breakthroughs. Catalysts 2017, 7, 47. [Google Scholar] [CrossRef] [Green Version]
- Ramli, Z.A.C.; Kamarudin, S.K.; Basri, S.; Zainoodin, A.M. The potential of novel carbon nanocages as a carbon support for an enhanced methanol electro-oxidation reaction in a direct methanol fuel cell. Int. J. Energy Res. 2020, 44, 10071–10086. [Google Scholar] [CrossRef]
- Kua, J.; Goddard, W.A. Oxidation of methanol on 2nd and 3rd row group VIII transition metals (Pt, Ir, Os, Pd, Rh, and Ru): Application to direct methanol fuel cells. J. Am. Chem. Soc. 1999, 121, 10928–10941. [Google Scholar] [CrossRef]
- Bock, C.; Paquet, C.; Couillard, M.; Botton, G.A.; MacDougall, B.R. Size-selected synthesis of PtRu nano-catalysts: Reaction and size control mechanism. J. Am. Chem. Soc. 2004, 126, 8028–8037. [Google Scholar] [CrossRef] [Green Version]
- Baral, A.; Das, D.P.; Minakshi, M.; Ghosh, M.K.; Padhi, D.K. Probing Environmental Remediation of RhB Organic Dye Using α-MnO2 under Visible- Light Irradiation: Structural, Photocatalytic and Mineralization Studies. ChemistrySelect 2016, 1, 4277–4285. [Google Scholar] [CrossRef]
- Poudel, M.B.; Yu, C.; Kim, H.J. Synthesis of Conducting Bifunctional Polyaniline@Mn-TiO2 Nanocomposites for Supercapacitor Electrode and Visible Light Driven Photocatalysis. Catalysts 2020, 10, 546. [Google Scholar] [CrossRef]
- Poudel, M.B.; Kim, A.A.; Lohani, P.C.; Yoo, D.J.; Kim, H.J. Assembling zinc cobalt hydroxide/ternary sulfides heterostructure and iron oxide nanorods on three-dimensional hollow porous carbon nanofiber as high energy density hybrid supercapacitor. J. Energy Storage 2023, 60, 106713. [Google Scholar] [CrossRef]
- Poudel, M.B.; Kim, A.A. Silver nanoparticles decorated TiO2 nanoflakes for antibacterial properties. Inorg. Chem. Commun. 2023, 152, 110675. [Google Scholar] [CrossRef]
- Ercelik, M.; Ozden, A.; Seker, E.; Colpan, C.O. Characterization and performance evaluation of PtRu/CTiO2 anode electrocatalyst for DMFC applications. Int. J. Hydrog. Energy 2017, 42, 21518–21529. [Google Scholar] [CrossRef]
- Luttrell, T.; Halpegamage, S.; Tao, J.; Kramer, A.; Sutter, E.; Batzill, M. Why is anatase a better photocatalyst than rutile?—Model studies on epitaxial TiO2 films. Sci. Rep. 2015, 4, 4043. [Google Scholar] [CrossRef] [Green Version]
- Kolla, P.; Smirnova, A. Methanol oxidation on hybrid catalysts: PtRu/C nanostructures promoted with cerium and titanium oxides. Int. J. Hydrog. Energy 2013, 38, 15152–15159. [Google Scholar] [CrossRef]
- Nakagawa, N.; Ito, Y.; Tsujiguchi, T.; Ishitobi, H. Improved reaction kinetics and selectivity by the TiO2-embedded carbon nanofiber support for electro-oxidation of ethanol on PtRu nanoparticles. J. Power Sources 2014, 248, 330–336. [Google Scholar] [CrossRef]
- Zhao, L.; Wang, Z.B.; Li, J.L.; Zhang, J.J.; Sui, X.L.; Zhang, L.M. Hybrid of carbon-supported Pt nanoparticles and three dimensional graphene aerogel as high stable electrocatalyst for methanol electrooxidation. Electrochim. Acta 2016, 189, 175–183. [Google Scholar] [CrossRef]
- Alwin, S.; Sahaya Shajan, X.; Shajan, X.S.; Sahaya Shajan, X.; Shajan, X.S. Aerogels: Promising Nanostructured Materials for Energy Conversion and Storage Applications; Springer: Berlin/Heidelberg, Germany, 2020; Volume 9, pp. 1–27. [Google Scholar]
- Shaari, N.; Kamarudin, S.K.; Norazuwana Shaari, S.K.K.; Shaari, N.; Kamarudin, S.K. Current status, opportunities, and challenges in fuel cell catalytic application of aerogels. Int. J. Energy Res. 2019, 43, 2447–2467. [Google Scholar] [CrossRef]
- Fuentes, R.E.; García, B.L.; Weidner, J.W. Effect of Titanium Dioxide Supports on the Activity of Pt-Ru toward Electrochemical Oxidation of Methanol. J. Electrochem. Soc. 2011, 158, B461. [Google Scholar] [CrossRef] [Green Version]
- Basri, S.; Kamarudin, S.K.; Daud, W.R.W.W.; Yaakob, Z.; Kadhum, A.A.H.H. Novel anode catalyst for direct methanol fuel cells. Sci. World J. 2014, 2014, 547604. [Google Scholar] [CrossRef] [Green Version]
- Abdullah, N.; Kamarudin, S.K.; Shyuan, L.K. Novel Anodic Catalyst Support for Direct Methanol Fuel Cell: Characterizations and Single-Cell Performances. Nanoscale Res. Lett. 2018, 13, 90. [Google Scholar] [CrossRef] [Green Version]
- Hasran, U.A.; Kamarudin, S.K.; Daud, W.R.W.; Majlis, B.Y.; Mohamad, A.B.; Kadhum, A.A.H.; Ahmad, M.M. Optimization of hot pressing parameters in membrane electrode assembly fabrication by response surface method. Int. J. Hydrog. Energy 2013, 38, 9484–9493. [Google Scholar] [CrossRef]
- Zainoodin, A.M.; Kamarudin, S.K.; Masdar, M.S.; Daud, W.R.W.; Mohamad, A.B.; Sahari, J. High power direct methanol fuel cell with a porous carbon nanofiber anode layer. Appl. Energy 2014, 113, 946–954. [Google Scholar] [CrossRef]
- Mei, Q.; Zhang, K.; Guan, G.; Liu, B.; Wang, S.; Zhang, Z. Highly efficient photoluminescent graphene oxide with tunable surface properties. Chem. Commun. 2010, 46, 7319–7321. [Google Scholar] [CrossRef]
- Li, D.; Müller, M.B.; Gilje, S.; Kaner, R.B.; Wallace, G.G. Processable aqueous dispersions of graphene nanosheets. Nat. Nanotechnol. 2008, 3, 101–105. [Google Scholar] [CrossRef]
- Gao, X.; Jang, J.; Nagase, S. Hydrazine and thermal reduction of graphene oxide: Reaction mechanisms, product structures, and reaction design. J. Phys. Chem. C 2010, 114, 832–842. [Google Scholar] [CrossRef]
- Marcano, D.C.; Kosynkin, D.V.; Berlin, J.M.; Sinitskii, A.; Sun, Z.; Slesarev, A.; Alemany, L.B.; Lu, W.; Tour, J.M. Improved synthesis of graphene oxide. ACS Nano 2010, 4, 4806–4814. [Google Scholar] [CrossRef]
- Huang, N.M.; Lim, H.N.; Chia, C.H.; Yarmo, M.A.; Muhamad, M.R. Simple room-temperature preparation of high-yield large-area graphene oxide. Int. J. Nanomedicine 2011, 6, 3443–3448. [Google Scholar] [CrossRef] [Green Version]
- Liu, R.; Guo, W.; Sun, B.; Pang, J.; Pei, M.; Zhou, G. Composites of rutile TiO2 nanorods loaded on graphene oxide nanosheet with enhanced electrochemical performance. Electrochim. Acta 2015, 156, 274–282. [Google Scholar] [CrossRef]
- Xiang, C.; Guo, R.; Lan, J.; Jiang, S.; Wang, C.; Du, Z.; Cheng, C. Self-assembling porous 3D titanium dioxide-reduced graphene oxide aerogel for the tunable absorption of oleic acid and RhodamineB dye. J. Alloys Compd. 2017, 735, 246–252. [Google Scholar] [CrossRef]
- Cordero-Borboa, A.E.; Sterling-Black, E.; Gómez-Cortés, A.; Vázquez-Zavala, A. X-ray diffraction evidence of the single solid solution character of bi-metallic Pt-Pd catalyst particles on an amorphous SiO2 substrate. Appl. Surf. Sci. 2003, 220, 169–174. [Google Scholar] [CrossRef]
- Jorio, A.; Ferreira, E.H.M.; Moutinho, M.V.O.; Stavale, F.; Achete, C.A.; Capaz, R.B. Measuring disorder in graphene with the G and D bands. Phys. Status Solidi Basic Res. 2010, 247, 2980–2982. [Google Scholar] [CrossRef]
- Claramunt, S.; Varea, A.; López-Díaz, D.; Velázquez, M.M.; Cornet, A.; Cirera, A. The importance of interbands on the interpretation of the raman spectrum of graphene oxide. J. Phys. Chem. C 2015, 119, 10123–10129. [Google Scholar] [CrossRef]
- Stankovich, S.; Dikin, D.A.; Piner, R.D.; Kohlhaas, K.A.; Kleinhammes, A.; Jia, Y.; Wu, Y.; Nguyen, S.B.T.; Ruoff, R.S. Synthesis of graphene-based nanosheets via chemical reduction of exfoliated graphite oxide. Carbon N. Y. 2007, 45, 1558–1565. [Google Scholar] [CrossRef]
- Zhu, Y.; Murali, S.; Cai, W.; Li, X.; Suk, J.W.; Potts, J.R.; Ruoff, R.S. Graphene and graphene oxide: Synthesis, properties, and applications. Adv. Mater. 2010, 22, 3906–3924. [Google Scholar] [CrossRef]
- Li, Y.; Cai, Q.; Wang, L.; Li, Q.; Peng, X.; Gao, B.; Huo, K.; Chu, P.K. Mesoporous TiO2 Nanocrystals/Graphene as an Efficient Sulfur Host Material for High-Performance Lithium-Sulfur Batteries. ACS Appl. Mater. Interfaces 2016, 8, 23784–23792. [Google Scholar] [CrossRef]
- Bin Yarmo, M.A.; Binti Ramli, A.; Bin Radiman, S. Pencirian Permukaan Mangkin Pengubah Komersial Menggunakan Teknik Spektroskopi Fotoelektron Sinar-X. Malaysian J. Anal. Sci. 2001, 7, 267–271. [Google Scholar]
- Nissim, Y.I.; Katz, A. Single Chamber Processing; Elsevier: Amsterdam, The Netherlands, 1993; p. 162. [Google Scholar]
- Mohamed, M.A.; Wan Salleh, W.N.; Jaafar, J.; Rosmi, M.S.; Zul, Z.A.; Abd Mutalib, M.; Ismail, A.F.; Tanemura, M. Carbon as amorphous shell and interstitial dopant in mesoporous rutile TiO2: Bio-template assisted sol-gel synthesis and photocatalytic activity. Appl. Surf. Sci. 2017, 393, 46–59. [Google Scholar] [CrossRef]
- Sebastián, D.; Nieto-Monge, M.J.; Pérez-Rodríguez, S.; Pastor, E.; Lázaro, M.J. Nitrogen Doped Ordered Mesoporous Carbon as Support of PtRu Nanoparticles for Methanol Electro-Oxidation. Energies 2018, 11, 831. [Google Scholar] [CrossRef] [Green Version]
- Jiang, X.; Wang, X.; Shen, L.; Wu, Q.; Wang, Y.; Ma, Y.; Wang, X.; Hu, Z. High-performance Pt catalysts supported on hierarchical nitrogen-doped carbon nanocages for methanol electrooxidation. Chin. J. Catal. 2016, 37, 1149–1155. [Google Scholar] [CrossRef]
- Yang, L.X.; Allen, R.G.; Scott, K.; Christenson, P.; Roy, S. A comparative study of PtRu and PtRuSn thermally formed on titanium mesh for methanol electro-oxidation. J. Power Sources 2004, 137, 257–263. [Google Scholar] [CrossRef]
- Yang, L.X.; Bock, C.; MacDougall, B.; Park, J. The role of the WO x ad-component to Pt and PtRu catalysts in the electrochemical CH3OH oxidation reaction. J. Appl. Electrochem. 2004, 34, 427–438. [Google Scholar] [CrossRef] [Green Version]
- Reghunath, S.; Pinheiro, D.; KR, S.D. A review of hierarchical nanostructures of TiO2: Advances and applications. Appl. Surf. Sci. Adv. 2021, 3, 100063. [Google Scholar] [CrossRef]
- Jiménez-García, J.C.; Olmos-Asar, J.A.; Franceschini, E.E.; Mariscal, M.M. Electrochemical area of graphene-supported metal nanoparticles from an atomistic approach. J. Appl. Electrochem. 2020, 50, 421–429. [Google Scholar] [CrossRef]
- Ren, X.; Wang, Y.; Liu, A.; Zhang, Z.; Lv, Q.; Liu, B. Current progress and performance improvement of Pt/C catalysts for fuel cells. J. Mater. Chem. A 2020, 8, 24284–24306. [Google Scholar] [CrossRef]
- Vidal-Iglesias, F.J.; Arán-Ais, R.M.; Solla-Gullón, J.; Herrero, E.; Feliu, J.M. Electrochemical characterization of shape-controlled Pt nanoparticles in different supporting electrolytes. ACS Catal. 2012, 2, 901–910. [Google Scholar] [CrossRef] [Green Version]
- Yen, C.H.; Shimizu, K.; Lin, Y.Y.; Bailey, F.; Cheng, I.F.; Wai, C.M. Chemical fluid deposition of Pt-based bimetallic nanoparticles on multiwalled carbon nanotubes for direct methanol fuel cell application. Energy Fuels 2007, 21, 2268–2271. [Google Scholar] [CrossRef]
- Guo, J.W.; Zhao, T.S.; Prabhuram, J.; Chen, R.; Wong, C.W. Development of PtRu-CeO2/C anode electrocatalyst for direct methanol fuel cells. J. Power Sources 2006, 156, 345–354. [Google Scholar] [CrossRef]
- Minakshi, M.; Wickramaarachchi, K. Electrochemical aspects of supercapacitors in perspective: From electrochemical configurations to electrode materials processing. Prog. Solid State Chem. 2023, 69, 100390. [Google Scholar] [CrossRef]
- Wu, J.; Xu, M.; Lei, S.; Jin, C. High electrocatalytic activity and stability of PtAg supported on rutile TiO2 for methanol oxidation. Int. J. Hydrog. Energy 2020, 45, 12815–12821. [Google Scholar] [CrossRef]
- Sharma, P.; Minakshi Sundaram, M.; Watcharatharapong, T.; Laird, D.; Euchner, H.; Ahuja, R. Zn Metal Atom Doping on the Surface Plane of One-Dimesional NiMoO4 Nanorods with Improved Redox Chemistry. ACS Appl. Mater. Interfaces 2020, 12, 44815–44829. [Google Scholar] [CrossRef]
- Song, P.; Liu, L.; Wang, A.J.; Zhang, X.; Zhou, S.Y.; Feng, J.J. One-pot synthesis of platinum–palladium–cobalt alloyed nanoflowers with enhanced electrocatalytic activity for ethylene glycol oxidation. Electrochim. Acta 2015, 164, 323–329. [Google Scholar] [CrossRef]
- Shimizu, T.; Momma, T.; Mohamedi, M.; Osaka, T.; Sarangapani, S. Design and fabrication of pumpless small direct methanol fuel cells for portable applications. J. Power Sources 2004, 137, 277–283. [Google Scholar] [CrossRef]


| Samples | XRD/Crystallite Size (nm) |
|---|---|
| PtRu/TiO2-GA | 3.8 |
| PtRu/GA | 7.3 |
| PtRu/TiO2 | 8.1 |
| PtRu/C | 9.8 |
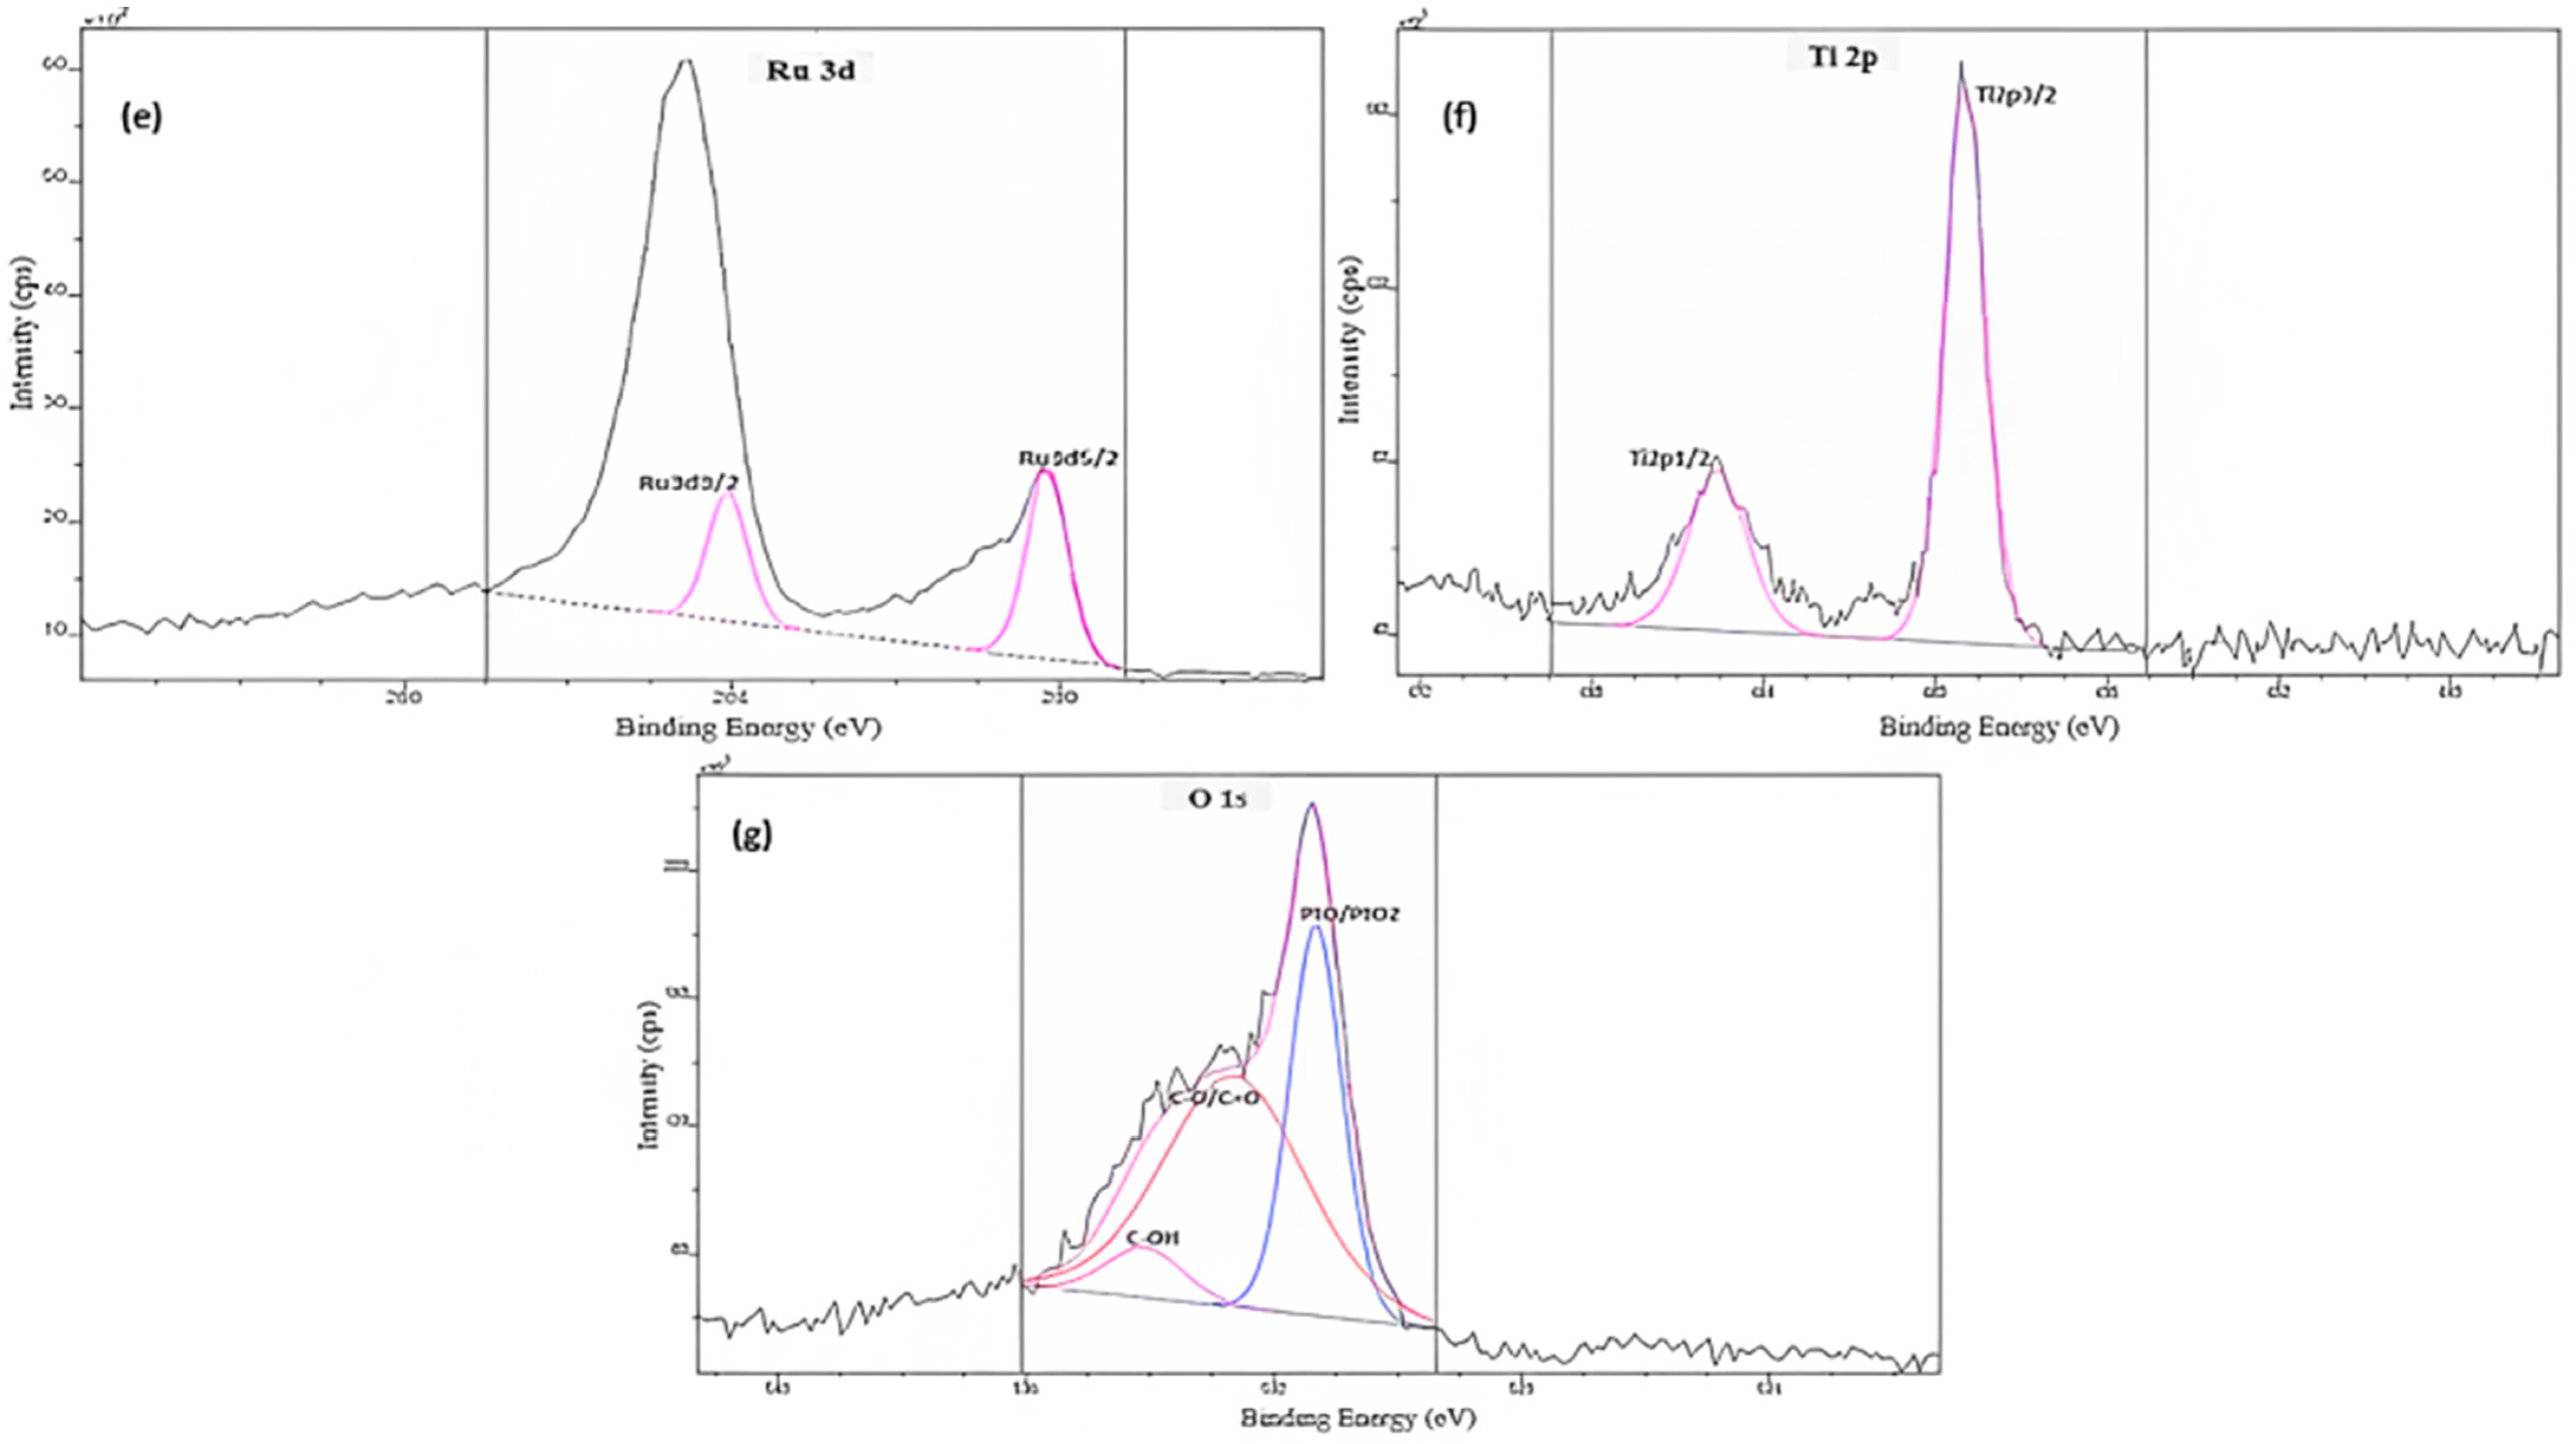
| Element | Atomic Concentration (%) |
|---|---|
| Pt | 11.49 |
| Ru | 17.55 |
| Ti | 21.3 |
| O | 29.95 |
| C | 18.84 |
| N | 0.87 |
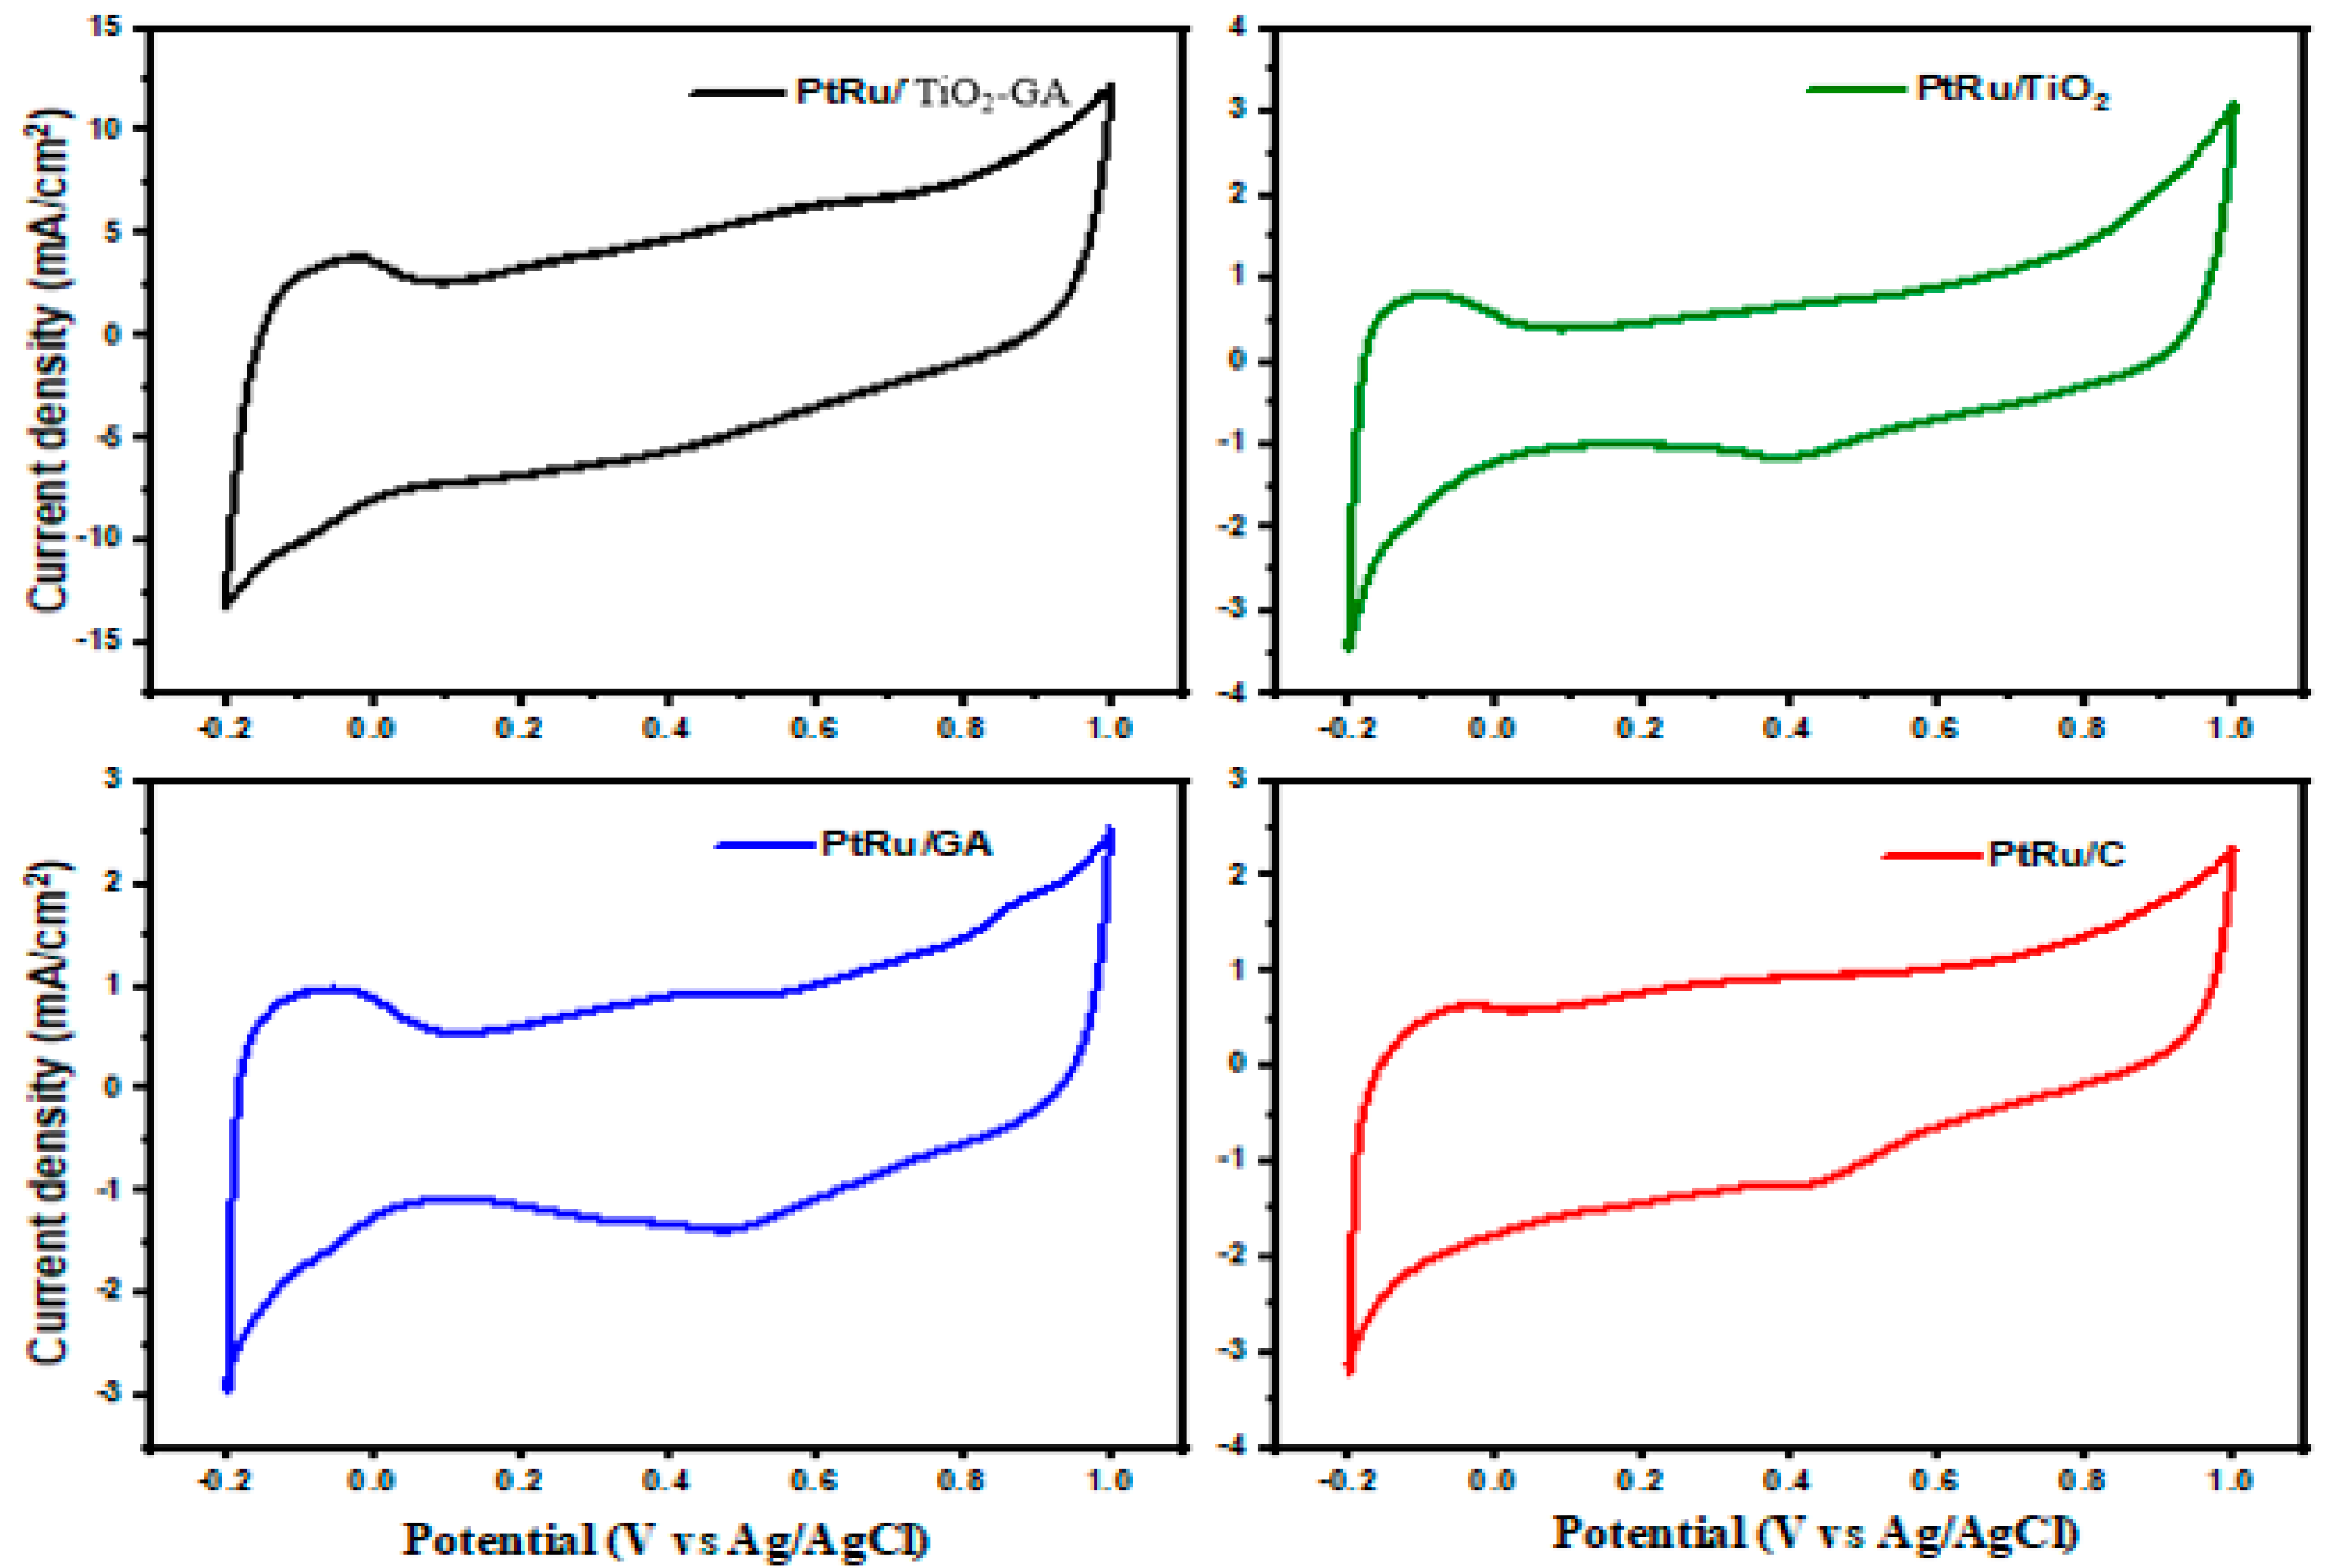
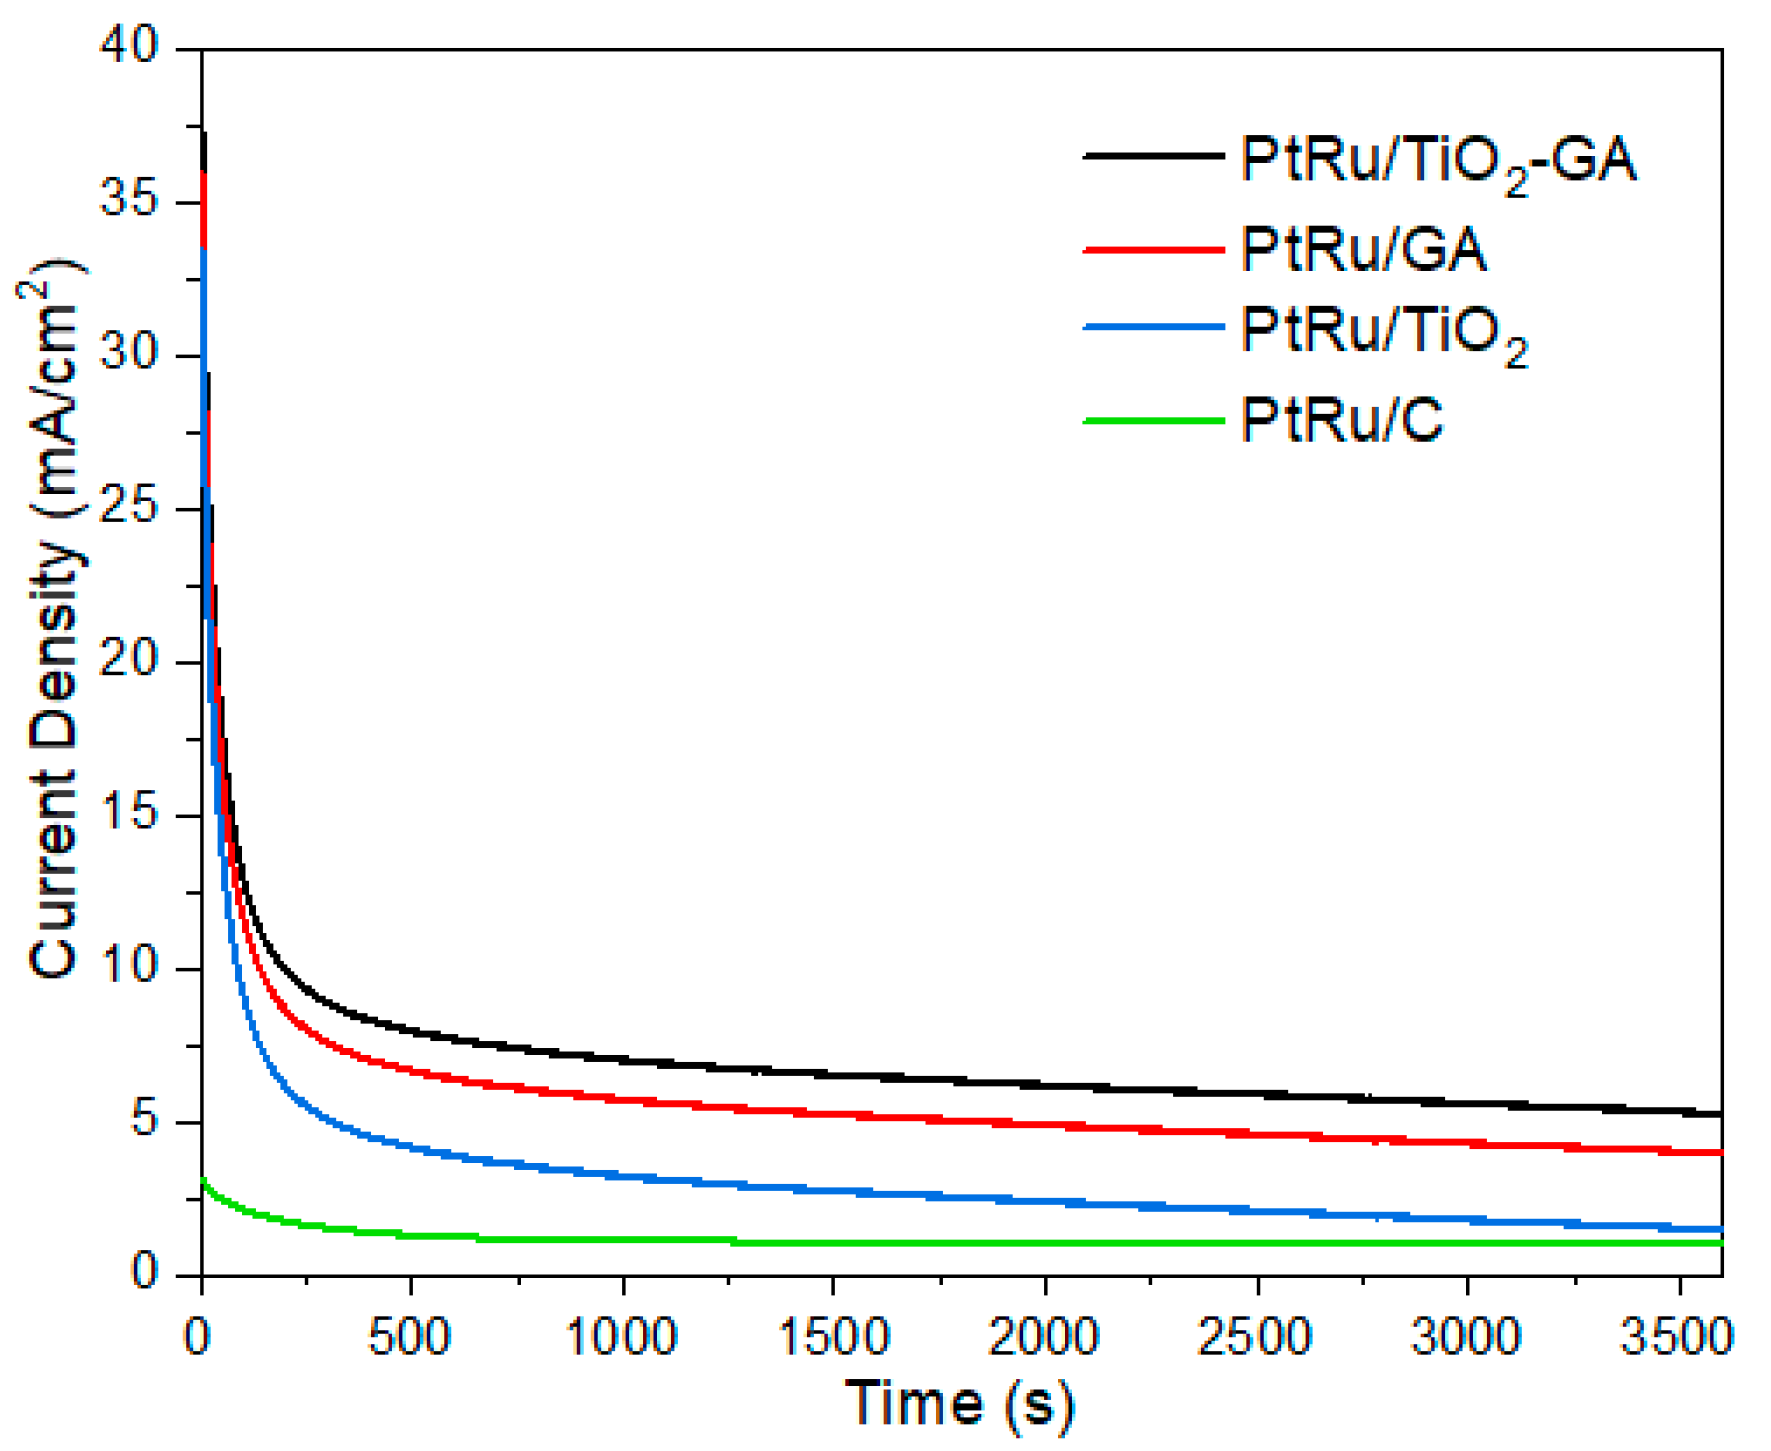
| Electrocatalyst | ECSA (m2/gPtRu) | Peak Potential (V vs. Ag/AgCl) | Onset Potential (V vs. Ag/AgCl) | Mass Activity (mA/mgPtRu) | Peak Current Density (mA/cm2) | Specific Activity (mA/cm2PtRu) | Author |
|---|---|---|---|---|---|---|---|
| PtRu/TiO2-GA | 68.44 | 0.7 | 0.1 | 608.17 | 30.59 | 0.45 | This study |
| PtRu/GA | 38.49 | 0.63 | 0.19 | 141.62 | 6.76 | 0.18 | This study |
| PtRu/TiO2 | 36.98 | 0.62 | 0.17 | 113.81 | 5.74 | 0.15 | This study |
| PtRu/C | 20.44 | 0.61 | 0.01 | 79.11 | 4.02 | 0.19 | This study |
| PtRu/TiO2-CNF | 10.4 | 0.84 | 0.305 | 345.64 | 0.5012 | 0 | Abdullah et al. [27] |
| - | 0.94 | 0.6 | 31 | - | - | Basri et al. [26] | |
| PtRu/MWCNT | - | 0.91 | 0.4 | 326.4 | 8.66 | - | Yen et al. [54] |
| TiO2-PtRu/C | 72.4 | 0.69 | 0.67 | 324 | - | - | Kolla and Smirnova [20] |
| PtRu0.7(CeO2)0.3/C | 4.02 | 0.19 | 0.4 | 21.43 | - | - | Guo et al. [55] |
Disclaimer/Publisher’s Note: The statements, opinions and data contained in all publications are solely those of the individual author(s) and contributor(s) and not of MDPI and/or the editor(s). MDPI and/or the editor(s) disclaim responsibility for any injury to people or property resulting from any ideas, methods, instructions or products referred to in the content. |
© 2023 by the authors. Licensee MDPI, Basel, Switzerland. This article is an open access article distributed under the terms and conditions of the Creative Commons Attribution (CC BY) license (https://creativecommons.org/licenses/by/4.0/).
Share and Cite
Osman, S.H.; Kamarudin, S.K.; Basri, S.; Karim, N.A. Potential of 3D Hierarchical Porous TiO2-Graphene Aerogel (TiO2-GA) as Electrocatalyst Support for Direct Methanol Fuel Cells. Nanomaterials 2023, 13, 1819. https://doi.org/10.3390/nano13121819
Osman SH, Kamarudin SK, Basri S, Karim NA. Potential of 3D Hierarchical Porous TiO2-Graphene Aerogel (TiO2-GA) as Electrocatalyst Support for Direct Methanol Fuel Cells. Nanomaterials. 2023; 13(12):1819. https://doi.org/10.3390/nano13121819
Chicago/Turabian StyleOsman, Siti Hasanah, Siti Kartom Kamarudin, Sahriah Basri, and Nabila A. Karim. 2023. "Potential of 3D Hierarchical Porous TiO2-Graphene Aerogel (TiO2-GA) as Electrocatalyst Support for Direct Methanol Fuel Cells" Nanomaterials 13, no. 12: 1819. https://doi.org/10.3390/nano13121819