
Nanoparticulate Perovskites for Photocatalytic Water Reduction

Department of Chemistry, University of Basel, Mattenstrasse 22, BPR 1095, Postfach, 4002 Basel, Switzerland
*
Author to whom correspondence should be addressed.
Nanomaterials 2023, 13(14), 2094; https://doi.org/10.3390/nano13142094
Submission received: 28 June 2023
/
Revised: 11 July 2023
/
Accepted: 15 July 2023
/
Published: 18 July 2023
(This article belongs to the Special Issue Transition Metal Complexes and Nanomaterials for Catalysis Application)
Abstract
:SrTiO3 and BaTiO3 nanoparticles (NPs) were activated using H2O2 or aqueous HNO3, and pristine and activated NPs were functionalized with a 2,2′-bipyridine phosphonic acid anchoring ligand (1), followed by reaction with RuCl3.3H2O and bpy, RhCl3.3H2O and bpy, or RuCl3.3H2O. The surface-bound metal complex functionalized NPs were used for the photogeneration of H2 from water, and their activity was compared to related systems using TiO2 NPs. The role of pH during surface complexation was found to be important. The NPs were characterized using Fourier transform infrared (FTIR) and solid-state absorption spectroscopies, thermogravimetric analysis mass spectrometry (TGA-MS), and matrix-assisted laser desorption/ionization mass spectrometry (MALDI-MS), and the dihydrogen generation was analyzed using gas chromatography–mass spectrometry (GC-MS). Our findings indicate that extensively functionalized SrTiO3 or BaTiO3 NPs may perform better than TiO2 NPs for water reduction.

1. Introduction
Increasing global economic development and a growing population have resulted in a higher demand for energy [1]. The burning of fossil fuels to provide energy releases greenhouse gases, which places immense stress on the environment. In the long term, this will cost society increasing amounts of resources [2,3,4,5]. As a consequence, research focusing on inexpensive energy solutions is increasingly focused on renewable and clean sources [6]. One solution is the use of dihydrogen derived from renewable sources as fuel or energy storage [7]. An attractive approach to a hydrogen economy is to combine energy harvesting and H2 evolution using photocatalysts operating under solar irradiation [8]. Hence, the design and development of efficient photocatalysts are crucial. A major contribution to this development is the use of heterogeneous catalysts [9,10,11,12]. These are often easier to recover than homogeneous catalysts but have the disadvantage of inactive interior volumes, with only surface sites being catalytically active [13,14,15]. An alternative is functionalizing nanoparticle (NP) scaffolds with photocatalysts. Such immobilized photocatalysts offer greater catalyst-to-volume ratios than bulk heterogeneous catalysts, and this enhances the catalytic activity and turnover. An additional benefit of NPs is the possibility of dispersing them in liquid phases [16,17,18,19].
In previous studies, we have shown that the binding of photo- and redox-active Rh and Ru coordination compounds onto TiO2 NP surfaces can be used successfully for H2 production, with the catalytic activity of the NP-supported catalyst outperforming previously reported, related homogeneous catalysts [20]. Another promising class of photocatalysts are perovskite-type oxides MTiO3 (M = Ca, Sr or Ba). These comprise cheap, earth-abundant elements [21,22,23], are water-insoluble, thermodynamically stable, and resistant to temperature- and photo-corrosion [24]. The photocatalytic properties of MTiO3 can be improved, tuned, and modified. This has been demonstrated using alternative synthetic methods [25,26], doping with organic or inorganic compounds [24,27,28], surface nanoparticle deposition [29,30], the use of cocatalysts [31,32], or the use of composites [33,34].
The photocatalytic properties of perovskites have been utilized for several applications, including organic compound degradation (methylene blue [24,25], methylene orange [29], salicylic acid [35], or ofloxacin dyes [34]) or H2 generation. In particular, SrTiO3 and BaTiO3 offer excellent activity in H2 generation. For example, the use of doped SrTiO3 has been widely demonstrated with examples, including Mn-, Ru-, Rh-, Ir- [27], Na- [36], Al-La- [37], and La-Rh- dopants [38]. Further approaches that result in improved H2 generation with doped SrTiO3 involve the introduction of oxygen vacancies [39] or additional cocatalysts, including Na-SrTiO3 combined with Rh2-yCryO3 [31] or Al-SrTiO3 with RhCrOx [32]. Similarly, BaTiO3 has been doped with Rh and functionalized with Pt nanoparticles to give a composite material shown to generate H2 upon irradiation [40]. A further promising feature of SrTiO3 and BaTiO3 NPs is their relatively similar pH-dependent zeta potentials and band gaps, only ~0.2 eV larger than TiO2 [41,42,43,44,45,46]. Functionalization using various anchoring groups, including phosphonic acids, carboxylic acids, or even hydroxy groups, makes them suitable candidates to extend our earlier results obtained with TiO2 NPs [47,48].
In this work, we report the surface activation of pristine SrTiO3 and BaTiO3 NPs using either HNO3 or H2O2. The activated NPs are abbreviated as SrTiO3-a, BaTiO3-a (HNO3 activation) or SrTiO3-OH, BaTiO3-OH (H2O2 activation), respectively. We compare the subsequent functionalization of each type of pristine and activated NP with the ligand [2,2′-bipyridine]-4,4′-diylbis(phosphonic acid) (1, Scheme 1) which contains phosphonic acid anchoring domains. The functionalized NPs were used for direct surface metal complex assembly by reaction with 2,2′-bipyridine (bpy) and ruthenium or rhodium trichloride to give a surface-bound complex presumed to be (but not established as) an [M(bpy)2(1)]-species. The photocatalytic behavior of these metal-functionalized NPs was investigated. Experiments were also conducted to highlight the importance of pH control for successful metal complex assembly on the NP surface. The NPs were characterized using Fourier transform infrared (FTIR) and solid-state absorption spectroscopies, thermogravimetric analysis mass spectrometry (TGA-MS), and matrix-assisted laser desorption/ionization mass spectrometry (MALDI-MS), and the dihydrogen generation was analyzed using gas chromatography–mass spectrometry (GC-MS).
2. Materials and Methods
2.1. General
RuCl3.3H2O and RhCl3.3H2O were purchased from Oxkem Ltd. (Reading, UK) and Johnson Matthey (Materials Technology, Reading, UK). 2,2′-Bipyridine (bpy) and triethanolamine (TEOA) were purchased from Apollo Scientific Ltd. (Stockport, UK) and Sigma Aldrich Chemie GmbH (Buchs, Switzerland), respectively. K2[PtCl4] was purchased from Alfa Aesar GmbH & Co KG (Karlsruhe, Germany). Pristine SrTiO3 and BaTiO3 NPs were purchased from Sigma-Aldrich Chemie GmbH (Buchs, Switzerland) and had diameter sizes of <100 and 50 nm, respectively; further characterizations are reported in the Supplementary Materials. The anchoring ligand 1 was prepared as previously described [20]. Instrumentation details are given in the Supplementary Materials. The calculated major MALDI peaks reported in the Supplementary Materials were determined using the most abundant isotopes (e.g., 102Ru, 35Cl). For functionalized NPs in which the surface-bound ligand 1 is coordinated to a metal, a simplified notation is introduced; for example, Ru@SrTiO3 describes a SrTiO3 NP modified with ligand 1 which is also coordinated to Ru. In the case of NPs functionalized with both Ru and Rh, the relative amounts of the two metals are indicated using lower case (lower concentration) or upper case (higher concentration) letters (r or R). The first letter refers to Ru and the second to Rh, e.g., rR@SrTiO3 describes metal complex-functionalized NPs with Ru/Rh in a 1:20 molar ratio on the surface.
2.2. Experimental
2.2.1. Nanoparticle Surface Activation Using HNO3 (SrTiO3-a, BaTiO3-a)
Pristine SrTiO3 or BaTiO3 NPs were activated as previously reported [20]. The NPs (2.00 g) were dispersed by sonication for 15 min in dilute aqueous HNO3 (30 mL, 3.0 M). The mixture was then stirred for 30 min. The suspension was centrifuged (10 min, 7000 rpm) and the NPs were washed once with milliQ water (40 mL). The NPs were added to milliQ water (40 mL) and dispersed by sonication for 10 min. The suspension was then stirred for 72 h. The suspension was centrifuged (10 min, 7000 rpm), and the NPs were washed with milliQ water (2 × 40 mL). The activated NPs (SrTiO3-a, 1.67 g and BaTiO3-a, 0.60 g) were stored in a sealed vial under N2 after drying them under high vacuum. The characterization data of the pristine NPs and acid-activated NPs are given in the Supplementary Materials. The TGA and TGA-MS spectra of the pristine NPs (Figures S1–S4) and acid-activated NPs (Figures S5–S7) are given in the Supplementary Materials.
2.2.2. Nanoparticle Surface Activation Using H2O2 (SrTiO3-OH, BaTiO3-OH)
Pristine SrTiO3 or BaTiO3 NPs were activated as reported in the literature [49]. The NPs (1.05 g) were dispersed by sonication for 20 min in H2O2 (50 mL, 30%). The mixture was then stirred for 4 h at 110 °C under N2. The suspension was cooled down, centrifuged (10 min, 7000 rpm), and the NPs were washed with milliQ water (40 mL). The activated NPs (1.05 g and 1.05 g) were stored in a sealed vial under N2 after drying them under high vacuum for 72 h. The characterization data are given in the Supplementary Materials. The TGA and TGA-MS spectra of the H2O2-activated NPs (Figures S8–S11) are given in the Supplementary Materials.
2.2.3. Nanoparticle Surface Ligand Functionalization (1@SrTiO3, 1@SrTiO3-a, 1@SrTiO3-OH, 1@BaTiO3, 1@BaTiO3-a, 1@BaTiO3-OH)
The functionalization was performed as previously reported [20]. Anchoring ligand 1 (10.0 mg, 31.6 µmol, 1.0 eq.) and milliQ water (18 mL) were added to a microwave vial and dispersed by sonication for 1 min. Acid- or H2O2-activated NPs (449.0 mg, 4.6 SrTiO3 eq. or 7.3 BaTiO3) were added. The suspension was dispersed by sonication for 10 min. The microwave vial was sealed, and the reaction mixture was heated for 3 h at 130 °C in the microwave reactor. After cooling to room temperature, the suspension was centrifuged (20 min, 7000 rpm). The NPs were separated from the solvent and washed with EtOH (2 × 15 mL). This procedure gave white f-NPs (f-NP = functionalized NP) with the following yields: 1@SrTiO3-a NPs (418.3 mg), 1@SrTiO3-OH NPs (422.6 mg), 1@BaTiO3-a NPs (409.9 mg), 1@BaTiO3-OH NPs (425.1 mg), and these were stored in a sealed vial under N2 after drying the NPs under high vacuum. This reaction was repeated using pristine SrTiO3 and BaTiO3 NPs (224 mg, 4.6 SrTiO3 eq. or 7.3 BaTiO3 eq.) and 1 (5.0 mg, 15.8 µmol) yielding 1@SrTiO3 NPs (218.1 mg, 221.6 mg) and 1@BaTiO3 NPs (210.7 mg, 219.4 mg). For NMR spectroscopic measurements, NPs (5–10 mg) were dispersed in 500 µL D2O in an NMR tube. The characterization data are given in the Supplementary Materials. The TGA, TGA-MS, and MALDI spectra of the pristine (Figures S12–S17), acid-activated (Figures S18–S22), and H2O2-activated (Figures S23–S28) functionalized NPs are given in the Supplementary Materials.
2.2.4. Nanoparticle Surface Complexation (Ru@SrTiO3, Ru@BaTiO3)
The metal complex was formed directly on the NP surface. 1@SrTiO3 (70.9 mg), RuCl3.3H2O (1.03 mg, 3.94 µmol), and bpy (1.25 mg, 8.00 µmol) were added to a vial. H2O (5.0 mL) and EtOH (3.0 mL) were added, and the mixture was thoroughly dispersed using sonication and stirring. The suspension was transferred into an autoclave PTFE liner with additional EtOH (2.0 mL). The autoclave was sealed and then heated in an oven at a heating rate of 320 °C/h to 160 °C. The autoclave was left at 160 °C for 1 h. After cooling, the autoclave was opened, and the suspension was centrifuged (20 min, 7000 rpm). The resulting NPs were washed with H2O (3 × 10 mL) and EtOH (1 × 10 mL). Ru@SrTiO3 (65.8 mg) was obtained as a pale orange powder after drying the NPs under a high vacuum. This experiment was repeated with 1@BaTiO3 (70.9 mg), RuCl3.3H2O (1.03 mg, 3.95 µmol), and bpy (1.25 mg, 8.00 µmol) yielding Ru@BaTiO3 (67.0 mg) as a dark brown powder. The characterization data are given in the Supplementary Materials. The TGA, TGA-MS, and MALDI spectra are given in the Supplementary Materials (Figures S29–S34).
2.2.5. Nanoparticle Surface Complexation (rR@SrTiO3, rR@SrTiO3-a, rR@SrTiO3-OH, rR@SrTiO3-OH-A, rR@BaTiO3, rR@BaTiO3-a, rR@BaTiO3-OH, rR@BaTiO3-OH-A)
The notation is defined in Section 2.1. The metal complex was formed directly on the NP surface. This reaction was carried out with each isolated NP from Section 2.2.1 and Section 2.2.2. Hence, 1@SrTiO3, 1@SrTiO3-a NPs, 1@SrTiO3-OH, 1@BaTiO3, 1@BaTiO3-a, or 1@BaTiO3-OH (365.6 mg) was added to a vial with RuCl3.3H2O (0.24 mg, 0.9 µmol), RhCl3.3H2O (5.15 mg, 19.6 µmol), and bpy (6.45 mg, 41.3 µmol). H2O (5.0 mL) and EtOH (3.0 mL) were added, and the mixture was thoroughly dispersed using sonication and stirring. The suspension was transferred to an autoclave with a PTFE liner with additional EtOH (2.0 mL). The autoclave was sealed and then heated in an oven at a rate of 320 °C/h to 160 °C. The autoclave was left at 160 °C for 1 h. After cooling, the autoclave was opened, and the suspension was centrifuged (20 min, 7000 rpm). The resulting NPs were washed with H2O (3 × 10 mL) and EtOH (1 × 10 mL). After drying the NPs under high vacuum, the reaction yielded rR@SrTiO3 (354.2 mg) as a pale orange powder, rR@SrTiO3-a (358.2 mg) as a pale orange powder, rR@SrTiO3-OH (358.4 mg) as a grey powder, rR@BaTiO3 (349.9 mg) as a grey powder, rR@BaTiO3-a (356.9 mg) as a dark brown powder or rR@BaTiO3-OH (357.4 mg) as a dark grey powder. This reaction was repeated with 1@SrTiO3-OH and 1@BaTiO3-OH with a pH adjusted to 1.5 using 4.0 mL H2O, 1.0 mL aqueous H2SO4 (1 M), and the same amount of EtOH (5 mL). Other reaction conditions were kept the same. rR@SrTiO3-OH-A (356.0 mg) and rR@BaTiO3-OH-A (355.1 mg) were both isolated as a pale orange powder. The characterization data are given in the Supplementary Materials. The TGA, TGA-MS, and MALDI spectra of the pristine (Figures S36–S40), acid-activated (Figures S41–S45), H2O2-activated (Figures S46–S51), and H2O2-activated under adjusted pH (Figures S52–S55) functionalized, and ruthenium-, rhodium-, and bpy-complexed NPs are given in the Supplementary Materials. An FTIR reference spectrum (Figure S56) was recorded by mixing pristine SrTiO3 NPs (500 mg) with aqueous H2SO4 (200 µL, 3 M) using a mortar.
2.2.6. Dihydrogen Generation
The water reduction reaction conditions were consistent with the conditions in the previous work with TiO2 NPs [20]. Triethanolamine (TEOA) was added as a sacrificial electron donor, K2[PtCl4] as a catalyst to facilitate H2 formation (feasibly by the formation of Pt nanoparticles), bpy as an additive, aqueous H2SO4 for altering the solution pH. TEOA (2.52 mmol, 376 mg), K2[PtCl4] (1.7 µmol, 0.70 mg), and bpy (18.6 µmol, 2.91 mg) were added to a 5 mL microwave vial with milliQ water and aqueous H2SO4 (1 M) to modify the pH. The experiments were performed at pH 7.5 and used 1 mL aqueous H2SO4 (1 M) and 5 mL milliQ water. Metal complex-functionalized NPs were added (114.1 mg). The vial was flushed with N2 and then sealed. The suspension was sonicated (10 min) and thoroughly shaken. N2 was bubbled through the suspension for 10 min. The vial was irradiated using a sun simulator generating 1200 W m−2 (see the Supplementary Materials) for 4 h with an incident angle of light of 5°. The suspension was stirred throughout the irradiation and periodically shaken. Headspace samples for gas chromatography were collected using a syringe and transferred to a 10 mL GC vial for analysis. The measured GC integral was converted into mL of H2 with calibration performed by injecting several known volumes of H2.
3. Results and Discussion
3.1. NP Activation, Functionalization, Surface Complexation, and Material Characterization
3.1.1. NP Surface Activation
The surface activation of NPs is a crucial step for successful and stable surface functionalization. We previously described the benefits of acid activation of TiO2 NPs for their use in catalysis [20]. However, in the literature, other methods are also described, including using various acids (e.g., MeCO2H or HF), hydrogen peroxide, or plasma for surface activation [49,50,51]. These methods are used to enhance the surface reactivity and make the surface more reactive for functionalization. TiO2 and SrTiO3 NPs are acid-resistant, whereas BaTiO3 NPs are sensitive to mineral acids. Hence, as described in Section 2.2.1, during acid activation with aqueous HNO3 (3 M), the BaTiO3 NPs partially dissolved or were lost during washing (70%). Since acid activation was unsuitable for the BaTiO3 NPs, other activation methods were explored, and activation using the H2O2 treatment [49] was chosen. This method simultaneously saturates the surface with hydroxyl groups and strips it of carbonate groups. Although the literature protocol required hydroxyl groups for a salinization reaction [49], the hydroxyl groups should also favor condensation with the phosphonic acid of the anchoring ligand.
Activation was performed with both SrTiO3 and BaTiO3 by boiling the dispersed NPs under N2 in 30% H2O2. The particles were washed with water and then dried for 72 h under high vacuum. The pristine and activated NPs were characterized using FTIR and TGA-MS. The FTIR differences shown in Figure 1 were limited to the fingerprint region. For the pristine SrTiO3 activated with H2O2, an additional absorption at 1446 cm−1 appeared. The pristine BaTiO3 activated with acid showed the disappearance of a prominent peak at 1420 cm−1, while the activation with H2O2 caused the peak to shift and broaden.
The TGA-MS results are reported in Table 1. A comparison of the pristine SrTiO3 and BaTiO3 NPs with acid-activated NPs (SrTiO3 and BaTiO3) shows that there was a slight increase in the weight loss (0.1–0.4%) in the lower temperature region (<380 °C). The NPs activated with H2O2 showed a greater weight loss than the pristine NPs, with an increase in the lower temperature region of 1.2% or 2.2% for SrTiO3 and BaTiO3. Using TGA-MS, a peak with amu 18 (H2O) was found in each sample and assigned to physisorbed and chemisorbed water. For H2O2-activated NPs, this increase could also be due to the loss of the hydroxyl groups. The pristine NPs and H2O2-activated NPs showed organic decomposition products (amu 44, CO2) throughout the TGA experiment, possibly due to impurities in the pristine samples; this was especially visible for BaTiO3.
In the higher temperature region (380–900 °C), H2O2-activated SrTiO3 and BaTiO3 NPs also showed slightly higher weight losses (0.2%) than the pristine NPs. The acid-activated SrTiO3 and BaTiO3 NPs showed slightly higher (0.6%) and lower (0.1%) weight losses, respectively. In both cases, the TGA-MS experiment recorded a significant weight loss at ~550 °C attributed to amu 44 (CO2), and, in the case of SrTiO3-a, a mass loss at amu 81 was also observed. The TGA-MS experiment on SrTiO3-a is illustrated in Figure 2 as an example of the sharp weight loss. The origin of this weight loss is unclear.
3.1.2. Nanoparticle Surface Ligand Functionalization
The bpy metal-binding domain in ligand 1 (Scheme 1) was chosen for the surface assembly of {M(bpy)3}n+ (M = Ru, n = 2; M = Rh, n = 3) moieties. Phosphonic acids bind strongly to BaTiO3 NP surfaces [47], and it is reasonable to assume a similar behavior with SrTiO3 NPs. The pristine BaTiO3 and SrTiO3 NPs had 50 and 100 nm diameters, respectively, making them larger than the p25 TiO2 NPs used in previous work [20,52,53]. This difference significantly changes the surface area from a volume ratio of 0.28 nm−1 for TiO2 to 0.12 nm−1 and 0.06 nm−1 for BaTiO3 and SrTiO3, respectively. This reduces the available surface area and necessitates functionalization adjustments to avoid the free ligand’s physisorption. Section 2.2.3 details the functionalization methods adopted. The NPs were characterized using 1H NMR spectroscopy, FTIR, TGA-MS, MALDI-MS, and solid-state absorption spectroscopy. The TGA-MS results are presented in Table 2 and show higher weight losses than the corresponding unfunctionalized NPs in the high-temperature region (380–900 °C), indicating successful surface functionalization. When compared to TiO2, the weight loss due to functionalization was smaller (0.2–0.7% versus 2.6%) [20] than expected since the SrTiO3 and BaTiO3 NPs had considerably larger particle sizes. The NPs all showed carbon-containing impurities before functionalization, as described in Section 3.1.1. Based on the TGA-MS experiments in the low-temperature region, the impurities were lost during the functionalization. Figure 3 shows the TGA-MS measurement of 1@SrTiO3-a, where ligand 1 was decomposed in a single event distinct from the decompositions recorded in the starting material. The TGA-MS measurement of 1@SrTiO3 still shows the peak observed for SrTiO3-a at ~550 °C with an additional weight loss between 700 °C and 880 °C. The TGA-MS in this region shows amu 18 (H2O) and 44 (CO2), corresponding to a decomposition of the anchoring ligand 1.
The FTIR spectra of the f-NPs (Figure 4) showed a broad, weak absorption around 3300 cm−1, in accordance with the TGA-MS results, supporting the presence of hydroxy groups. The NPs also exhibited a strong absorption at 540 cm−1 and 500 cm−1 for SrTiO3 and BaTiO3, respectively. Compared to the unfunctionalized NPs, 1@SrTiO3 and 1@BaTiO3 (independent of prior activation) showed several absorptions in the range 1900 cm−1 to 900 cm−1, indicating a bound ligand. The possibility of traces of an absorbed and labile species being on the NP surface after the functionalization was excluded based on the 1H NMR spectroscopy.
The solid-state absorption spectra used the pristine NPs (SrTiO3 or BaTiO3) as the 100% baseline, and the results are shown in Figure 5. The f-NPs showed a broad weak absorption between 400 and 700 nm. These results are similar to the solid-state absorption spectra of the ligand 1-functionalized TiO2 NPs [20].
3.1.3. Nanoparticle Surface Complexation
For all complexations, the f-NPs were dispersed in an autoclave in a mixture of H2O/EtOH together with RuCl3.3H2O, RhCl3.3H2O, and bpy (see Section 2.2.4 and Section 2.2.5 for detailed procedures). Depending on the activation of the NPs and the pH during the complexation, differently colored NPs with different catalytic activities were isolated. The ruthenium and rhodium metal complex-bearing NPs were tested for their ability to catalyze dihydrogen production from water under irradiation using simulated sunlight. The method was also utilized with only RuCl3.3H2O to prepare Ru@SrTiO3 and Ru@BaTiO3. The isolated f-NPs are shown in Figure 6 and were characterized using 1H NMR spectroscopy, FTIR, TGA-MS, MALDI-MS, and solid-state absorption spectroscopy.
TGA-MS revealed an increased weight loss of the complex-bearing NPs when comparing them to ligand-functionalized NPs. The results are shown in Table 3. The greater weight loss for the metal complexed f-NPs compared to the ligand f-NPs in the high-temperature region (380–900 °C) was rather low (0.2–0.5%). This provides evidence for the low degree of functionalization compared to the equivalent functionalized TiO2 NPs [20].
A successful complexation was expected to result in additional decomposition in the TGA-MS. Hence, the TGA-MS data of SrTiO3-a (Figure 2) and 1@SrTiO3-a (Figure 3) to rR@SrTiO3-a (Figure 7) were used to identify the decomposition processes. Using the ion current of CO2, amu 44 (Figure 7, green), the decompositions can be differentiated from the starting material. The decomposition of rR@SrTiO3-a occurred at a slightly lower temperature (~650 °C) than the recorded decomposition for 1@SrTiO3-a (~800 °C) and higher than the impurity recorded with SrTiO3-a (~550 °C).
In further experiments with 1@SrTiO3-OH and 1@BaTiO3-OH, the pH for the complexation reaction in the autoclave was adjusted from 6.9 to 1.5 with aqueous H2SO4. The resulting NPs showed large weight loss increases in the high-temperature region of 4.0% (Figure 8, bottom, labeled rR@SrTiO3-OH-A) and 6.1% (Figure 8, top, rR@BaTiO3-OH-A). However, the TGA-MS showed peaks at amu 48 (SO) and 64 (SO2) at 750 °C, suggesting the surface binding of H2SO4 [54]. The presence of amu 44 (CO2, Figure 8) suggests an organic decomposition, indicating that the decomposition of H2SO4 was not the main cause of the weight loss. The main weight loss occurred at ~700 °C, corresponding to the decomposition also observed for rR@SrTiO3-a. The earlier decomposition at ~550 °C and ~800 °C was not observed for rR@SrTiO3-OH-A. For rR@BaTiO3-OH-A, an additional decomposition at ~900 °C was observed. 1H NMR spectroscopy was used to verify the absence of a non-bound anchoring ligand in all cases.
The solid-state absorption spectra of the complexed NPs are shown in Figure 9. In the case of SrTiO3, the spectrum of the metal complex f-NPs (Figure 9, left) shows a broad absorption between 410 nm and 480 nm, with weaker absorptions between 500 and 700 nm. These generally agree with the absorption spectra for the corresponding TiO2 NPs [20]. However, rR@SrTiO3-OH NPs (Figure 9, left, violet) exhibited more intense absorptions in the regions 540–570, 600–620, and 660–680 nm. As these NPs were grey to black, a panchromatic absorption was to be expected. Metal complex f-NPs with BaTiO3 NPs (Figure 9, right) showed similar panchromatic adsorption. For rR@BaTiO3-OH-A (Figure 9, right, red), absorptions between 600–620 and 660–680 nm were less intense than other NPs, in accordance with their pale orange color.
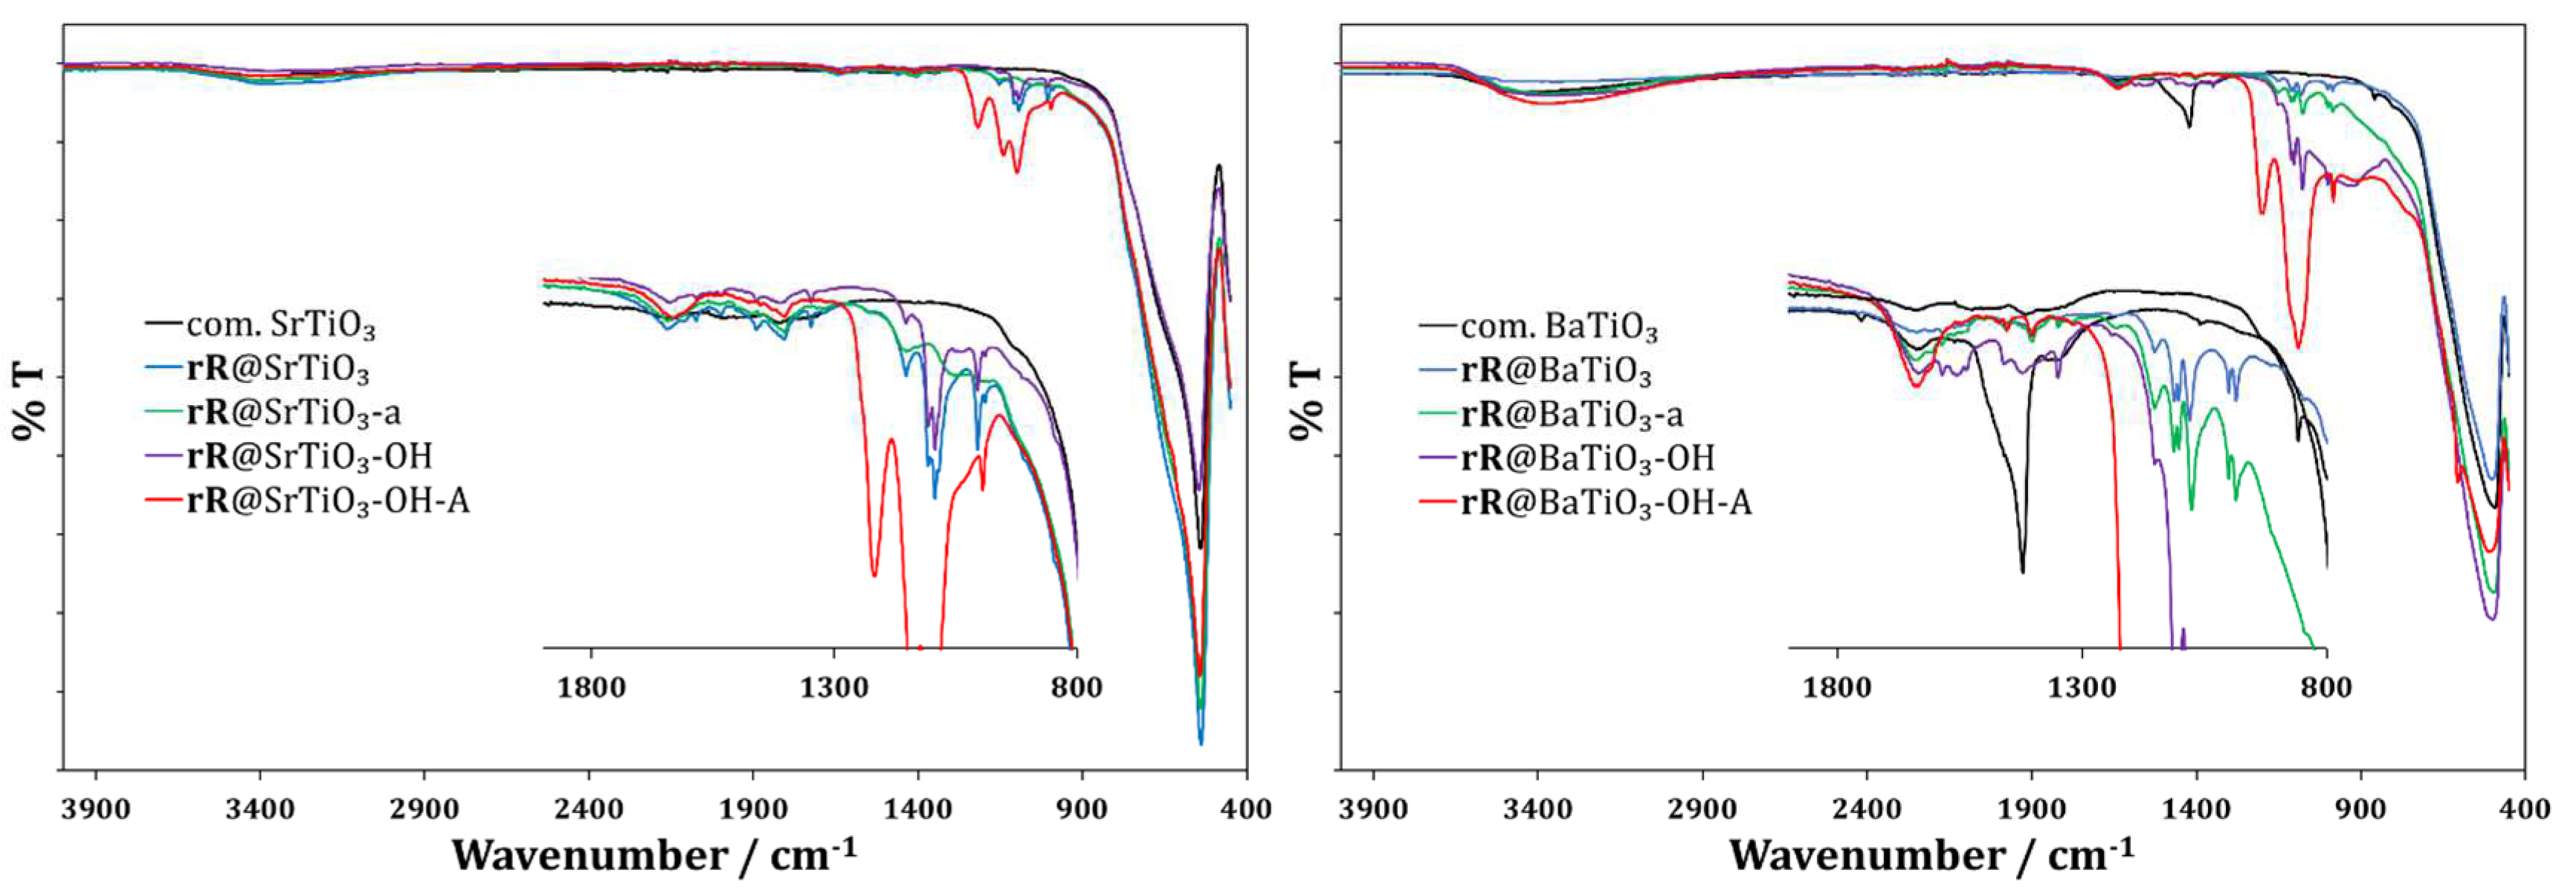
Figure 10 shows the FTIR spectra of rR@SrTiO3 (left, blue) and rR@BaTiO3 (right, blue) and their variants (-a, green; -OH, violet; -OH-A, red). Overall, the FTIR spectra of all metal complex f-NPs of SrTiO3 and BaTiO3 were similar (except for rR@SrTiO3-OH-A and rR@BaTiO3-OH-A). In addition, the spectra were very similar to that of the anchoring ligand f-NPs described in Section 3.1.2, with only small differences in the fingerprint region (1900 to 900 cm−1). In contrast, the FTIR spectra of rR@SrTiO3-OH-A and rR@BaTiO3-OH-A showed strong absorptions at 1219, 1141, and 1100 and at 1200 and 1091 cm−1, respectively, due to the presence of H2SO4 on the NP surface. This was confirmed by recording an FTIR spectrum of a mixture of pristine SrTiO3 NPs and aqueous H2SO4 (see Supplementary Materials, Figure S56).
As expected, attempts to quantify the ruthenium or rhodium content of the functionalized NPs using energy-dispersive X-ray (EDX) spectroscopy were unsuccessful, as the expected values were below the 1% detection limit.
3.2. Dihydrogen Generation from Water
General Procedure
The experimental details of these studies are given in Section 2.2.6, and the results are collected in Table 4. The f-NPs that produced dihydrogen showed the characteristic red color of a {Ru(bpy)3}2+ chromophore, while f-NPs that were either grey or black either did not produce H2 or did so with low efficiency. BaTiO3 NPs and SrTiO3 NPs activated with H2O2, functionalized with ligand 1 and then complexed with RuCl3.3H2O and RhCl3.3H2O were less active for water reduction. This indicates minimal or no formation of the required photocatalyst(s) on the surface.
As discussed in our previous paper [20], surface functionalization is increased by the HNO3 treatment, leading to more active catalytic sites on the surface and greater hydrogen production.
4. Conclusions
We explored activation methods for SrTiO3 and BaTiO3 NPs using H2O2 and aqueous HNO3. Pristine and activated SrTiO3 and BaTiO3 NPs were functionalized with anchoring ligand 1 and subsequently elaborated using RuCl3.3H2O and bpy, RhCl3.3H2O and bpy, or RuCl3.3H2O. The potentially photo- and redox-active Rh and Ru surface-bound metal complex f-NPs were used in a photochemical system for the solar generation of H2 from water. BaTiO3 NPs and SrTiO3 NPs activated with H2O2, functionalized with ligand 1, and then complexed with RuCl3.3H2O and RhCl3.3H2O yielded f-NPs that were inactive for water reduction. rR@SrTiO3-a was the most efficient within our tested materials, giving 1.1 mL H2 per hour, with rR@SrTiO3 being roughly two-thirds as efficient. The complexation of the metal species to the H2O2-activated and ligand-functionalized NPs was modified by adjusting the pH to 1.5 with aqueous H2SO4. The resulting orange SrTiO3 and BaTiO3 NPs were active for water reduction and produced H2. rR@SrTiO3-OH-A were considerably less active than rR@SrTiO3 or rR@SrTiO3-a, while rR@BaTiO3-OH-A performed better than rR@BaTiO3-a. Hence, pH seems to be more important during complexation than previously thought, and adjusting it can play a major role. It is unclear if the drop in efficiency for rR@SrTiO3-OH-A was due to residual H2SO4 influencing the pH of the suspension during the water reduction or if complexation was impacted. For rR@BaTiO3-OH-A, the solid-state absorption spectroscopic data and the red color of the functionalized NPs further suggest the formation of surface-bound {Ru(bpy)3}2+ chromophores.
We conclude that extensively functionalized SrTiO3 or BaTiO3 NPs may perform better than TiO2 NPs for water reduction. However, the former NPs are more expensive than TiO2, and cost-benefit and scale-up limitations should be explored. Particle size might also play a significant role in surface loading, and we note that the pristine BaTiO3 and SrTiO3 NPs had 2 to 4 times larger radii than the TiO2 NPs. This work included the characterization of activated f-NPs and metal complex f-NPs using FTIR spectroscopy, solid-state absorption spectroscopy, and TGA-MS, providing evidence for successful functionalization.
Supplementary Materials
The following supporting information can be downloaded at: https://www.mdpi.com/article/10.3390/nano13142094/s1. Details of instrumentation and procedure, characterization details. Figures S1–S4: TGA and TGA-MS spectra for pristine NPs (SrTiO3, BaTiO3). Figures S5–S7: TGA and TGA-MS spectra for acid-activated NPs (SrTiO3-a, BaTiO3-a). Figures S8–S11: TGA and TGA-MS spectra for H2O2-activated NPs (SrTiO3-OH, BaTiO3-OH). Figures S12–S17: TGA, TGA-MS, and MALDI spectra for pristine with ligand 1-functionalized NPs (1@SrTiO3, 1@BaTiO3). Figures S18–S22: TGA, TGA-MS, and MALDI spectra for acid-activated with ligand 1-functionalized NPs (1@SrTiO3-a, 1@BaTiO3-a). Figures S23–S28: TGA, TGA-MS, and MALDI spectra for H2O2-activated with ligand 1-functionalized NPs (1@SrTiO3-OH, 1@BaTiO3-OH). Figures S29–S35: TGA, TGA-MS, and MALDI spectra for pristine with ligand 1-functionalized NPs and ruthenium- and bpy-complexed NPs (Ru@SrTiO3, Ru@BaTiO3). Figures S36–S40: TGA, TGA-MS, and MALDI spectra for pristine with ligand 1-functionalized NPs and ruthenium-, rhodium-, and bpy-complexed NPs (rR@SrTiO3, rR@BaTiO3). Figure S41–S45: TGA, TGA-MS, and MALDI spectra for acid-activated with ligand 1-functionalized NPs and ruthenium-, rhodium-, and bpy-complexed NPs (rR@SrTiO3-a, rR@BaTiO3-a). Figures S46–S51: TGA, TGA-MS, and MALDI spectra for H2O2-activated with ligand 1-functionalized NPs and ruthenium-, rhodium-, and bpy-complexed NPs (rR@SrTiO3-OH, rR@BaTiO3-OH). Figures S52–S55: TGA and MALDI spectra for H2O2-activated with ligand 1-functionalized NPs and under adjusted pH with ruthenium-, rhodium-, and bpy-complexed NPs (rR@SrTiO3-OH-A, rR@BaTiO3-OH-A) Figure S56. FTIR spectra of commercial SrTiO3 NPs mixed with aqueous H2SO4.
Author Contributions
Methodology, investigation, formal analysis, writing of original draft: S.A.F.; manuscript, review and editing: C.E.H. and E.C.C.; supervision, project management, funding acquisition: C.E.H. and E.C.C. All authors have read and agreed to the published version of the manuscript.
Funding
This research was funded by the University of Basel.
Data Availability Statement
Data are available from the authors upon request.
Acknowledgments
We acknowledge support from the University of Basel.
Conflicts of Interest
The authors declare no conflict of interest.
References
- Available online: https://www.ipcc.ch/sr15/download/#full (accessed on 4 November 2022).
- Available online: https://www.giss.nasa.gov/projects/impacts/ (accessed on 4 November 2022).
- Available online: https://climate.nasa.gov/news/2865/a-degree-of-concern-why-global-temperatures-matter (accessed on 4 November 2022).
- Solomon, S.; Plattner, G.-K.; Knutti, R.; Friedlingstein, P. Irreversible climate change due to carbon dioxide emissions. Proc. Natl. Acad. Sci. USA 2009, 106, 1704–1709. [Google Scholar] [CrossRef] [PubMed]
- Raftery, A.E.; Zimmer, A.; Frierson, D.M.W.; Startz, R.; Liu, P. Less than 2 °C warming by 2100 unlikely. Nat. Clim. Change 2017, 7, 637–641. [Google Scholar] [CrossRef] [PubMed]
- Kang, J.-N.; Wei, Y.-M.; Liu, L.-C.; Han, R.; Yu, B.-Y.; Wang, J.-W. Energy systems for climate change mitigation: A systematic review. Appl. Energy 2020, 263, 114602. [Google Scholar] [CrossRef]
- Rivard, E.; Trudeau, M.; Zaghib, K. Hydrogen Storage for Mobility: A Review. Materials 2019, 12, 1973. [Google Scholar] [CrossRef] [Green Version]
- Johnson, T.C.; Morris, D.J.; Wills, M. Hydrogen generation from formic acid and alcohols using homogeneous catalysts. Chem. Soc. Rev. 2010, 39, 81–88. [Google Scholar] [CrossRef]
- Chen, S.; Takata, T.; Domen, K. Particulate photocatalysts for overall water splitting. Nat. Rev. Mater. 2017, 2, 17050. [Google Scholar] [CrossRef]
- Mei, B.; Han, K.; Mul, G. Driving Surface Redox Reactions in Heterogeneous Photocatalysis: The Active State of Illuminated Semiconductor-Supported Nanoparticles during Overall Water-Splitting. ACS Catal. 2018, 8, 9154–9164. [Google Scholar] [CrossRef] [Green Version]
- Chen, Y.; Wang, M.; Xiang, S.; Liu, J.; Feng, S.; Wang, C.; Zhang, N.; Feng, T.; Yang, M.; Zhang, K.; et al. Hierarchical Hollow Nanocages Derived from Polymer/Cobalt Complexes for Electrochemical Overall Water Splitting. ACS Sustain. Chem. Eng. 2019, 7, 10912–10919. [Google Scholar] [CrossRef]
- Wang, Z.; Li, C.; Domen, K. Recent developments in heterogeneous photocatalysts for solar-driven overall water splitting. Chem. Soc. Rev. 2019, 48, 2109–2125. [Google Scholar] [CrossRef]
- Maleki, A.; Taheri-Ledari, R.; Ghalavand, R.; Firouzi-Haji, R. Palladium-decorated o-phenylenediamine-functionalized Fe3O4/SiO2 magnetic nanoparticles: A promising solid-state catalytic system used for Suzuki–Miyaura coupling reactions. J. Phys. Chem. 2020, 136, 109200. [Google Scholar] [CrossRef]
- Hassan, A.F.; Elhadidy, H. Effect of Zr+4 doping on characteristics and sonocatalytic activity of TiO2/carbon nanotubes composite catalyst for degradation of chlorpyrifos. J. Phys. Chem. 2019, 129, 180–187. [Google Scholar] [CrossRef]
- Sajjadi, S.; Khataee, A.; Darvishi Cheshmeh Soltani, R.; Hasanzadeh, A. N, S co-doped graphene quantum dot–decorated Fe3O4 nanostructures: Preparation, characterization and catalytic activity. J. Phys. Chem. 2019, 127, 140–150. [Google Scholar] [CrossRef]
- Stevens, P.D.; Fan, J.; Gardimalla, H.M.R.; Yen, M.; Gao, Y. Superparamagnetic Nanoparticle-Supported Catalysis of Suzuki Cross-Coupling Reactions. Org. Lett. 2005, 7, 2085–2088. [Google Scholar] [CrossRef] [PubMed]
- Adriano Zecchina, S.B.; Groppo, E. Selective Nanocatalysts and Nanoscience: Concepts for Heterogeneous and Homogeneous Catalysis; Wiley: Weinheim, Germany, 2011. [Google Scholar]
- Samira Bagheri, N.M.J. Nanocatalysts in Environmental Applications; Springer: Cham, Switzerland, 2018. [Google Scholar]
- Albonetti, S.; Mazzoni, R.; Cavani, F. Ch. 1 Homogeneous, Heterogeneous and Nanocatalysis. In Transition Metal Catalysis in Aerobic Alcohol Oxidation; Cardona, F., Parmeggiani, C., Eds.; Green Chemistry Series; RSC: New York, NY, USA, 2015; pp. 1–39. [Google Scholar]
- Freimann, S.A.; Housecroft, C.E.; Constable, E.C. Attraction in Action: Reduction of Water to Dihydrogen Using Surface-Functionalized TiO2 Nanoparticles. Nanomaterials 2022, 12, 789. [Google Scholar] [CrossRef] [PubMed]
- Emsley, J. The Elements, 3rd ed.; Oxford University Press Inc.: New York, NY, USA, 1994. [Google Scholar]
- Available online: https://pubs.usgs.gov/pp/0440d/report.pdf (accessed on 17 October 2022).
- Ober, J.A.; McRae, M.E.; Gambogi, J. Mineral Commodity Summaries 2021; U.S. Geological Survey: Reston, VA, USA, 2021; p. 200. [Google Scholar]
- Konstas, P.-S.; Konstantinou, I.; Petrakis, D.; Albanis, T. Development of SrTiO3 Photocatalysts with Visible Light Response Using Amino Acids as Dopant Sources for the Degradation of Organic Pollutants in Aqueous Systems. Catalysts 2018, 8, 528. [Google Scholar] [CrossRef] [Green Version]
- Kappadan, S.; Gebreab, T.W.; Thomas, S.; Kalarikkal, N. Tetragonal BaTiO3 nanoparticles: An efficient photocatalyst for the degradation of organic pollutants. Mater. Sci. Semicond. Process 2016, 51, 42–47. [Google Scholar] [CrossRef]
- Xiong, X.; Tian, R.; Lin, X.; Chu, D.; Li, S. Formation and Photocatalytic Activity of BaTiO3 Nanocubes via Hydrothermal Process. J. Nanomater. 2015, 2015, 692182. [Google Scholar] [CrossRef] [Green Version]
- Konta, R.; Ishii, T.; Kato, H.; Kudo, A. Photocatalytic Activities of Noble Metal Ion Doped SrTiO3 under Visible Light Irradiation. J. Phys. Chem. B 2004, 108, 8992–8995. [Google Scholar] [CrossRef]
- Rohj, R.K.; Hossain, A.; Mahadevan, P.; Sarma, D.D. Band Gap Reduction in Ferroelectric BaTiO3 through Heterovalent Cu-Te Co-Doping for Visible-Light Photocatalysis. Front. Chem. 2021, 9, 682979. [Google Scholar] [CrossRef]
- Chen, P.; Li, X.; Ren, Z.; Wu, J.; Li, Y.; Liu, W.; Li, P.; Fu, Y.; Ma, J. Enhancing Photocatalysis of Ag Nanoparticles Decorated BaTiO3 Nanofibers through Plasmon-Induced Resonance Energy Transfer Turned by Piezoelectric Field. Catalysts 2022, 12, 987. [Google Scholar] [CrossRef]
- Ma, L.; Sun, T.; Cai, H.; Zhou, Z.-Q.; Sun, J.; Lu, M. Enhancing photocatalysis in SrTiO3 by using Ag nanoparticles: A two-step excitation model for surface plasmon-enhanced photocatalysis. J. Chem. Phys. 2015, 143, 084706. [Google Scholar] [CrossRef] [PubMed]
- Jiang, J.; Kato, K.; Fujimori, H.; Yamakata, A.; Sakata, Y. Investigation on the highly active SrTiO3 photocatalyst toward overall H2O splitting by doping Na ion. J. Catal. 2020, 390, 81–89. [Google Scholar] [CrossRef]
- Lyu, H.; Hisatomi, T.; Goto, Y.; Yoshida, M.; Higashi, T.; Katayama, M.; Takata, T.; Minegishi, T.; Nishiyama, H.; Yamada, T.; et al. An Al-doped SrTiO3 photocatalyst maintaining sunlight-driven overall water splitting activity for over 1000 h of constant illumination. Chem. Sci. 2019, 10, 3196–3201. [Google Scholar] [CrossRef] [Green Version]
- Alex, K.V.; Prabhakaran, A.; Jayakrishnan, A.R.; Kamakshi, K.; Silva, J.P.B.; Sekhar, K.C. Charge Coupling Enhanced Photocatalytic Activity of BaTiO3/MoO3 Heterostructures. ACS Appl. Mater. Interfaces 2019, 11, 40114–40124. [Google Scholar] [CrossRef] [PubMed]
- Fazli, A.; Zakeri, F.; Khataee, A.; Orooji, Y. A BaTiO3/WS2 composite for piezo-photocatalytic persulfate activation and ofloxacin degradation. Commun. Chem. 2022, 5, 95. [Google Scholar] [CrossRef]
- Yadav, A.A.; Hunge, Y.M.; Mathe, V.L.; Kulkarni, S.B. Photocatalytic degradation of salicylic acid using BaTiO3 photocatalyst under ultraviolet light illumination. J. Mater. Sci. Mater. 2018, 29, 15069–15073. [Google Scholar] [CrossRef]
- Kato, K.; Jiang, J.; Sakata, Y.; Yamakata, A. Effect of Na-Doping on Electron Decay Kinetics in SrTiO3 Photocatalyst. ChemCatChem 2019, 11, 6349–6354. [Google Scholar] [CrossRef]
- Qin, Y.; Fang, F.; Xie, Z.; Lin, H.; Zhang, K.; Yu, X.; Chang, K. La,Al-Codoped SrTiO3 as a Photocatalyst in Overall Water Splitting: Significant Surface Engineering Effects on Defect Engineering. ACS Catal. 2021, 11, 11429–11439. [Google Scholar] [CrossRef]
- Moss, B.; Wang, Q.; Butler, K.T.; Grau-Crespo, R.; Selim, S.; Regoutz, A.; Hisatomi, T.; Godin, R.; Payne, D.J.; Kafizas, A.; et al. Linking in situ charge accumulation to electronic structure in doped SrTiO3 reveals design principles for hydrogen-evolving photocatalysts. Nat. Mater. 2021, 20, 511–517. [Google Scholar] [CrossRef]
- Fan, Y.; Liu, Y.; Cui, H.; Wang, W.; Shang, Q.; Shi, X.; Cui, G.; Tang, B. Photocatalytic Overall Water Splitting by SrTiO3 with Surface Oxygen Vacancies. Nanomaterials 2020, 10, 2572. [Google Scholar] [CrossRef]
- Maeda, K. Rhodium-Doped Barium Titanate Perovskite as a Stable p-Type Semiconductor Photocatalyst for Hydrogen Evolution under Visible Light. ACS Appl. Mater. Interfaces 2014, 6, 2167–2173. [Google Scholar] [CrossRef]
- Fujisawa, J.-I.; Eda, T.; Hanaya, M. Comparative study of conduction-band and valence-band edges of TiO2, SrTiO3, and BaTiO3 by ionization potential measurements. Chem. Phys. Lett. 2017, 685, 23–26. [Google Scholar] [CrossRef]
- Liao, D.L.; Wu, G.S.; Liao, B.Q. Zeta potential of shape-controlled TiO2 nanoparticles with surfactants. Colloids Surf. 2009, 348, 270–275. [Google Scholar] [CrossRef]
- Bhagya, N.P.; Prashanth, P.A.; Raveendra, R.S.; Sathyanarayani, S.; Ananda, S.; Nagabhushana, B.M.; Nagabhushana, H. Adsorption of hazardous cationic dye onto the combustion derived SrTiO3 nanoparticles: Kinetic and isotherm studies. J. Asian Ceram. Soc. 2016, 4, 68–74. [Google Scholar] [CrossRef] [Green Version]
- Cai, J.; Wei, H.; Zhang, Y.; Cai, R.; Zhang, X.; Wang, Y.; Liu, J.; Tan, H.H.; Xie, T.; Wu, Y. Designed Construction of SrTiO3/SrSO4/Pt Heterojunctions with Boosted Photocatalytic H2 Evolution Activity. Eur. J. Chem. 2021, 27, 7300–7306. [Google Scholar] [CrossRef]
- Olhero, S.M.; Kaushal, A.; Ferreira, J.M.F. Preventing hydrolysis of BaTiO3 powders during aqueous processing and of bulk ceramics after sintering. J. Eur. Ceram. Soc. 2015, 35, 2471–2478. [Google Scholar] [CrossRef] [Green Version]
- Luan, W.; Gao, L. Influence of pH value on properties of nanocrystalline BaTiO3 powder. Ceram. Int. 2001, 27, 645–648. [Google Scholar] [CrossRef]
- Ye, H.-J.; Shao, W.-Z.; Zhen, L. Tetradecylphosphonic acid modified BaTiO3 nanoparticles and its nanocomposite. Colloids Surf. A Physicochem. Eng. Asp. 2013, 427, 19–25. [Google Scholar] [CrossRef]
- Rechberger, F.; Ilari, G.; Willa, C.; Tervoort, E.; Niederberger, M. Processing of Cr doped SrTiO3 nanoparticles into high surface area aerogels and thin films. Mater. Chem. Front. 2017, 1, 1662–1667. [Google Scholar] [CrossRef]
- Čulić-Viskota, J.; Dempsey, W.P.; Fraser, S.E.; Pantazis, P. Surface functionalization of barium titanate SHG nanoprobes for in vivo imaging in zebrafish. Nat. Protoc. 2012, 7, 1618–1633. [Google Scholar] [CrossRef]
- Pujari, S.P.; Scheres, L.; Marcelis, A.T.M.; Zuilhof, H. Covalent Surface Modification of Oxide Surfaces. Angew. Chem. Int. Ed. Engl. 2014, 53, 6322–6356. [Google Scholar] [CrossRef] [PubMed]
- Kim, B.; Park, S.W.; Kim, J.-Y.; Yoo, K.; Lee, J.A.; Lee, M.-W.; Lee, D.-K.; Kim, J.Y.; Kim, B.; Kim, H.; et al. Rapid Dye Adsorption via Surface Modification of TiO2 Photoanodes for Dye-Sensitized Solar Cells. ACS Appl. Mater. Interfaces 2013, 5, 5201–5207. [Google Scholar] [CrossRef] [PubMed]
- Freimann, S.A.; Zare, D.; Housecroft, C.E.; Constable, E.C. The SALSAC approach: Comparing the reactivity of solvent-dispersed nanoparticles with nanoparticulate surfaces. Nanoscale Adv. 2020, 2, 679–690. [Google Scholar] [CrossRef] [PubMed]
- Freimann, S.A.; Prescimone, A.; Housecroft, C.E.; Constable, E.C. Turning over on sticky balls: Preparation and catalytic studies of surface-functionalized TiO2 nanoparticles. RSC Adv. 2021, 11, 5537–5547. [Google Scholar] [CrossRef]
- Available online: https://webbook.nist.gov/cgi/cbook.cgi?ID=C7664939&Mask=200#Mass-Spec (accessed on 17 October 2022).
Scheme 1.
Anchoring ligand 1.
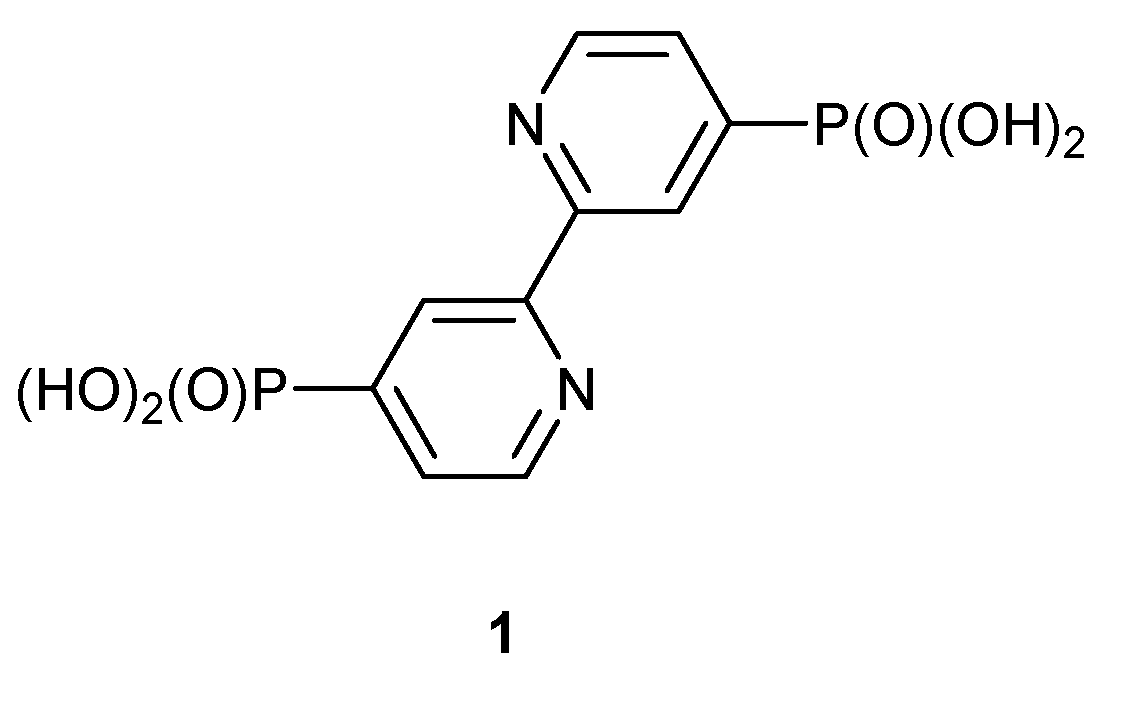
Figure 1.
FTIR spectra of pristine SrTiO3 NPs (left, blue), SrTiO3-a NPs (left, green), SrTiO3-OH NPs (left, violet); pristine BaTiO3 (right, blue), BaTiO3-a NPs (right, green), BaTiO3-OH NPs (right, violet).
Figure 1.
FTIR spectra of pristine SrTiO3 NPs (left, blue), SrTiO3-a NPs (left, green), SrTiO3-OH NPs (left, violet); pristine BaTiO3 (right, blue), BaTiO3-a NPs (right, green), BaTiO3-OH NPs (right, violet).
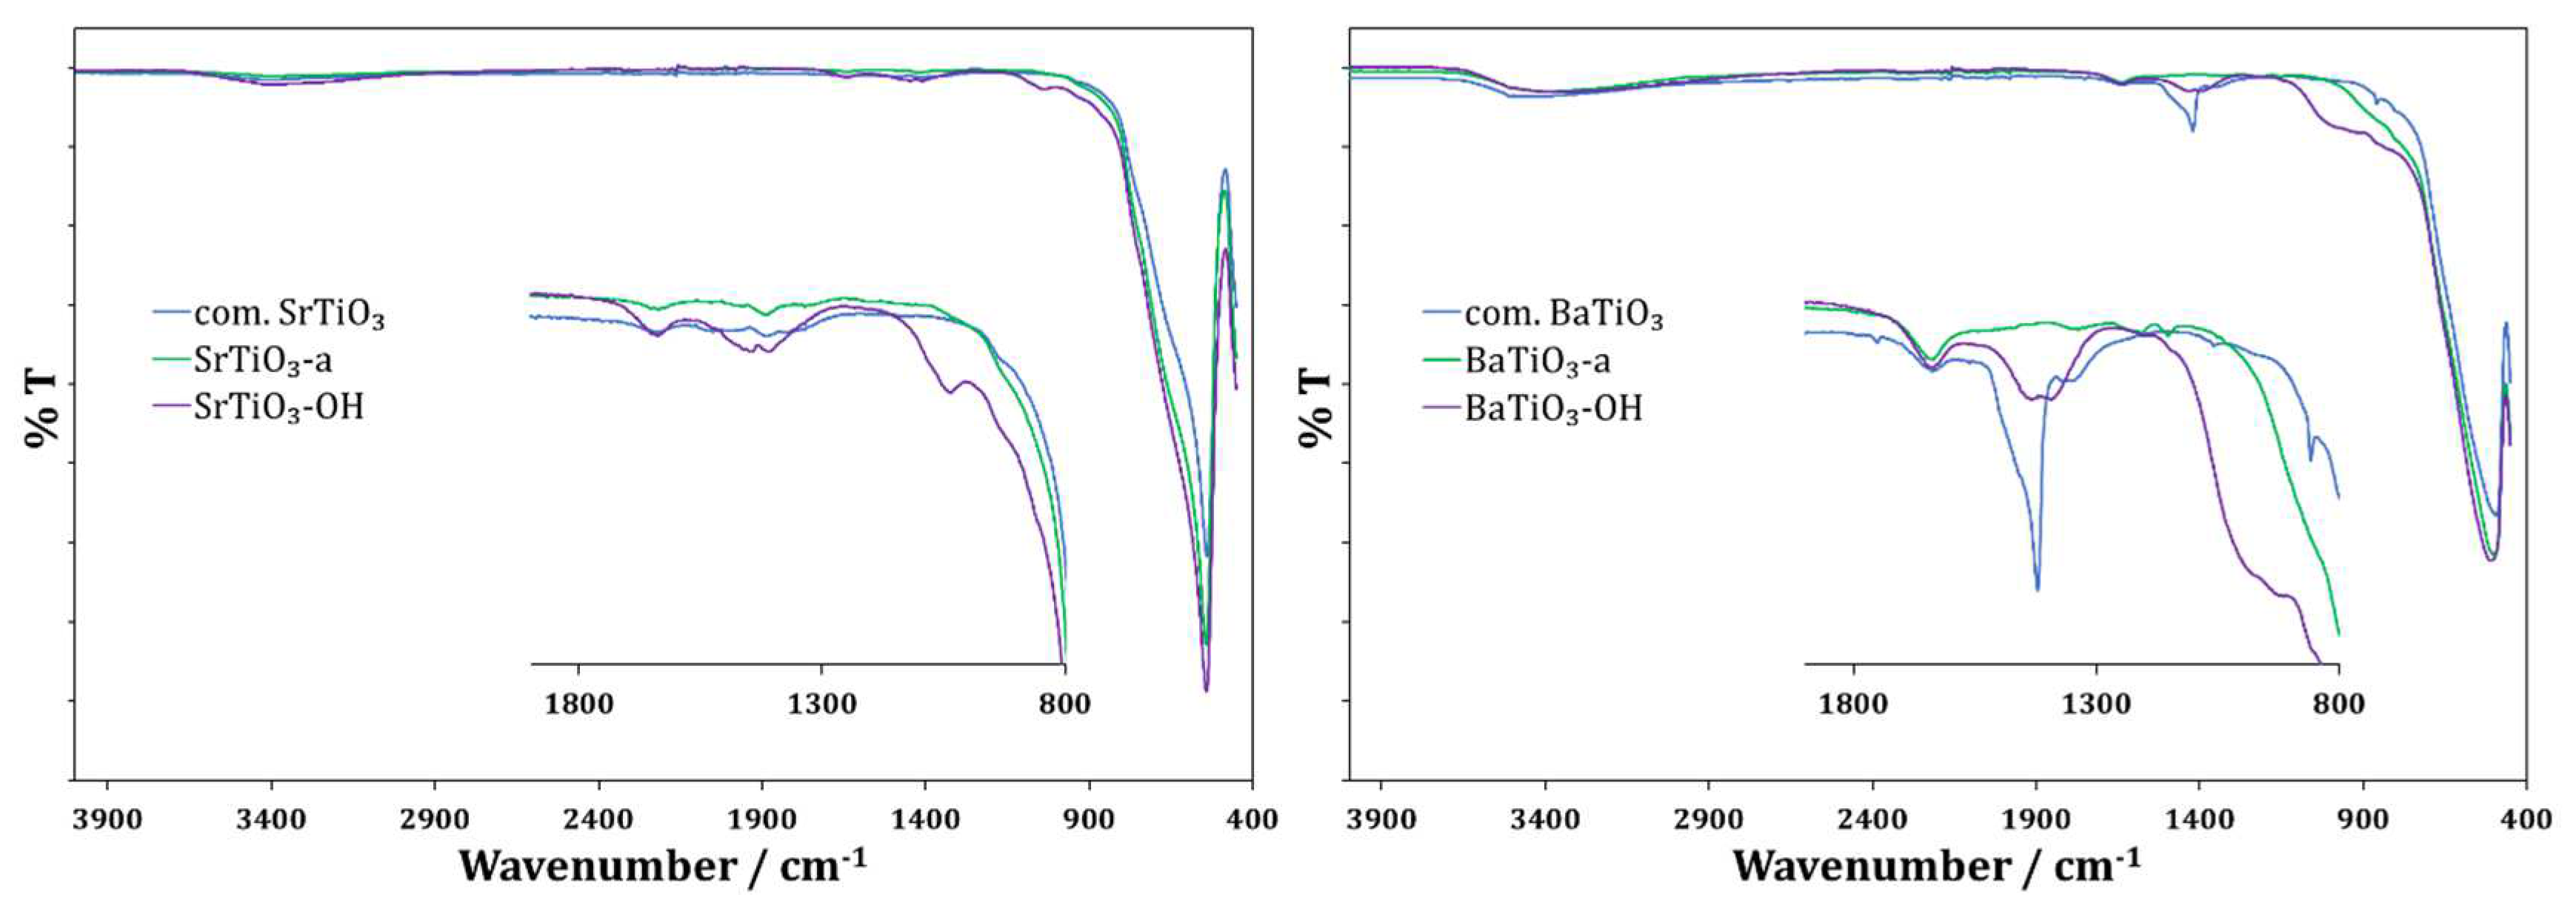
Figure 2.
TGA-MS of acid-activated SrTiO3 NPs. SrTiO3-a, where black is the weight loss, red is the temperature, brown is the derivative weight against time, blue is the ion current of amu 18, green is the ion current of amu 44, and orange is the ion current of amu 81.
Figure 2.
TGA-MS of acid-activated SrTiO3 NPs. SrTiO3-a, where black is the weight loss, red is the temperature, brown is the derivative weight against time, blue is the ion current of amu 18, green is the ion current of amu 44, and orange is the ion current of amu 81.
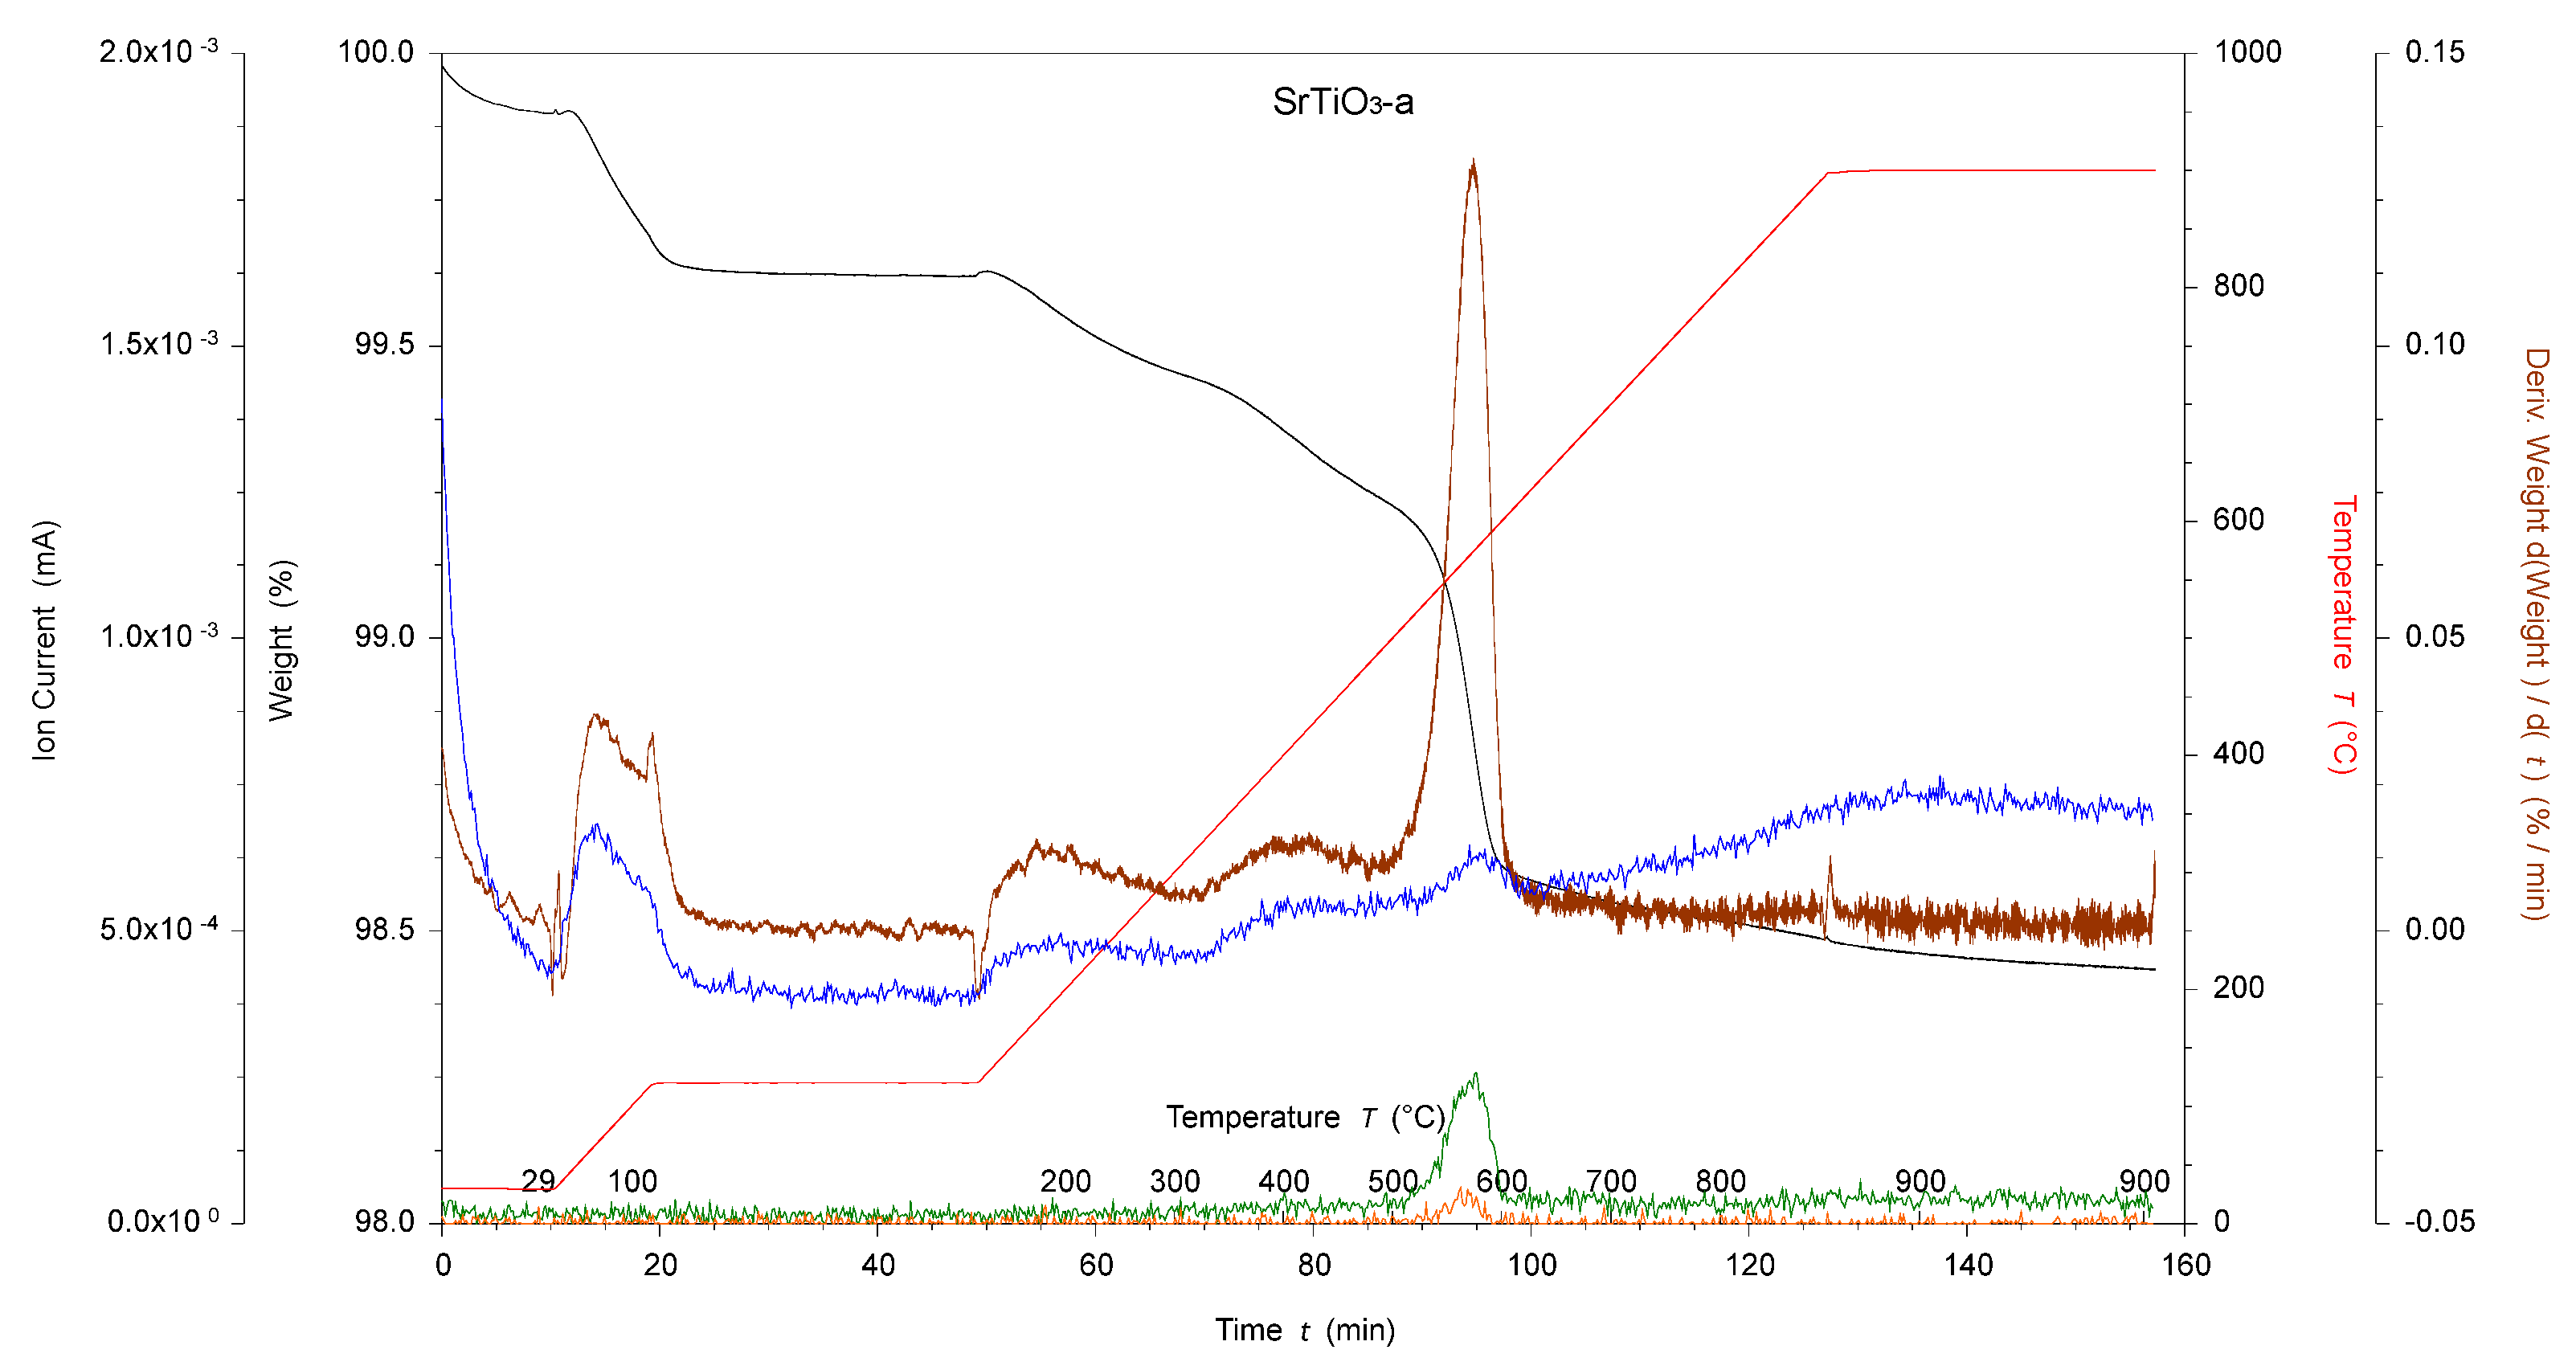
Figure 3.
TGA-MS of acid-activated with ligand 1-functionalized SrTiO3 NPs. 1@SrTiO3-a, where black is the weight loss, red is the temperature, brown is the derivative weight against time, blue is the ion current of amu 18, green is the ion current of amu 44, and orange is the ion current of amu 81.
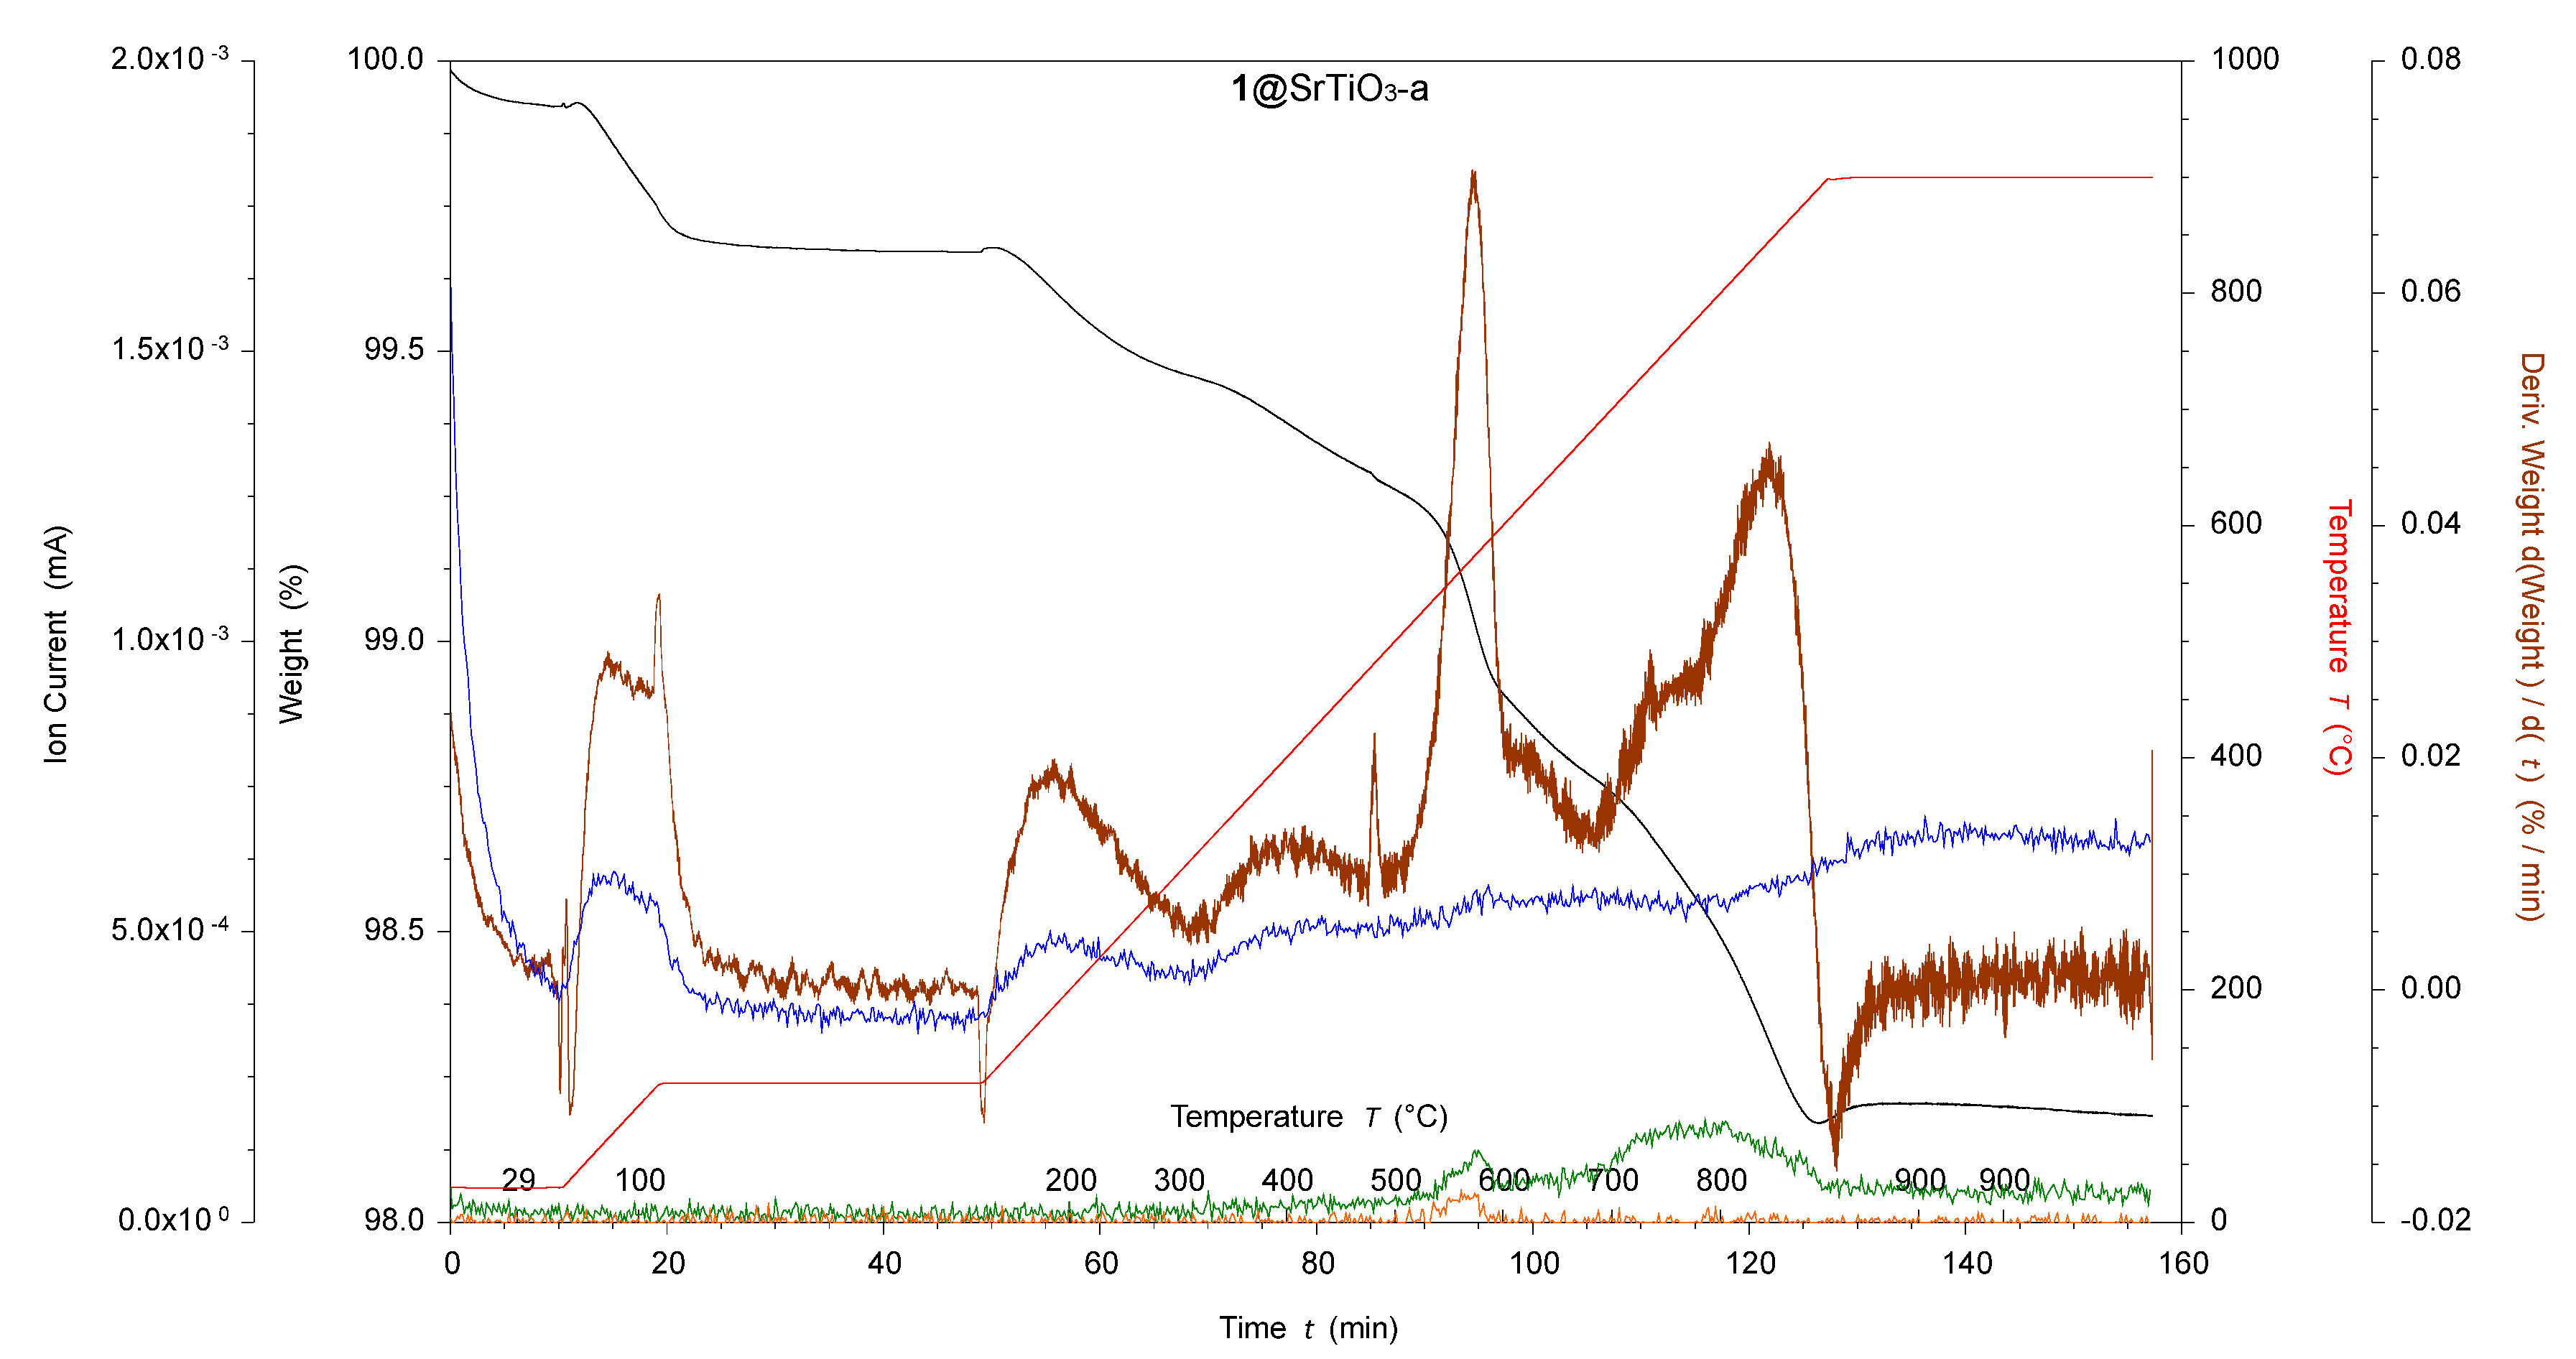
Figure 4.
FTIR spectra of pristine SrTiO3 (left, black), 1@SrTiO3 NPs (left, blue), 1@SrTiO3-a NPs (left, green), 1@SrTiO3-OH NPs (left, violet); pristine BaTiO3 (right, black), 1@BaTiO3 NPs (right, blue), 1@BaTiO3-a NPs (right, green), 1@BaTiO3-OH NPs (right, violet).
Figure 4.
FTIR spectra of pristine SrTiO3 (left, black), 1@SrTiO3 NPs (left, blue), 1@SrTiO3-a NPs (left, green), 1@SrTiO3-OH NPs (left, violet); pristine BaTiO3 (right, black), 1@BaTiO3 NPs (right, blue), 1@BaTiO3-a NPs (right, green), 1@BaTiO3-OH NPs (right, violet).
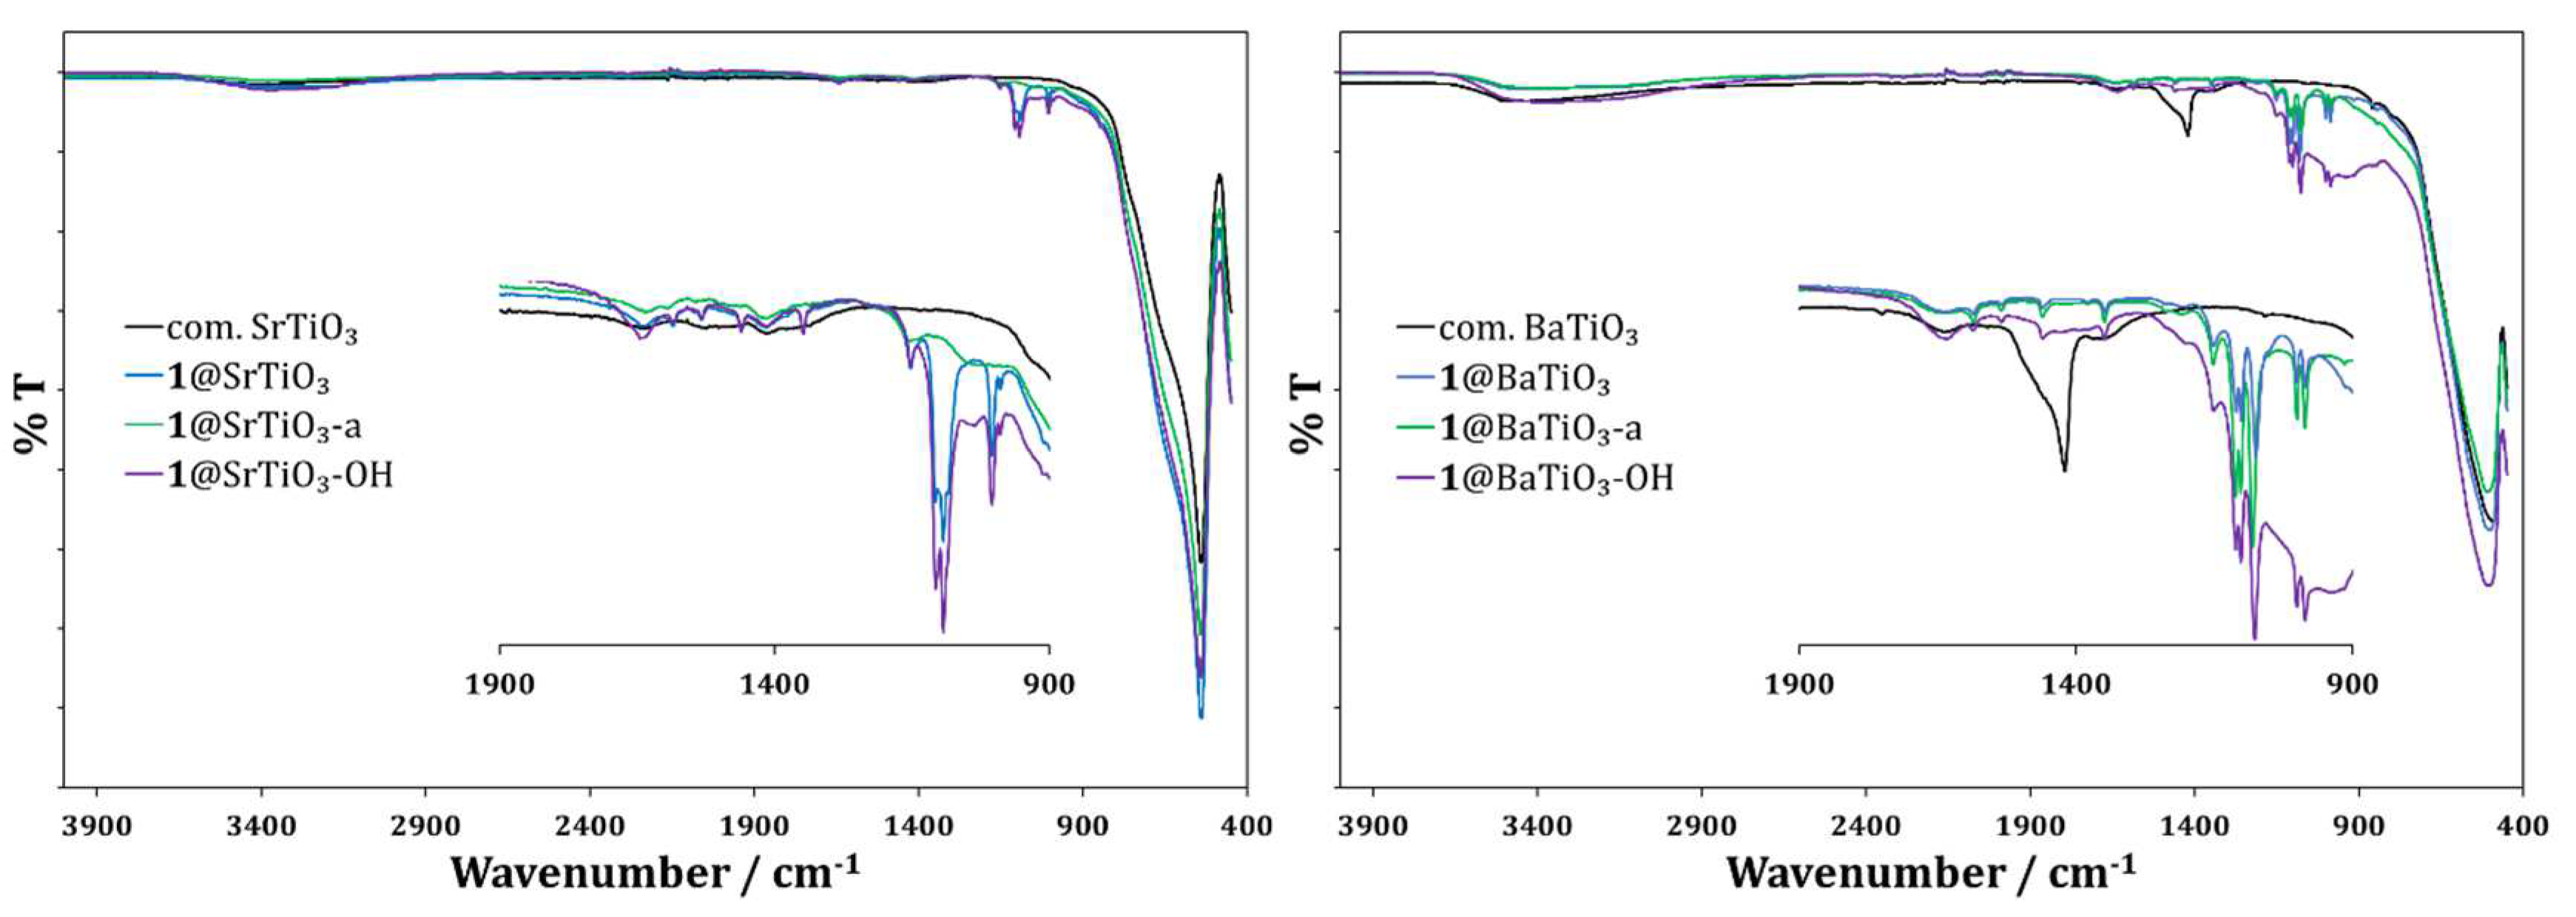
Figure 5.
Solid-state absorption spectra of 1@SrTiO3 NPs (left, blue), 1@SrTiO3-a NPs (left, green), 1@SrTiO3-OH NPs (left, violet); 1@BaTiO3 NPs (right, blue), 1@BaTiO3-a NPs (right, green), 1@BaTiO3-OH NPs (right, violet).
Figure 5.
Solid-state absorption spectra of 1@SrTiO3 NPs (left, blue), 1@SrTiO3-a NPs (left, green), 1@SrTiO3-OH NPs (left, violet); 1@BaTiO3 NPs (right, blue), 1@BaTiO3-a NPs (right, green), 1@BaTiO3-OH NPs (right, violet).
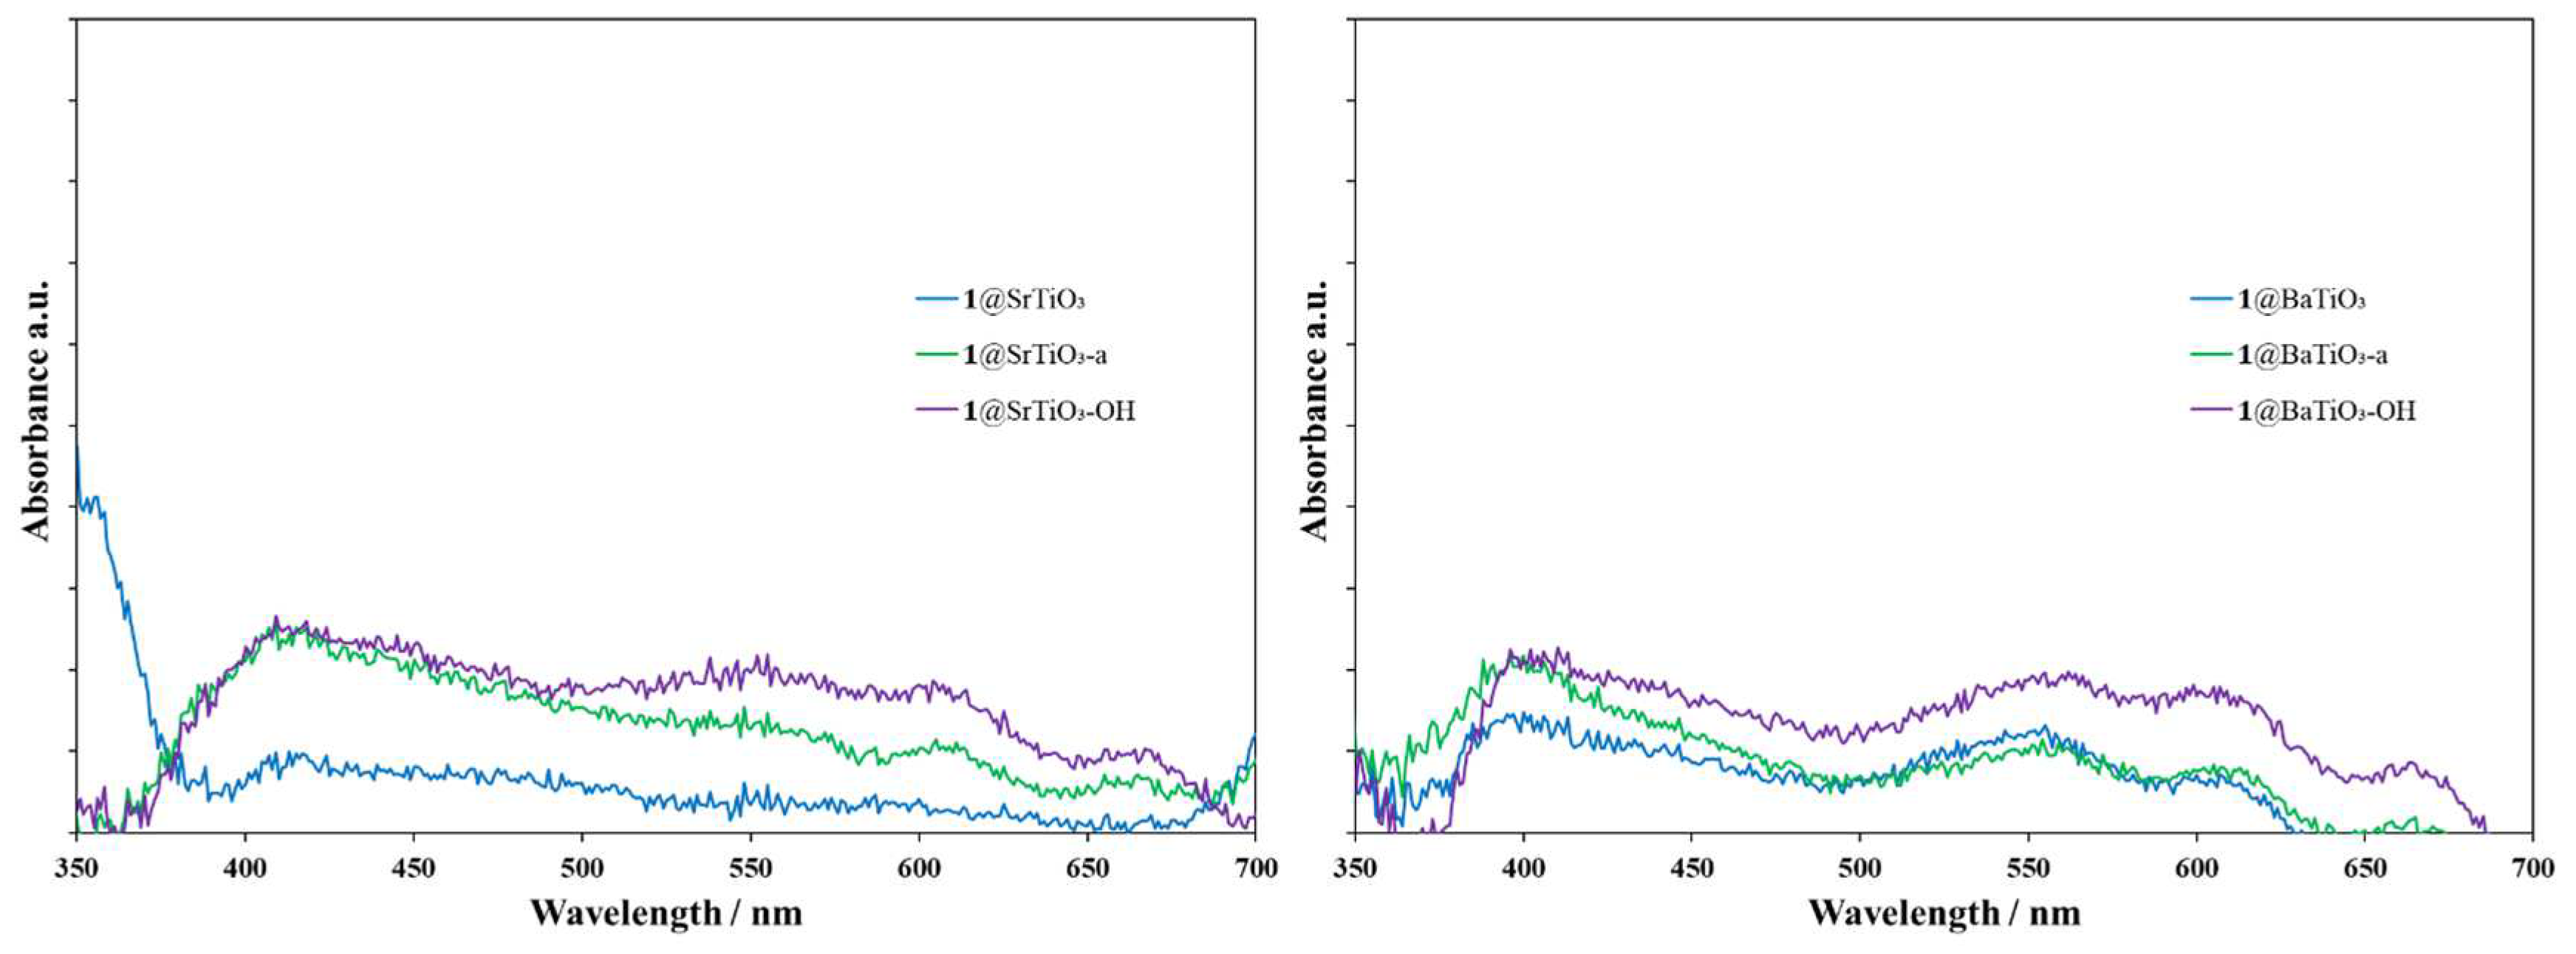
Figure 6.
Isolated f-NPs from left to right: rR@SrTiO3, rR@SrTiO3-a, rR@SrTiO3-OH, rR@SrTiO3-OH-A, Ru@SrTiO3, Ru@BaTiO3, rR@BaTiO3, rR@BaTiO3-a, rR@BaTiO3-OH, rR@BaTiO3-OH-A.
Figure 6.
Isolated f-NPs from left to right: rR@SrTiO3, rR@SrTiO3-a, rR@SrTiO3-OH, rR@SrTiO3-OH-A, Ru@SrTiO3, Ru@BaTiO3, rR@BaTiO3, rR@BaTiO3-a, rR@BaTiO3-OH, rR@BaTiO3-OH-A.

Figure 7.
TGA-MS of acid-activated with ligand 1-functionalized and ruthenium-, rhodium-, and bpy-complexed SrTiO3 NPs. rR@SrTiO3-a, where black is the weight loss, red is the temperature, brown is the derivative weight against time, blue is the ion current of amu 18, and green is the ion current of amu 44.
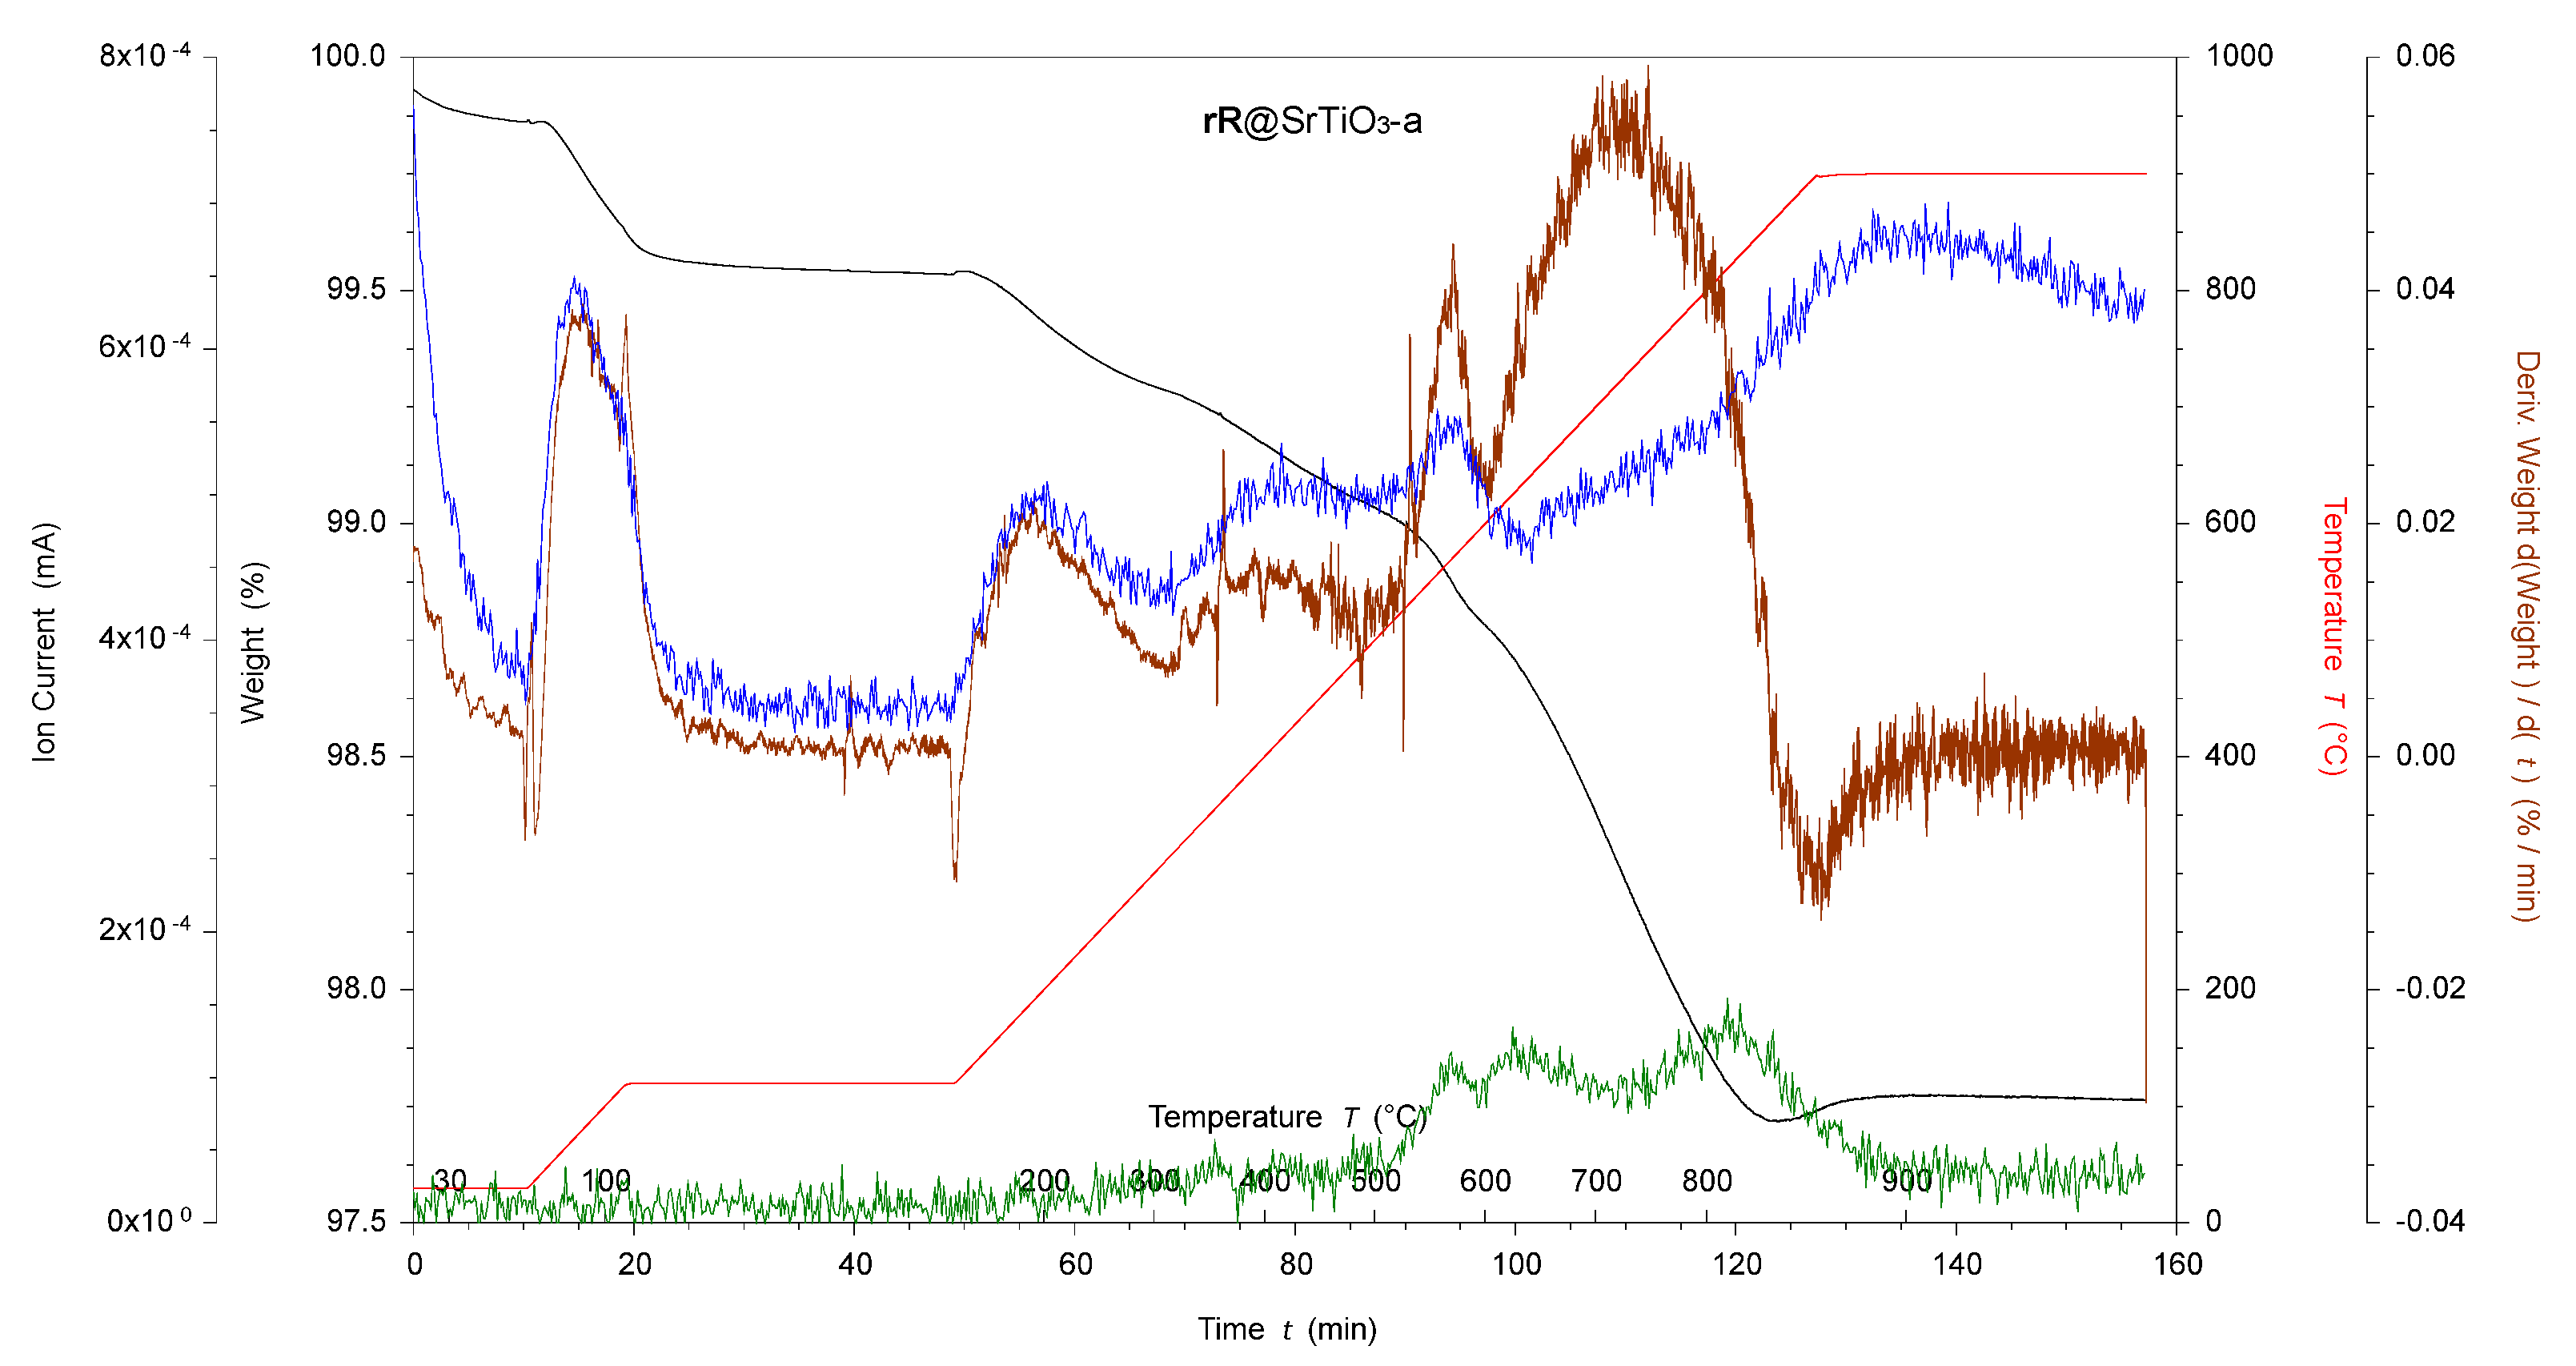
Figure 8.
TGA-MS of H2O2 activated with ligand 1-functionalized and ruthenium, rhodium, and bpy under adjusted pH complexed SrTiO3 NPs (top) and BaTiO3 NPs (bottom). rR@SrTiO3-OH-A and rR@SrTiO3-OH-A, where black is the weight loss, red is the temperature, brown is the derivative weight against time, blue is the ion current of amu 18, green is the ion current of amu 44, yellow is the ion current of amu 48, and pink is the ion current of amu 64.
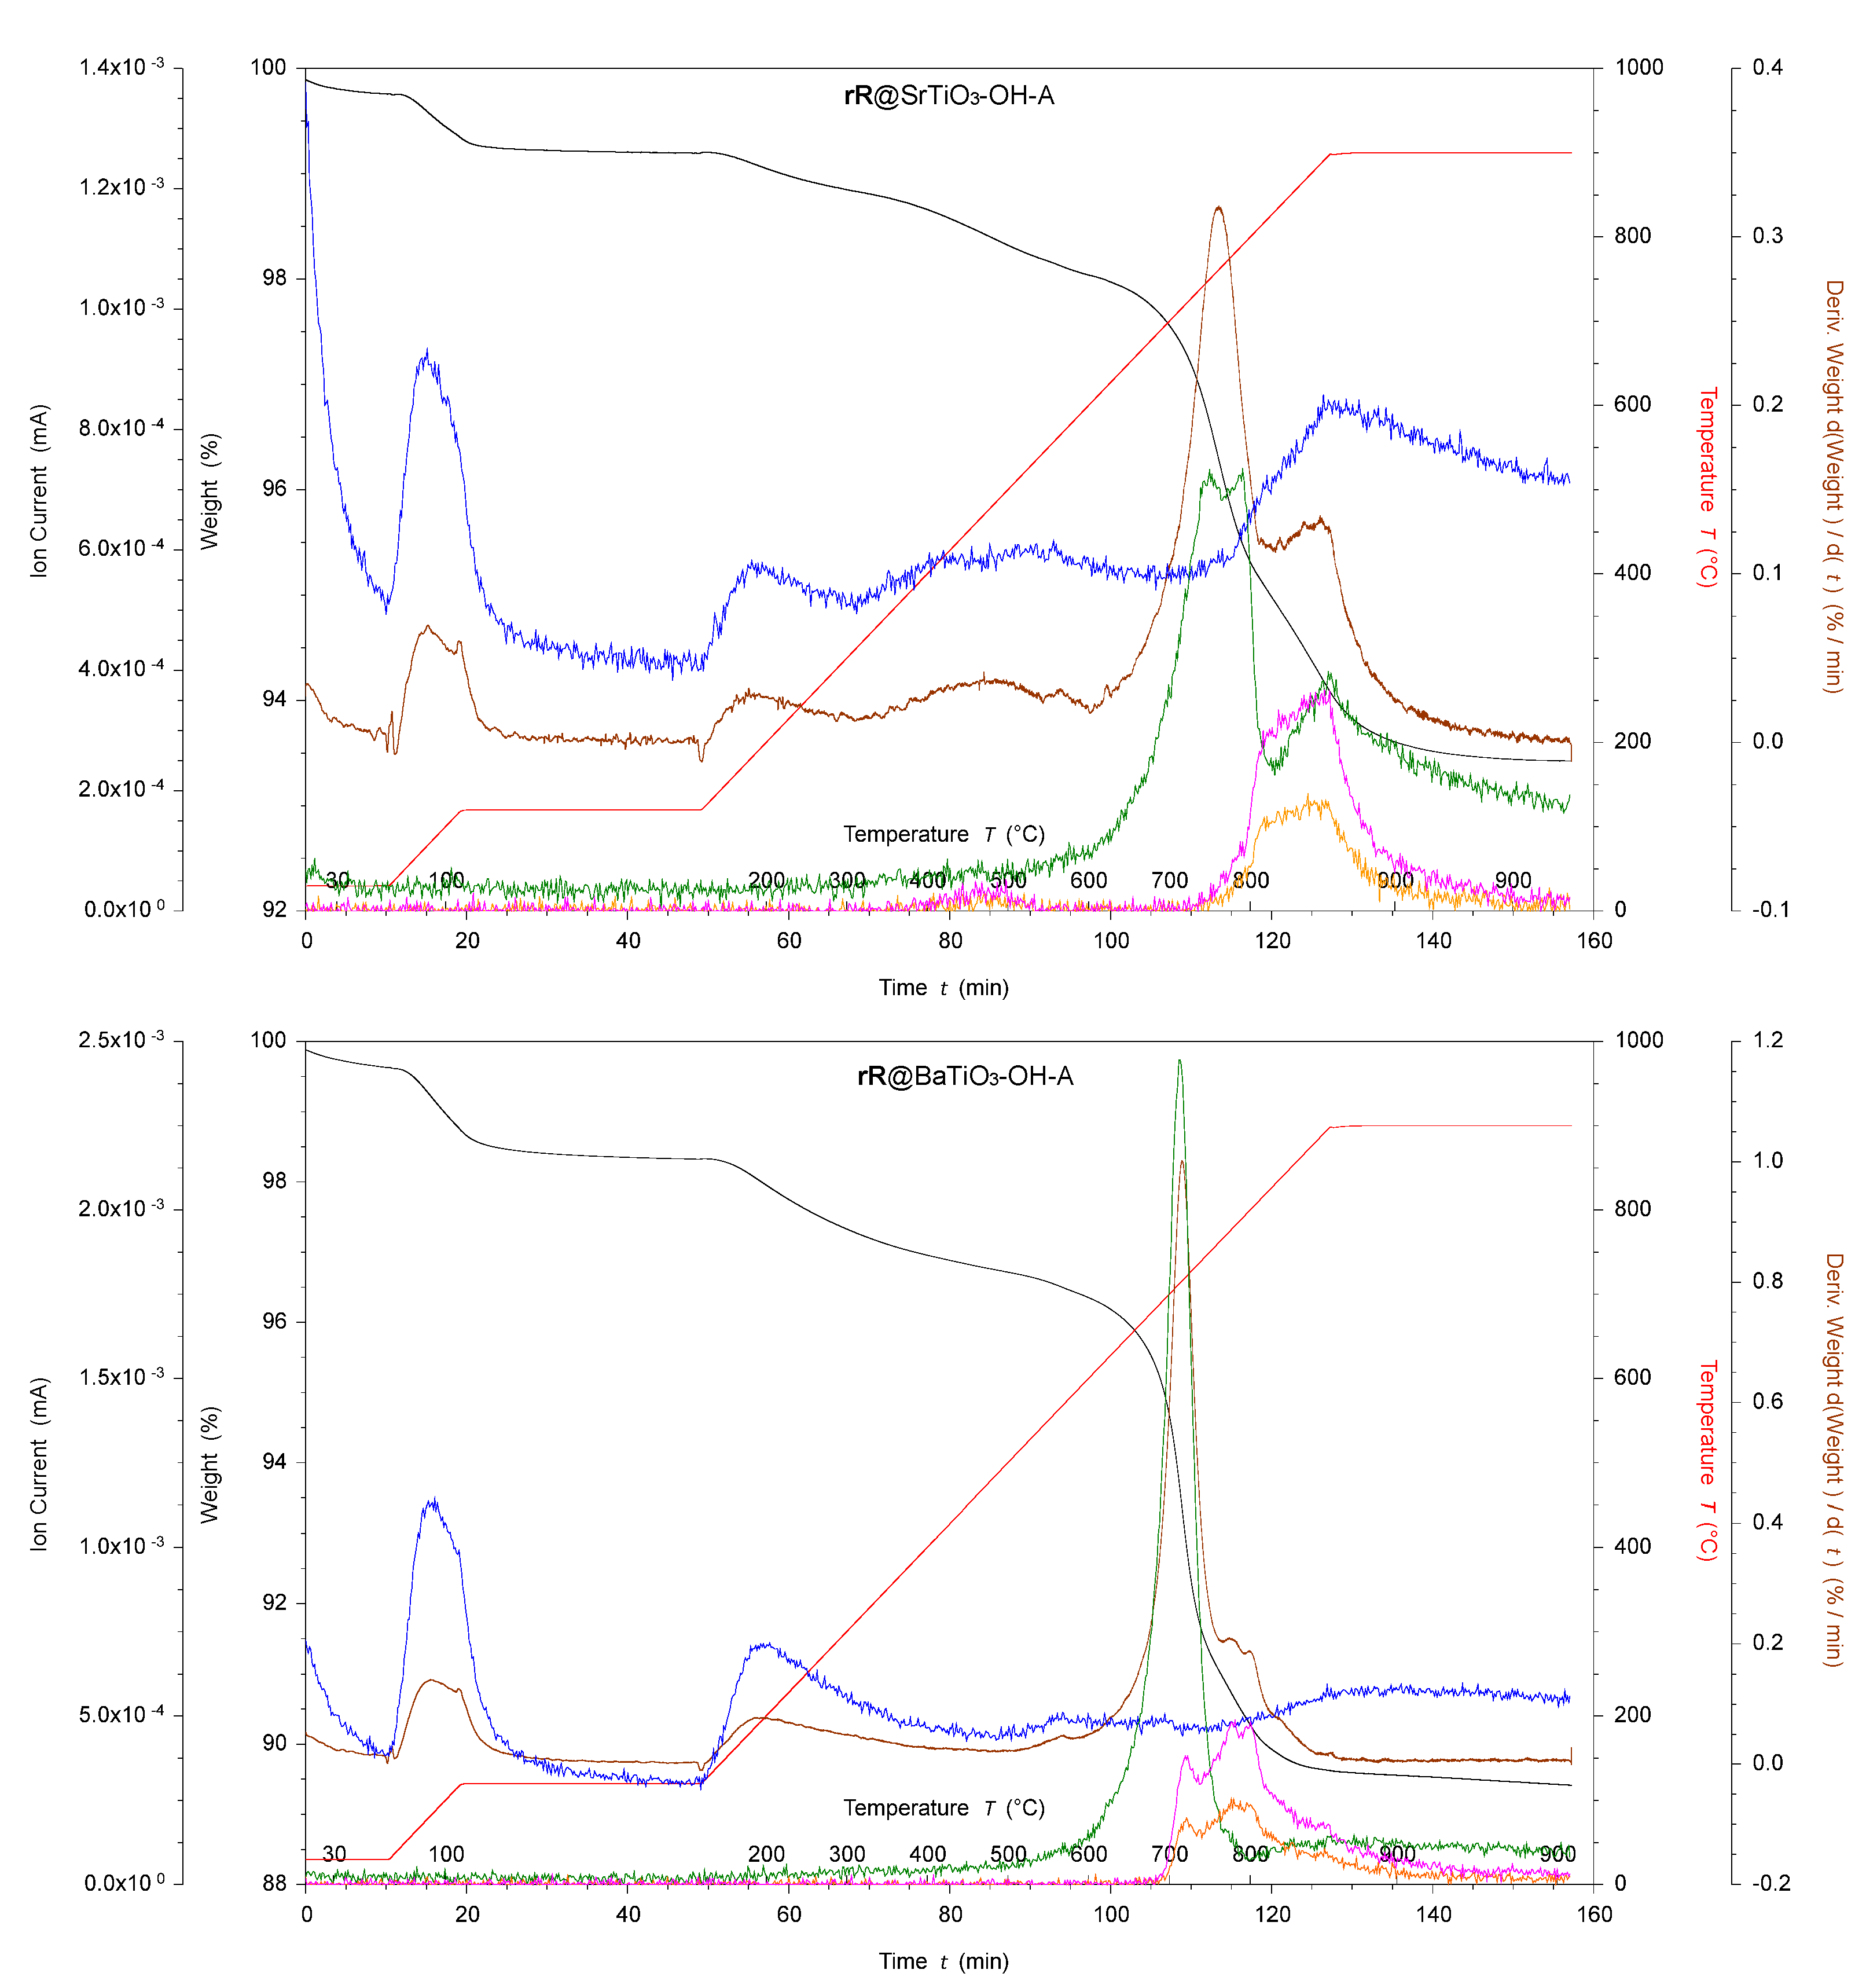
Figure 9.
Solid-state absorption spectra of rR@SrTiO3 NPs (left, blue), rR@SrTiO3-a NPs (left, green), rR@SrTiO3-OH NPs (left, violet), rR@SrTiO3-OH-A NPs (left, red); rR@BaTiO3 NPs (right, blue), rR@BaTiO3-a NPs (right, green), rR@BaTiO3-OH NPs (right, violet), rR@BaTiO3-OH-A NPs (right, red).
Figure 9.
Solid-state absorption spectra of rR@SrTiO3 NPs (left, blue), rR@SrTiO3-a NPs (left, green), rR@SrTiO3-OH NPs (left, violet), rR@SrTiO3-OH-A NPs (left, red); rR@BaTiO3 NPs (right, blue), rR@BaTiO3-a NPs (right, green), rR@BaTiO3-OH NPs (right, violet), rR@BaTiO3-OH-A NPs (right, red).
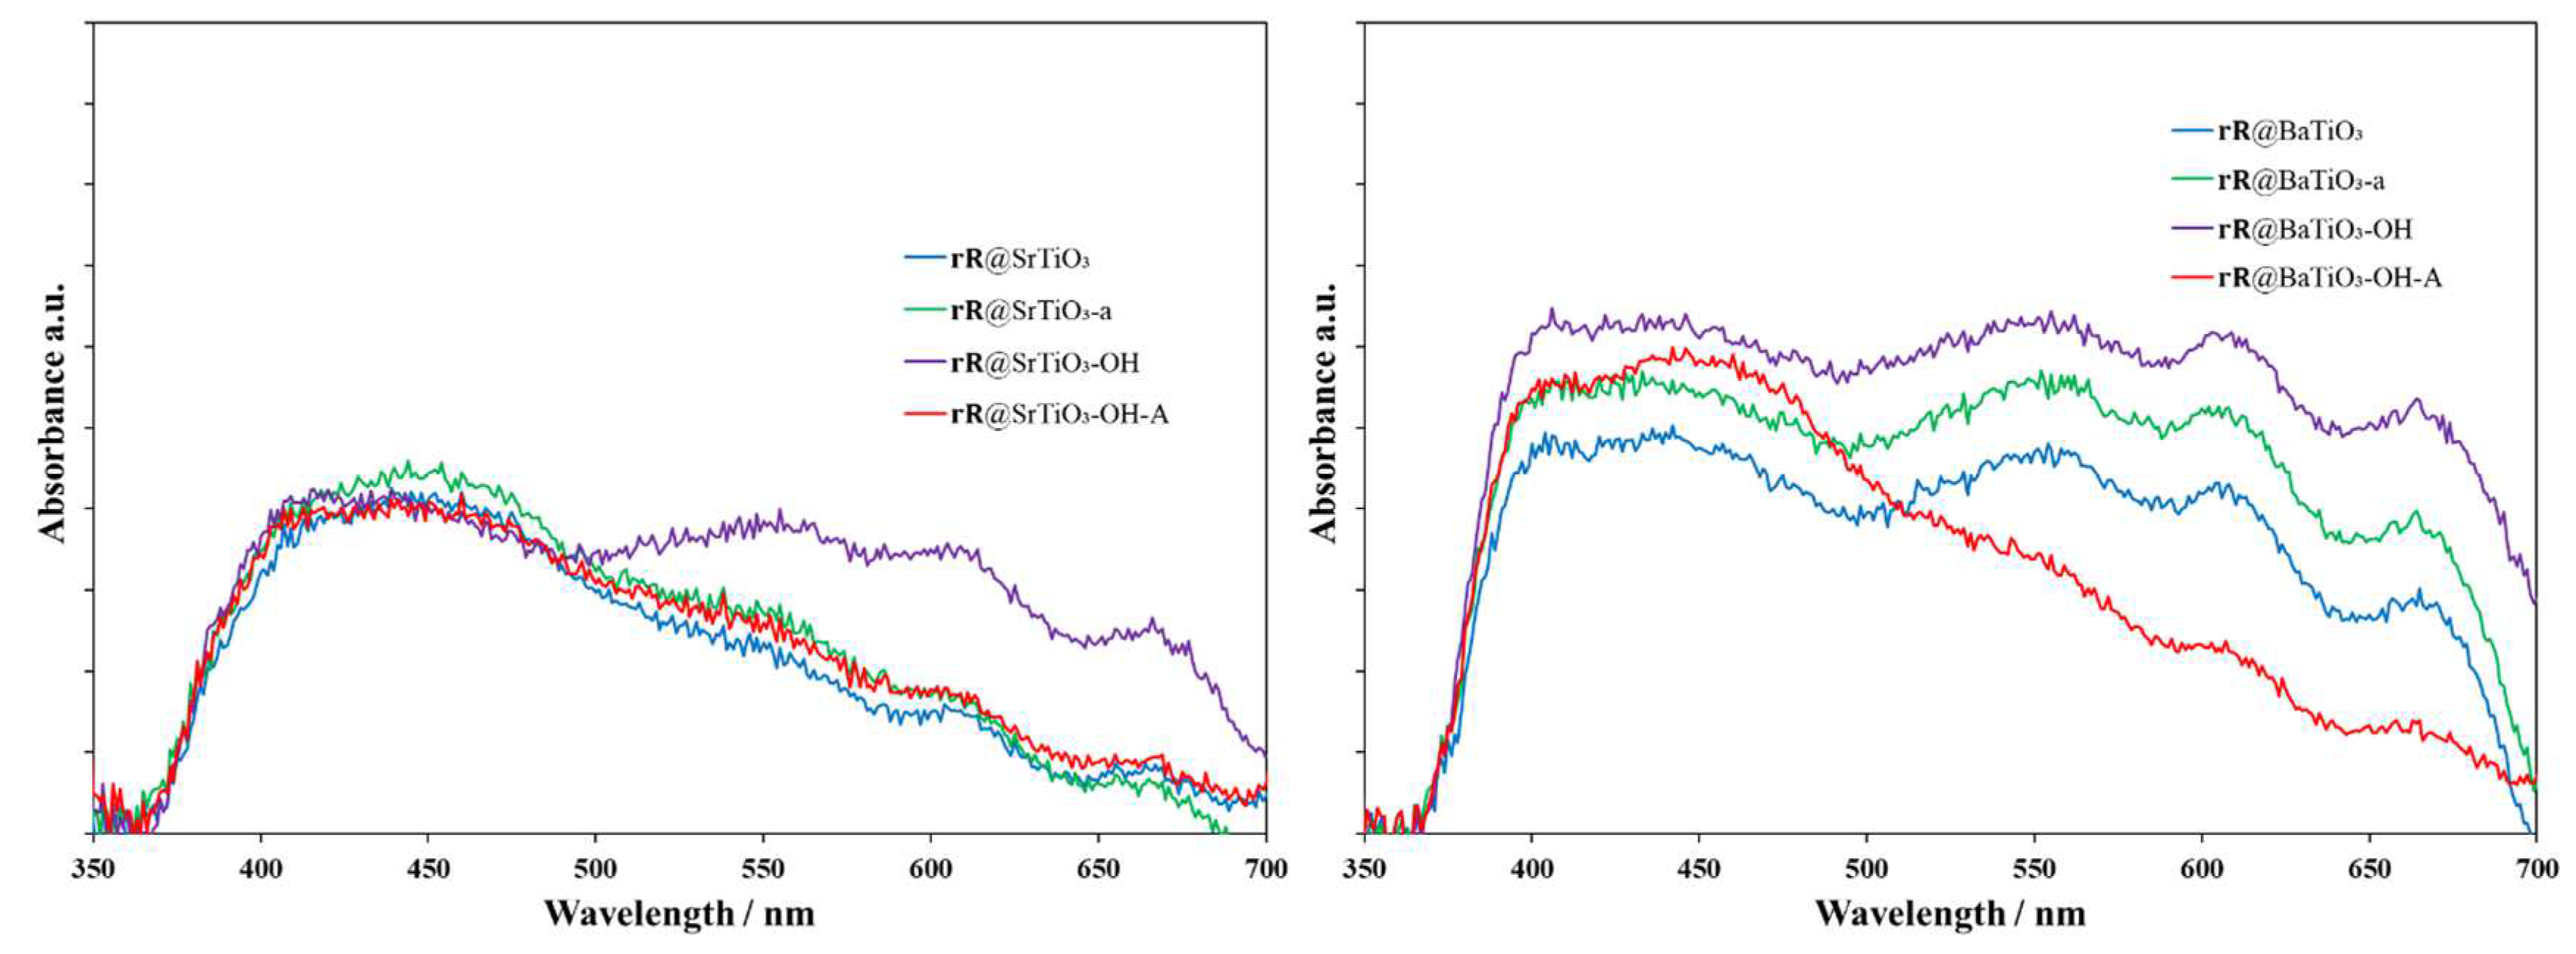
Figure 10.
FTIR spectra of rR@SrTiO3 NPs (left, blue), rR@SrTiO3-a NPs (left, green), rR@SrTiO3-OH NPs (left, violet), rR@SrTiO3-OH-A NPs (left, red); rR@BaTiO3 NPs (right, blue), rR@BaTiO3-a NPs (right, green), rR@BaTiO3-OH NPs (right, violet), rR@BaTiO3-OH-A NPs (right, red).
Figure 10.
FTIR spectra of rR@SrTiO3 NPs (left, blue), rR@SrTiO3-a NPs (left, green), rR@SrTiO3-OH NPs (left, violet), rR@SrTiO3-OH-A NPs (left, red); rR@BaTiO3 NPs (right, blue), rR@BaTiO3-a NPs (right, green), rR@BaTiO3-OH NPs (right, violet), rR@BaTiO3-OH-A NPs (right, red).

Table 1.
TGA-MS results of non-activated and activated SrTiO3 and BaTiO3 NPs. (-a) represents HNO3-activated NPs and (-OH) represents H2O2-activated NPs.
Table 1.
TGA-MS results of non-activated and activated SrTiO3 and BaTiO3 NPs. (-a) represents HNO3-activated NPs and (-OH) represents H2O2-activated NPs.
| Entry | 30–380 °C /% | Mass Found /amu | 380–900 °C /% | Mass Found /amu |
|---|---|---|---|---|
| Pristine SrTiO3 | 0.5 | 18; 44 a | 0.4 | 18; 44 |
| SrTiO3-a | 0.6 | 18 | 1.0 | 18, 44 b, 81 b |
| SrTiO3-OH | 1.8 | 18; 44 | 0.6 | 18; 44 |
| PristineBaTiO3 | 1.0 | 18; 44 | 0.6 | 18; 44 |
| BaTiO3-a | 1.4 | 18 | 0.5 | 18; 44 b |
| BaTiO3-OH | 3.6 | 18; 44 | 0.8 | 18; 44 |
a Peak with amu 44 was recorded as traces slightly above baseline. b Peak with amu 44 was only recorded within a temperature range of 500–600 °C.
Table 2.
TGA-MS results of 1@SrTiO3 and 1@BaTiO3 NPs using non-activated and activated NPs.
| Entry | 30–380 °C /% | Mass Found /amu | 380–900 °C /% | Mass Found /amu |
|---|---|---|---|---|
| 1@SrTiO3 | 0.8 | 18 | 1.0 | 18; 44 |
| 1@SrTiO3-a | 0.6 | 18 | 1.2 | 18; 44; 81 |
| 1@SrTiO3-OH | 1.6 | 18 | 1.3 | 18; 44 |
| 1@BaTiO3 | 1.4 | 18 | 1.0 | 18; 44 |
| 1@BaTiO3-a | 1.5 | 18 | 1.2 | 18; 44; 81 |
| 1@BaTiO3-OH | 3.3 | 18 | 1.5 | 18; 44 |
(1@) represents ligand 1 bound to the NP surface, (-a) represents using HNO3-activated NPs during the functionalization, and (-OH) represents using H2O2-activated NPs during the functionalization.
Table 3.
TGA-MS results of rR@SrTiO3 and rR@BaTiO3 NPs using non-activated and activated NPs.
| Entry | 30–380 °C /% | Mass Found /amu | 380–900 °C /% | Mass Found /amu |
|---|---|---|---|---|
| rR@SrTiO3 | 0.9 | 18; 44 | 1.5 | 18; 44 |
| rR@SrTiO3-a | 0.7 | 18; 44 | 1.4 | 18; 44 |
| rR@SrTiO3-OH | 1.5 | 18; 44 | 1.6 | 18; 44 |
| rR@SrTiO3-OH-A | 1.2 | 18 | 5.3 | 18; 44; 48; 64 |
| rR@BaTiO3 | 0.9 | 18; 44 | 1.2 | 18; 44 |
| rR@BaTiO3-a | 1.6 | 18; 44 | 1.5 | 18; 44 |
| rR@BaTiO3-OH | 3.2 | 18; 44 | 1.6 | 18; 44 |
| rR@BaTiO3-OH-A | 2.9 | 18 | 7.6 | 18; 44; 48; 64 |
(rR@) represents anchoring ligand 1-f-NPs bound to the surface of the NPs and complexed with RuCl3 and RhCl3 at a ratio of roughly 1:20; (-a) represents using HNO3 activated NPs during the functionalization; (-OH) means H2O2 activated NPs during the functionalization; (-OH-A) refers to additionally adjusting the pH to 1.5 during the complexation.
Table 4.
Dihydrogen-generating experiments.
| Entry | GCI a /a.u. | H2 /mL | Rate /mL h−1 |
|---|---|---|---|
| rR@SrTiO3 | 150,100 | 3.10 | 0.77 |
| rR@SrTiO3-a | 216,900 | 4.47 | 1.12 |
| rR@SrTiO3-OH | 31,800 | 0.66 | 0.16 |
| rR@SrTiO3-OH-A | 94,900 | 1.96 | 0.49 |
| rR@BaTiO3 | 43,800 | 0.90 | 0.23 |
| rR@BaTiO3-a | 90,000 | 1.86 | 0.46 |
| rR@BaTiO3-OH | 0 | 0 | 0 |
| rR@BaTiO3-OH-A | 108,600 | 2.24 | 0.56 |
a GC integral (GCI) was adjusted for pre-existing nitrogen headspace in the reaction vial and partial sampling during the GC measurement.
Disclaimer/Publisher’s Note: The statements, opinions and data contained in all publications are solely those of the individual author(s) and contributor(s) and not of MDPI and/or the editor(s). MDPI and/or the editor(s) disclaim responsibility for any injury to people or property resulting from any ideas, methods, instructions or products referred to in the content. |
© 2023 by the authors. Licensee MDPI, Basel, Switzerland. This article is an open access article distributed under the terms and conditions of the Creative Commons Attribution (CC BY) license (https://creativecommons.org/licenses/by/4.0/).
Share and Cite
MDPI and ACS Style
Freimann, S.A.; Housecroft, C.E.; Constable, E.C. Nanoparticulate Perovskites for Photocatalytic Water Reduction. Nanomaterials 2023, 13, 2094. https://doi.org/10.3390/nano13142094
AMA Style
Freimann SA, Housecroft CE, Constable EC. Nanoparticulate Perovskites for Photocatalytic Water Reduction. Nanomaterials. 2023; 13(14):2094. https://doi.org/10.3390/nano13142094
Chicago/Turabian StyleFreimann, Sven A., Catherine E. Housecroft, and Edwin C. Constable. 2023. "Nanoparticulate Perovskites for Photocatalytic Water Reduction" Nanomaterials 13, no. 14: 2094. https://doi.org/10.3390/nano13142094
Note that from the first issue of 2016, this journal uses article numbers instead of page numbers. See further details here.