
Fully Atomistic Molecular Dynamics Simulation of a TIPS-Pentacene:Polystyrene Mixed Film Obtained via the Solution Process

1
Research Center for Organic Electronics (ROEL), Yamagata University, Jonan 4-3-16, Yonezawa 992-8510, Japan
2
Scuola Superiore Meridionale, Largo San Marcellino 10, 80138 Napoli, Italy
*
Author to whom correspondence should be addressed.
Nanomaterials 2023, 13(2), 312; https://doi.org/10.3390/nano13020312
Submission received: 30 November 2022
/
Revised: 7 January 2023
/
Accepted: 8 January 2023
/
Published: 11 January 2023
(This article belongs to the Special Issue Nanomaterials for Printed Electronics and Bioelectronics)
Abstract
:Organic thin-film transistors using small-molecule semiconductor materials such as 6,13-bis(triisopropylsilylethynyl)pentacene (TIPS-P) have been recently studied for the production of flexible and printed electronic devices. Blending a semiconductor with an insulating polymer, such as polystyrene, is known to improve the device performance; however, its molecular-level structure remains unknown. In this study, we performed molecular dynamics (MD) simulations on a mixed system of TIPS-P and atactic polystyrene (aPS) with fully atomistic models to understand the structure of the mixed thin film at the molecular level and the influence on the device properties. To reproduce the deposition from the solution, we gradually reduced the number of toluene molecules in the simulation. The dynamic characteristics of the system, mean squared displacement, diffusion coefficient, density profile, and P2 order parameter were analyzed. Some of the simulated systems reached the equilibrium state. In these systems, the simulated structures suggested the presence of more TIPS-P molecules on the surface than inside the bulk, even at the low molecular weight of aPS, where phase separation was not observed experimentally. The results of the fully atomistic MD simulations are also a basis for the coarse-grained model to increase the speed of the MD simulation.
1. Introduction
Flexible and printed organic electronic devices have been extensively studied over the last three decades [1] because of their unique mechanical features, such as their ability to bend, stick, and be disposed of [2,3,4], which are different from those of conventional electronic devices based on rigid inorganic semiconductors. These unique features make flexible electronic devices suitable for healthcare applications such as biosensing [5,6] and electronic organs [7,8,9] (bioelectronics). The two main trends in the research field of flexible electronic devices are (i) reducing the thickness of films integrating or constituting the electronic components [10] and (ii) developing new materials suitable for producing flexible electronic devices [11,12,13]. One of the molecules used as organic semiconductors in flexible electronic devices is pentacene, which exhibits a high carrier mobility [14,15] (~1.2 cm2/Vs) required for applications in electronic devices. However, the material requires a vacuum deposition process, which notably increases the cost [16,17]. An alternative to pentacene is 6,13-bis(triisopropylsilylethynyl)pentacene (TIPS-P), which has been developed as a highly soluble semiconductor for flexible electronic devices [18,19]. In particular, TIPS-P is used as the active layer of organic thin-film transistors as a small-molecule semiconductor owing to its solubility and conductivity [17,20]. Owing to its high solubility, TIPS-P can be deposited via solution processes at room temperature at a lower cost than pentacene and is suitable for large-area electronic products [16,18,21]. TIPS-P also has a high carrier mobility, exceeding 1 cm2/Vs [17]. Ohe et al. experimentally reported that blending TIPS-P with an insulating polymer, poly-α-methylstyrene (PαMS), can improve the performance and homogeneity of organic thin-film transistors [17]. In their experiments, spin-coating a solution of TIPS-P and PαMS in toluene formed a tri-layer structure of a TIPS-P layer/mixed layer of TIPS-P and PαMS/TIPS-P layer via spontaneous phase separation if the weight-average molecular weight (Mw) of PαMS was larger than 28,200 [17]. The blend of TIPS-P and PαMS with a low Mw of 2200 resulted in lower device performance without phase separation. However, the reason why the insulating polymer affects the device performance, as well as its interfacial structures, has not been revealed to date. The technique of blending small-molecule semiconductors with insulating polymers has been extended to different combinations of materials [22].
In this study, we performed fully atomistic molecular dynamics (MD) simulations of a TIPS-P:atactic polystyrene mixed film to understand its structure and interactions at the molecular level. The thin-film formation from the solution was mimicked by gradually reducing the toluene content in the system. Using MD simulations with atomistic models makes it possible to reproduce the molecular state at the surface in more detail, which is otherwise difficult to accomplish by using experimental approaches such as atomic force microscopy and X-ray diffraction. To date, trial-and-error experiments based on device features have been conducted for the selection of polymer materials. Elucidating the mechanism from the results of MD simulations will guide material selection. The results of the fully atomistic MD simulation are also a basis for the coarse-grained (CG) model to increase the speed of the MD simulation.
2. Methods
2.1. Atomistic Models
In this study, atomistic models of atactic polystyrene (aPS, C8nH8n+2) [23], TIPS-P (C44H54Si2) [24], and toluene (C7H8) [25] were used. Figure 1 shows the molecular formulas of aPS, TIPS-P, and toluene. For all the considered models, OPLS-AA force field parameters were used. A short oligomer of aPS (Mw = 1056, C80H82), composed of ten repeating units, was selected because of the limitation of the calculation cost and to have access to the characteristic relaxation time of aPS occurring at different timescales, which can be achieved by full-atomistic simulations. The aPS model, which is able to correctly reproduce the structural and dynamic properties of the polymer bulk, was taken from the literature [23,26]. The TIPS-P model, proposed by Steiner et al., was used to study the crystalline structure of TIPS-P [24].
2.2. Calculation for the Pristine TIPS-P Crystal
To validate the force field for TIPS-P, an MD simulation of pristine TIPS-P crystals without PS and toluene was performed. The 10 × 8 × 4 supercell of the experimental structure [27] was used as the initial configuration. Energy minimization was performed using 5000 steps of the steepest descent algorithm. A time step of 2 fs for this system and a cut-off distance for the Lennard-Jones non-bonded interaction of 1.2 nm were set. Periodic boundary conditions were considered in all directions (x, y, and z). For the production run, the temperature was kept constant using a velocity-rescaling algorithm [28] with a characteristic relaxation time τT = 0.02 ps and a fixed volume. Simulated annealing was performed from 0 to 200 K every 100 ps in 50 K increments, with a simulation time of 1 ns. Chemical structures of all molecules used in the MD simulations are reported in Figure 1.
2.3. Calculation for the Mixed Solution System
The free software GROMACS [29] (Ver. 2016.4) was used for all simulations, and the temperature was kept constant using a velocity-rescaling algorithm [28] with a characteristic relaxation time τT = 0.02 ps. The pressure was kept constant using the Berendsen weak-coupling scheme, and the box was scaled isotropically with a characteristic relaxation time τP = 0.3 ps. Periodic boundary conditions were used in all directions (x, y, and z). A time step of 2 fs was set for all systems. The cut-off distance for the Lennard-Jones non-bonded interactions was set to 1.2 nm. The electrostatic interactions were computed using the Ewald particle mesh (mesh spacing in Fourier space: 0.12 nm) [30,31]. All the bonds involving hydrogen atoms were constrained using the LINCS algorithm [32]. For all the initial coordinate sets, the energy of the systems was minimized by performing 5000 steps of the steepest descent algorithm. On each initial set of coordinates, an NPT simulation of the bulk system was performed until the total mass density reached equilibrium. As a further validation model test, we performed an additional run in the NPT ensemble by using a different barostat algorithm, the Parrinello–Rahman algorithm (with same target temperature and pressure) [33]. For the additional run, we used the last well-equilibrated configuration obtained from the set-up with a Berendsen barostat. In Figure 2, the comparison of the time evolution of the mass density of the system calculated for the two barostat algorithms is reported. As can be seen from the trends in Figure 2, we can assume that the key interactions reproduced by the Berendsen set-up are in reasonable agreement with the Parrinello–Rahman set-up (which is known to be accurate in the reproduction of the canonical ensemble) [34,35]. For both algorithms, the mass density converges to the same equilibrium value.
After the NPT run, we performed an NVT simulation by taking the last configuration of the NPT simulation and extending the box side length up to 20 nm to create the interface under vacuum. The toluene content was gradually reduced from 50 to 30, 20, 10, and 5 w/w%. A constant number of TIPS-P molecules and aPS chains was used (Table 1). First, we prepared a 50 w/w% toluene system and randomly set all molecules in the simulation box without a vacuum phase. Minimization and NPT simulations were performed for the bulk, followed by an NVT simulation, in which the interface of the bulk with vacuum was included. Considering the experimental conditions [17], the simulations were performed at room temperature (300 K) and the annealing temperature (333 K). A trajectory of 1 µs was accumulated for all systems. Starting from a set of coordinates (taken at equilibrium) of the system at a higher toluene content, some toluene molecules were removed from the system according to the new (lower) concentration. The same protocol, minimization, and NPT run were then applied, and a long NVT production run (1 µs with the bulk/vacuum interface) was performed. This procedure was performed until a system with a toluene content of 5 w/w% was simulated. The compositions and total times of the simulated systems are listed in Table 1.
3. Results and Discussions
3.1. Pristine TIPS-P Crystal for Validation of the Force Field
Different planar views of a representative equilibrium configuration of the simulated TIPS-P crystal (Figure 3a) are compared with the crystalline structure of the pristine TIPS-P in the literature [27] (Figure 3b). In panel 3c of the same figure, the time evolution of the powder X-ray diffraction pattern calculated from the MD simulation is compared with the experimental one (black segmented line). As the simulation time increases, peak positions shift to lower 2θ values (see the sequence of calculated patterns from 3 to 50 ns), indicating an increase in the lattice constant parameters (from ~1 to ~10%). The average values of the lattice constants obtained at equilibrium are: a = 7.70 Å, b = 7.83 Å, c = 16.82 Å, α = 93.3°, β = 89.5°, and γ = 91.1°, which reasonably agree with the experimental values: a = 7.55 Å, b = 7.73 Å, c = 16.76 Å, α = 89.5°, β = 78.7°, and γ = 84.0° [27]. These results indicate the validity of the adopted force field to simulate the crystalline structure of TIPS-P.
3.2. TIPS-P:aPS:Toluene Ternary System
3.2.1. Mean Squared Displacement
The mean squared displacement (MSD) [37,38,39] can provide an approximate estimation of the capability of sampling the entire phase space of the system for each component. Figure 4 shows the time-dependence of the MSDs in the direction normal to the bulk/vacuum interface. At toluene content of 50 w/w%, the MSDs of TIPS-P and aPS saturated at 15 and 10 nm2, respectively. The thickness T of the ternary system was approximately 10 nm at all times. If each molecule has enough time to diffuse within the thickness, the MSD is expected to be
where s and t are the initial and final positions of a molecule, and 1/T gives the uniform probability density of the position between 0 and T. This formula and T = 10 nm give MSD = 16.7 nm2. Therefore, the saturation of MSDs at 15 and 10 nm2 indicates that the TIPS-P and aPS had enough time to diffuse within the thickness in the systems with toluene content of 50 w/w%. However, the MSDs in the systems with toluene content of 30 w/w% or less did not saturate within the simulated time, which indicates that systems with lower toluene content require simulation times longer than 1000 ns. The diffusion coefficient of each component was also calculated using the least-squares method of linear fitting to the time-MSD curve. The diffusion constants for all toluene contents are listed in Table 2.
3.2.2. Polymer Configuration
To evaluate the effectiveness of sampling the polymer configurations, we computed the end-to-end relaxation time for the aPS chains. The autocorrelation function was used to compute the relation time (Figure 5), where R is the length of the end-to-end distance vector, and the brackets indicate the time average. Then, the relaxation time was computed by integrating the stretched exponential function fitted to the autocorrelation functions, as described in Equation (1).
The values are listed in Table 3. As the toluene content decreased from 50 to 5 w/w%, the relaxation time of aPS increased from ~0.6 to 200 ns. In addition, shorter relaxation times were observed at higher temperatures. The total simulation time was approximately 4–5 times the relaxation time at 5 w/w% toluene. From these data, we can conclude that the sampling of chain conformations is sufficient for all the toluene contents.
3.2.3. Density Profile
From the results of MSD in Figure 4, the system with 50 w/w% toluene was considered under the equilibrium after 500 ns. The density profile of each component was calculated in 50 ns increments from 0 to 1000 ns. Figure 6 shows the density profiles, computed along the normal direction of the bulk/vacuum interface, of the system with 50 w/w% toluene at 50, 500, and 1000 ns. Figure 7 shows the configurations of the same system. The density profile indicates that the concentration of TIPS-P is higher within 1 nm of the surface. However, experimental studies have reported no phase separation when the Mw of PαMS is 2000 or lower [17]. This is because the experimental method does not have a high spatial resolution of 1 nm. Our simulation reveals, for the first time, that the surface contains more TIPS-P molecules than the film, even at a low Mw of 1056. Such phenomena can be considered a precursor of phase separation into a tri-layer structure at the high molecular weight of aPS.
3.2.4. P2 Order Parameter
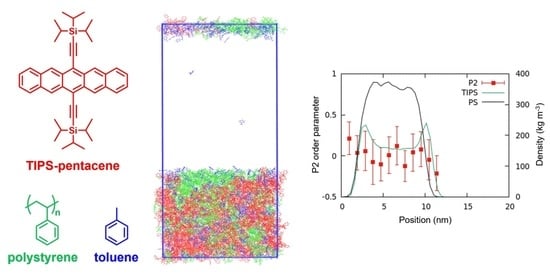
To investigate the orientation in different regions in the bulk and at the bulk/vacuum interface, we calculated the order parameter P2 [40]. The order parameter P2 is defined as , where θ is the angle between the molecular vector of TIPS-P and the direction normal to the bulk/vacuum interface. P2 = −0.5 if the molecular vector is perpendicular to the interface, and P2 = 1 if the molecular vector is parallel to the interface. If the molecules are randomly oriented, P2 = 0. The TIPS-P molecular vector was defined using the positions of the two silicon atoms.
The order parameter P2 was calculated at each slice (thickness: 2 nm) parallel to the surface for a system with 50 w/w% toluene at 300 K at 50, 500, and 1000 ns (see Figure 6). As can be seen from the profiles, the P2 values were almost equal to 0 under all these conditions, which indicates the random orientation of the investigated molecules. This is consistent with the experimental result for PαMS with Mw ≤ 2000 [17].
3.2.5. Surface Profile
Some indication of the roughness of the surface can be obtained from the profile decay. The roughness of the surface can be measured using the root mean squared roughness Rq [41], where Rq is defined as
To this end, the system was divided into 10 × 10 bins in the direction parallel to the bulk/vacuum interface (x, y). For each bin, the largest height h(x, y) was calculated by considering the atom coordinates of both TIPS-P and aPS. The term in Equation (2) is the average height of the surface, computed by considering all 10 × 10 bins. The Rq values computed for all systems are compared in Figure 8.
The main result emerging from the roughness calculation confirms that the TIPS-P and aPS molecules were arranged in a manner that minimizes Rq. Rq was the highest with 50 w/w% toluene (0.31 nm). Rq decreased as the toluene content decreased, and finally, Rq was 0.17 nm with 5 w/w% toluene. The range of Rq agreed with the experimental range (0.2–0.5 nm) [42]. The increase in the amount of toluene perturbed the roughness of both molecules. The temperature did not seem to affect the roughness significantly.
4. Conclusions
We performed a fully atomistic MD simulation for a blend system of TIPS-P and aPS in toluene. The evaporation of toluene was mimicked by a gradual reduction in the number of toluene molecules. The MSDs and diffusion coefficients for all systems indicated that equilibrium states were reached under two conditions: 50 w/w% at 300 K and 50 w/w% at 333 K. The density profile revealed that the concentration of TIPS-P was higher at the interface with vacuum, whereas no clear phase separation was observed because of the low molecular weight of aPS. The high concentration of TIPS-P at the surface is advantageous to forming conductive paths in organic thin-film transistors. The random orientation of the TIPS-P molecules was observed, which is consistent with the experimental results. The analysis of the surface roughness indicated that the TIPS-P molecules were arranged in a manner that produced a smooth surface, which is compatible with the high ordering of the molecules. Further studies with a higher Mw would clarify the film structure with improved mobility in the experiments. However, this requires a CG model instead of a fully atomistic model to reduce the calculation cost and to gain access to the intrinsically faster dynamics of the CG models. The present results can be used to develop CG models and to approach the problem with a multiscale strategy, reintroducing atomic details via backmapping methodology where needed.
Author Contributions
Conceptualization, H.M.; methodology, A.D.N.; formal analysis, T.S., T.O. and A.D.N.; investigation, T.S.; resources, A.D.N. and H.M.; data curation, T.S., T.O. and A.D.N.; writing—original draft preparation, T.S.; writing—review and editing, A.D.N. and H.M.; visualization, T.S.; supervision, A.D.N. and H.M.; project administration, A.D.N. and H.M.; funding acquisition, H.M. All authors have read and agreed to the published version of the manuscript.
Funding
This research was funded by JST CREST, grant number JPMJCR18J2 and JST, the establishment of University fellowships towards the creation of science technology innovation, grant Number JPMJFS2104.
Institutional Review Board Statement
Not applicable.
Informed Consent Statement
Not applicable.
Data Availability Statement
Not applicable.
Acknowledgments
We thank Giuseppe Milano at the University of Naples Federico II for supervising. A.D.N. wishes to thank the HPC team of Enea (http://www.enea.it) for permission to use the ENEA-GRID and the HPC facilities CRESCO (http://www.cresco.enea.it) in Portici.
Conflicts of Interest
The authors declare no conflict of interest.
References
- Garnier, F.; Horowitz, G.; Peng, X.; Fichou, D. An All-organic “Soft” Thin Film Transistor with Very High Carrier Mobility. Adv. Mater. 1990, 2, 592–594. [Google Scholar] [CrossRef]
- Liao, C.; Zhang, M.; Yao, M.Y.; Hua, T.; Li, L.; Yan, F. Flexible Organic Electronics in Biology: Materials and Devices. Adv. Mater. 2015, 27, 7493–7527. [Google Scholar] [CrossRef] [PubMed]
- Mano, T.; Nagamine, K.; Ichimura, Y.; Shiwaku, R.; Furusawa, H.; Matsui, H.; Kumaki, D.; Tokito, S. Printed Organic Transistor-Based Enzyme Sensor for Continuous Glucose Monitoring in Wearable Healthcare Applications. ChemElectroChem 2018, 5, 3881–3886. [Google Scholar] [CrossRef]
- Jeong, H.; Baek, S.; Han, S.; Jang, H.; Kim, S.H.; Lee, H.S. Novel Eco-Friendly Starch Paper for Use in Flexible, Transparent, and Disposable Organic Electronics. Adv. Funct. Mater. 2018, 28, 1704433. [Google Scholar] [CrossRef]
- Wang, X.; Liu, Z.; Zhang, T. Flexible Sensing Electronics for Wearable/Attachable Health Monitoring. Small 2017, 13, 1602790. [Google Scholar] [CrossRef]
- Gao, W.; Ota, H.; Kiriya, D.; Takei, K.; Javey, A. Flexible Electronics toward Wearable Sensing. Acc. Chem. Res. 2019, 52, 523–533. [Google Scholar] [CrossRef] [PubMed]
- Rivnay, J.; Owens, R.M.; Malliaras, G.G. The Rise of Organic Bioelectronics. Chem. Mater. 2014, 26, 679–685. [Google Scholar] [CrossRef]
- Xu, L.; Gutbrod, S.R.; Bonifas, A.P.; Su, Y.; Sulkin, M.S.; Lu, N.; Chung, H.J.; Jang, K.I.; Liu, Z.; Ying, M.; et al. 3D Multifunctional Integumentary Membranes for Spatiotemporal Cardiac Measurements and Stimulation across the Entire Epicardium. Nat. Commun. 2014, 5, 3329. [Google Scholar] [CrossRef] [Green Version]
- Isaksson, J.; Kjäll, P.; Nilsson, D.; Robinson, N.; Berggren, M.; Richter-Dahlfors, A. Electronic Control of Ca2+ Signalling in Neuronal Cells Using an Organic Electronic Ion Pump. Nat. Mater. 2007, 6, 673–679. [Google Scholar] [CrossRef]
- Davis, R.L.; Jayaraman, S.; Chaikin, P.M.; Register, R.A. Creating Controlled Thickness Gradients in Polymer Thin Films via Flowcoating. Langmuir 2014, 30, 5637–5644. [Google Scholar] [CrossRef]
- Zou, M.; Ma, Y.; Yuan, X.; Hu, Y.; Liu, J.; Jin, Z. Flexible Devices: From Materials, Architectures to Applications. J. Semicond. 2018, 39, 011010. [Google Scholar] [CrossRef]
- Corzo, D.; Tostado-Blázquez, G.; Baran, D. Flexible Electronics: Status, Challenges and Opportunities. Front. Electron. 2020, 1, 594003. [Google Scholar] [CrossRef]
- Huang, T.-C.; Fukuda, K.; Lo, C.-M.; Yeh, Y.-H.; Sekitani, T.; Someya, T.; Cheng, K.-T. Pseudo-CMOS: A Design Style for Low-Cost and Robust Flexible Electronics. Trans. Electron Devices 2010, 58, 141–150. [Google Scholar] [CrossRef]
- Klauk, H.; Halik, M.; Zschieschang, U.; Schmid, G.; Radlik, W.; Weber, W. High-Mobility Polymer Gate Dielectric Pentacene Thin Film Transistors. J. Appl. Phys. 2002, 92, 5259–5263. [Google Scholar] [CrossRef]
- Sheraw, C.D.; Zhou, L.; Huang, J.R.; Gundlach, D.J.; Jackson, T.N.; Kane, M.G.; Hill, I.G.; Hammond, M.S.; Campi, J.; Greening, B.K.; et al. Organic Thin-Film Transistor-Driven Polymer-Dispersed Liquid Crystal Displays on Flexible Polymeric Substrates. Appl. Phys. Lett. 2002, 80, 1088–1090. [Google Scholar] [CrossRef]
- Sirringhaus, H. Device Physics of Solution-Processed Organic Field-Effect Transistors. Adv. Mater. 2005, 17, 2411–2425. [Google Scholar] [CrossRef]
- Ohe, T.; Kuribayashi, M.; Yasuda, R.; Tsuboi, A.; Nomoto, K.; Satori, K.; Itabashi, M.; Kasahara, J. Solution-Processed Organic Thin-Film Transistors with Vertical Nanophase Separation. Appl. Phys. Lett. 2008, 93, 286. [Google Scholar] [CrossRef]
- Park, S.K.; Jackson, T.N.; Anthony, J.E.; Mourey, D.A. High Mobility Solution Processed 6,13-Bis(Triisopropyl-Silylethynyl) Pentacene Organic Thin Film Transistors. Appl. Phys. Lett. 2007, 91, 6–9. [Google Scholar] [CrossRef]
- Kang, J.; Shin, N.; Do, Y.J.; Prabhu, V.M.; Yoon, D.Y. Structure and Properties of Small Molecule-Polymer Blend Semiconductors for Organic Thin Film Transistors. J. Am. Chem. Soc. 2008, 130, 12273–12275. [Google Scholar] [CrossRef]
- Anthony, J.E. Functionalized Acenes and Heteroacenes for Organic Electronics. Chem. Rev. 2006, 106, 5028–5048. [Google Scholar] [CrossRef]
- Forrest, S.R. Electronic Appliances on Plastic. Nature 2004, 428, 911–918. [Google Scholar] [CrossRef] [PubMed]
- Riera-Galindo, S.; Leonardi, F.; Pfattner, R.; Mas-Torrent, M. Organic Semiconductor/Polymer Blend Films for Organic Field-Effect Transistors. Adv. Mater. Technol. 2019, 4, 1900104. [Google Scholar] [CrossRef]
- Müller-Plathe, F. Local Structure and Dynamics in Solvent-Swollen Polymers. Macromolecules 1996, 29, 4782–4791. [Google Scholar] [CrossRef]
- Steiner, F.; Poelking, C.; Niedzialek, D.; Andrienko, D.; Nelson, J. Influence of Orientation Mismatch on Charge Transport across Grain Boundaries in Tri-Isopropylsilylethynyl (TIPS) Pentacene Thin Films. Phys. Chem. Chem. Phys. 2017, 19, 10854–10862. [Google Scholar] [CrossRef] [PubMed] [Green Version]
- Jorgensen, W.L.; Maxwell, D.S.; Tirado-Rives, J. Development and Testing of the OPLS All-Atom Force Field on Conformational Energetics and Properties of Organic Liquids. J. Am. Chem. Soc. 1996, 118, 11225–11236. [Google Scholar] [CrossRef]
- Müller-Plathe, F. Unexpected Diffusion Behavior of Gas Molecules in Crystalline Poly(4-Methyl-1-Pentene). J. Chem. Phys. 1995, 103, 4346–4351. [Google Scholar] [CrossRef]
- Chen, J.; Anthony, J.; Martin, D.C. Thermally Induced Solid-State Phase Transition of Bis(triisopropylsilylethynyl) Pentacene Crystals. J. Phys. Chem. B 2006, 110, 16397–16403. [Google Scholar] [CrossRef]
- Bussi, G.; Donadio, D.; Parrinello, M. Canonical Sampling through Velocity Rescaling. J. Chem. Phys. 2007, 126, 014101. [Google Scholar] [CrossRef] [Green Version]
- Abraham, M.; van der Spoel, D.; Lindahl, E.; Hess, B.; the GROMACS Development Team. GROMACS User Manual Version 2016. Available online: https://manual.gromacs.org/documentation/2016/manual-2016.pdf (accessed on 7 January 2023).
- Essmann, U.; Perera, L.; Berkowitz, M.L.; Darden, T.; Lee, H.; Pedersen, L.G. A Smooth Particle Mesh Ewald Method. J. Chem. Phys. 1995, 103, 8577–8593. [Google Scholar] [CrossRef] [Green Version]
- Darden, T.; York, D.; Pedersen, L. Particle Mesh Ewald: An N·log(N) Method for Ewald Sums in Large Systems. J. Chem. Phys. 1993, 98, 10089–10092. [Google Scholar] [CrossRef]
- Hess, B.; Bekker, H.; Berendsen, H.J.C.; Fraaije, J.G.E.M. LINCS: A Linear Constraint Solver for Molecular Simulations. J. Comput. Chem. 1997, 18, 1463–1472. [Google Scholar] [CrossRef]
- Parrinello, M.; Rahman, A. Polymorphic transitions in single crystals: A new molecular dynamics method. J. Appl. Phys. 1981, 52, 7182–7190. [Google Scholar] [CrossRef]
- Ke, Q.; Gong, X.; Liao, S.; Duan, C.; Li, L. Effects of thermostats/barostats on physical properties of liquids by molecular dynamics simulations. J. Mol. Liq. 2022, 365, 120116. [Google Scholar] [CrossRef]
- Wong-ekkabut, J.; Karttunen, M. The good, the bad and the user in soft matter simulations. Biochim. Biophys. Acta 2016, 1858, 2529–2538. [Google Scholar] [CrossRef] [PubMed]
- Anthony, J.E.; Brooks, J.S.; Eaton, D.L.; Parkin, S.R. Functionalized Pentacene: Improved Electronic Properties from Control of Solid-State Order. J. Am. Chem. Soc. 2001, 123, 9482–9483. [Google Scholar] [CrossRef] [PubMed]
- Marcon, V.; Fritz, D.; Van Der Vegt, N.F.A. Hierarchical Modelling of Polystyrene Surfaces. Soft Matter 2012, 8, 5585–5594. [Google Scholar] [CrossRef]
- Qian, H.; Sheetz, M.P.; Elson, E.L. Single Particle Tracking. Analysis of Diffusion and Flow in Two-Dimensional Systems. Biophys. J. 1991, 60, 910–921. [Google Scholar] [CrossRef] [Green Version]
- Tarantino, N.; Tinevez, J.Y.; Crowell, E.F.; Boisson, B.; Henriques, R.; Mhlanga, M.; Agou, F.; Israël, A.; Laplantine, E. Tnf and Il-1 Exhibit Distinct Ubiquitin Requirements for Inducing NEMO-IKK Supramolecular Structures. J. Cell Biol. 2014, 204, 231–245. [Google Scholar] [CrossRef]
- Dalmolen, L.G.P.; Picken, S.J.; de Jong, A.F.; de Jeu, W.H. The order parameters <P2> and <P4> in nematic p-alkyl-p′-cyano-biphenyls: Polarized Raman measurements and the influence of molecular association. J. Phys. 1985, 46, 1443–1449. [Google Scholar]
- Kiely, J.D. Quantification of Topographic Structure by Scanning Probe Microscopy. J. Vac. Sci. Technol. B Microelectron. Nanom. Struct. 1997, 15, 1483. [Google Scholar] [CrossRef]
- Bonaccurso, E.; Graf, K. Nanostructuring Effect of Plasma and Solvent Treatment on Polystyrene. Langmuir 2004, 20, 11183–11190. [Google Scholar] [CrossRef] [PubMed]
Figure 1.
Molecular formulas of (a) polystyrene, C80H82; (b) toluene, C7H8; and (c) TIPS-P, C44H54Si2.
Figure 1.
Molecular formulas of (a) polystyrene, C80H82; (b) toluene, C7H8; and (c) TIPS-P, C44H54Si2.

Figure 2.
Time behavior of mass density for the Berendsen (black) and Parrinello–Rahman (red) barostat algorithms. Only the last 8 ns of trajectory, starting from a well-equilibrated sample, are shown.
Figure 2.
Time behavior of mass density for the Berendsen (black) and Parrinello–Rahman (red) barostat algorithms. Only the last 8 ns of trajectory, starting from a well-equilibrated sample, are shown.

Figure 3.
(a) The different views of a representative equilibrium configuration of TIPS-P crystalline structure obtained via MD simulation. (b) The different views of the TIPS-P crystalline structure obtained via experiment [36]. (c) Comparison between simulated and experimental [36] powder X-ray diffraction patterns of the TIPS-P crystal.

Figure 4.
Time-dependence of the MSDs at different toluene contents and temperatures. TIPS-P (green), aPS (red), and toluene (black, dotted line).
Figure 4.
Time-dependence of the MSDs at different toluene contents and temperatures. TIPS-P (green), aPS (red), and toluene (black, dotted line).

Figure 5.
Autocorrelation functions of the end-to-end distance for the systems of 50 w/w% toluene at 300 K and 333 K (a,b) and 5 w/w% toluene at 300 K and 333 K (c,d).
Figure 5.
Autocorrelation functions of the end-to-end distance for the systems of 50 w/w% toluene at 300 K and 333 K (a,b) and 5 w/w% toluene at 300 K and 333 K (c,d).

Figure 6.
Density profiles of aPS (black curve) and TIPS-P (green curve) together with the P2 order parameters of TIPS-P for the systems with 50 w/w% toluene at 300 K.
Figure 6.
Density profiles of aPS (black curve) and TIPS-P (green curve) together with the P2 order parameters of TIPS-P for the systems with 50 w/w% toluene at 300 K.

Figure 7.
Configurations of the system containing 50 w/w% toluene at 300 K at 50, 500, and 1000 ns. Owing to the applied periodic boundary condition, there are two bulk/vacuum interfaces in our simulation box. (Red: aPS, blue: toluene, and green: TIPS-P).
Figure 7.
Configurations of the system containing 50 w/w% toluene at 300 K at 50, 500, and 1000 ns. Owing to the applied periodic boundary condition, there are two bulk/vacuum interfaces in our simulation box. (Red: aPS, blue: toluene, and green: TIPS-P).

Figure 8.
Surface roughness Rq (nm) of the mixed film with standard error (sample size is 3) at different toluene contents.
Figure 8.
Surface roughness Rq (nm) of the mixed film with standard error (sample size is 3) at different toluene contents.


Table 1.
Composition of the simulated systems.
| w/w% Toluene | # of Toluene | # of TIPS-P | # of aPS Chain | Box [x, y, z] (nm) | Total Time (µs) |
|---|---|---|---|---|---|
| 50 | 2700 | 150 | 150 | 9.5; 19.0; 9.5 | 1 |
| 30 | 1620 | 150 | 150 | 8.7; 8.7; 40.0 | 1 |
| 20 | 1080 | 150 | 150 | 7.8; 7.8; 30.0 | 1 |
| 10 | 540 | 150 | 150 | 7.9; 7.9; 20.0 | 1 |
| 5 | 270 | 150 | 150 | 7.6; 7.6; 20.0 | 1 |
Table 2.
Diffusion coefficients with standard error (sample size is 4) inside the bulk in the normal direction of the surface for toluene, TIPS-P, and aPS.
Table 2.
Diffusion coefficients with standard error (sample size is 4) inside the bulk in the normal direction of the surface for toluene, TIPS-P, and aPS.
| Toluene Content (w/w%) | Toluene (cm2/s) | TIPS-P (cm2/s) | aPS (cm2/s) | |||
|---|---|---|---|---|---|---|
| 300 K | 333 K | 300 K | 333 K | 300 K | 333 K | |
| 50 | (5.63 ± 0.07) × 10−6 | (1.33 ± 0.01) × 10−5 | (8.0 ± 0.7) × 10−7 | (1.29 ± 0.04) × 10−6 | (5.9 ± 0.2) × 10−7 | (10 ± 1) × 10−7 |
| 20 | (2.5 ± 0.5) × 10−6 | (3 ± 2) × 10−6 | (7.2 ± 0.5) × 10−8 | (2.1 ± 0.4) × 10−7 | (5.1 ± 0.4) × 10−8 | (2.0 ± 0.3) × 10−7 |
| 10 | (1.6 ± 0.1) × 10−6 | (3.4 ± 0.8) × 10−6 | (1.8 ± 0.3) × 10−8 | (7 ± 1) × 10−8 | (1.17 ± 0.08) × 10−8 | (6.8 ± 0.8) × 10−8 |
| 5 | (9 ± 3) × 10−7 | (1.8 ± 0.8) × 10−6 | (4 ± 1) × 10−9 | (1.5 ± 0.4) × 10−8 | (4 ± 1) × 10−9 | (1.2 ± 0.3) × 10−8 |
Table 3.
Relaxation time () computed for systems at 50 and 5 w/w% toluene. Standard errors were calculated by dividing the 150 aPS chains into 10 groups.
Table 3.
Relaxation time () computed for systems at 50 and 5 w/w% toluene. Standard errors were calculated by dividing the 150 aPS chains into 10 groups.
| Toluene Content (w/w%) | Temperature (K) | (ns) |
|---|---|---|
| 50 | 300 | 0.64 ± 0.03 |
| 50 | 333 | 2.2 ± 0.1 |
| 5 | 300 | 240 ± 20 |
| 5 | 333 | 190 ± 30 |
Disclaimer/Publisher’s Note: The statements, opinions and data contained in all publications are solely those of the individual author(s) and contributor(s) and not of MDPI and/or the editor(s). MDPI and/or the editor(s) disclaim responsibility for any injury to people or property resulting from any ideas, methods, instructions or products referred to in the content. |
© 2023 by the authors. Licensee MDPI, Basel, Switzerland. This article is an open access article distributed under the terms and conditions of the Creative Commons Attribution (CC BY) license (https://creativecommons.org/licenses/by/4.0/).
Share and Cite
MDPI and ACS Style
Suzuki, T.; De Nicola, A.; Okada, T.; Matsui, H. Fully Atomistic Molecular Dynamics Simulation of a TIPS-Pentacene:Polystyrene Mixed Film Obtained via the Solution Process. Nanomaterials 2023, 13, 312. https://doi.org/10.3390/nano13020312
AMA Style
Suzuki T, De Nicola A, Okada T, Matsui H. Fully Atomistic Molecular Dynamics Simulation of a TIPS-Pentacene:Polystyrene Mixed Film Obtained via the Solution Process. Nanomaterials. 2023; 13(2):312. https://doi.org/10.3390/nano13020312
Chicago/Turabian StyleSuzuki, Tomoka, Antonio De Nicola, Tomoharu Okada, and Hiroyuki Matsui. 2023. "Fully Atomistic Molecular Dynamics Simulation of a TIPS-Pentacene:Polystyrene Mixed Film Obtained via the Solution Process" Nanomaterials 13, no. 2: 312. https://doi.org/10.3390/nano13020312
Note that from the first issue of 2016, this journal uses article numbers instead of page numbers. See further details here.