
Luminescence Thermometry with Nanoparticles: A Review

Centre of Excellence for Photoconversion, Vinča Institute of Nuclear Sciences—National Institute of the Republic of Serbia, University of Belgrade, P.O. Box 522, 11001 Belgrade, Serbia
*
Author to whom correspondence should be addressed.
Nanomaterials 2023, 13(21), 2904; https://doi.org/10.3390/nano13212904
Submission received: 12 October 2023
/
Revised: 31 October 2023
/
Accepted: 2 November 2023
/
Published: 5 November 2023
(This article belongs to the Section Inorganic Materials and Metal-Organic Frameworks)
Abstract
:Luminescence thermometry has emerged as a very versatile optical technique for remote temperature measurements, exhibiting a wide range of applicability spanning from cryogenic temperatures to 2000 K. This technology has found extensive utilization across many disciplines. In the last thirty years, there has been significant growth in the field of luminous thermometry. This growth has been accompanied by the development of temperature read-out procedures, the creation of luminescent materials for very sensitive temperature probes, and advancements in theoretical understanding. This review article primarily centers on luminescent nanoparticles employed in the field of luminescence thermometry. In this paper, we provide a comprehensive survey of the recent literature pertaining to the utilization of lanthanide and transition metal nanophosphors, semiconductor quantum dots, polymer nanoparticles, carbon dots, and nanodiamonds for luminescence thermometry. In addition, we engage in a discussion regarding the benefits and limitations of nanoparticles in comparison with conventional, microsized probes for their application in luminescent thermometry.
1. Introduction
Nanoparticles are defined as materials that possess dimensions inside the nanoscale range, namely measuring less than 100 nm. These materials have become important players in contemporary technologies, with numerous and significant uses. Luminescent nanoparticles have garnered substantial attention among the scientific community due to their many present-day uses, including but not limited to solid-state lighting, solar cells, displays, dosimetry, medical imaging, phototherapy, counterfeiting, and physical and chemical sensing [1]. Nanoparticles exhibit characteristics that are not seen in their bulk counterparts as a result of the reduction in their size. The electronic and phonon quantum confinements, high surface area, and surface features facilitating specialized interactions are key factors contributing to their distinct properties and appealing applications.
Luminescent nanoparticles are also successfully used as luminescence thermometry probes. This optical technique for the remote sensing and measurement of temperature relies on the detection of temperature-induced changes in the luminescence of probe materials. The detection can be steady-state or time-resolved in both downshifting and up-conversion emission measurements. So far, all types of luminescent materials have been tested for various applications of luminescence thermometry. This is possible because luminescence is always affected by temperature to some extent. The type of material used depends on application demands and available instrumentation. However, luminescent nanoparticles were the sole choice for luminescence thermometry in biomedicine, integrated optoelectronics, and nanoscale environments [2]. They were used either just for temperature sensing or to simultaneously serve additional tasks, such as bioimaging, localized heating, chemical sensing, etc. The method can be used in biological systems in vitro or in vivo, where temperature variations in kelvin have been measured. This amount of temperature variation cannot be justified considering the power generated by cell metabolism and the laws of thermal transport [3]. The quantum efficiency of emission and the biocompatibility of the material are also important factors to consider when utilizing nanoparticles.
The spectral positions of emission and excitation bands, the intensity of emission bands, the ratio of the intensities of emission bands, excited state lifetimes, and emission rise times are the features readily used to determine the temperature of luminescence probes. They can be used either separately or in combination to perform single-parameter thermometry or multiparameter thermometry. In this case, the choice depends not only on the application demands and available instrumentation but also on the available materials. The latter differ in luminescence characteristics and in thermometric performances, which are usually quantified by the relative sensitivity, temperature, and spatial and temporal resolutions. It is worth mentioning that the thermometric performances of luminescence nanoparticles differ from those of their bulk counterparts [4]. In addition, some of them, mostly semiconductor quantum dots, exhibit notable size dependence.
A substantial body of literature exists on the subject of luminescence thermometry, encompassing several books [2,4,5] and review papers [6,7,8,9,10]. Nevertheless, there is a notable absence of comprehensive review sources that thoroughly explore the application of nanoparticles in luminescent thermometry. This review paper aims to address this deficiency by providing a comprehensive analysis of this area. It is primarily focused on an overview of the recent utilization of nanoparticles for luminescence thermometry and not on the luminescence thermometry methodology itself. The review addresses both inorganic and organic nanoparticles, namely lanthanide and transition metal nanophosphors, semiconductor quantum dots, polymer nanoparticles, carbon dots, and nanodiamonds.
2. Lanthanide Activated Nanoparticles
Lanthanide-activated materials were among the first to find usage in luminescence-based temperature measurements and have been, by far, the most widely employed [4]. They consist of lanthanide ions as optically active centers that are incorporated into hosting insulators or wide band gap semiconductors. Even though lanthanides include sixth group elements form the periodic table, from 57La to 71Lu, only elements from 58Ce to 70Yb transform into ions that possess specific electronic configurations which result in a diversity of luminescence features. The most common trivalent lanthanide ions are formed by removing electrons from the outer 5d and/or 6s orbitals, leaving only partly filled 4f orbitals. In this way, optically active 4f electrons are shielded inside the outer 5s2 and 5p6 shells, which are in fact energetically lower. This indicates that the optical properties of lanthanides are only slightly impacted by their surroundings, resulting in typically narrow spectral bands formed by sets of well-defined peaks. However, the crystal environment is important in lanthanide luminescence because electronic transitions between 4f levels, which are forbidden by Laporte’s selection rules, become partially allowed when the lanthanide senses an asymmetric field from the host crystal lattice [11]. The diversity of energy levels of a lanthanide ion within the crystal lattice is depicted schematically in Figure 1a, including the order of magnitude of the energetic separation between sublevels. The levels are noted as , ( is orbital angular momentum, noted as S, P, D, F, G, H, … for , respectively; is spin angular momentum; is total angular momentum; when and when ), and are much more influenced by the spin–orbit interaction than the crystal field. The number of Stark sublevels that originated from the crystal field is when is an integer and when is a half-integer number. Numerous energy levels of lanthanide ions provide a variety of luminescent emissions throughout the long spectral range from UVA to NIR, Figure 1.
Each lanthanide ion has a specific luminescent fingerprint according to its set of energy states [11]. Trivalent Sm3+ (4f5 configuration), Eu3+ (4f6), Tb3+ (4f8), Dy3+ (4f9), and Ho3+ (4f10) ions have largely separated energy levels and exhibit strong emissions in the visible region [4]. Nd3+ (4f3), Er3+ (4f11) and Tm3+ (4f12) ions, whose energy levels have smaller energy differences, usually radiate in the NIR region. The Ce3+ ion is an unusual example of trivalent lanthanides because of its large energy 4f–5d transition, which differs from the typical 4f–4f lines of other Ln3+. The emission of Gd3+ is located at a shorter wavelength in the ultraviolet spectral range due to the absence of sufficient intermediate states; therefore, it is not commonly used as an emitting center in luminescence thermometry [4]. Only recently, Yu et al. [12] have demonstrated that YAl3(BO3)4 is activated by the Pr3+–Gd3+ pair for ratiometric luminescence thermometry in the UV spectral range.
Regardless of the excitation scheme, the luminescent properties of lanthanide-doped nanoparticles are temperature-dependent in a variety of ways. As the temperature rises, the various emission peaks broaden as a result of lattice vibrations, the overall intensity of the spectrum decreases, and the lifetimes of radiative transitions shorten as non-radiative phonon relaxations become more probable. All of these phenomena have been proposed and verified as a basis for temperature sensing with lanthanide-doped nanoparticles [4,6,13]. Each lanthanide energy state can potentially be used to sense temperature. Depending on the experiment, this provides a wide spectrum of excitation and emission wavelengths [14]. As primary disadvantages, one should mention the lower absorption cross-sections and quantum yields of f–f transitions in lanthanide-doped nanoparticles compared with those of other luminescent probes, which must often be compensated for by a higher excitation power or a prolonged detection time [14]. The ability of this class of nanothermometers to optimize sensing performance for different temperature ranges—from cryogenic regions (4 K) to regions with temperatures as high as >1400 K—is a remarkable advantage for many applications including those in harsh environments [15,16,17]. From the point of view of biocompatibility, while lanthanide doped NPs are basically considered as chemically nontoxic, toxicity due to nanoparticle size may pose some concerns [18].
The initial utilization of lanthanide-based phosphors for luminous temperature monitoring was documented by Kusama et al. [19], who investigated the cathodoluminescence of Y2O2S:Eu3+. Interest in this topic surged around 2010, owing mostly to the realization of luminescence thermometry’s great potential in nanotechnology and nanomedicine [6].
Lanthanide-based nanoparticles (NPs) utilized in luminescent thermometry can be categorized into two types, based on energy path phenomena and the number of photons absorbed and released. These types are known as downshifting and upconverting NPs [20]. In downshifting, NPs absorb high-energy photons and subsequently re-emit lower energy photons. Almost all lanthanide ions can be used for Boltzmann-type LIR temperature sensing, and downshifting lanthanide-based NPs are a good choice when a high energy absorption is practically feasible [4]. Most literature reports involve the use of Eu3+, Dy3+ and Nd3+ ions.
Recently, Trejgis et al. [21] developed a new concept of luminescence-based temperature sensing and 2D mapping using the intensity of the emission band under excited state absorption (ESA) of Eu3+-doped LiLaP4O12 nanocrystals of approximately 20 nm size. In this particular approach, it is shown that at lower temperatures, the population of the ground state is predominant (Figure 2a). Consequently, the absorption process of the ground state becomes highly effective, resulting in a strong intensity of the excited emission achieved at the wavelength (wavelength of the emission obtained upon the ground state absorption). Nevertheless, as per the Boltzmann distribution, it is seen that at higher temperatures, the relative population of the excited state (7F1–6) is greater than that of the ground state (7F0), Figure 2b. In this particular scenario, the temperature-dependent factor pertains to the LIR (Luminescence Intensity Ratio) of a solitary emission band acquired using two distinct excitation wavelengths, one resonating with the Ground State Absorption (GSA) and the other resonating with the Excited State Absorption (ESA). The authors examined the excitation and the emission within the temperature range of −150 to 400 °C and obtained sensitivity as high as 2.17% K−1 (at 200 K), and 1.9% K−1 (at 200 K).
In Table 1, the most recent results of typical nanothermometry studies of downshifting nanoparticles made from lanthanides are shown.
Upconverting nanoparticles (UC NPs) possess the potential to achieve light emission characterized by a shorter wavelength and more energy compared with the excitation process. This phenomenon is facilitated by a nonlinear optical process known as upconversion [13,14,34,35,36]. Typically, the phenomenon is seen through the sequential absorption of two or more photons with low energy, subsequently resulting in the emission of a photon with higher energy. Various mechanisms have been put forth to elucidate the phenomenon of upconversion, including excited-state absorption, energy transfer upconversion, photon avalanche, cooperative sensitization upconversion, and energy migration upconversion [37]. In general, the process of upconverting nanoparticles (UCNPs) involves the introduction of a single ion, known as the activator. This activator ion, which may include ions such as Er3+, Ho3+, and Tm3+, is responsible for generating emissions through excited state absorption or energy transfer between ions of the same species. Frequently, the addition of two distinct ions is employed to enhance the upconversion quantum yield and absorption cross-section. This involves the introduction of an activator ion alongside a sensitizer ion, which possesses the ability to absorb energy and subsequently transmit it to the adjacent activator within the crystal lattice [4,34]. An exemplary instance of an upconverting ion pair that holds significant relevance in the field of thermometry is the Yb3+–Er3+ pair. In this system, Yb3+ ions exhibit absorption of radiation at approximately 980 nm, while the absorbed energy is subsequently transferred to Er3+ ions, leading to their excitation through a series of resonant transitions. In addition to this, it is worth noting that the energy level of the excited state of Yb3+ closely aligns with that of Ho3+ and Tm3+ excited states. This alignment facilitates efficient resonant energy transfer [4]. The utilization of upconverting luminous nanoparticles appears primarily in biological contexts, as the use of low-energy near-infrared (NIR) excitations does not pose any harm to living entities [38]. The first report of a UCNP-based nanothermometer for in vitro measurement was reported by Vetrone et al. who used PEI-coated NaYF4:Yb3+/Er3+ nanocrystals to measure the intracellular temperature of HeLa cells [39]. Tm3+ ion is also suitable for UC nanothermometry in bioapplications since it emits within the biological windows of transparency of tissues [40].
Runowski et al. [41] recently reported results of the upconverting nanoparticles of YVO4 co-doped with Yb3+-Tm3+ for sensing high temperatures—up to 1000 K. Their particles of 50–100 nm sizes exhibit upconversion emission of Tm3+ and Yb3+ ions upon the 975 nm laser excitation. For temperature sensing in the low-temperature range, the authors used relative intensities of the Tm3+ emissions from thermally coupled levels (TCLs), while for the high-temperature range, the intensity ratio of the nonthermally coupled levels (non-TCLs) of Yb3+ and Tm3+ was exploited. Even at extreme temperatures, these NIR bands are quite intense, and their intensity ratio fluctuates dramatically, allowing accurate temperature detection. The sensitivities of these two methods are 2.86% K−1 (at 300 K) and 2.13% K−1 (at 1009 K), as shown in Figure 3.
Recent results of the typical nanothermometry explorations of lanthanide-based upconverting nanoparticles are summarized in Table 2.
Despite the fact that there have been few reports on the use of divalent lanthanide ion-activated phosphors in luminescence thermometry, we are not aware of the usage of corresponding nanoparticles.
3. Transition Metal Ion-Activated Nanoparticles
Transition metal ion-activated photoluminescent nanoparticles are a broad range of compounds that, together with lanthanide-doped nanoparticles, are commonly employed in luminescent thermometry. In this context, ions of transition elements belonging to the fourth period of the periodic table (namely, from 22Ti to 30Zn) function as optically active centers, which are included in insulating materials or large band gap semiconductors. When a transition metal ion (TM) is incorporated into a solid host, its outer 4s electrons are removed, leaving partially filled 3d shells as optically active [49]. Therefore, the electronic configuration of TM ions is 3dn (), where partially occupied d orbitals provide various energy levels for possible optical transitions. Correspondingly, all TM ions with the same configuration exhibit similar optical properties [4]. In contrast to the 4f-orbitals of lanthanide ions, d-orbitals are not protected from the outside environment, making TM ions highly sensitive to the features of the materials host, particularly its crystal field strength [49]. All this implies that the spectroscopic properties of TMs as optical probes are the consequence of the specific ion’s electronic configuration, as well as the crystal field potential of ligands [4]. The influence of a host crystal lattice on a TM ion inside it is elucidated using crystal field theory [50], where the TM ions are subjected to the electrostatic field from the surrounding atoms (ligands) and treated as negative point charges located in the corners of the coordination polyhedron. Thus, the crystal field of the ligands causes perturbation of the energy levels of d-orbitals, which is usually much stronger (~104 cm−1) than the spin-orbit interaction (~102 cm−1). The total separation of 3d energy levels—the crystal field strength (CFS)—is denoted by Δ or 10Dq, and it strongly depends on the coordination number and symmetry of the crystalline environment. In Figure 4a, the splitting of the 3d energy levels in octahedral and tetrahedral environments is presented [10]. Further separation can occur via the so called Jahn–Teller effect, with the deformation in the coordination polyhedron (Figure 4b) [51]. Other parameters of interest in the crystal field theory are the so called Racah parameters A, B, and C, where B is the most important one and represents the individual d electron repulsion [4]. The important and useful tools for the prediction and explication of the TM-doped phosphors’ spectroscopic properties are the Tanabe–Sugano diagrams, calculated for each electronic configuration in an octahedral crystal field [52]. They provide the energy layout of the electronic states, with their symmetry and term notations, with respect to the crystal field parameters Dq/B. The exemplary Tanabe–Sugano diagram for the d2 configuration (exists in Ti2+, V3+, Cr4+, Mn5+, Fe6+ ions) is shown in Figure 4c. The free ion energy levels correspond to . The lowest energy level, the ground state, coincides with the x-axis. The free ion levels are noted as , where the values for can be 0 (indicated by S), 1 (P), 2 (D), 3 (F), 4 (G). When incorporated into the crystal field, a TM ion’s levels are given by , where can be A (no degeneracy), E (double degeneracy, doublet), or T (triplet) [49]. The increase in the crystal field strength does not influence all the levels in the same way—the levels with the higher slope in the diagram are more sensitive to the values. Figure 4d displays representative transition metal ions that are most frequently used in luminescent thermometry, and their emissions span from the UV to NIR spectral range [10].
The Cr3+ ion was one of the first transition metal ions to be used in luminescence temperature measurements [53,54]. It is also the most widely employed of all the TM ions, followed by manganese ions of different valence (Mn2+, Mn3+, Mn4+, Mn5+), while other ions of interest are Ti3+, Ti4+, V3+, V4+, Fe3+, Co2+, and Ni2+ [10]. In the ever-growing field of biological research, ions like Ti2+, Co2+, Ni2+, V2+, and Cr4+ are finding their use in temperature measurements of tissues and cells in all three biological windows [4]. When discussing transition metal ion-doped nanoparticles, various temperature-dependent spectroscopic properties can be monitored, such as changes in TM ion emission intensities, emission bandwidths, bandshifts, or excited state lifetimes, as well as the intensity ratios between different emission bands. In order to explain and quantify these changes, different theoretical models have been proposed [7,10]. Generally speaking, in this type of luminescent nanoparticle, both radiative and non-radiative transition rates alter with temperature, making their luminescence intensity highly sensitive to temperature fluctuations, which results in excellent thermometric performances [55,56,57]. The advantages of using TM ions as optical probes over lanthanide ions, which have undoubtedly dominated this research area, lie in their distinctive spectroscopic properties. As they strongly depend on the type of material into which they are placed, their temperature-changing characteristics can be modulated by choosing the appropriate matrices [58]. Furthermore, they have much higher absorption cross-sections than that of the f–f transitions of Ln3+ ions, allowing for enhanced luminescence brightness. Very often, hosts are being co-doped with lanthanide and transition metal ions, which may offer interesting phenomena and improved thermometric properties [57,59,60,61,62]. Lanthanide ions can activate additional methods of thermal quenching of the TM’s excited states, as well as introduce supplementary transitions for ratiometric thermometry methods.
The initial record of using temperature-dependent luminescence behavior in materials doped with transition metal (TM) ions for thermometry was reported in 1997 by Fernicola et al. [53]. In their study, they developed fiber optic thermometers using Cr-doped forsterite and olivine crystals. The researchers investigated the decay of strong near-infrared emission throughout the temperature range of 77–373 K. They discovered a significant decrease in the emission lifetime, which was shown to be four times shorter across this temperature range. Nevertheless, the present analysis lacks information regarding this sensitivity.
An interesting example of the Cr3+ (d3 configuration) use in nanothermometry is presented in the work of Avram et al. [63]. The authors synthesized Cr3+-doped zinc gallate (ZnGa2O4:Cr) nanoparticles and co-doped them with Ge4+, obtaining the particle size of ~50 to 80 nm. The characteristic spin-forbidden 2E → 4A2 transition of the Cr3+ ion that appears around 700 nm in the emission spectrum was monitored. The lifetime of this transition is in the milliseconds range, and it was used for luminescence thermometry in the temperature span of 303–533 K. The ZnGa2O4:0.05Cr nanoparticles exhibited the best performance, with the maximum sensitivity of 1.25% K−1 at 493 K (Figure 5a). These authors have also developed an experimental setup for real-time thermal imaging (the method is schematically presented in Figure 5b and the thermal image obtained by it in Figure 5c).
The Mn5+ ion has recently been proven as an important luminescent activator for biological applications. Its intense and narrow emission band lies in the second biological window, while the excitation is in the first biological window. There are certain prerequisites for these features— a tetrahedral crystal environment, a sufficient host’s energy band gap, as well as the suitable composition that enables the stability of the 5+ valence state [10]. A very recent report on accurate deep-tissue thermal monitoring using a Mn5+ ion was published by Piotrowski et al. [64]. The authors examined the temperature dependence of the excited level lifetimes of Mn5+-doped Ba3(VO4)2 nanoparticles of the average size of ~52 nm, as well as the influence of co-doping with different lanthanide ions (Nd3+, Pr3+, Tm3+, Er3+), with the main results shown in Figure 6. The emission transition 1E → 3A2, which appears at 1178 nm and reaches lifetime values of 450 µs, served for thermal probing. The optimized composition of the nanothermometer is Ba3(VO4)2:1%Mn5+,0.5%Er3+, which features relative thermal sensitivity between 0.5 and 1.2%K−1 in the 350–500 K temperature range. This research also contains the proof-of-concept experiment of thermal imaging in vivo.
In Table 3, the most recent results of luminescence thermometry studies using the nanoparticles activated by transition metal ions are shown.
At the transition from bulk to nanocrystalline lanthanide and transition-activated materials, certain thermometric properties are maintained (ratiometric), while others can significantly differ (emission decay times and emission bandwidths). It is therefore useful to look at these properties in bulk materials, which are given, for example, in reference [4].
4. Semiconductor Quantum Dots
Semiconductor quantum dots (QDs) are defined as semiconductor nanocrystals, i.e., inorganic particles in the size range of 1–10 nm, that are generally composed of II-VI and III-V elements [75,76,77,78]. Currently, QDs are also based on I–VI, IV–VI, I−III−VI elements, as well as transition-metal dichalcogenides, perovskites, and carbon [76,79]. Their zero-dimensionality causes the quantum confinement of their charge carriers and some unique and fascinating optical properties of QDs arise—sharp and symmetrical emission spectra, high quantum yield, good chemical and photo-stability, and size-dependent emission wavelength tunability [80]. In addition, they display acceptable biocompatibility and biofunctionality after capsulating and/or surface modification [18,79]. The size of QDs can be controlled by regulating nanometer accuracy during chemical synthesis, which results in the adjustability of their emissions from the UV to the near-infrared spectral range. Like all semiconductors, the QDs possess the valence- and the conduction band, separated by a band gap. Their charge carriers are formed when the electrons are excited to the conduction band, leaving holes in the valence band. The electron-hole pairs, bounded through the Coulomb interaction, are called excitons. As the size of the QD reduces, quantum confinement in both the electron and hole wavefunctions leads to an increase in the QD’s effective bandgap and the appearance of the discrete energy levels in the vicinity of the valence- and conduction band. Hence, different optical transitions become possible and luminescence can be tuned [14,18]. The critical parameters that determine QDs’ luminescent properties are as follows: QD’s particle radius (R) and Bohr radius (electron-hole distance in an exciton, ). The mutual relationship of these quantities, as well as the influence of R on luminescent color in various QDs, are illustrated in Figure 7.
From the point of view of thermal sensing, several properties of the quantum dots’ emission are affected by temperature—intensity, lifetime, peak position, and Stokes-shift (spectral separation between absorption and emission). The simplest of them is the emission intensity thermal evolution, but it is influenced by the particle concentration and excitation power fluctuations [14]. The method based on the temperature-dependent spectral shift of the emission wavelength is the best known [81], and it overcomes the drawbacks of the intensity-based methods, as the thermal reading is unaffected by the local variations [78]. This phenomenon occurs as a consequence of different effects, such as bandgap energy thermal change, quantum effects, electron phonon coupling, quantum yield variations, and the thermal expansion of the crystalline lattice [81]. The temperature dependence of QD luminescence is a complex phenomenon in which both the nature and the magnitude of the thermally originated changes depend on the QDs’ size [4]. Introducing impurities to semiconducting quantum dots (mostly Mn2+ and Eu3+) may offer additional possibilities in terms of temperature read-outs, as these bring in new levels inside or outside the QDs’ band gaps [4,82,83].
To the best of our knowledge, the luminescence temperature dependence of QD nanoparticles was originally observed by Joly et al. in 2001. They explored the luminescence behavior of ZnS:Mn2+ at temperatures 11–273 K and discussed its mechanisms [84]. A bit later, Wang et al. reported the thermal behavior of CdTe nanoparticles (~4 nm size, 30–60 °C temperature range, 350 nm excitation), and found the emission intensity decreased linearly and reversibly with a sensitivity of 1.1%/°C [82]. These results paved the way for future investigations in this field. One of the first demonstrations of suitability of using QDs for temperature sensing in vitro was demonstrated in 2010 by Maestro et al. [85], who examined CdSe dispersed in phosphate buffered saline for biomedical imaging by measuring the temperature evolution of a single HeLa cancer cell.
The exciton absorption band shift can also be used for temperature measurement, as shown by Savchenko et al. [86]. These authors have tested the optical absorption spectra ranging from 6.5 to 296 K of colloidal InP/ZnS core-shell quantum dots with the coating of a modified polyacrylic acid. The results show that the first exciton absorption band, which is attributed to the InP exciton band, shifts towards higher energies when cooled from room temperature. The obtained experimental data have been approximated by means of a linear model and Fan’s expression (presented in Figure 8).
Recently, Marin et al. have produced two types of nanocomposite materials based on mercaptosilane-passivated CuInS2/ZnS core-shell quantum dots, the performance of which was tested for luminescence thermometry and luminescent labels [87]. These QDs were deposited onto silica nanoparticles and embedded into polymeric film. Luminescence thermometry was performed on the nanocomposite QD-based film in the temperature range of 140–340 K. The authors monitored the thermal parameter (Δ) as the ratio between the sum of integrated area of the two red-most emission components (2) + (3), and the one centered at 642 nm (1) (Figure 9c). The obtained thermal sensitivity reached values of ~2.3%/K.
Recent results of the typical nanothermometry explorations of quantum dots are summarized in Table 4.
5. Polymer Nanoparticles
Organic substances demonstrating photoluminescent properties can be categorized into various classes, including organic dyes, pigments, polymers, and proteins [14,18,78]. The fundamental basis for luminescence in organic compounds is in the π-electron systems present within individual molecules. These systems give rise to electronic transitions between molecular orbitals, leading to the absorption and emission of light [94]. The elucidation of luminescence in organic molecules can be effectively explicated by the renowned Jablonski diagram (Figure 10a). Starting with the initial state known as the ground state, typically denoted as S0 and characterized by singlet spin, the molecule undergoes a transition to higher energy states, namely singlet (Si) or triplet (Ti) states, upon the absorption of a photon. These excited states, with i being greater than or equal to 1, exhibit distinct vibrational and rotational energy levels. Then, the molecule quickly relaxes from the higher energy excited singlet states (in the ps range) to the lowest singlet state S1 through internal conversion (IC), from where it decays back to the ground state S0 either radiatively (fluorescence) or nonradiatively (through IC or external conversion, EC). Alternatively, the molecule can undergo an intersystem crossing (ISC) (in the 10 ns range) and transit to a triplet state. It should be noted that the singlet –singlet transition, , is more probable than the singlet–triplet transition, , as the latter is spin-forbidden since it involves a spin multiplicity change. From there, the transition can be either radiative (phosphorescence) or nonradiative (ISC or EC). The time frame of the phosphorescence can even be in the millisecond range, precisely because of its forbidden nature [94]. The spectral properties of organic compounds arise from these transition mechanisms, and often contain a specific vibronic structure as well, as schematically illustrated in Figure 10b.
The flexibility of organic compounds is considered to be one of their primary advantages in comparison with other thermometric nanoparticles. A diverse array of organic fluorophores is already accessible, each engineered to possess distinct characteristics such as absorption and emission wavelengths, spectrum range, solubility, and functionalization capabilities [18]. Furthermore, these temperature sensors have the capability to be seamlessly integrated with other organic or inorganic species, resulting in the formation of hybrid sensors [4]. Although the temperature-dependent quenching mechanism may differ between compounds, the generalized, fundamental photodynamics can be explained using the Jablonski energy-level model. The relative probability for the excited molecule to descend to the ground state via the radiative or nonradiative path(s) changes when the temperature changes, effectively modifying the molecule’s luminescence intensity (and lifetime). The variation in decay rates with temperature is a consequence of complex and sometimes competing effects [18]. The most utilized thermometric organic dyes are fluorescent, such as fluorescein of rhodamine B, and their emission and lifetime change with temperature [14]. Green Fluorescent Protein (GFP) is an interesting example of in vivo temperature measurements and fluorescence imaging at the cellular level, because its temperature-dependent characteristic is fluorescence polarization anisotropy [78]. One should also mention the application in aerodynamics, where organic dyes are mixed with paints to form pressure-sensitive paints (PSP), which are used to monitor pressure and temperature on aircraft model surfaces [18]. Qiao et al. [95] classify the fluorescent polymeric nano-thermometers into two categories: thermosensitive polymer-based and nonthermosensitive polymer-based. Both groups comprise a polymer and organic fluorescent dye. Thermosensitive polymer undergoes a reversible phase transition with temperature that induces a change in the optical properties of a dye incorporated in it. Nonthermosensitive polymer serves only as a matrix of physically embedded optically active organic dye [95].
Meng et al. [96] have monitored the intracellular temperature of Hep-G2 cells under photothermal therapy using the ratiometric fluorescent thermometer. Thermometric organic nanoparticles were prepared by encapsulating thermoresponsive NIR fluorophores (dyes)—TBB (2-([1,1′-biphenyl]-4-yl)-3-(4-((E)-4-(diphenylamino)styryl) phenyl) fumaronitrile) and Rhodamine 110—into an amphiphilic polymer matrix F127 to form TBB&R110@F127 nanoparticles of about 50 nm size and a narrow size distribution (Figure 11b). Upon the 480 nm excitation, TRF NPs exhibited double peaks (520, 680 nm) originated from two different fluorophores. The ratio of these peaks was used to measure thermographic properties in the temperature range of 25–65 °C, yielding a relative sensitivity of 2.37%·°K−1 (Figure 11b,c). Also, the stability of this polymer thermometer was confirmed by repeating cycles of heating and cooling [96].
Another example of organic thermographic nanoparticles was recently proposed by Russegger et al. [97], and the results are presented in Figure 12. The authors synthesized different organic zirconium(IV)-pyridinedipyrrolide complexes as dyes and immobilized them in gas-blocking polymers. In this way, they obtained negatively charged PVA-MMA-based nanoparticles for temperature imaging in microfluidic devices, and positively charged PVA-TMA-based nanoparticles for thermometry in live cells. The size of PVA-MAA particles was ~34 nm with a uniform size distribution, while for PVA-TMA particles the size distribution was trimodal (~9 nm, ~42 nm and ~344 nm). The temperature-dependent property of interest was a luminescence decay time of different Zr-complexes in the temperature range 5–60 °C, while the emission intensity remained unchanged (excitation at 530 nm) (Figure 12a,b, respectively). Mono-exponential decay in the order of tens and hundreds of microseconds exhibited temperature sensitivities between −2.5 and −2.9% K−1 in polystyrene at 25 °C [97].
Recent results of the typical nanothermometry explorations of polymer nanoparticles are summarized in Table 5.
6. Carbon Dots
Carbon dots (CDs) are zero-dimensional carbon-based materials that have a size range of a few tens of nanometers [107]. They can be chemically modified and/or doped to improve or add useful qualities. CDs have extraordinary features, including tunable optoelectronic capabilities, bright photoluminescence with high quantum yields, non-toxicity, and superior biocompatibility, as well as modifiable functional groups that come along with simple and cost-effective manufacturing procedures [108,109,110,111]. Most of the CDs consist of a sp2/sp3 carbon skeleton with possible functional groups or polymer chains. Their core can have a graphite/diamond lattice or carbon in amorphous form, depending on the different degrees of carbonization [111]. The origin of luminescence in carbon dots is still a subject of ongoing investigation and debate. CDs manufactured using various techniques, precursors, and post-treatments have distinctive optical properties, indicating that CDs present a sophisticated system. There are several proposed mechanisms for the luminescence of carbon dots, and it is likely that multiple factors influence it [109]:
- Surface States and Functional Groups: Carbon dots have a high density of surface states—the electronic states are localized near their surface. These surface states can arise from the presence of oxygen and functional groups such as carboxyl, hydroxyl, or amino groups on the surface of the carbon dots, schematically shown in Figure 13a. The interaction between these surface states and the excited electrons can lead to radiative recombination, resulting in the emission of light [112], Figure 13b,c.
- Quantum Confinement Effect: The small size of carbon dots leads to quantum confinement effects, which can influence the electronic structure of the carbon material, causing the formation of discrete energy levels [113].
The mechanism of carbon dots’ temperature-dependent luminescence is still not clearly explained. Typically, with an increase in temperature, the exitonic emissions from CDs are redshifted and nonradiative decay rates increase [116]. Yang et al. [117] ascribe thermal linear fluorescence quenching to the synergistic effects of plentiful oxygen-containing functional groups and hydrogen bonds. On the contrary, other authors attribute linear fluorescence temperature decay to the temperature-induced “energy traps” on the CDs’ surface, the non-radiative channels of trap/defect states that become activated at higher temperatures, thus provoking energy transmission and thermal quenching [118,119,120]. Yu et al. [118] were the first authors to investigate the temperature-dependent fluorescence in carbon nanodots by measuring their temperature-dependent photoluminescence lifetimes within the 77–300 K range and comparing them to semiconductors and metal-based nanoparticles.
Kalytchuk et al. [121] obtained highly luminescent water-soluble nitrogen and sulfur-codoped CDs and examined their photoluminescent properties in a wide range of temperatures (10–70 °C). In contrast to many semiconducting nanocrystals, the absorption and emission spectra of N,S-codoped CDs did not show any band shifts at different temperatures. On the other hand, they exhibited temperature-dependent emission decays and can serve as highly sensitive intracellular nanothermometers, stable over a wide range of pH values, CD concentrations, and environmental ionic strengths, with a maximum sensitivity of 1.79%K−1 and a statistical accuracy of 0.27 °C. The results enabled the authors to achieve in vitro photoluminescence lifetime-based temperature sensing in human cervical cancer (HeLa) cells (shown in Figure 14). Moreover, the absolute PL quantum yield of these CDs is as high as 78 ± 2% under a 355nm excitation.
Mohammed et al. [122] showed that their N,B-CDs’ photoluminescent emission spectra are very sensitive to temperature changes within the 0–90 °C range, as presented in Figure 15. These CDs emitted blue fluorescence that peaked at 450 nm and exhibited up to 70% quantum yield, which can be used for highly sensitive temperature measurements with a thermo-sensitivity of 1.8%°K−1, excellent recovery, and pH stability. Apart from being excellent nanothermometers, these CDs can be used as Fe3+/Fe2+ sensors in biological samples.
In the context of detecting temperature fluctuations in the surrounding environment, the utilization of ratiometric optical nanothermometry is advantageous due to its reliance on the ratio between two luminescent signals. This approach offers benefits such as self-calibration of the system and enhanced reliability in thermal measurements [115,116].
Recent results of the typical nanothermometry explorations of carbon dots are summarized in Table 6.
7. Nanodiamonds
The research regarding nanodiamonds (i.e., diamond nanoparticles) was initiated in the Soviet Union during the 1960s [131]. Nanodiamonds combine many superior properties of bulk diamond. Some of the most important characteristics are summarized in [132], such as chemical inertness, wide-band gap electronic properties, excellent thermal conductivity, and outstanding mechanical behavior to those conferred by their high specific surface area [131]. In addition, they are non-toxic and have rich surface chemistry, making them ideal candidates for biomedical in vivo and in vitro applications [133,134,135]. The luminescent properties of nanodiamonds arise from the defects within their crystal lattice that introduce energy levels within the bandgap of the diamond structure, causing absorption and, subsequently, the emission of light. The negatively charged nitrogen-vacancy color center (NV−, or just NV) is one of the 500 distinct color centers discovered in diamond, and one of the most promising so far [136]. Silicon-, germanium-, tin-, and lead-vacancy color centers (SiV, GeV, SnV, and PbV, respectively) are also of interest [137]. The thermometry methods in nanodiamonds are categorized into spin-based thermometry and all-optical thermometry, based on their temperature-dependent features. The NV centers are employed in both spin-based and all-optical thermometry, whereas the other color centers are predominantly used in all-optical thermometry [136,137].
The NV color center comprises a C-atom vacancy and a N-atom impurity plus an additional electron, trapped at the defect center, and has C3v point group symmetry [131,138,139]. The photoluminescence spectra of the NV center lie in the visible range (Figure 16). They can be excited by easily accessible optical lasers (532 nm), whereas the emission spectra of the NV center consist of a Zero-Phonon Line (ZPL) at 638 nm accompanied by broad phonon side-bands (PSB) that originate from thermally excited vibrational states [140]. The peculiarity of the NV center photoluminescence is its dependence on the temperature and magnetic field when subjected to resonant microwave excitation. These features are the foundation of two different thermometry methods in nanodiamond—zero-phonon line (ZPL) thermal shift (i.e., all-optical thermometry) and optically detected magnetic resonance (ODMR) thermal shift (i.e., spin-based thermometry) [131,136,137,140].
The simplified electronic structure of the NV center is presented in Figure 17a. The centers have triplet ground states (3A2) with electron spin sublevels of and , where the spin–spin interaction is responsible for a zero-field splitting of . At room temperature the spin–orbit coupling results in the 3E excited state fine structure with three detectable levels of and , separated by a zero-field splitting of . The intersystem crossings can take place from the 3E excited state to/from the intermediate 1E and 1A singlet states, causing weak near-infrared (NIR) emissions [131,138,141]. The associated photoluminescence spectra and schematic presentation of the all-optical thermometry method are schematically summarized in Figure 17b. A strong optical transition that occurs between the 3A2 ground state and the 3E excited state (green arrow) initiates the ZPL at 638 nm (red arrow) at room temperature. The position, amplitude, and width of ZPL changes with temperature according to a Lorentzian function with an exponential background. Furthermore, the ratiometric all-optical thermometry method relies upon the ratio of the counts underneath the ZPL and the total emission spectra, known as the Optical Debye–Waller factor. By applying the microwave resonance to the transition between of and in the ground state, the photoluminescence substantially decreases through a process called the optically detected magnetic resonance (ODMR). This method, presented in Figure 17c, analyses the temperature dependence of , a phenomenon arising from the thermal lattice expansion and temperature dependence of the electron–phonon interaction [131].
The usage of the temperature-dependent fluorescent properties of the NV centres in nanodiamonds for thermometry in the range of 300–700 K was first proposed by Plakhotnik et al. [142]. The authors introduced ratiometric all-optical thermometry method based on the Debye–Waller factor of the NV fluorescence spectrum and obtained the variability in the fluorescence intensity and lifetime of approximately −0.2%/K and −0.06 ns/K, respectively.
Choi et al. [143] published important results (displayed in Figure 18) about using the nanothermometry method of NV centers in nanodiamonds of ~50 nm size for in vivo temperature measurements as well as for the regulation of cell division timings in C. elegans embryos. NV nanothermometers were injected inside C. elegans embryos, allowing the in vivo monitoring of the temperature and the correlation of cell-division dynamics with the local temperature distribution inside an embryo. An infrared laser was utilized to achieve heating within the temperature range of ΔT~20 K, commencing from an initial temperature of 12.3 °C. NV temperature sensors were characterized using the ODMR method and had maximal temperature sensitivities of ~2 K/Hz−1/2.
Unlike NV centers, which exhibit an almost 100 nm broad emission band, group IV-based defects in nanodiamonds concentrate almost all their photoluminescence into a few nanometers-wide zero phonon lines (ZPLs), and their temperature-dependent changes have been used for all-optical thermometry [131,144,145,146,147,148]. Miller et al. [147] studied aggregates of nanodiamonds with germanium-vacancy (GeV) defects distributed on different substrates within a wide temperature range of 85–400 K, with the aim of obtaining 2D optical thermometer with high nanoscale spatial resolution, predominantly for biomedical applications. They observed the thermal shift of the GeV center’s ZPL at 602 nm and fitted it with different models. The results shown in Figure 19 proved that nanodiamond aggregates with GeV center are optical temperature sensors with a sensitivity of 0.2 cm−1K−1 at room temperature [147].
Recent results of the typical nanothermometry explorations of nanodiamonds with different optically active defects are summarized in Table 7. It is important to note that the sensitivity of thermometry using nanodiamonds is commonly expressed as the uncertainty for a given measurement time. For other types of nanoparticles, sensitivity is defined as the rate of change in a measurement over its uncertainty. Therefore, it is difficult to compare the reported sensitivity values for other types of nanoparticles with those of nanodiamonds.
8. Conclusions
Luminescent nanoparticles are widely used as probes in luminescence thermometry. They can be utilized in all temperature read-out methodologies, with both steady-state and time-resolved emission detection and with both downshifting and up-conversion excitations. They can be used in almost all luminescence thermometry applications. The only ones that they cannot be used in are measurements at very high temperatures, because at those temperatures, nanoparticles emit less light and are not as stable as their bulk counterparts. For some applications, they are indispensable. These are primarily biomedical and nanotechnology applications that require high spatial measurement resolutions and/or particle surface modifications. In addition, achieving multifunctional luminescence materials is much easier with nanoparticles. The polyvalent functions of nanoparticles related to thermometry so far are mostly bioimaging, nanoheating, and counterfeiting, but some other functions would not be difficult to envisage. Further, by combining several nanoparticles with different spectral and temperature responses, one can construct a luminescence thermometer to suit any specific demand. To achieve similar goals, it is also possible to use core/(multiple) shell nanoparticles. Considering the number of papers published on luminescence thermometry, lanthanide-activated nanophosphors are the most commonly used probes, with semiconductor quantum dots following them. This is probably due to the large and important field of applications of up-conversion materials in which lanthanide-activated nanoparticles play a crucial role. Regarding semiconductor quantum dots, luminescence thermometry performance differs between nanoparticles of different sizes and morphologies.
Author Contributions
Conceptualization, L.Đ.F. and M.D.D.; writing—original draft preparation, L.Đ.F. and M.D.D.; writing—review and editing, L.Đ.F. and M.D.D. All authors have read and agreed to the published version of the manuscript.
Funding
This research was funded by the the Ministry of Science, Technological Development, and Innovation of the Republic of Serbia under contract 451-03-47/2023-01/200017.
Data Availability Statement
The manuscript does not contain any original data.
Conflicts of Interest
The authors declare no conflict of interest.
References
- Brik, M.G.; Srivastava, A.M. Luminescent Materials: Fundamentals and Applications; De Gruyter: Berlin, Germany; Boston, MA, USA, 2023. [Google Scholar]
- Carlos, L.D.; Palacio, F. Thermometry at the Nanoscale: Techniques and Selected Applications; Royal Society of Chemistry: Cambridge, CA, USA, 2016. [Google Scholar]
- Macherel, D.; Haraux, F.; Guillou, H.; Bourgeois, O. The conundrum of hot mitochondria. Biochim. Biophys. Acta Bioenerg. 2021, 1862, 148348. [Google Scholar] [CrossRef]
- Dramićanin, M. Luminescence thermometry. Methods, Materials and Applications; Elsevier: Amsterdam, The Netherlands, 2018. [Google Scholar]
- Martí, J.J.C.; Baiges, M.C.P. Luminescent Thermometry: Applications and Uses; Springer: Cham, Switzerland, 2023. [Google Scholar]
- Brites, C.D.S.; Balabhadra, S.; Carlos, L.D. Lanthanide-Based Thermometers: At the Cutting-Edge of Luminescence Thermometry. Adv. Optical Mater. 2019, 7, 1801239. [Google Scholar] [CrossRef]
- Dramićanin, M.D. Trends in luminescence thermometry. J. Appl. Phys. 2020, 128, 040902. [Google Scholar] [CrossRef]
- Bednarkiewicz, A.; Marciniak, L.; Carlos, L.D.; Jaque, D. Standardizing luminescence nanothermometry for biomedical applications. Nanoscale 2020, 12, 14405–14421. [Google Scholar] [CrossRef] [PubMed]
- Brites, C.D.S.; Marin, R.; Suta, M.; Neto, A.N.C.; Ximendes, E.; Jaque, D.; Carlos, L.D. Spotlight on Luminescence Thermometry: Basics, Challenges, and Cutting-Edge Applications. Adv. Mater. 2023, 35, 2302749. [Google Scholar] [CrossRef] [PubMed]
- Marciniak, L.; Kniec, K.; Elzbieciak-Piecka, K.; Trejgis, K.; Stefanska, J.; Dramićanin, M. Luminescence thermometry with transition metal ions. A review. Coord. Chem. Rev. 2022, 469, 214671. [Google Scholar] [CrossRef]
- Kako, T. Luminescence centers of rare-earth ions. In Fundamentals of Phosphors; Yen, W.M., Shionoya, S., Yamamoto, H., Eds.; CRC Press: Boca Raton, FL, USA, 2007; Chapter 2, Section 3; pp. 181–204. [Google Scholar]
- Yu, D.; Li, H.; Zhang, D.; Zhang, Q.; Meijerink, A.; Suta, M. One ion to catch them all: Targeted high-precision Boltzmann thermometry over a wide temperature range with Gd3+. Light Sci. Appl. 2021, 10, 236. [Google Scholar] [CrossRef] [PubMed]
- Nexha, A.; Carvajal, J.J.; Pujol, M.C.; Díaz, F.; Aguiló, M. Lanthanide doped luminescence nanothermometers in the biological windows: Strategies and applications. Nanoscale 2021, 13, 7913. [Google Scholar] [CrossRef]
- Quintanilla, M.; Liz-Marzán, L.M. Guiding Rules for Selecting a Nanothermometer. Nano Today 2018, 19, 126–145. [Google Scholar] [CrossRef]
- Shang, Y.; Han, Q.; Hao, S.; Chen, T.; Zhu, Y.; Wang, Z.; Yang, C. Dual-mode upconversion nanoprobe enables broad-range thermometry from cryogenic to room temperature. ACS Appl. Mater. Interfaces 2019, 11, 42455–42461. [Google Scholar] [CrossRef] [PubMed]
- Tuxun, H.; Cai, Z.; Ji, M.; Zhang, B.; Zhang, C.; Li, J.; Yu, X.; Fu, Z.; Zhang, Z.; Zheng, H. Controlling and probing heat generation in an optical heater system. Nanophotonics 2022, 11, 979–986. [Google Scholar] [CrossRef]
- Zhang, B.; Guo, X.; Zhang, Z.; Fu, Z.; Zheng, H. Luminescence thermometry with rare earth doped nanoparticles: Status and challenges. J. Lumin. 2022, 250, 119110. [Google Scholar] [CrossRef]
- Bradac, C.; Lim, S.F.; Chang, H.-C.; Aharonovich, I. Optical Nanoscale Thermometry: From Fundamental Mechanisms to Emerging Practical Applications. Adv. Opt. Mater. 2020, 8, 2000183. [Google Scholar] [CrossRef]
- Kusama, H.; Sovers, O.J.; Yoshioka, T. Line Shift Method for Phosphor Temperature Measurements. Jpn. J. Appl. Phys. 1976, 15, 2349–2358. [Google Scholar] [CrossRef]
- Dramićanin, M.D. Sensing temperature via downshifting emissions of lanthanide-doped metal oxides and salts. A review. Methods Appl. Fluoresc. 2016, 4, 042001. [Google Scholar] [CrossRef] [PubMed]
- Trejgis, K.; Bednarkiewicz, A.; Marciniak, L. Engineering excited state absorption based nanothermometry for temperature sensing and imaging. Nanoscale 2020, 12, 4667–4675. [Google Scholar] [CrossRef]
- Nikolic, M.G.; Rabasovic, M.S.; Krizan, J.; Savic-Sevic, S.; Rabasovic, M.D.; Marinkovic, B.P.; Vlasic, A.; Sevic, D. Luminescence thermometry using Gd2Zr2O7:Eu3+. Opt. Quantum Electron. 2018, 50, 258. [Google Scholar] [CrossRef]
- Garvas, M.; Acosta, S.; Urbančič, I.; Koklič, T.; Štrancar, J.; Nunes, L.A.O.; Guttmann, P.; Umek, P.; Bittencourt, C. Single cell temperature probed by Eu3+ doped TiO2 nanoparticles luminescence. Nano Select 2021, 2, 1208–1217. [Google Scholar] [CrossRef]
- Kolesnikov, I.E.; Mamonova, D.V.; Kurochkin, M.A.; Medvedev, V.A.; Kolesnikov, E.Y. Effect of doping concentration on dual-mode LaVO4:Eu3+ luminescence thermometers. Ceram. Int. 2023, 49, 20699–20705. [Google Scholar] [CrossRef]
- Trejgis, K.; Ledwa, K.; Bednarkiewicz, A.; Marciniak, L. Impact of host composition and dopant ion concentration on the thermometric properties of a Eu3+ activated fluoride-based single-band ratiometric luminescent thermometer. J. Alloys Compd. 2022, 898, 162839. [Google Scholar] [CrossRef]
- Kolesnikov, I.E.; Kurochkina, M.A.; Golyevac, E.V.; Mamonovaa, D.V.; Kalinicheva, A.A.; Kolesnikov, E.Y.; Lähderanta, E. Multimode high-sensitive optical YVO4:Ln3+ nanothermometers (Ln3+ = Eu3+, Dy3+, Sm3+) using charge transfer band features. Phys. Chem. Chem. Phys. 2020, 22, 28183–28190. [Google Scholar] [CrossRef]
- Ćulubrk, S.; Lojpur, V.; Ahrenkiel, S.P.; Nedeljković, J.M.; Dramićanin, M.D. Non-contact thermometry with Dy3+ doped Gd2Ti2O7 nano-powders. J. Lumin. 2016, 170, 395–400. [Google Scholar] [CrossRef]
- Periša, J.; Ćirić, A.; Zeković, I.; Ðordević, V.; Sekulić, M.; Antić, Ž.; Dramićanin, M.D. Exploiting High-Energy Emissions of YAlO3:Dy3+ for Sensitivity Improvement of Ratiometric Luminescence Thermometry. Sensors 2022, 22, 7997. [Google Scholar] [CrossRef] [PubMed]
- Jahanbazi, F.; Wang, Y.; Dorman, J.A.; Mao, Y. La2Zr2O7:Pr3+ nanoparticles for luminescence thermometry based on a single parameter over a wide temperature range of 620 K. J. Alloys Compd. 2022, 911, 165013. [Google Scholar] [CrossRef]
- Hernández-Rodrígueza, M.A.; Lozano-Gorrína, A.D.; Martína, I.R.; Rodríguez-Mendoza, U.R.; Lavína, V. Comparison of the sensitivity as optical temperature sensor of nano-perovskite doped with Nd3+ ions in the first and second biological windows. Sens. Actuators B Chem. 2018, 255, 970–976. [Google Scholar] [CrossRef]
- Kolesnikov, I.E.; Kalinichev, A.A.; Kurochkin, M.A.; Golyeva, E.V.; Kolesnikov, E.Y.; Kurochkin, A.V.; Lahderanta, E.; Mikhailov, M.D. YVO4:Nd3+ nanophosphors as NIR-to-NIR thermal sensors in wide temperature range. Sci. Rep. 2017, 7, 18002. [Google Scholar] [CrossRef]
- Wu, Q.; Li, S.; Li, C.; Xu, Q.; Sun, J.; Kang, Z.; Song, C. Down-conversion PL characteristics of CaSrSiO4: Tb3+ nanophosphor and its application on optical low-temperature sensor. Appl. Phys. B 2018, 124, 199. [Google Scholar] [CrossRef]
- Periša, J.; Ristić, Z.; Piotrowski, W.; Antić, Ž.; Marciniak, M.; Dramićanin, M.D. All near-infrared multiparametric luminescence thermometry using Er3+, Yb3+-doped YAG nanoparticles. RSC Adv. 2021, 11, 15933–15942. [Google Scholar] [CrossRef]
- Sun, C.; Gradzielski, M. Advances in fluorescence sensing enabled by lanthanide-doped upconversion nanophosphors. Adv. Colloid Interface Sci. 2022, 300, 102579. [Google Scholar] [CrossRef]
- Chen, H.; Ding, B.; Ma, P.; Lin, J. Recent progress in upconversion nanomaterials for emerging optical biological applications. Adv. Drug Deliv. Rev. 2022, 188, 114414. [Google Scholar] [CrossRef] [PubMed]
- Kumar, B.; Malhotra, K.; Fuku, R.; Van Houten, J.; Qu, G.Y.; Piunno, P.A.E.; Krull, U.J. Recent trends in the developments of analytical probes based on lanthanide-doped upconversion nanoparticles. Trends Anal. Chem. 2021, 139, 116256. [Google Scholar] [CrossRef]
- Auzel, F. Upconversion and anti-stokes processes with f and d ions in solids. Chem. Rev. 2004, 104, 139–174. [Google Scholar] [CrossRef] [PubMed]
- Wang, R.; Zhang, F. Lanthanide-based near infrared nanomaterials for bioimaging. In Near-Infrared Nanomaterials: Preparation, Bioimaging and Therapy Applications; Zhang, F., Ed.; RSC: London, UK, 2016; Chapter 1; pp. 1–39. [Google Scholar]
- Vetrone, F.; Naccache, R.; Zamarron, A.; de la Fuente, A.J.; Sanz-Rodríguez, F.; Maestro, L.M.; Rodriguez, E.M.; Jaque, D.; Sole, J.G.; Capobianco, J.A. Temperature Sensing Using Fluorescent Nanothermometers. ACS Nano 2010, 4, 3254–3258. [Google Scholar] [CrossRef]
- Labrador-Páez, L.; Pedroni, M.; Speghini, A.; García-Solé, J.; Haro-González, P.; Jaque, D. Reliability of rare-earth-doped infrared luminescent nanothermometers. Nanoscale 2018, 10, 22319–22328. [Google Scholar] [CrossRef]
- Runowski, M.; Woźny, P.; Stopikowska, N.; Martín, I.R.; Lavín, V.; Lis, S. Luminescent Nanothermometer Operating at Very High Temperature-Sensing up to 1000 K with Upconverting Nanoparticles (Yb3+/Tm3+). ACS Appl. Mater. Interfaces 2020, 12, 43933–43941. [Google Scholar] [CrossRef] [PubMed]
- Pereira, A.F.; Silva, J.F.; Gouveia-Neto, A.S.; Jacinto, C. 1.319 µm excited thulium doped nanoparticles for subtissue thermal sensing with deep penetration and high contrast imaging. Sens. Actuators B Chem. 2017, 238, 525–531. [Google Scholar] [CrossRef]
- Runowski, M.; Shyichuk, A.; Tymiński, A.; Grzyb, T.; Lavín, V.; Lis, S. Multifunctional Optical Sensors for Nanomanometry and Nanothermometry: High-Pressure and High-Temperature Upconversion Luminescence of Lanthanide-Doped Phosphates—LaPO4/YPO4:Yb3+−Tm3+. ACS Appl. Mater. Interfaces 2018, 10, 17269–17279. [Google Scholar] [CrossRef] [PubMed]
- Xu, F.; Ba, Z.; Zheng, Y.; Wang, Y.; Hu, M.; Xu, X.; Wang, J.; Zhang, Z. Rare-earth-doped optical nanothermometer in visible and near-infrared regions. J. Mater. Sci. 2018, 53, 15107–15117. [Google Scholar] [CrossRef]
- Xu, W.; Zhao, D.; Zhu, X.; Zheng, L.; Zhang, Z.; Cao, W. NIR to NIR luminescence thermometry in core/multishells-structured nanoparticles operating in the biological window. J. Lumin. 2020, 225, 117358. [Google Scholar] [CrossRef]
- Savchuk, O.A.; Carvajal, J.J.; Brites, C.D.S.; Carlos, L.D.; Aguilo, M.; Diaz, F. Upconversion thermometry: A new tool to measure the thermal resistance of nanoparticles. Nanoscale 2018, 10, 6602–6610. [Google Scholar] [CrossRef]
- Perrella, R.V.; de Sousa Filho, P.C. High-sensitivity dual UV/NIR-excited luminescence thermometry by rare earth vanadate nanoparticles. Dalton Trans. 2020, 49, 911–922. [Google Scholar] [CrossRef] [PubMed]
- Shang, F.; Hu, C.; Xu, W.; Zhu, X.; Zhao, D.; Zhang, W.; Zhang, Z.; Cao, W. Near-infrared emitting Nd3+-Yb3+ codoped Y2O3 nanocrystals for highly sensitive optical thermometry. J. Alloys Compd. 2021, 858, 157637. [Google Scholar] [CrossRef]
- Tamatani, M. Luminescence centers of transition metal ions. In Fundamentals of Phosphors; Yen, W.M., Shionoya, S., Yamamoto, H., Eds.; CRC Press: Boca Raton, FL, USA, 2007; Chapter 2, Section 2; pp. 157–180. [Google Scholar]
- Avram, N.M.; Brik, M.G. Optical Properties of 3d-Ions in Crystals: Spectroscopy and Crystal Field Analysis; Springer: Berlin/Heidelberg, Germany; New York, NY, USA; Dordrecht, The Netherlands; London, UK, 2013. [Google Scholar]
- Van Vleck, J.H. The John-Teller effect and crystalline stark splitting for clusters of the form XY6. J. Chem. Phys. 1939, 7, 72–84. [Google Scholar] [CrossRef]
- Tanabe, Y.; Sugano, S. On the Absorption Spectra of Complex Ions I. J. Phys. Soc. Jpn. 1954, 9, 753–766. [Google Scholar] [CrossRef]
- Fernicola, V.C.; Zhang, Z.Y.; Grattan, K.T.V. Fiber optic thermometry based on Cr-fluorescence in olivine crystals. Rev. Sci. Instrum. 1997, 68, 2418–2421. [Google Scholar] [CrossRef]
- Sun, T.; Zhang, Z.Y.; Grattan, K.T.V.; Palmer, A.W.; Collins, S.F. Analysis of the double exponential behavior in alexandrite for optical temperature sensing applications. Rev. Sci. Instrum. 1997, 68, 3442–3446. [Google Scholar] [CrossRef]
- Piotrowski, W.; Kuchowicz, M.; Dramićanin, M.; Marciniak, L. Lanthanide dopant stabilized Ti3+ state and supersensitive Ti3+ -based multiparametric luminescent thermometer in SrTiO3:Ln3+ (Ln3+ = Lu3+, La3+, Tb3+) nanocrystals. Chem. Eng. J. 2022, 428, 131165. [Google Scholar] [CrossRef]
- Li, F.; Cai, J.; Chi, F.F.; Chen, Y.; Duan, C.; Yin, M. Investigation of luminescence from LuAG: Mn4+ for physiological temperature sensing. Opt. Mater. 2017, 66, 447–452. [Google Scholar] [CrossRef]
- Trejgis, K.; Dramićanin, M.D.; Marciniak, L. Highly sensitive multiparametric luminescent thermometer for biologically-relevant temperatures based on Mn4+, Ln3+ co-doped SrTiO3 nanocrystals. J. Alloys Compd. 2021, 875, 159973. [Google Scholar] [CrossRef]
- Chen, D.; Chen, X.; Li, X.; Guo, H.; Liu, S.; Li, X. Cr3+-doped Bi2Ga4O9-Bi2Al4O9 solid-solution phosphors: Crystal-field modulation and lifetime based temperature sensing. Opt. Lett. 2017, 42, 4950–4953. [Google Scholar] [CrossRef]
- Kniec, K.; Marciniak, L. The influence of grain size and vanadium concentration on the spectroscopic properties of YAG:V3+, V5+ and YAG: V, Ln3+ (Ln3+ = Eu3+, Dy3+, Nd3+) nanocrystalline luminescent thermometers. Sens. Actuators B Chem. 2018, 264, 382–390. [Google Scholar] [CrossRef]
- Elzbieciak, K.; Bednarkiewicz, A.; Marciniak, L. Temperature sensitivity modulation through crystal field engineering in Ga3+ co-doped Gd3Al5−xGaxO12:Cr3+, Nd3+ nanothermometers. Sens. Actuators B Chem. 2018, 269, 96–102. [Google Scholar] [CrossRef]
- Elzbieciak-Piecka, K.; Matuszewska, C.; Marciniak, L. Step by step designing of sensitive luminescent nanothermometers based on Cr3+, Nd3+ co-doped La3−xLuxAl5−yGayO12 nanocrystals. New J. Chem. 2019, 43, 12614–12622. [Google Scholar] [CrossRef]
- Elzbieciak, K.; Marciniak, L. The Impact of Cr3+ Doping on Temperature Sensitivity Modulation in Cr3+ Doped and Cr3+, Nd3+ Co-doped Y3Al5O12, Y3Al2Ga3O12, and Y3Ga5O12 Nanothermometers. Front. Chem. 2018, 6, 424. [Google Scholar] [CrossRef]
- Avram, D.; Porosnicu, I.; Patrascu, A.; Tiseanu, C. Real-Time Thermal Imaging based on the Simultaneous Rise and Decay Luminescence Lifetime Thermometry. Adv. Photonics Res. 2022, 3, 2100208. [Google Scholar] [CrossRef]
- Piotrowski, W.M.; Marin, R.; Szymczak, M.; Rodríguez, E.M.; Ortgies, D.H.; Rodríguez-Sevilla, P.; Dramićanin, M.D.; Jaque, D.; Marciniak, L. Mn5+ Lifetime-Based Thermal Imaging in the Optical Transparency Windows Through Skin-Mimicking Tissue Phantom. Adv. Opt. Mater. 2023, 11, 2202366. [Google Scholar] [CrossRef]
- Drabik, J.; Cichy, B.; Marciniak, L. New Type of Nanocrystalline Luminescent Thermometers Based on Ti3+/Ti4+ and Ti4+/Ln3+ (Ln3+ = Nd3+, Eu3+, Dy3+) Luminescence Intensity Ratio. J. Phys. Chem. C 2018, 122, 26, 14928–14936. [Google Scholar] [CrossRef]
- Drabik, J.; Marciniak, L. The influence of Eu3+ concentration on the spectroscopic properties of YAG:Ti, Eu3+ nanocrystalline luminescent thermometer. J. Lumin. 2019, 208, 213–217. [Google Scholar] [CrossRef]
- Jiang, R.; Yang, J.; Meng, Y.; Yan, D.; Liu, C.; Xu, C.; Liu, Y. The effects of the amount of Ge4+ doped in Zn2Ga3.98−4x/3GexO8:Cr0.02 nanoparticles on size distribution, NIR afterglow imaging and temperature sensing. J. Alloys Compd. 2020, 822, 153626. [Google Scholar] [CrossRef]
- Elzbieciak-Piecka, K.; Suta, M.; Marciniak, L. Structurally induced tuning of the relative sensitivity of LaScO3:Cr3+ luminescent thermometers by co-doping lanthanide ions. Chem. Eng. J. 2021, 421, 129757. [Google Scholar] [CrossRef]
- Ristić, Z.; Đorđević, V.; Medić, M.; Kuzman, S.; Sekulić, M.; Antić, Ž.; Dramićanin, M.D. Triple-temperature readout in luminescence thermometry with Cr3+-doped Mg2SiO4 operating from cryogenic to physiologically relevant temperatures. Meas. Sci. Technol. 2021, 32, 054004. [Google Scholar] [CrossRef]
- Kniec, K.; Ledwa, K.; Marciniak, L. Enhancing the Relative Sensitivity of V5+, V4+ and V3+ Based Luminescent Thermometer by the Optimization of the Stoichiometry of Y3Al5−xGaxO12 Nanocrystals. Nanomaterials 2019, 9, 1375. [Google Scholar] [CrossRef]
- Marciniak, L.; Trejgis, K. Luminescence lifetime thermometry with Mn3+-Mn4+ co-doped nanocrystals. J. Mater. Chem. C 2018, 6, 7092–7100. [Google Scholar] [CrossRef]
- Piotrowski, W.; Trejgis, K.; Maciejewska, K.; Ledwa, K.; Fond, B.; Marciniak, L. Thermochromic Luminescent Nanomaterials Based on Mn4+/Tb3+ Codoping for Temperature Imaging with Digital Cameras. ACS Appl. Mater. Interfaces 2020, 12, 44039–44048. [Google Scholar] [CrossRef]
- Piotrowski, W.M.; Marin, R.; Szymczak, M.; Martín Rodríguez, E.; Ortgies, D.H.; Rodríguez-Sevilla, P.; Bolek, P.; Dramićanin, M.D.; Jaque, D.; Marciniak, L. Critical evaluation of the thermometric performance of ratiometric luminescence thermometers based on Ba3(VO4)2:Mn5+,Nd3+ for deep-tissue thermal imaging. J. Mater. Chem. C 2023, 11, 6713–6723. [Google Scholar] [CrossRef]
- Matuszewska, C.; Elzbieciak-Piecka, K.; Marciniak, L. Transition Metal Ion-Based Nanocrystalline Luminescent Thermometry in SrTiO3:Ni2+,Er3+ Nanocrystals Operating in the Second Optical Window of Biological Tissues. J. Phys. Chem. C 2019, 123, 30, 18646–18653. [Google Scholar] [CrossRef]
- Weng, J.; Ren, J. Luminescent Quantum Dots: A Very Attractive and Promising Tool in Biomedicine. Curr. Med. Chem. 2006, 13, 897–909. [Google Scholar] [CrossRef]
- Cotta, M.A. Quantum Dots and Their Applications: What Lies Ahead? ACS Appl. Nano Mater. 2020, 3, 4920–4924. [Google Scholar] [CrossRef]
- Costa-Fernández, J.M.; Pereiro, R.; Sanz-Medel, A. The use of luminescent quantum dots for optical sensing. Trends Anal. Chem. 2006, 25, 207–218. [Google Scholar] [CrossRef]
- Del Rosal, B.; Ximendes, E.; Rocha, U.; Jaque, D. In Vivo Luminescence Nanothermometry: From Materials to Applications. Adv. Opt. Mater. 2016, 5, 1–14. [Google Scholar] [CrossRef]
- Zhao, P.; Xu, Q.; Tao, J.; Jin, Z.; Pan, Y.; Yu, C.; Yu, Z. Near infrared quantum dots in biomedical applications: Current status and future perspective. Wiley Interdiscip. Rev. Nanomed. Nanobiotechnol. 2018, 10, e1483. [Google Scholar] [CrossRef] [PubMed]
- Alivisatos, A.P. Semiconductor Clusters, Nanocrystals and Quantum Dots. Science 1996, 271, 933–937. [Google Scholar] [CrossRef]
- Bednarkiewicz, A.; Drabik, J.; Trejgis, K.; Jaque, D.; Ximendes, E.; Marciniak, L. Luminescence based temperature bio-imaging: Status, challenges, and perspectives. Appl. Phys. Rev. 2021, 8, 011317. [Google Scholar] [CrossRef]
- Wang, S.; Westcott, S.; Chen, W. Nanoparticle Luminescence Thermometry. J. Phys. Chem. B 2002, 106, 11203–11209. [Google Scholar] [CrossRef]
- Brites, C.D.S.; Lima, P.P.; Silva, N.J.O.; Millán, A.; Amaral, V.S.; Palacio, F.; Carlos, L.D. Thermometry at the nanoscale. Nanoscale 2012, 4, 4799–4829. [Google Scholar] [CrossRef]
- Joly, A.G.; Chen, W.; Roark, J.; Zhang, J.Z. Temperature Dependence of Up-Conversion Luminescence and Photoluminescence of Mn2+ in ZnS:Mn2+ Nanoparticles. J. Nanosci. Nanotechnol. 2001, 1, 295–301. [Google Scholar] [CrossRef]
- Maestro, L.M.; Rodríguez, E.M.; Rodríguez, F.S.; Iglesias-de la Cruz, M.C.; Juarranz, A.; Naccache, R.; Vetrone, F.; Jaque, D.; Capobianco, J.A.; Solé, J.G. CdSe Quantum Dots for Two-Photon Fluorescence Thermal Imaging. Nano Lett. 2010, 10, 5109–5115. [Google Scholar] [CrossRef]
- Savchenko, S.S.; Vokhmintsev, A.S.; Weinstein, I.A. Temperature-induced shift of the exciton absorption band in InP/ZnS quantum dots. Opt. Mater. Express 2017, 7, 354–359. [Google Scholar] [CrossRef]
- Marin, R.; Vivian, A.; Skripka, A.; Migliori, A.; Morandi, V.; Enrichi, F.; Vetrone, F.; Ceroni, P.; Aprile, C.; Canton, P. Mercaptosilane-Passivated CuInS2 Quantum Dots for Luminescence Thermometry and Luminescent Labels. ACS Appl. Nano Mater. 2019, 2, 2426–2436. [Google Scholar] [CrossRef]
- Albahrani, S.M.B.; Seoudi, T.; Philippon, D.; Lafarge, L.; Reiss, P.; Hajjaji, H.; Guillot, G.; Querry, M.; Bluet, J.-M.; Vergne, P. Quantum dots to probe temperature and pressure in highly confined liquids. RSC Adv. 2018, 8, 22897–22908. [Google Scholar] [CrossRef]
- Birchall, L.; Foerster, A.; Rance, G.A.; Terry, A.; Wildman, R.D.; Tuck, C.J. An inkjet-printable fluorescent thermal sensor based on CdSe/ZnS quantum dots immobilised in a silicone matrix. Sens. Actuator A Phys. 2022, 347, 113977. [Google Scholar] [CrossRef]
- Chang, Q.; Zhou, X.; Jiang, S.; Xiang, G.; Li, L.; Li, Y.; Jing, C.; Ling, F.; Wang, Y.; Xiao, P. Dual-mode luminescence temperature sensing performance of manganese (II) doped CsPbCl3 perovskite quantum dots. Ceram. Int. 2022, 48, 33645–33652. [Google Scholar] [CrossRef]
- Kalytchuk, S.; Adam, M.; Tomanec, O.; Zboril, R.; Gaponik, N.; Rogach, A.L. Sodium Chloride Protected CdHgTe Quantum Dot Based Solid-State Near-Infrared Luminophore for Light-Emitting Devices and Luminescence Thermometry. ACS Photonics 2017, 4, 1459–1465. [Google Scholar] [CrossRef]
- Del Rosal, B.; Carrasco, E.; Ren, F.; Benayas, A.; Vetrone, F.; Sanz-Rodríguez, F.; Ma, D.; Juarranz, Á.; Jaque, D. Infrared-Emitting QDs for Thermal Therapy with Real-Time Subcutaneous Temperature Feedback. Adv. Funct. Mater. 2016, 2, 6060–6068. [Google Scholar] [CrossRef]
- Silva, J.F.; de Oliveira, J.M.; Silva, W.F.; Soares, A.C.C.; Rocha, U.; Dantas, N.O.; da Silva Filho, E.A.; Duzzioni, M.; Cofré, A.H.R.; de Castro, O.W.; et al. Supersensitive nanothermometer based on CdSe/CdSxSe1−x magic-sized quantum dots with in vivo low toxicity. Chem. Eng. Sci. 2022, 264, 118153. [Google Scholar] [CrossRef]
- Adachi, C.; Tsutsui, T. Luminescence of organic compounds. In Fundamentals of Phosphors; Yen, W.M., Shionoya, S., Yamamoto, H., Eds.; CRC Press: Boca Raton, FL, USA, 2007; Chapter 1, Section 5; pp. 51–59. [Google Scholar]
- Qiao, J.; Mu, X.; Qi, L. Construction of fluorescent polymeric nano-thermometers for intracellular temperature imaging: A review. Biosens. Bioelectron. 2016, 85, 403–413. [Google Scholar] [CrossRef]
- Meng, L.; Jiang, S.; Song, M.; Yan, F.; Zhang, W.; Xu, B.; Tian, W. TICT-Based Near-Infrared Ratiometric Organic Fluorescent Thermometer for Intracellular Temperature Sensing. ACS Appl. Mater. Interfaces 2020, 12, 26842–26851. [Google Scholar] [CrossRef] [PubMed]
- Russegger, A.; Debruyne, A.C.; Berrio, D.C.; Fuchs, S.; Marzi, J.; Schenke-Layland, K.; Dmitriev, R.I.; Borisov, S.M. Bright and Photostable TADF-Emitting Zirconium(IV) Pyridinedipyrrolide Complexes: Efficient Dyes for Decay Time-Based Temperature Sensing and Imaging. Adv. Opt. Mater. 2023, 11, 2202720. [Google Scholar] [CrossRef]
- Palner, M.; Pu, K.; Shao, S.; Rao, J. Semiconducting Polymer Nanoparticles with Persistent Near-Infrared Luminescence for In Vivo Optical Imaging. Angew. Chem. Int. Ed. 2015, 54, 11477–11480. [Google Scholar] [CrossRef] [PubMed]
- Wu, Y.; Liu, J.; Ma, J.; Liu, Y.; Wang, Y.; Wu, D. Ratiometric nanothermometer based on Rhodamine dye-incorporated F127-melamine-formaldehyde polymer nanoparticle: Preparation, characterization, wide-range temperature sensing, and precise intracellular thermometry. ACS Appl. Mater. Interfaces 2016, 8, 14396–14405. [Google Scholar] [CrossRef]
- Bustamante, N.; Ielasi, G.; Bedoya, M.; Orellana, G. Optimization of Temperature Sensing with Polymer-Embedded Luminescent Ru(II) Complexes. Polymers 2018, 10, 234. [Google Scholar] [CrossRef]
- Piñol, R.; Zeler, J.; Brites, C.D.S.; Gu, Y.; Tellez, P.; Neto, A.N.C.; da Silva, T.E.; Moreno-Loshuertos, R.; Fernandez-Silva, P.; Gallego, A.I.; et al. Real-Time Intracellular Temperature Imaging Using LanthanideBearing Polymeric Micelles. Nano Lett. 2020, 20, 6466–6472. [Google Scholar] [CrossRef] [PubMed]
- Kolesnikov, I.E.; Kurochkin, M.A.; Meshkov, I.N.; Akasov, R.A.; Kalinichev, A.A.; Kolesnikov, E.Y.; Gorbunova, Y.G.; Lähderanta, E. Water-soluble multimode fluorescent thermometers based on porphyrins photosensitizers. Mater. Des. 2021, 203, 109613. [Google Scholar] [CrossRef]
- Saha, B.; Ruidas, B.; Mete, S.; Mukhopadhyay, C.D.; Bauri, K.; De, P. AIE-active non-conjugated poly(Nvinylcaprolactam) as a fluorescent thermometer for intracellular temperature imaging. Chem. Sci. 2020, 11, 141–147. [Google Scholar] [CrossRef]
- Savchuk, O.A.; Silvestre, O.F.; Adão, R.M.R.; Nieder, J.B. GFP fluorescence peak fraction analysis based nanothermometer for the assessment of exothermal mitochondria activity in live cells. Sci. Rep. 2019, 9, 7535. [Google Scholar] [CrossRef]
- Steinegger, A.; Klimant, I.; Borisov, S.M. Purely Organic Dyes with Thermally Activated Delayed Fluorescence—A Versatile Class of Indicators for Optical Temperature Sensing. Adv. Opt. Mater. 2017, 5, 1700372. [Google Scholar] [CrossRef]
- Su, X.; Wen, Y.; Yuan, W.; Xu, M.; Liu, Q.; Huang, C.; Li, F. Lifetime-based nanothermometry in vivo with ultra-long-lived luminescence. Chem. Commun. 2020, 56, 10694–10697. [Google Scholar] [CrossRef] [PubMed]
- Sagbas, S.; Sahiner, N. Carbon Dots: Preparation, Properties, and Application. In Nanocarbon and its Composites. Preparation, Properties and Applications; Khan, A., Jawaid, M., Inamuddin, Asiri, A.M., Eds.; Elsevier: Amsterdam, The Netherlands, 2018; Chapter 22; pp. 651–676. [Google Scholar]
- Mohammed, L.J.; Omer, K.M. Carbon Dots as New Generation Materials for Nanothermometer: Review. Nanoscale Res. Lett. 2020, 15, 182. [Google Scholar] [CrossRef] [PubMed]
- Liu, M.L.; Chen, B.B.; Li, C.M.; Huang, C.Z. Carbon dots: Synthesis, formation mechanism, fluorescence origin and sensing applications. Green Chem. 2019, 21, 449–471. [Google Scholar] [CrossRef]
- Mansuriya, B.D.; Altintas, Z. Carbon Dots: Classification, Properties, Synthesis, Characterization, and Applications in Health Care—An Updated Review (2018–2021). Nanomaterials 2021, 11, 2525. [Google Scholar] [CrossRef] [PubMed]
- Han, Y.; Liccardo, L.; Moretti, E.; Zhao, H.; Vomiero, A. Synthesis, optical properties and applications of red/near-infrared carbon dots. J. Mater. Chem. C 2022, 10, 11827. [Google Scholar] [CrossRef]
- Zhu, J.Y.; Shao, H.; Bai, X.; Zhai, Y.; Zhu, Y.S.; Chen, X.; Pan, G.C.; Dong, B.; Xu, L.; Zhang, H.Z.; et al. Modulation of the photoluminescence in carbon dots through surface modification: From mechanism to white light-emitting diodes. Nanotechnology 2018, 29, 245702. [Google Scholar] [CrossRef] [PubMed]
- Jiang, K.; Sun, S.; Zhang, L.; Lu, Y.; Wu, A.; Cai, C.; Lin, H. Red, green, and blue luminescence by carbon dots: Full-color emission tuning and multicolor cellular imaging. Angew. Chem. Int. Ed. 2015, 54, 5360–5363. [Google Scholar] [CrossRef]
- Schneider, C.J.; Reckmeier, C.J.; Xiong, Y.; von Seckendorff, M.; Susha, A.S.; Kasák, P.; Rogach, A.L. Aggregated Molecular Fluorophores in the Ammonothermal Synthesis of Carbon Dots. J. Phys. Chem. C 2017, 121, 2014–2022. [Google Scholar] [CrossRef]
- Han, Y.; Liu, Y.; Zhao, H.; Vomiero, A.; Li, R. Highly efficient ratiometric nanothermometers based on colloidal carbon quantum dots. J. Mater. Chem. B 2021, 9, 4111–4119. [Google Scholar] [CrossRef] [PubMed]
- Zhao, H.; Vomiero, A.; Rosei, F. Tailoring the Heterostructure of Colloidal Quantum Dots for Ratiometric Optical Nanothermometry. Small 2020, 16, 2000804. [Google Scholar] [CrossRef]
- Yang, Y.; Kong, W.; Li, H.; Liu, J.; Yang, M.; Huang, H.; Liu, Y.; Wang, Z.; Wang, Z.; Sham, T.-K.; et al. Fluorescent N-Doped Carbon Dots as in Vitro and in Vivo Nanothermometer. ACS Appl. Mater. Interfaces 2015, 7, 27324–27330. [Google Scholar] [CrossRef] [PubMed]
- Yu, P.; Wen, X.; Toh, Y.-R.; Tang, J. Temperature-dependent fluorescence in carbon dots. J. Phys. Chem. C 2012, 116, 25552–25557. [Google Scholar] [CrossRef]
- Yuan, F.; Ding, L.; Li, Y.; Li, X.; Fan, L.; Zhou, S.; Fang, D.; Yang, S. Multicolor fluorescent graphene quantum dots colorimetrically responsive to all-pH and a wide temperature range. Nanoscale 2015, 7, 11727–11733. [Google Scholar] [CrossRef]
- Zhang, J.; Nan, D.; Pan, S.; Liu, H.; Yang, H.; Hu, X. N,S co-doped carbon dots as a dual-functional fluorescent sensor for sensitive detection of baicalein and temperature. Spectrochim. Acta Part A Mol. Biomol. Spectrosc. 2019, 221, 117161. [Google Scholar] [CrossRef]
- Kalytchuk, S.; Polakova, K.; Wang, Y.; Froning, J.P.; Cepe, K.; Rogach, A.L.; Zboril, R. Carbon Dot Nanothermometry: Intracellular Photoluminescence Lifetime Thermal Sensing. ACS Nano 2017, 11, 1432–1442. [Google Scholar] [CrossRef]
- Mohammed, L.J.; Omer, K.M. Dual functional highly luminescence B, N co-doped carbon nanodots as nanothermometer and Fe3+/Fe2+ sensor. Sci. Rep. 2020, 10, 3028. [Google Scholar] [CrossRef] [PubMed]
- Wang, C.; Jiang, K.; Wu, Q.; Wu, J.; Zhang, C. Green Synthesis of Red-Emitting Carbon Nanodots as a Novel “Turn-on” Nanothermometer in Living Cells. Chem. Eur. J. 2016, 22, 14475. [Google Scholar] [CrossRef] [PubMed]
- Cui, X.; Wang, Y.; Liu, J.; Yang, Q.; Zhang, B.; Gao, Y.; Wang, Y.; Lu, G. Dual functional N- and S-co-doped carbon dots as the sensor for temperature and Fe3+ ions. Sens. Actuators B Chem. 2017, 242, 1272–1280. [Google Scholar] [CrossRef]
- Wang, C.; Hu, T.; Thomas, T.; Song, S.; Wen, Z.; Wang, C.; Song, Q.; Yang, M. Surface state-controlled C-dot/C-dot based dual-emission fluorescent nanothermometers for intra-cellular thermometry. Nanoscale 2018, 10, 21809. [Google Scholar] [CrossRef]
- Nguyen, V.; Yan, L.; Xu, H.; Yue, M. One-step synthesis of multi-emission carbon nanodots for ratiometric temperature sensing. Appl. Surf. Sci. 2018, 427, 1118–1123. [Google Scholar] [CrossRef]
- Macairan, J.-R.; Jaunky, D.B.; Piekny, A.; Naccache, R. Intracellular ratiometric temperature sensing using fluorescent carbon dots. Nanoscale Adv. 2019, 1, 105–113. [Google Scholar] [CrossRef]
- Xu, Y.; Yang, Y.; Lin, S.; Xiao, L. Red-Emitting Carbon Nanodot-Based Wide-Range Responsive Nanothermometer for Intracellular Temperature Sensing. Anal. Chem. 2020, 92, 15632–15638. [Google Scholar] [CrossRef]
- Guo, Z.; Luo, J.; Zhu, Z.; Sun, Z.; Zhang, X.; Wu, Z.-C.; Mo, F.; Guan, A. A facile synthesis of high-efficient N,S co-doped carbon dots for temperature sensing application. Dye. Pigment. 2020, 173, 107952. [Google Scholar] [CrossRef]
- Li, C.; Qin, Z.; Wang, M.; Liu, W.; Jiang, H.; Wang, X. Manganese oxide doped carbon dots for temperature responsive biosensing and target bioimaging. Anal. Chim. Acta 2020, 1104, 125–131. [Google Scholar] [CrossRef]
- Treussart, F.; Vlasov, I.I. Photoluminescence of color centers in nanodiamonds. In Nanodiamonds, Advanced Material Analysis, Properties and Applications, Micro and Nano Technologies; Arnault, J.-C., Ed.; Elsevier: Amsterdam, The Netherlands, 2017; Chapter 7; pp. 155–181. [Google Scholar]
- Nebel, C.E. General properties of diamond. In Nanodiamonds, Advanced Material Analysis, Properties and Applications, Micro and Nano Technologies; Arnault, J.-C., Ed.; Elsevier: Amsterdam, The Netherlands, 2017; Chapter 7; pp. 1–24. [Google Scholar]
- Mochalin, V.N.; Shenderova, O.; Ho, D.; Gogotsi, Y. The properties and applications of nanodiamonds. Nat. Nanotechnol. 2012, 7, 11–23. [Google Scholar] [CrossRef]
- Kucsko, G.; Maurer, P.C.; Yao, N.Y.; Kubo, M.H.; Noh, J.; Lo, P.K.; Park, H.; Lukin, M.D. Nanometre-scale thermometry in a living cell. Nature 2013, 500, 54–59. [Google Scholar] [CrossRef]
- Petrini, G.; Tomagra, G.; Bernardi, E.; Moreva, E.; Traina, P.; Marcantoni, A.; Picollo, F.; Kvaková, K.; Cígler, P.; Degiovanni, I.P.; et al. Nanodiamond–quantum sensors reveal temperature variation associated to hippocampal neurons firing. Adv. Sci. 2022, 9, e2202014. [Google Scholar] [CrossRef]
- Zhang, T.; Pramanik, G.; Zhang, K.; Gulka, M.; Wang, L.; Jing, J.; Xu, F.; Li, Z.; Wei, Q.; Cigler, P.; et al. Toward Quantitative Bio-sensing with Nitrogen−Vacancy Center in Diamond. ACS Sens. 2021, 6, 2077–2107. [Google Scholar] [CrossRef] [PubMed]
- Fujiwara, M.; Shikano, Y. Diamond quantum thermometry: From foundations to applications. Nanotechnology 2021, 32, 482002. [Google Scholar] [CrossRef] [PubMed]
- Glushkov, E.; Navikasa, V.; Radenovic, A. Fluorescent Nanodiamonds as Versatile Intracellular Temperature Sensors. Chimia 2019, 73, 73–77. [Google Scholar] [CrossRef] [PubMed]
- Sotoma, S.; Epperla, C.P.; Chang, H.-C. Diamond Nanothermometry. Chem. Nano Mat. 2018, 2, 15–27. [Google Scholar] [CrossRef]
- Qureshi, S.A.; Hsiao, W.W.; Hussain, L.; Aman, H.; Le, T.-N.; Rafique, M. Recent Development of Fluorescent Nanodiamonds for Optical Biosensing and Disease Diagnosis. Biosensors 2022, 12, 1181. [Google Scholar] [CrossRef]
- Radtke, M.; Bernardi, E.; Slablab, A.; Nelz, R.; Neu, E. Nanoscale sensing based on nitrogen vacancy centers in single crystal diamond and nanodiamonds: Achievements and challenges. Nano Futures 2019, 3, 042004. [Google Scholar] [CrossRef]
- Plakhotnik, T.; Gruber, D. Luminescence of nitrogen-vacancy centers in nanodiamonds at temperatures between 300 and 700 K: Perspectives on nanothermometry. Phys. Chem. Chem. Phys. 2010, 12, 9751–9756. [Google Scholar] [CrossRef]
- Choi, J.; Zhou, H.; Landig, R.; Wu, H.-Y.; Yu, X.; Von Stetina, S.E.; Kucsko, G.; Mango, S.E.; Needleman, D.J.; Samuel, A.D.T.; et al. Probing and Manipulating Embryogenesis via Nanoscale Thermometry and Temperature Control. Proc. Natl. Acad. Sci. USA 2020, 117, 14636–14641. [Google Scholar] [CrossRef] [PubMed]
- Choi, S.; Agafonov, V.N.; Davydov, V.A.; Plakhotnik, T. Ultrasensitive All-Optical Thermometry Using Nanodiamonds with a High Concentration of Silicon-Vacancy Centers and Multiparametric Data Analysis. ACS Photonics 2019, 6, 1387–1392. [Google Scholar] [CrossRef]
- Ekimova, E.A.; Kondrina, M.V.; Krivobok, V.S.; Khomichc, A.A.; Vlasovc, I.I.; Khmelnitskiy, R.A.; Iwasakie, T.; Hatano, M. Effect of Si, Ge and Sn dopant elements on structure and photoluminescence of nano- and microdiamonds synthesized from organic compounds. Diam. Relat. Mater. 2019, 93, 75–83. [Google Scholar] [CrossRef]
- Fan, J.-W.; Cojocaru, I.; Becker, J.; Fedotov, I.V.; Hassan, M.; Alkahtani, A.; Alajlan, A.; Blakley, S.; Rezaee, M.; Lyamkina, A.; et al. Germanium-Vacancy Color Center in Diamond as a Temperature Sensor. ACS Photonics 2018, 5, 765–770. [Google Scholar] [CrossRef]
- Miller, C.; Puust, L.; Ekimov, E.; Vlasov, I.; Vanetsev, A.; Vinogradova, E.; Orlovskii, Y.; Treshchalov, A.; Sildos, I. Toward Performance and Applications of Large Area Optical Thermometry Based on the Luminescence of Germanium-Vacancy Defects in Diamond Nanocrystals. Phys. Status Solidi A 2020, 218, 2000217. [Google Scholar] [CrossRef]
- Romshin, A.M.; Zeeb, V.; Martyanov, A.K.; Kudryavtsev, O.S.; Pasternak, D.G.; Sedov, V.S.; Ralchenko, V.G.; Sinogeykin, A.G.; Vlasov, I.I. A new approach to precise mapping of local temperature fields in submicrometer aqueous volumes. Sci. Rep. 2021, 11, 14228. [Google Scholar] [CrossRef] [PubMed]
- Fukami, M.; Yale, C.G.; Andrich, P.; Liu, X.; Heremans, F.J.; Nealey, P.F.; Awschalom, D.D. All-Optical Cryogenic Thermometry Based on Nitrogen-Vacancy Centers in Nanodiamonds. Phys. Rev. Appl. 2019, 12, 014042. [Google Scholar] [CrossRef]
- Nishimura, Y.; Oshimi, K.; Umehara, Y.; Kumon, Y.; Miyaji, K.; Yukawa, H.; Shikano, Y.; Matsubara, T.; Fujiwara, M.; Baba, Y.; et al. Wide-Field Fluorescent Nanodiamond Spin Measurements Toward Real-Time Large-Area Intracellular Thermometry. Sci. Rep. 2021, 11, 4248. [Google Scholar] [CrossRef]
- Alkahtani, M.H.; Alghannam, F.; Jiang, L.; Rampersaud, A.A.; Brick, R.; Gomes, C.L.; Scully, M.O.; Hemmer, P.R. Fluorescent Nanodiamonds for Luminescent Thermometry in the Biological Transparency Window. Opt. Lett. 2018, 43, 3317–3320. [Google Scholar] [CrossRef]
- Singam, S.K.R.; Nesladek, M.; Goovaerts, E. NitrogenVacancy Nanodiamond Based Local Thermometry Using Frequency Jump Modulation. Nanotechnology 2020, 31, 105501. [Google Scholar] [CrossRef]
- Tsai, P.C.; Epperla, C.P.; Huang, J.S.; Chen, O.Y.; Wu, C.C.; Chang, H.C. Measuring Nanoscale Thermostability of Cell Membranes with Single Gold-Diamond Nanohybrids. Angew. Chem. Int. Ed. 2017, 56, 3025–3030. [Google Scholar] [CrossRef] [PubMed]
- Fujiwara, M.; Sun, S.; Dohms, A.; Nishimura, Y.; Suto, K.; Takezawa, Y.; Oshimi, K.; Zhao, L.; Sadzak, N.; Umehara, Y.; et al. RealTime Nanodiamond Thermometry Probing In Vivo Thermogenic Responses. Sci. Adv. 2020, 6, eaba9636. [Google Scholar] [CrossRef] [PubMed]
- Sotoma, S.; Zhong, C.; Kah, J.C.Y.; Yamashita, H.; Plakhotnik, T.; Harada, Y.; Suzuki, M. In Situ Measurements of Intracellular Thermal Conductivity Using Heater-Thermometer Hybrid Diamond Nanosensors. Sci. Adv. 2021, 7, eabd7888. [Google Scholar] [CrossRef] [PubMed]
- Nguyen, C.T.; Evans, R.E.; Sipahigil, A.; Bhaskar, M.K.; Sukachev, D.D.; Agafonov, V.N.; Davydov, V.A.; Kulikova, L.F.; Jelezko, F. Lukin, M.D. All-optical nanoscale thermometry with silicon-vacancy centers in diamond. Appl. Phys. Lett. 2018, 112, 203102. [Google Scholar] [CrossRef]
- Tran, T.T.; Regan, B.; Ekimov, E.A.; Mu, Z.; Zhou, Y.; Gao, W.; Narang, P.; Solntsev, A.S.; Toth, M.; Aharonovich, I.; et al. Anti-Stokes excitation of solid-state quantum emitters for nanoscale thermometry. Sci. Adv. 2019, 5, eaav9180. [Google Scholar] [CrossRef]
Figure 1.
(a) Ln3+ ion’s energy levels splitting; (b) Emission spectra of different Ln3+ ions between 400 and 1600 nm.
Figure 1.
(a) Ln3+ ion’s energy levels splitting; (b) Emission spectra of different Ln3+ ions between 400 and 1600 nm.

Figure 2.
Schematic presentation of excited state absorption-based ratiometric luminescent thermometry at low (a) and high (b) temperatures; (c) Simplified energy diagram of Eu3+ ions with the indication of level used for temperature sensing; (d,e) The results of LIR and temperature sensitivity. Adapted with permission from [21].

Figure 3.
(a) TEM image; (b) UC emission spectrum; inset presents a photograph of the sample under 975 nm laser irradiation at ambient conditions; (c) a simplified energy-level diagram for the synthesized YVO4:Yb3+−Tm3+ NPs; (d) the obtained relative temperature sensitivities (Sr) for TCLs of Tm3+ (700/800 nm) and non-TCLs of Yb3+ and Tm3+ (940/800 nm) as a function of temperature. Adapted from [41] under a Creative Commons Attribution (CC-BY) License.

Figure 4.
(a) TM ion’s energy levels splitting in octahedral and tetrahedral environment; (b) the influence of the polyhedron distortion on 3d energy levels splitting; (c) Tanabe–Sugano diagram for the d2 configuration; (d) representative emission spectra of different TM ions. Adapted from [10] under the Creative Commons Attribution License.

Figure 5.
(a) Temperature evolution of the emission decay, average lifetime, estimated relative thermal sensitivity; (b) schematic representation of the real-time thermal imaging method using single pulse time-gated detection. Frames 1 and 2 are acquired during and after the laser excitation pulse. The thermal image is obtained by the ratio of frames 1 and 2 for every excitation pulse; (c) thermal image obtained using single pulse time-gated method. Adapted from [63] under the Creative Commons Attribution License.

Figure 6.
(a) Configurational coordinate diagram for Mn5+ (d2 configuration, in the tetrahedral environment, the Tanabe–Sugano diagram for d8 configuration is applied) and Er3+ ions; (b) the representative TEM images of Ba3(VO4)2:1%Mn5+,0.5%Er3+ nanoparticles; (c) thermal evolution of luminescent decays of 1E excited state of Mn5+ ions for Ba3(VO4)2:1% Mn5+, 0.5% Er3+; (d) thermal evolution of Mn5+ average lifetimes; (e) the relative sensitivities; (f) temperature uncertainties for Ba3(VO4)2:1%Mn5+ co-doped with different Er3+ concentrations. Adapted from [64] under the Creative Commons Attribution License.

Figure 7.
(a) Schematic presentation of the discretization of the energy levels in QDs, relative to the bulk material; (b) luminescent shifts of different QDs of different sizes. Reprinted with permission from [14].
Figure 7.
(a) Schematic presentation of the discretization of the energy levels in QDs, relative to the bulk material; (b) luminescent shifts of different QDs of different sizes. Reprinted with permission from [14].

Figure 8.
(a) Optical absorption spectra of InP/ZnS at various and temperatures; (b) energy shift and broadening analysis of exciton absorption band: ΔE1 temperature dependence (blue square symbols are experimental estimates); (c) normalized PL and OA spectra of the InP/ZnS QDs. Adapted from [86].
Figure 8.
(a) Optical absorption spectra of InP/ZnS at various and temperatures; (b) energy shift and broadening analysis of exciton absorption band: ΔE1 temperature dependence (blue square symbols are experimental estimates); (c) normalized PL and OA spectra of the InP/ZnS QDs. Adapted from [86].

Figure 9.
(a) Silica nanoparticles (SNPs), before and after decoration with MPTS-passivated CIS QDs (50 nm scale bars); (b) suspensions of SNPs and SNPs decorated with QDs under daylight (left) and 405 nm excitation (right, image taken with a 500 nm long pass filter). In the inset, the normalized spectra of a QD sol in chloroform and the SNPs decorated with QDs suspended in water are presented; (c) temperature-dependent emission of a polymeric film embedding MPTS-passivated CIS QDs under 405 nm excitation (solid lines) along with exemplary Gaussian curves used for the deconvolution of the signal recorded at 250 K. In the inset, the polymeric film under daylight and UV light is shown; (d) relative thermal sensitivity of the thermometric approach and corresponding thermal parameter (Δ, inset) over the investigated temperature range. Reprinted with permission from {MARIN, R.; VIVIAN, A.; SKRIPKA, A.; MIGLIORI, A.; MORANDI, V.; ENRICHI, F.; VETRONE, F.; CERONI, P.; APRILE, C.; CANTON, P. MERCAPTOSILANE-PASSIVATED CuInS2 QUANTUM DOTS FOR LUMINESCENCE THERMOMETRY AND LUMINESCENT LABELS. ACS APPL. NANO MATER. 2019, 2, 2426−2436}. Copyright {2023} American Chemical Society [87].

Figure 10.
(a) Jablonski diagram of the energy of states in organic molecules; (b) scheme of the typical spectra of organic molecules.
Figure 10.
(a) Jablonski diagram of the energy of states in organic molecules; (b) scheme of the typical spectra of organic molecules.

Figure 11.
(a) Schematic of the fabrication of TRF NPs; (b) TEM photographs of TRF NPs, inset: particle size distribution of TRF NPs (mean diameter of 48 nm); (c) PL spectra of TRF NPs with temperature increased from 25 to 65 °C; (d) PL intensity ratio versus temperature curves of TRF NPs; (e) PL intensity ratios variation in TRF NPs during repeated heating and cooling. Reprinted with permission from {MENG, L.; JIANG, S.; SONG, M.; YAN, F.; ZHANG, W.; XU, B.; TIAN, W. TICT-BASED NEAR-INFRARED RATIOMETRIC ORGANIC FLUORESCENT THERMOMETER FOR INTRACELLULAR TEMPERATURE SENSING. ACS APPL. MATER. INTERFACES 2020, 12(24), 26842–26851}. Copyright {2023} American Chemical Society [96].

Figure 12.
(a) Temperature dependency of TADF decay times for Zr(PDP)2 complexes immobilized in PS acquired under anoxic conditions; (b) Temperature dependence of emission intensity of Zr(PDP)2 complexes immobilized in PS measured under anoxic conditions; (c) Imaging of temperature distribution in a microfluidic chip with an aqueous dispersion of Zr(MesIPDPt-BuPh)2-PVA-MAA nanoparticles. Adapted from [97] under the Creative Commons Attribution License.

Figure 13.
(a) Schematic presentation of the CDs with the exemplary functional groups at their surface. Red color indicates a graphene-like core and the grey color stands for the surface functional groups surrounding the core. Adapted with permission from [115]; (b) simplified energy band scheme of CDs. Dopants and/or surface functional groups can introduce additional energy levels and modify possible photoluminescence output; (c) typical luminescence emission spectra of various CDs can appear in different spectral ranges, from blue to NIR.

Figure 14.
In vitro intracellular PL lifetime thermal sensing using N,S-CDs. (a) PL emission decays of HeLa cells incubated with N,S-CDs (500 μg/mL) at different temperatures (Tset), together with the single-exponential fits; (b) temperatures determined using the calibration curve (Tmeas.) and set temperatures (Tset) plotted against the PL lifetime; (c–f) applicability of N,S-CDs for long-term remote intracellular temperature monitoring; (c) PL lifetimes extracted from PL transients recorded every 15 min for 24 h of HeLa cells incubated with N,S-CDs (500 μg/mL); (d) temperatures determined using the calibration curve; (e) temperatures measured with a reference thermometer (Tref.); (f) histogram showing the distribution of temperature differences between the obtained and reference temperatures; the solid line is the distribution curve. Reprinted from [121] under an ACS Author Choice License.

Figure 15.
(a) Fluorescence spectra of CDs at different temperatures; (b) the linear fit of fluorescence intensity temperature change; (c) fluorescence intensity upon the cyclic switching of CDs under alternating conditions of 20 °C and 90 °C. Reprinted from [122], under the Creative Commons Attribution 4.0 International License http://creativecommons.org/licenses/by/4.0/, accessed on 11 October 2023.

Figure 16.
Wide fluorescent spectral range of different color centers in diamond. Reprinted from [137], under the Creative Commons Attribution 4.0 International License http://creativecommons.org/licenses/by/4.0/, accessed on 11 October 2023.
Figure 16.
Wide fluorescent spectral range of different color centers in diamond. Reprinted from [137], under the Creative Commons Attribution 4.0 International License http://creativecommons.org/licenses/by/4.0/, accessed on 11 October 2023.

Figure 17.
(a) Basic energy level scheme of the NV center; (b) schematic presentation of the NV center all-optical thermometry, typical photoluminescence emission spectrum of a single NV center displaying ZPL (638 nm) and PSB, in the inset: the temperature-dependent shift of ZPL; (c) typical ODMR spectra of the NV centers in nanodiamonds, in the inset: thermally induced changes in the ODMR spectra.

Figure 18.
(a) Optically detected magnetic resonance of an NV thermometer. Contrast is defined as the fluorescence ratio of the thermometer with and without the application of microwaves. In temperature measurements, the resonance curve is sampled at four optimized frequencies (red crosses) to extract the resonance position D(T) at a given local temperature T; (b) 2D temperature distribution map of the laser-illuminated C. elegans embryo, measured by a collection of NV thermometers inside an embryo, with comparisons between experiments and simulations. Adapted from [143].

Figure 19.
(a) Emission spectra of NDs on the surface of TiO2 film, upon heating by a focused laser beam. The laser was pointed onto the object for 5 min while recording a spectrum every minute. Then, the laser excitation was removed, and the object was cooled for 5 min, after which, a spectrum was recorded again. The spectra are obtained in the temperature range 293–323 K. Insert: a cluster of ND aggregates; (b) the fits of the ZPL shifts from different theoretical models. Adapted with permission from [147].


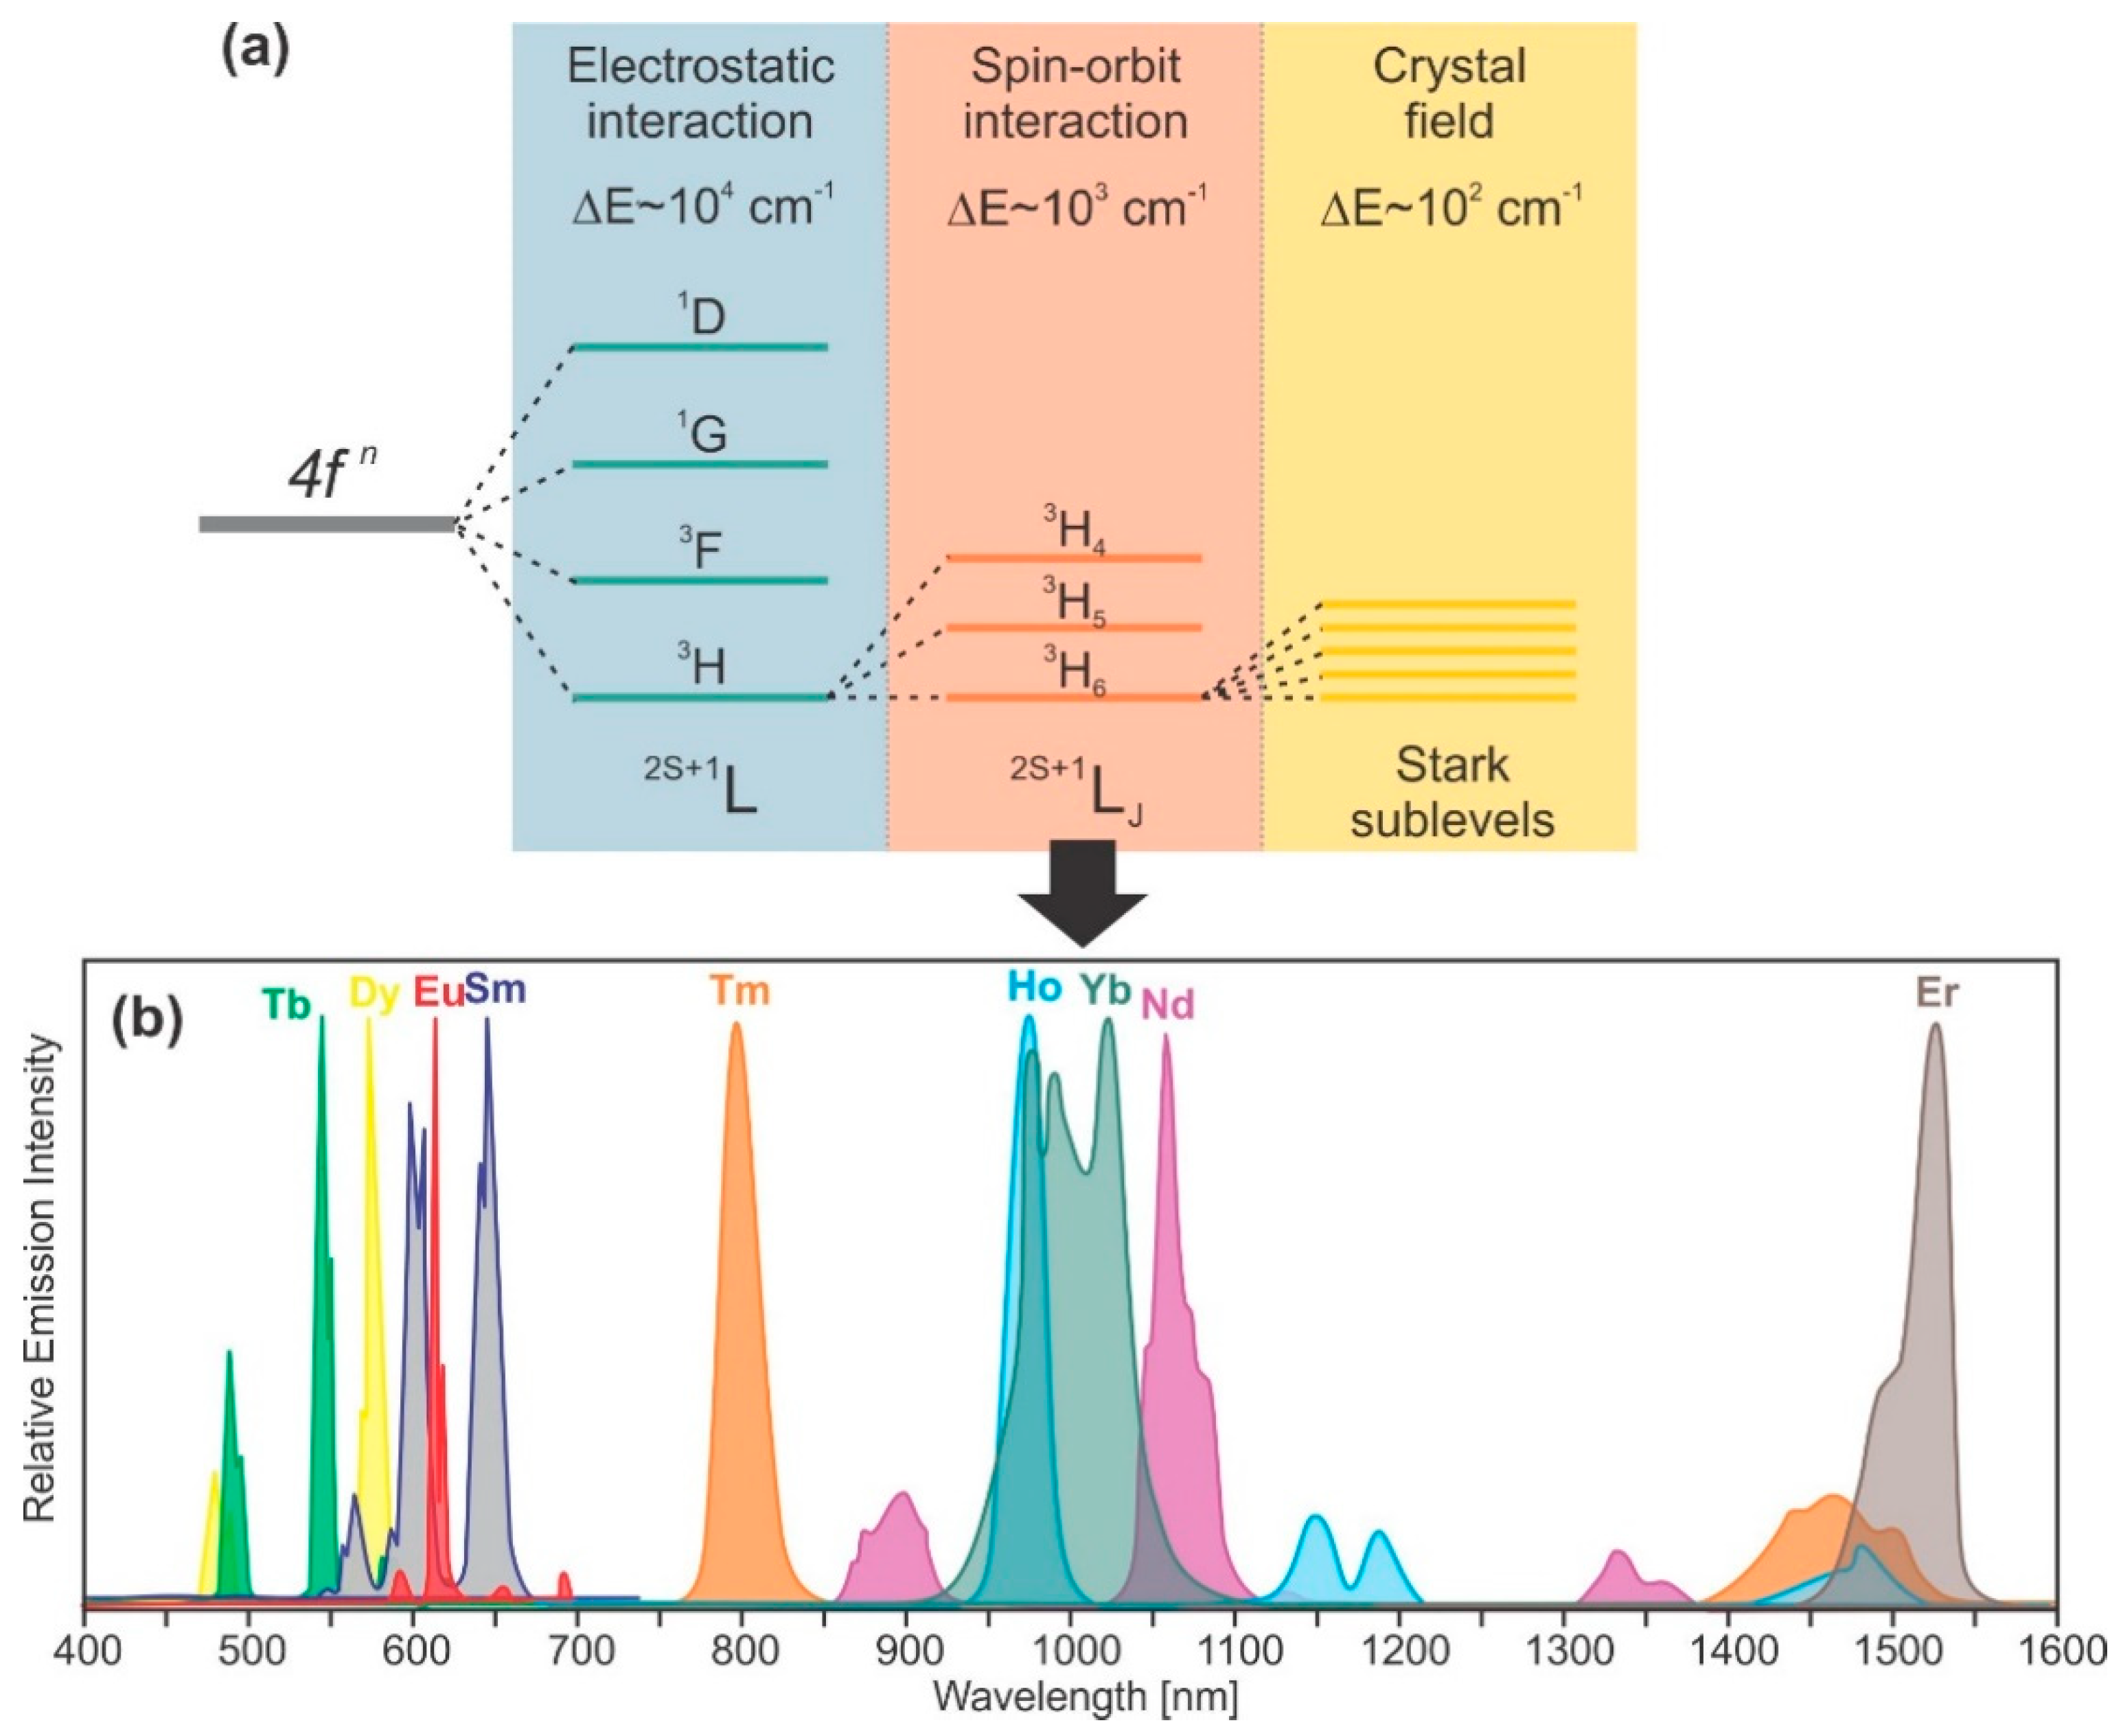
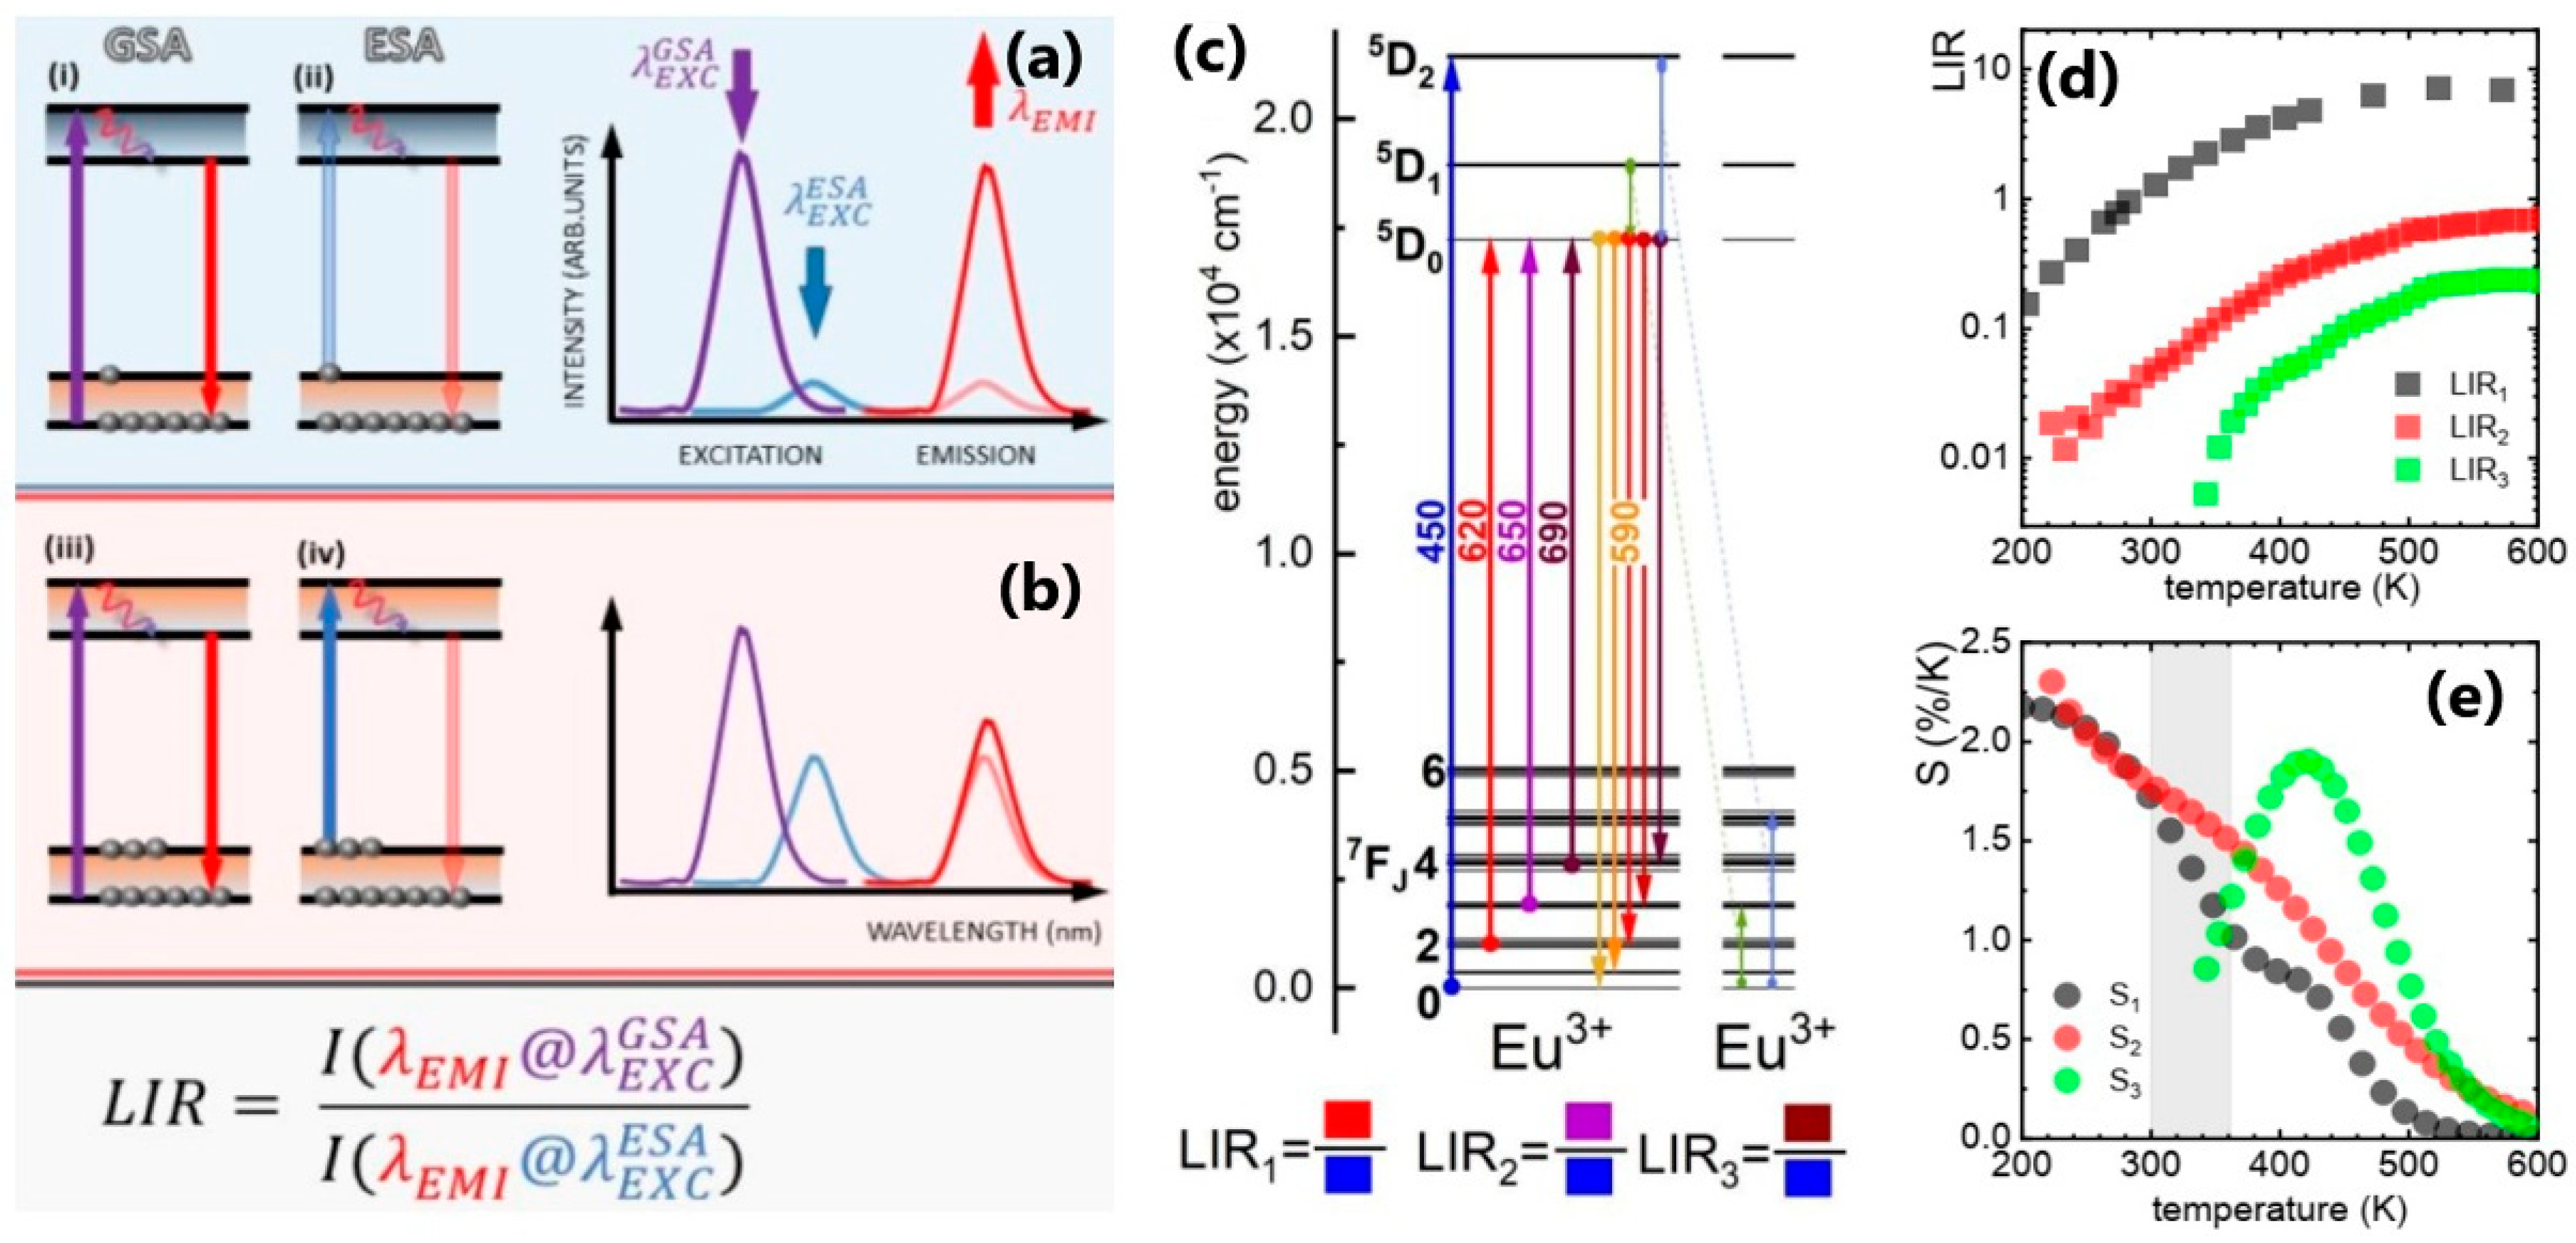
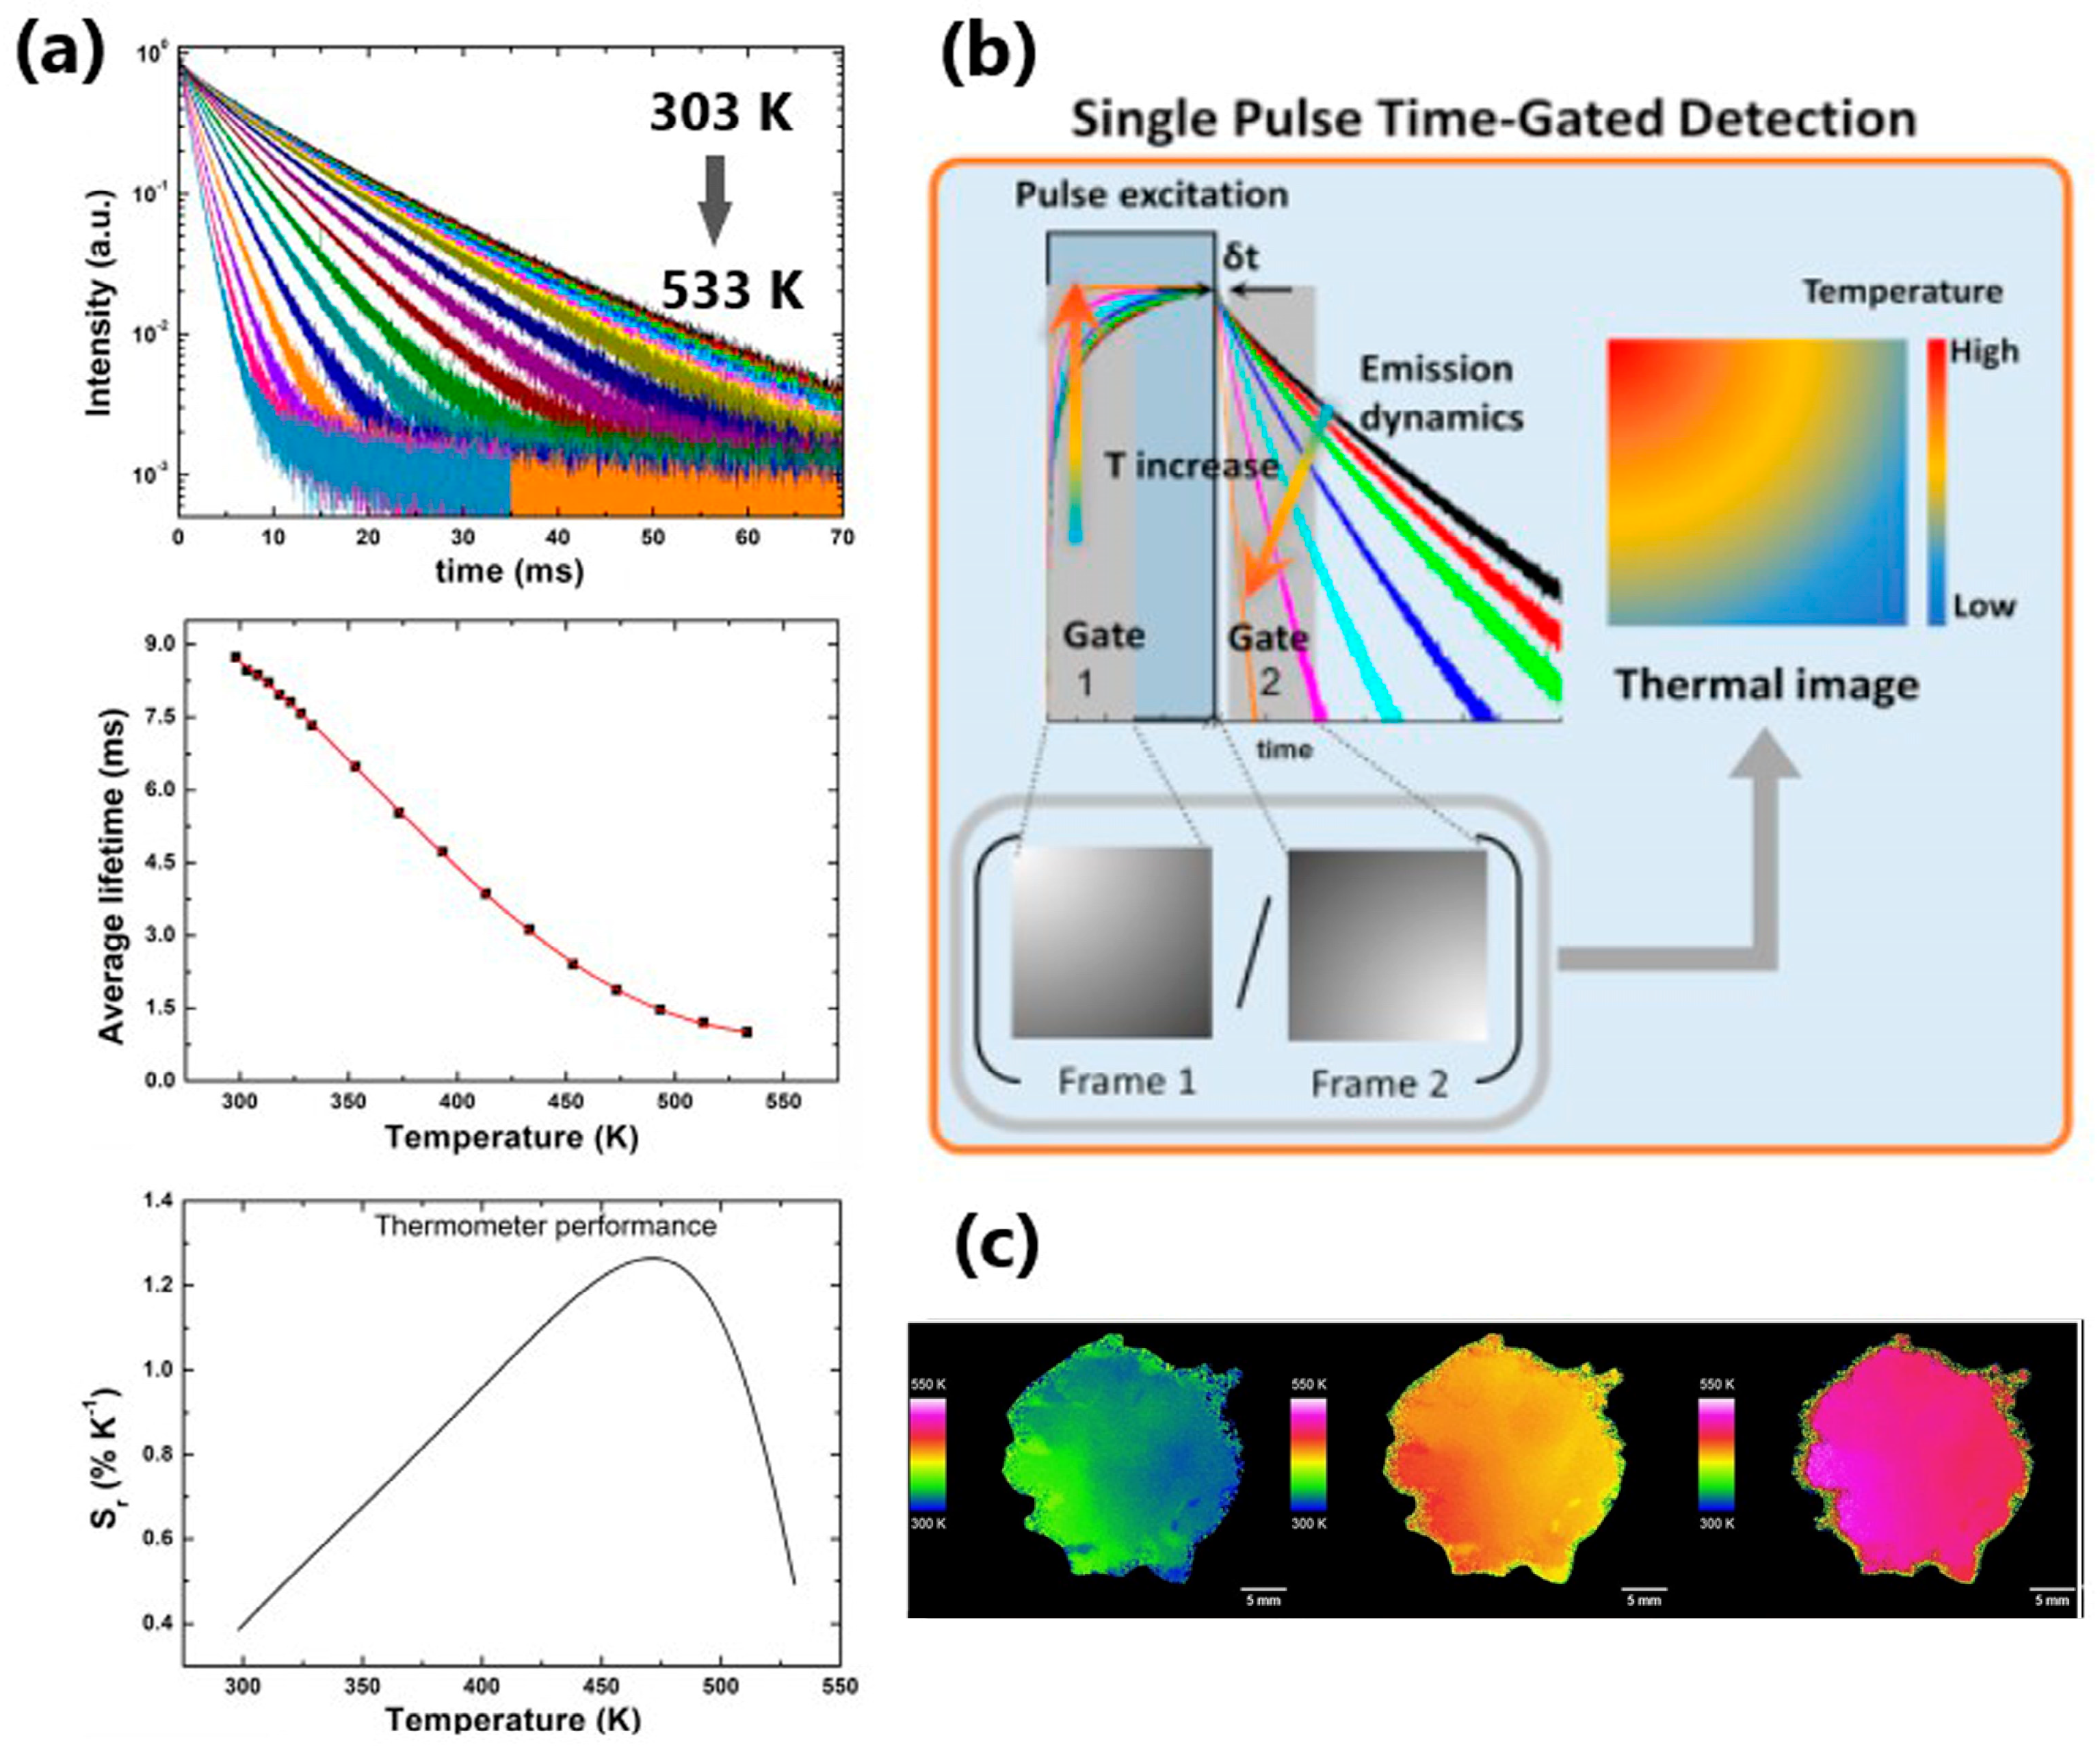
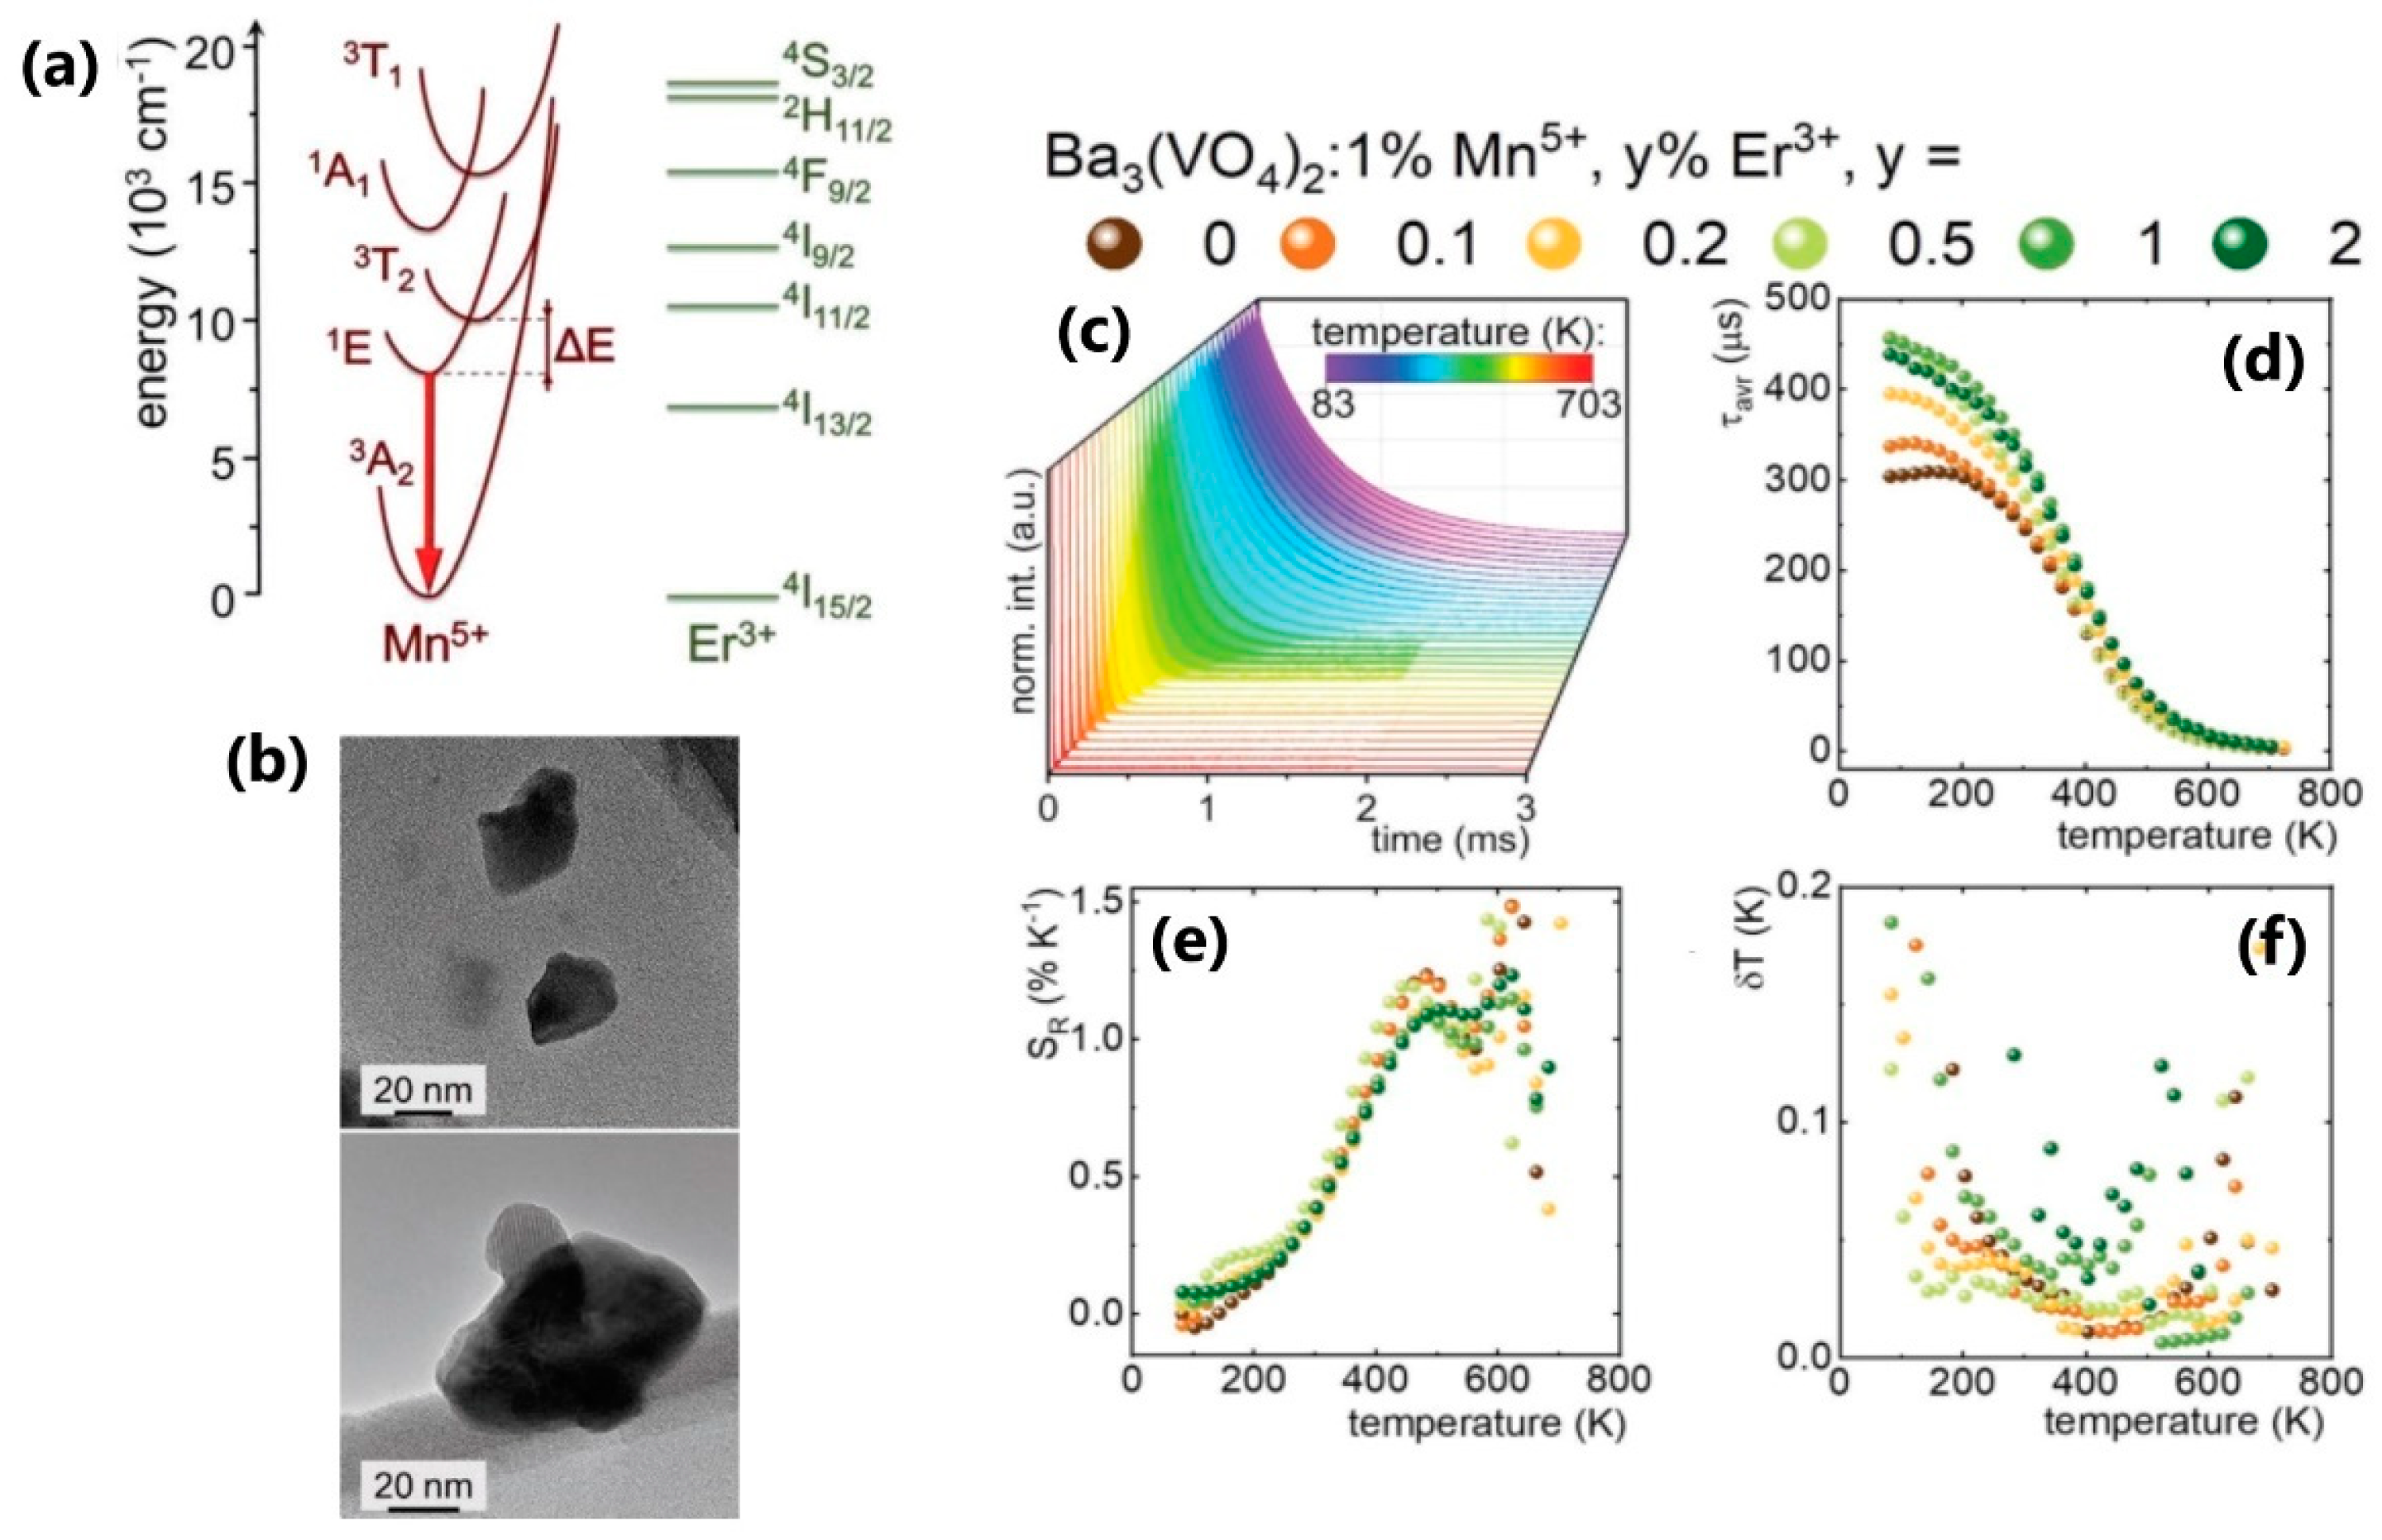
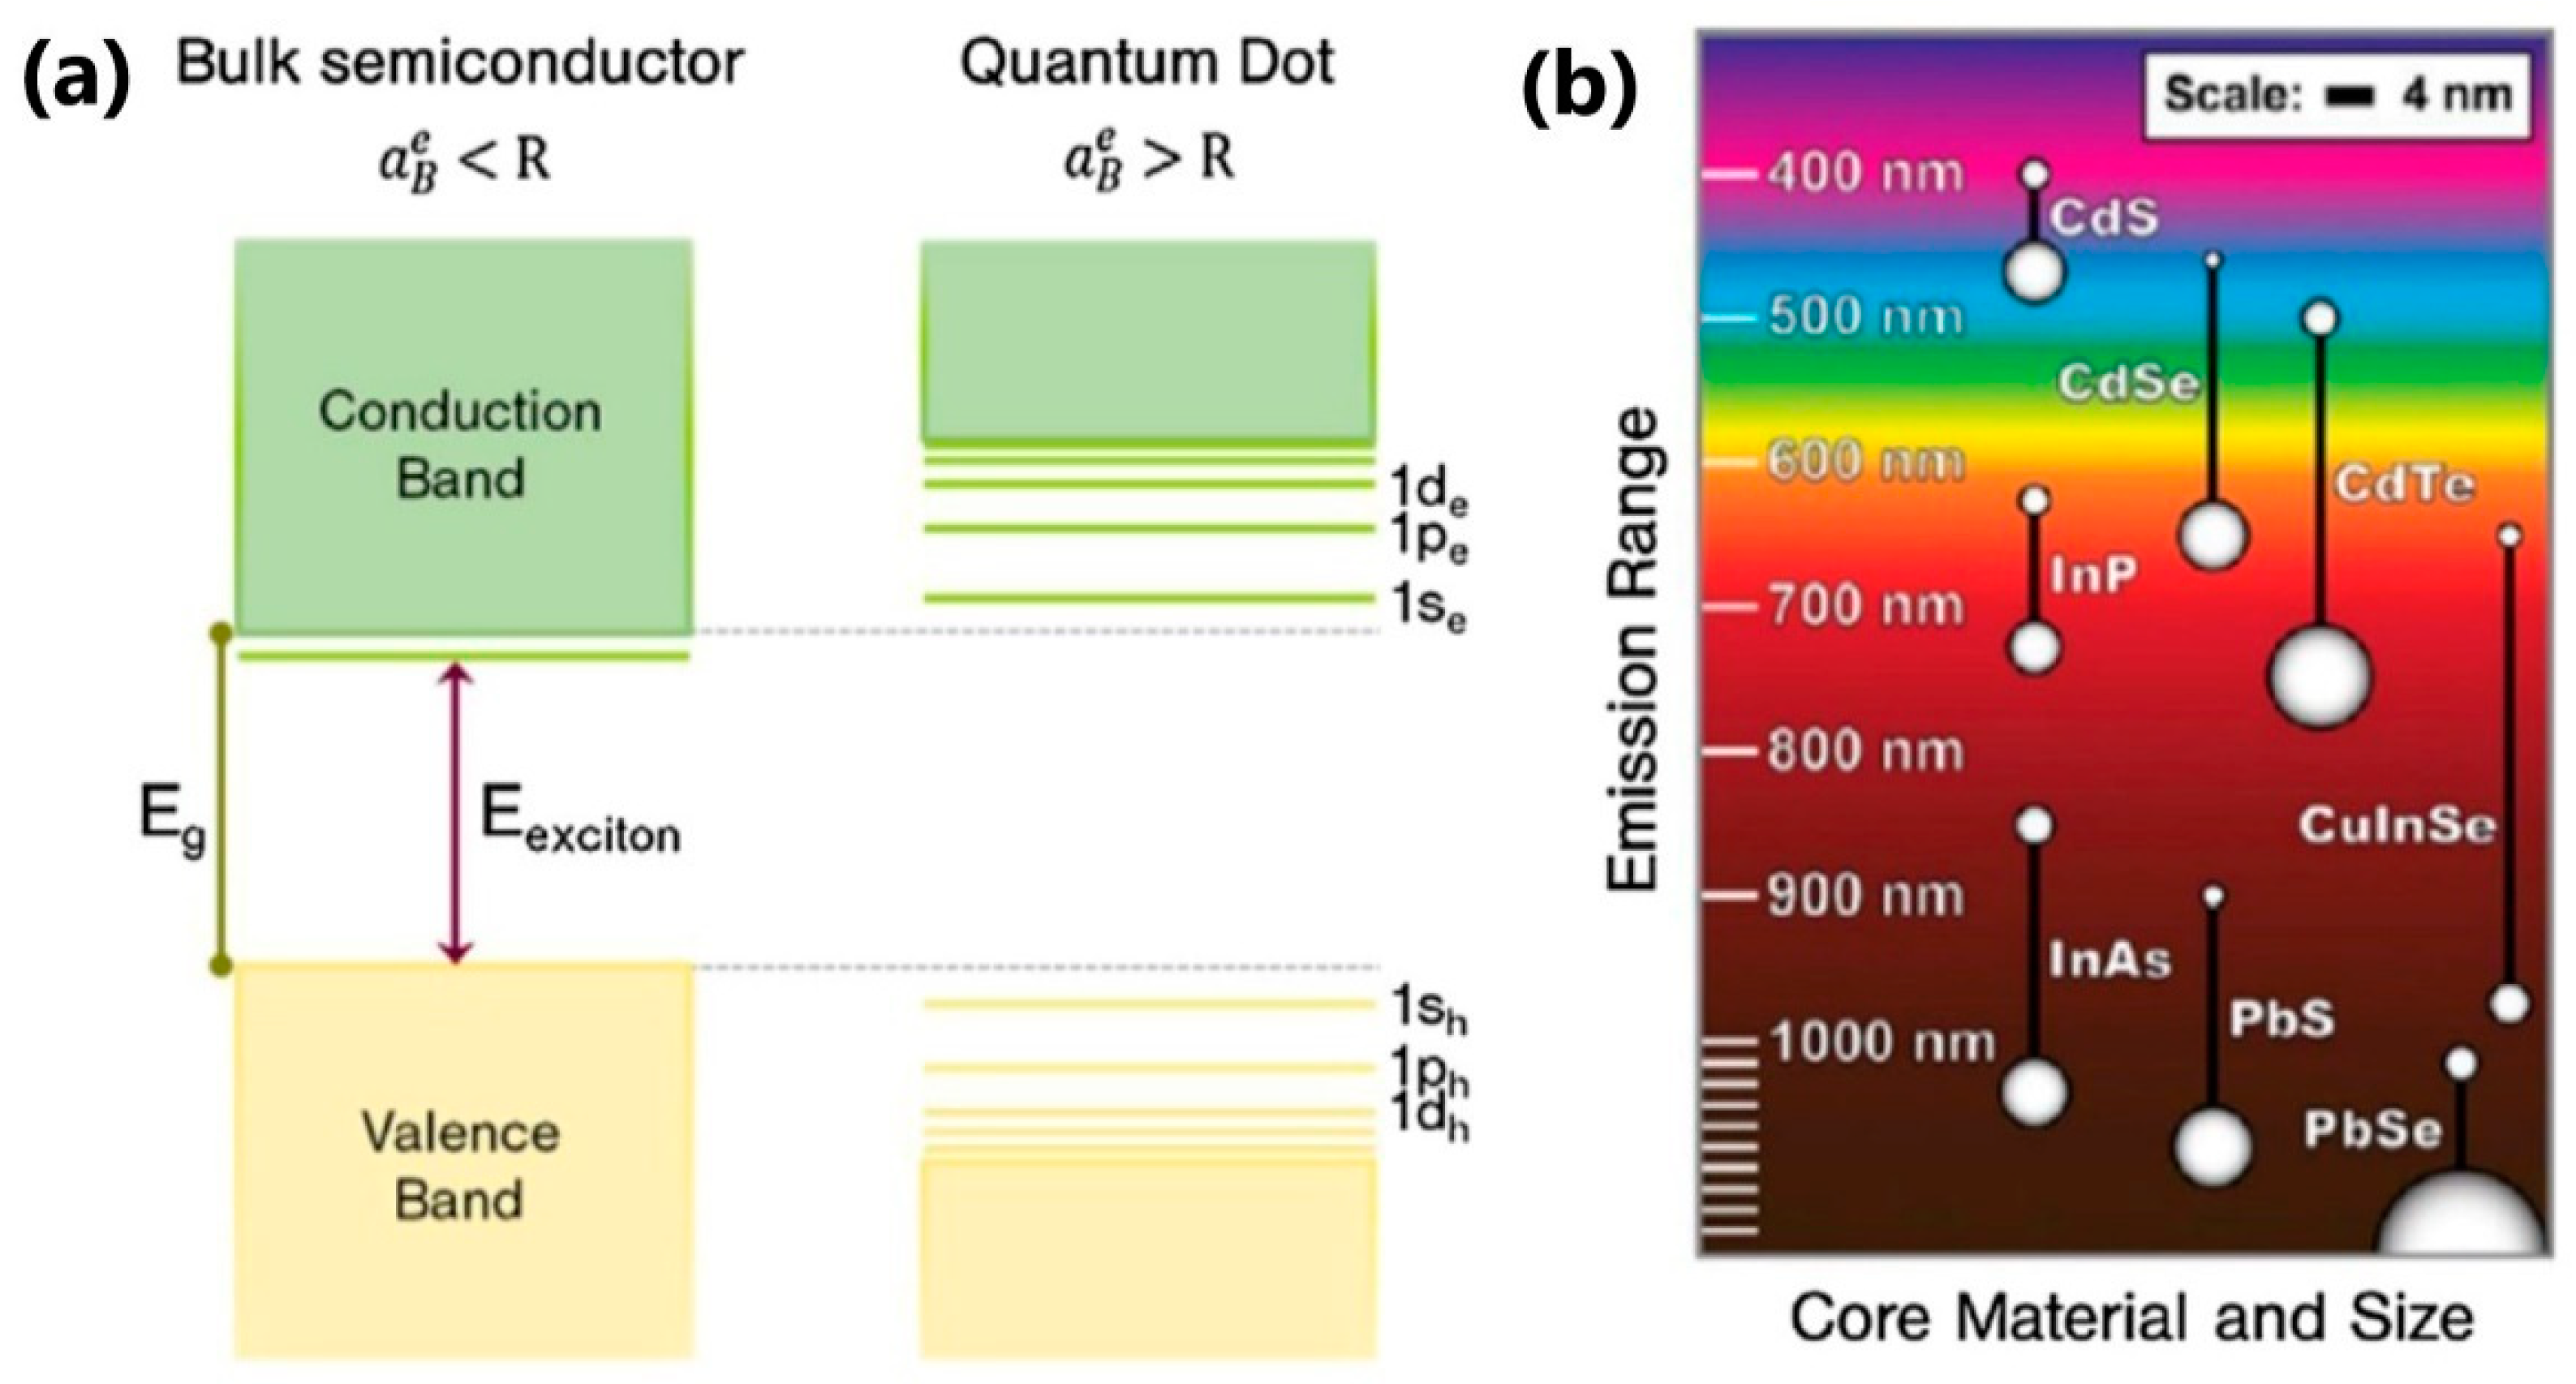
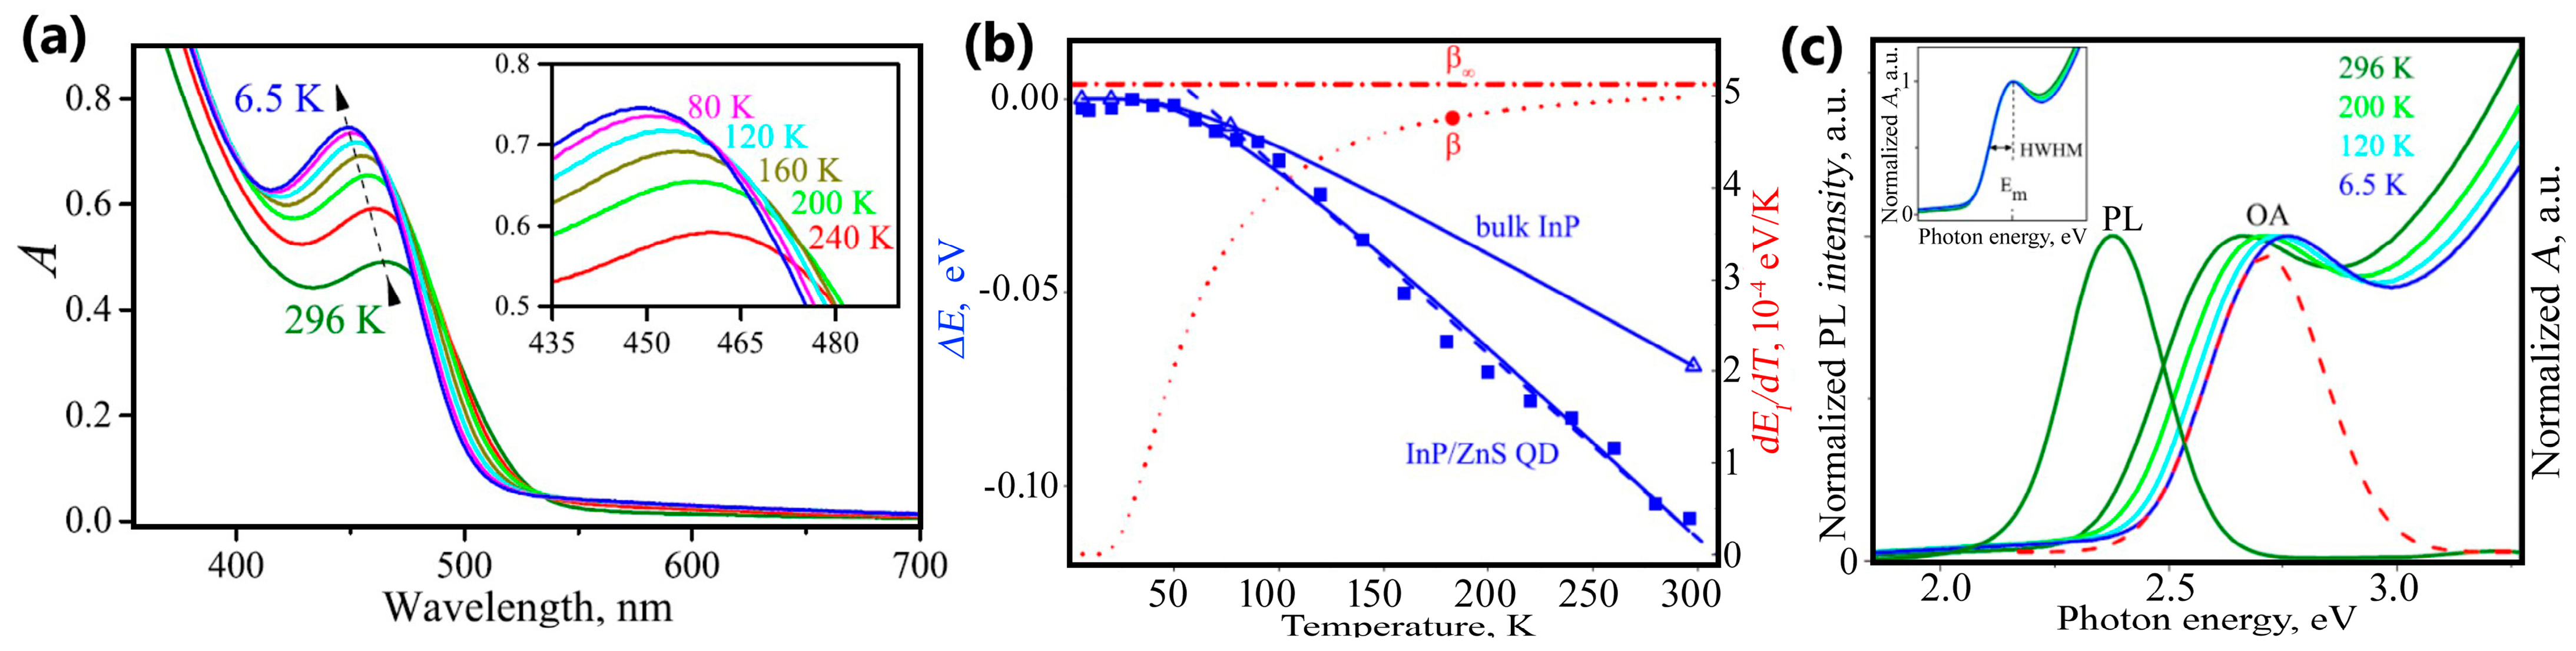
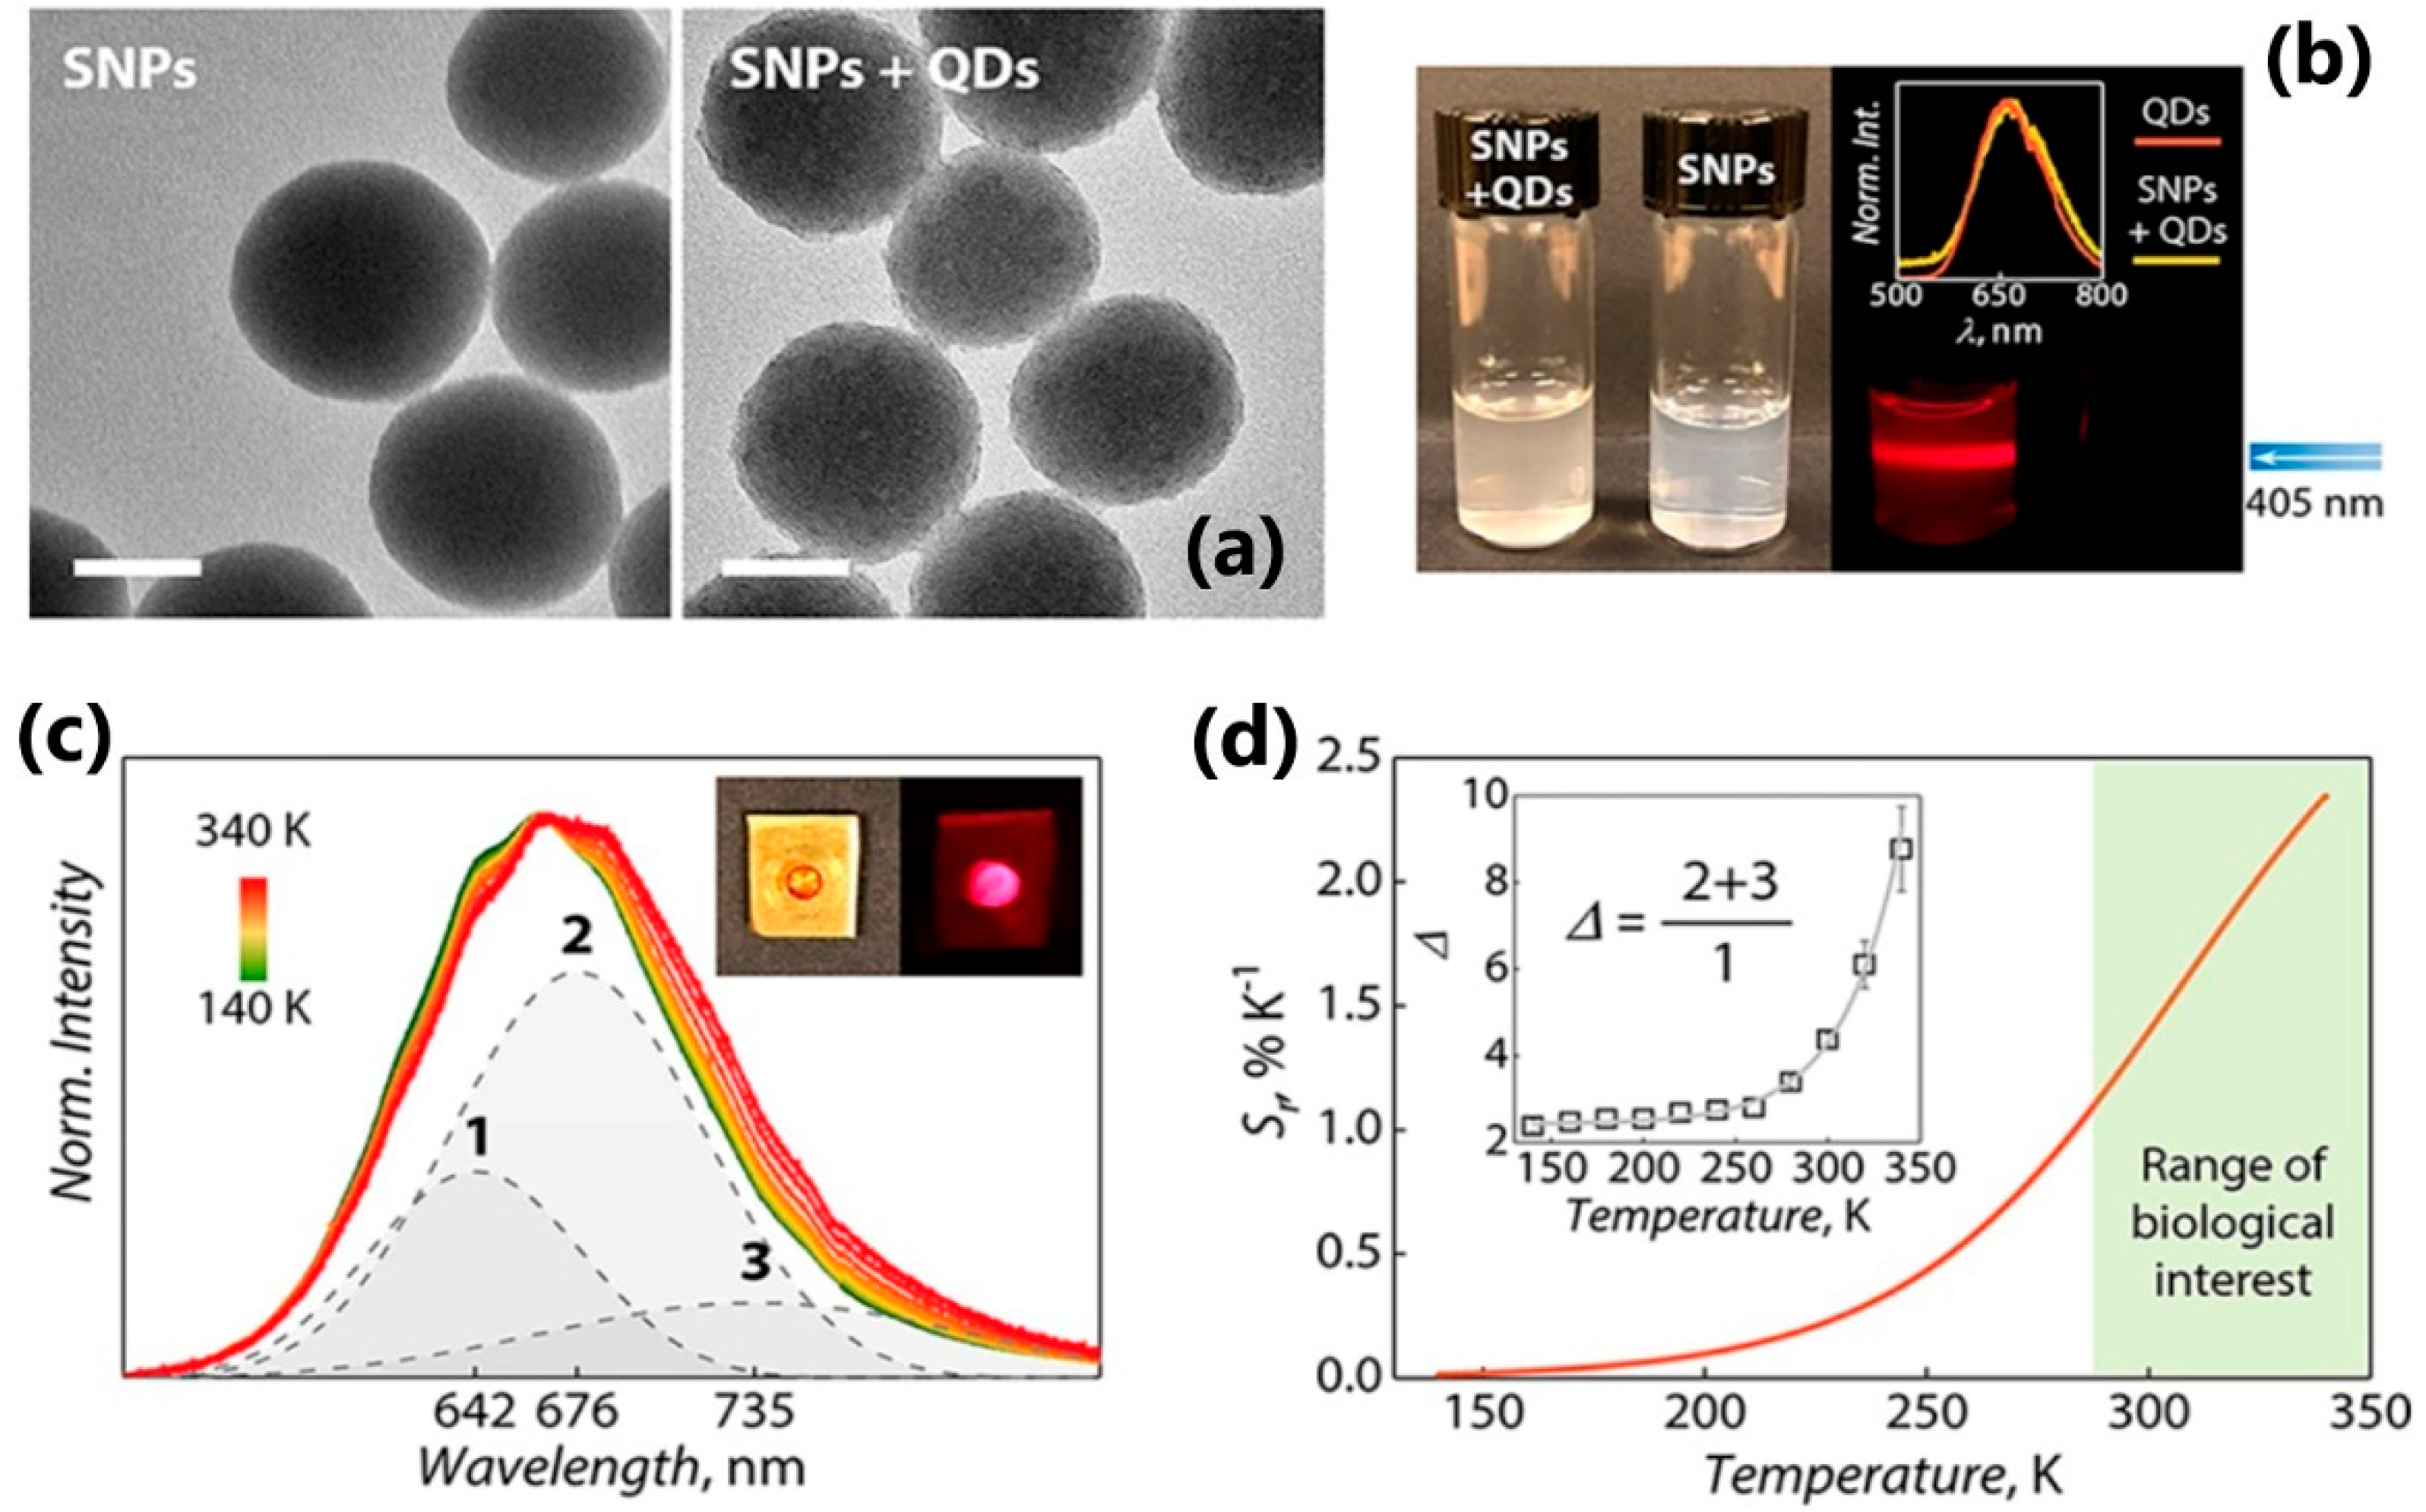
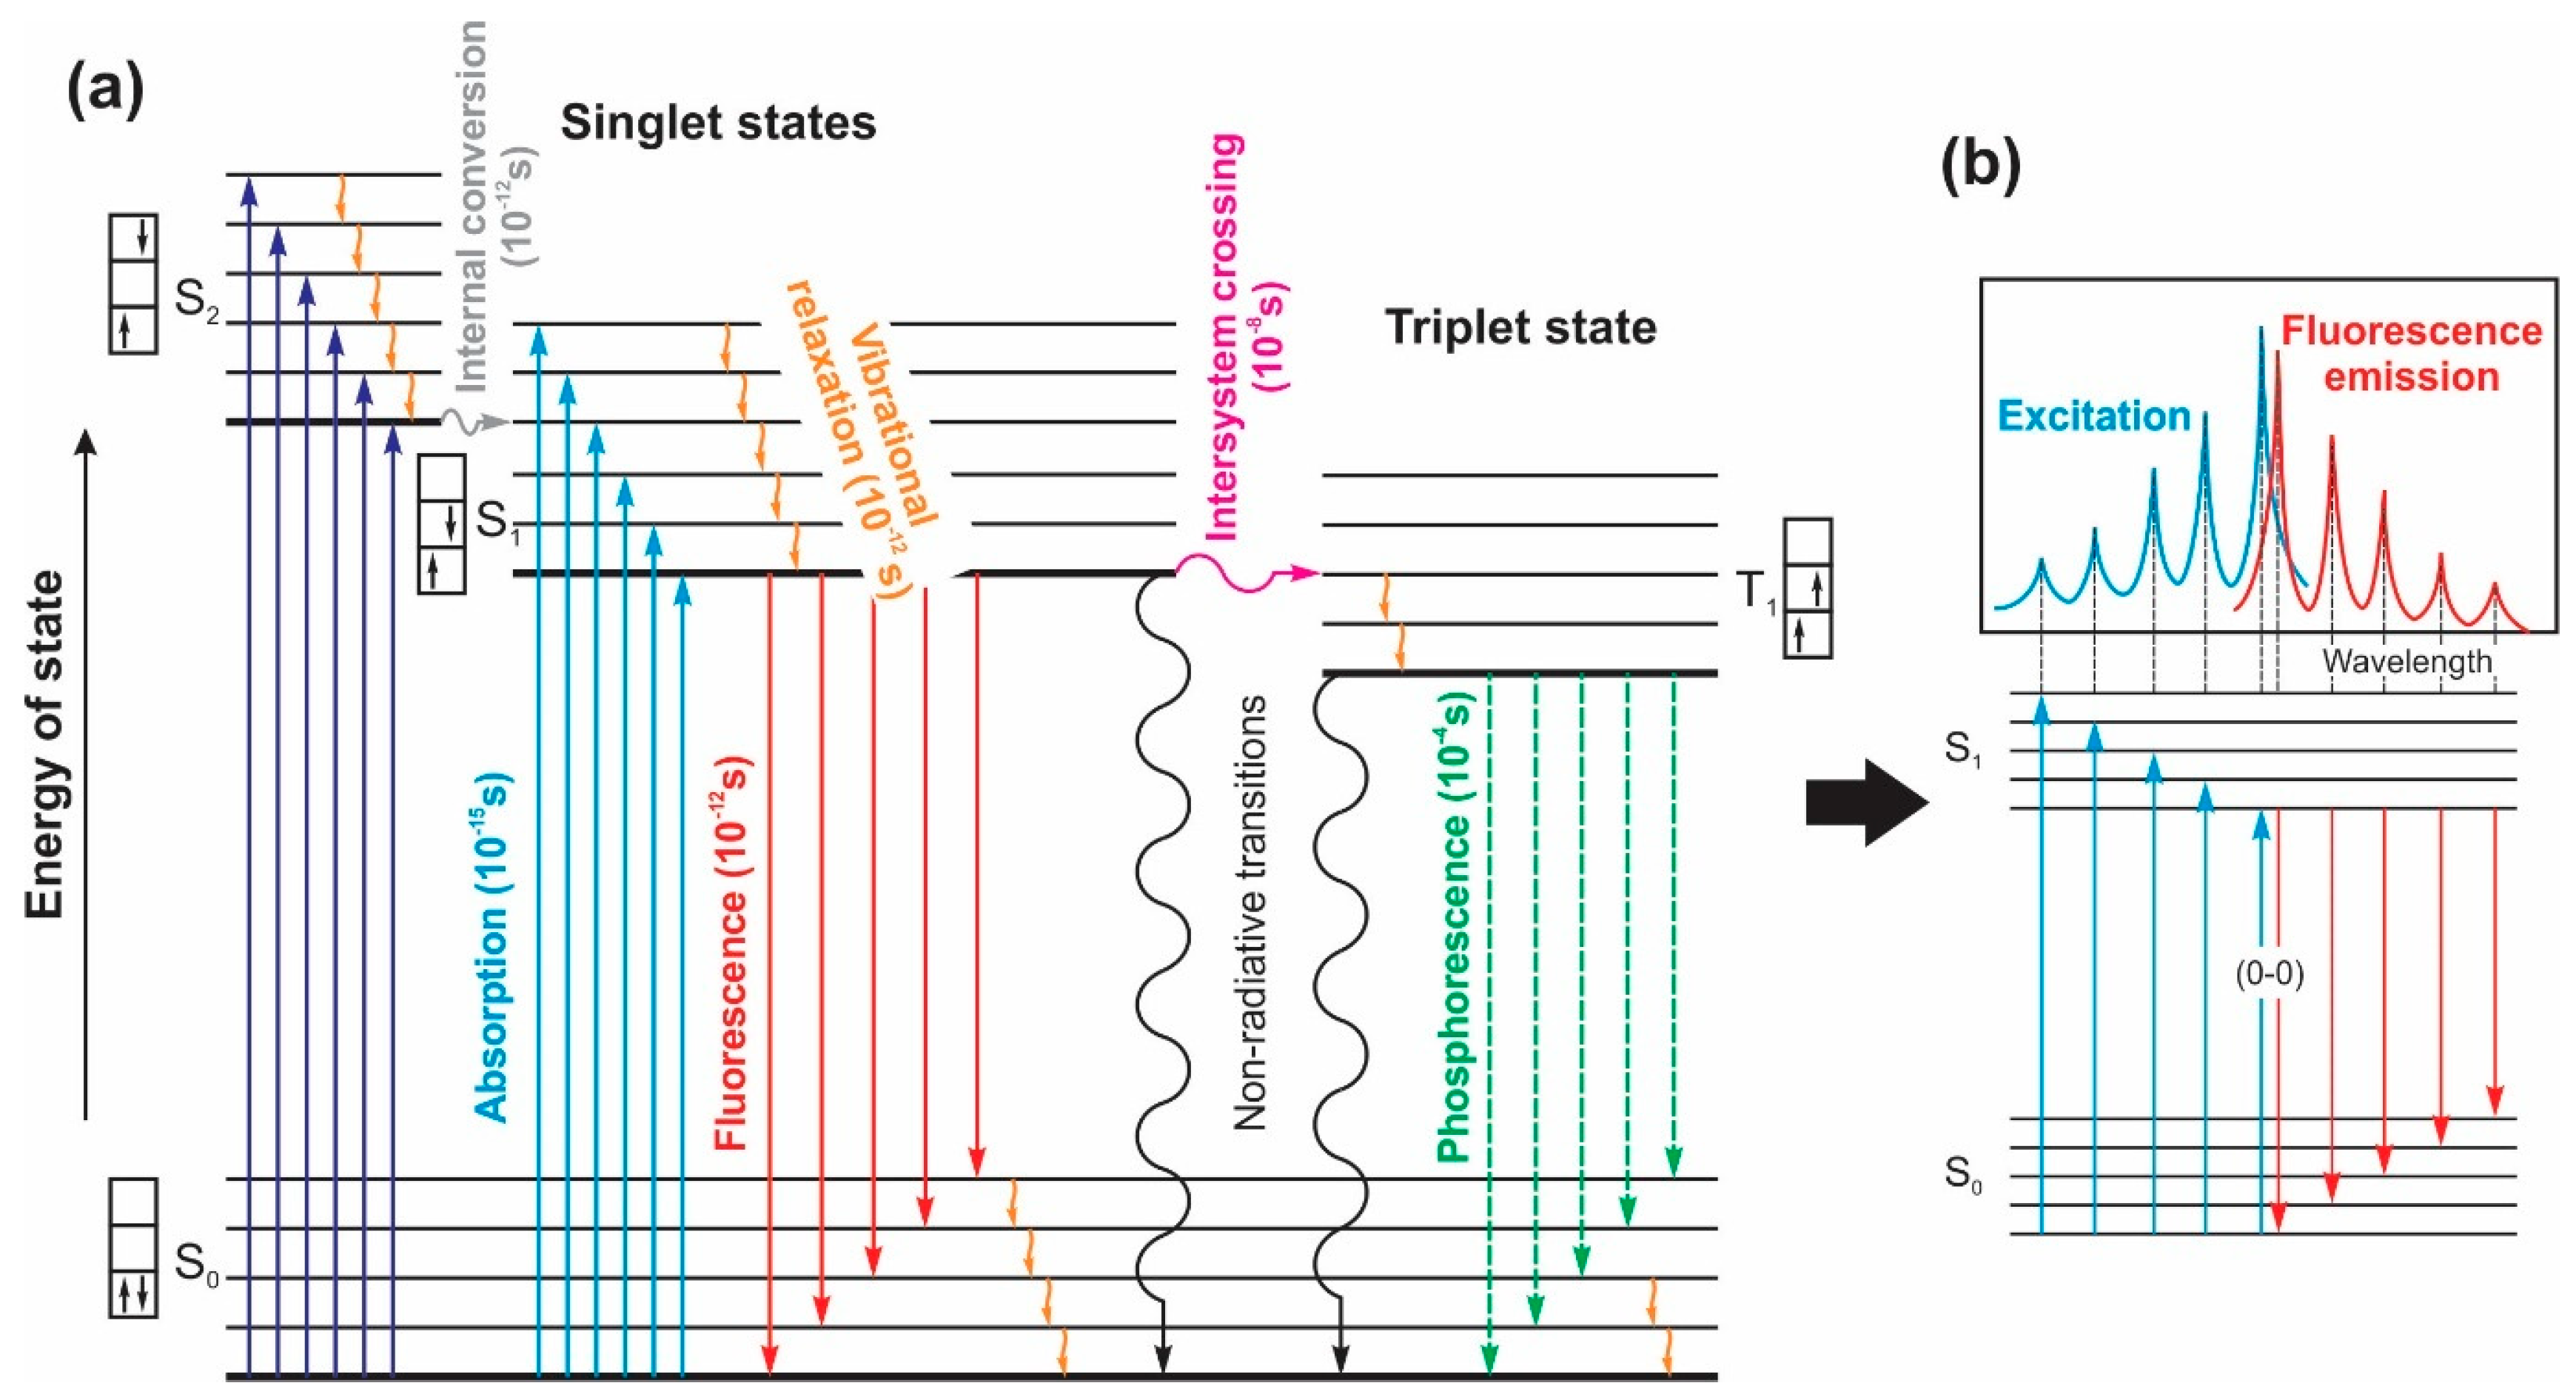
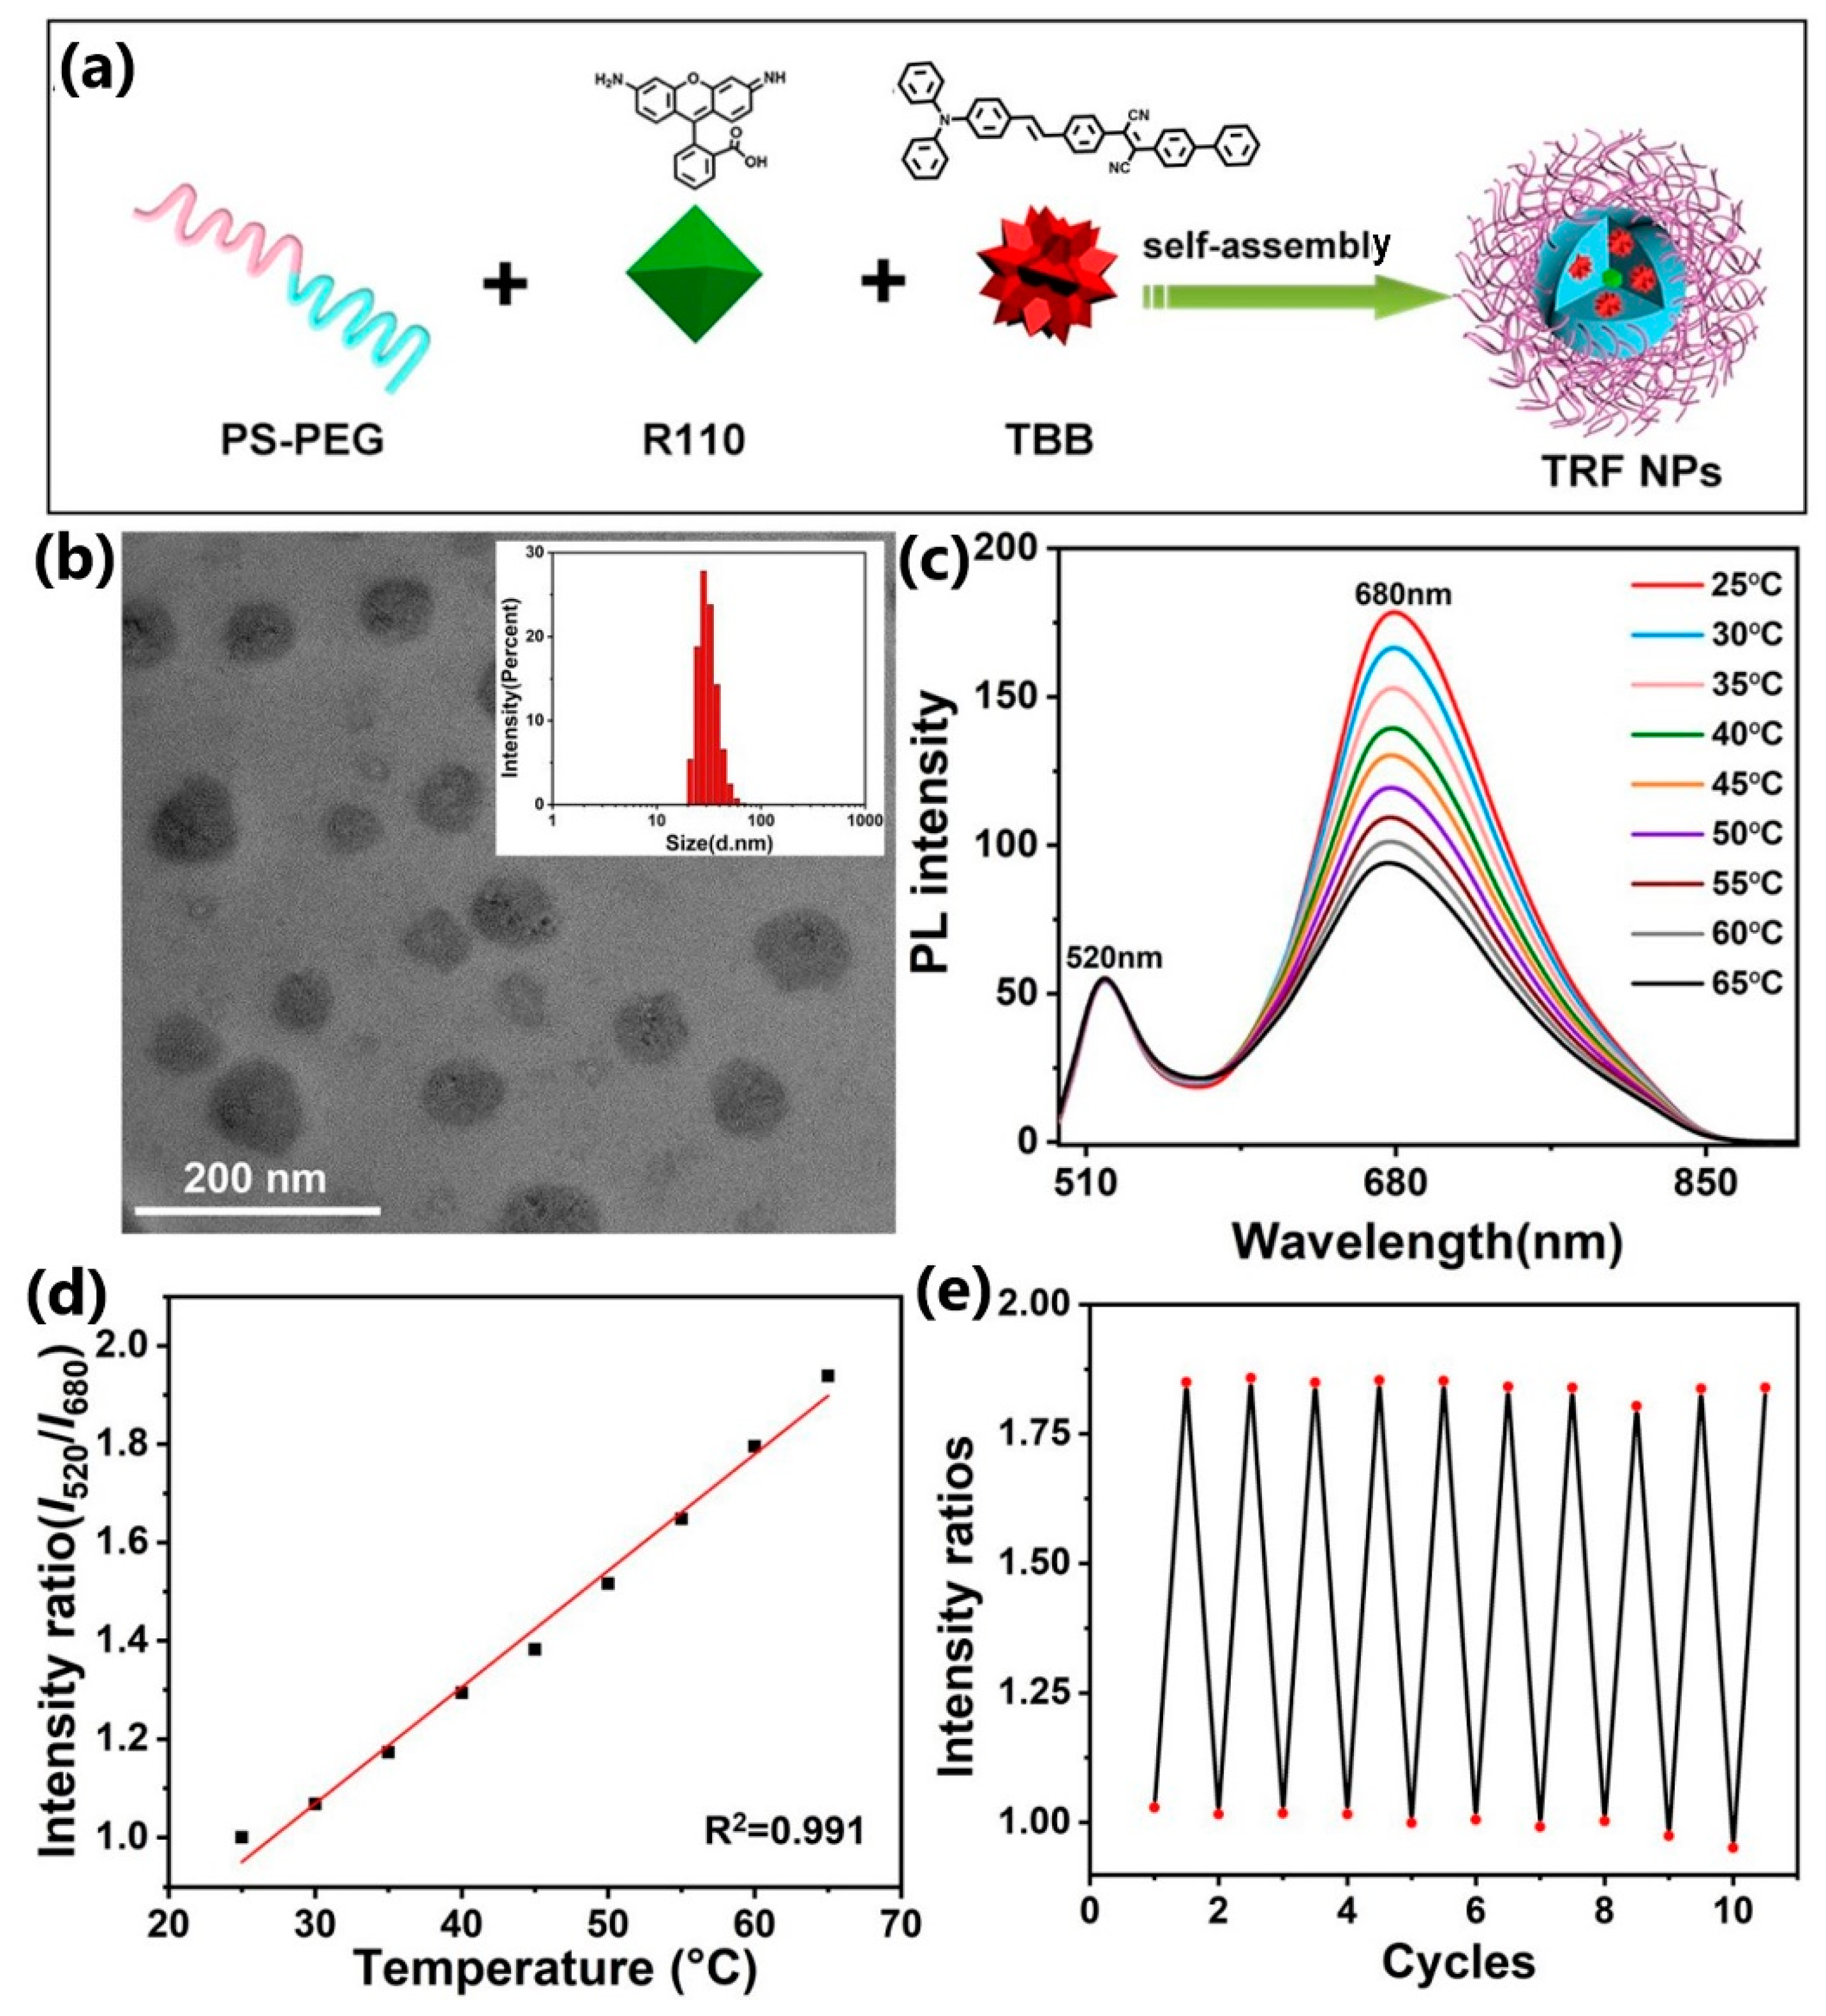
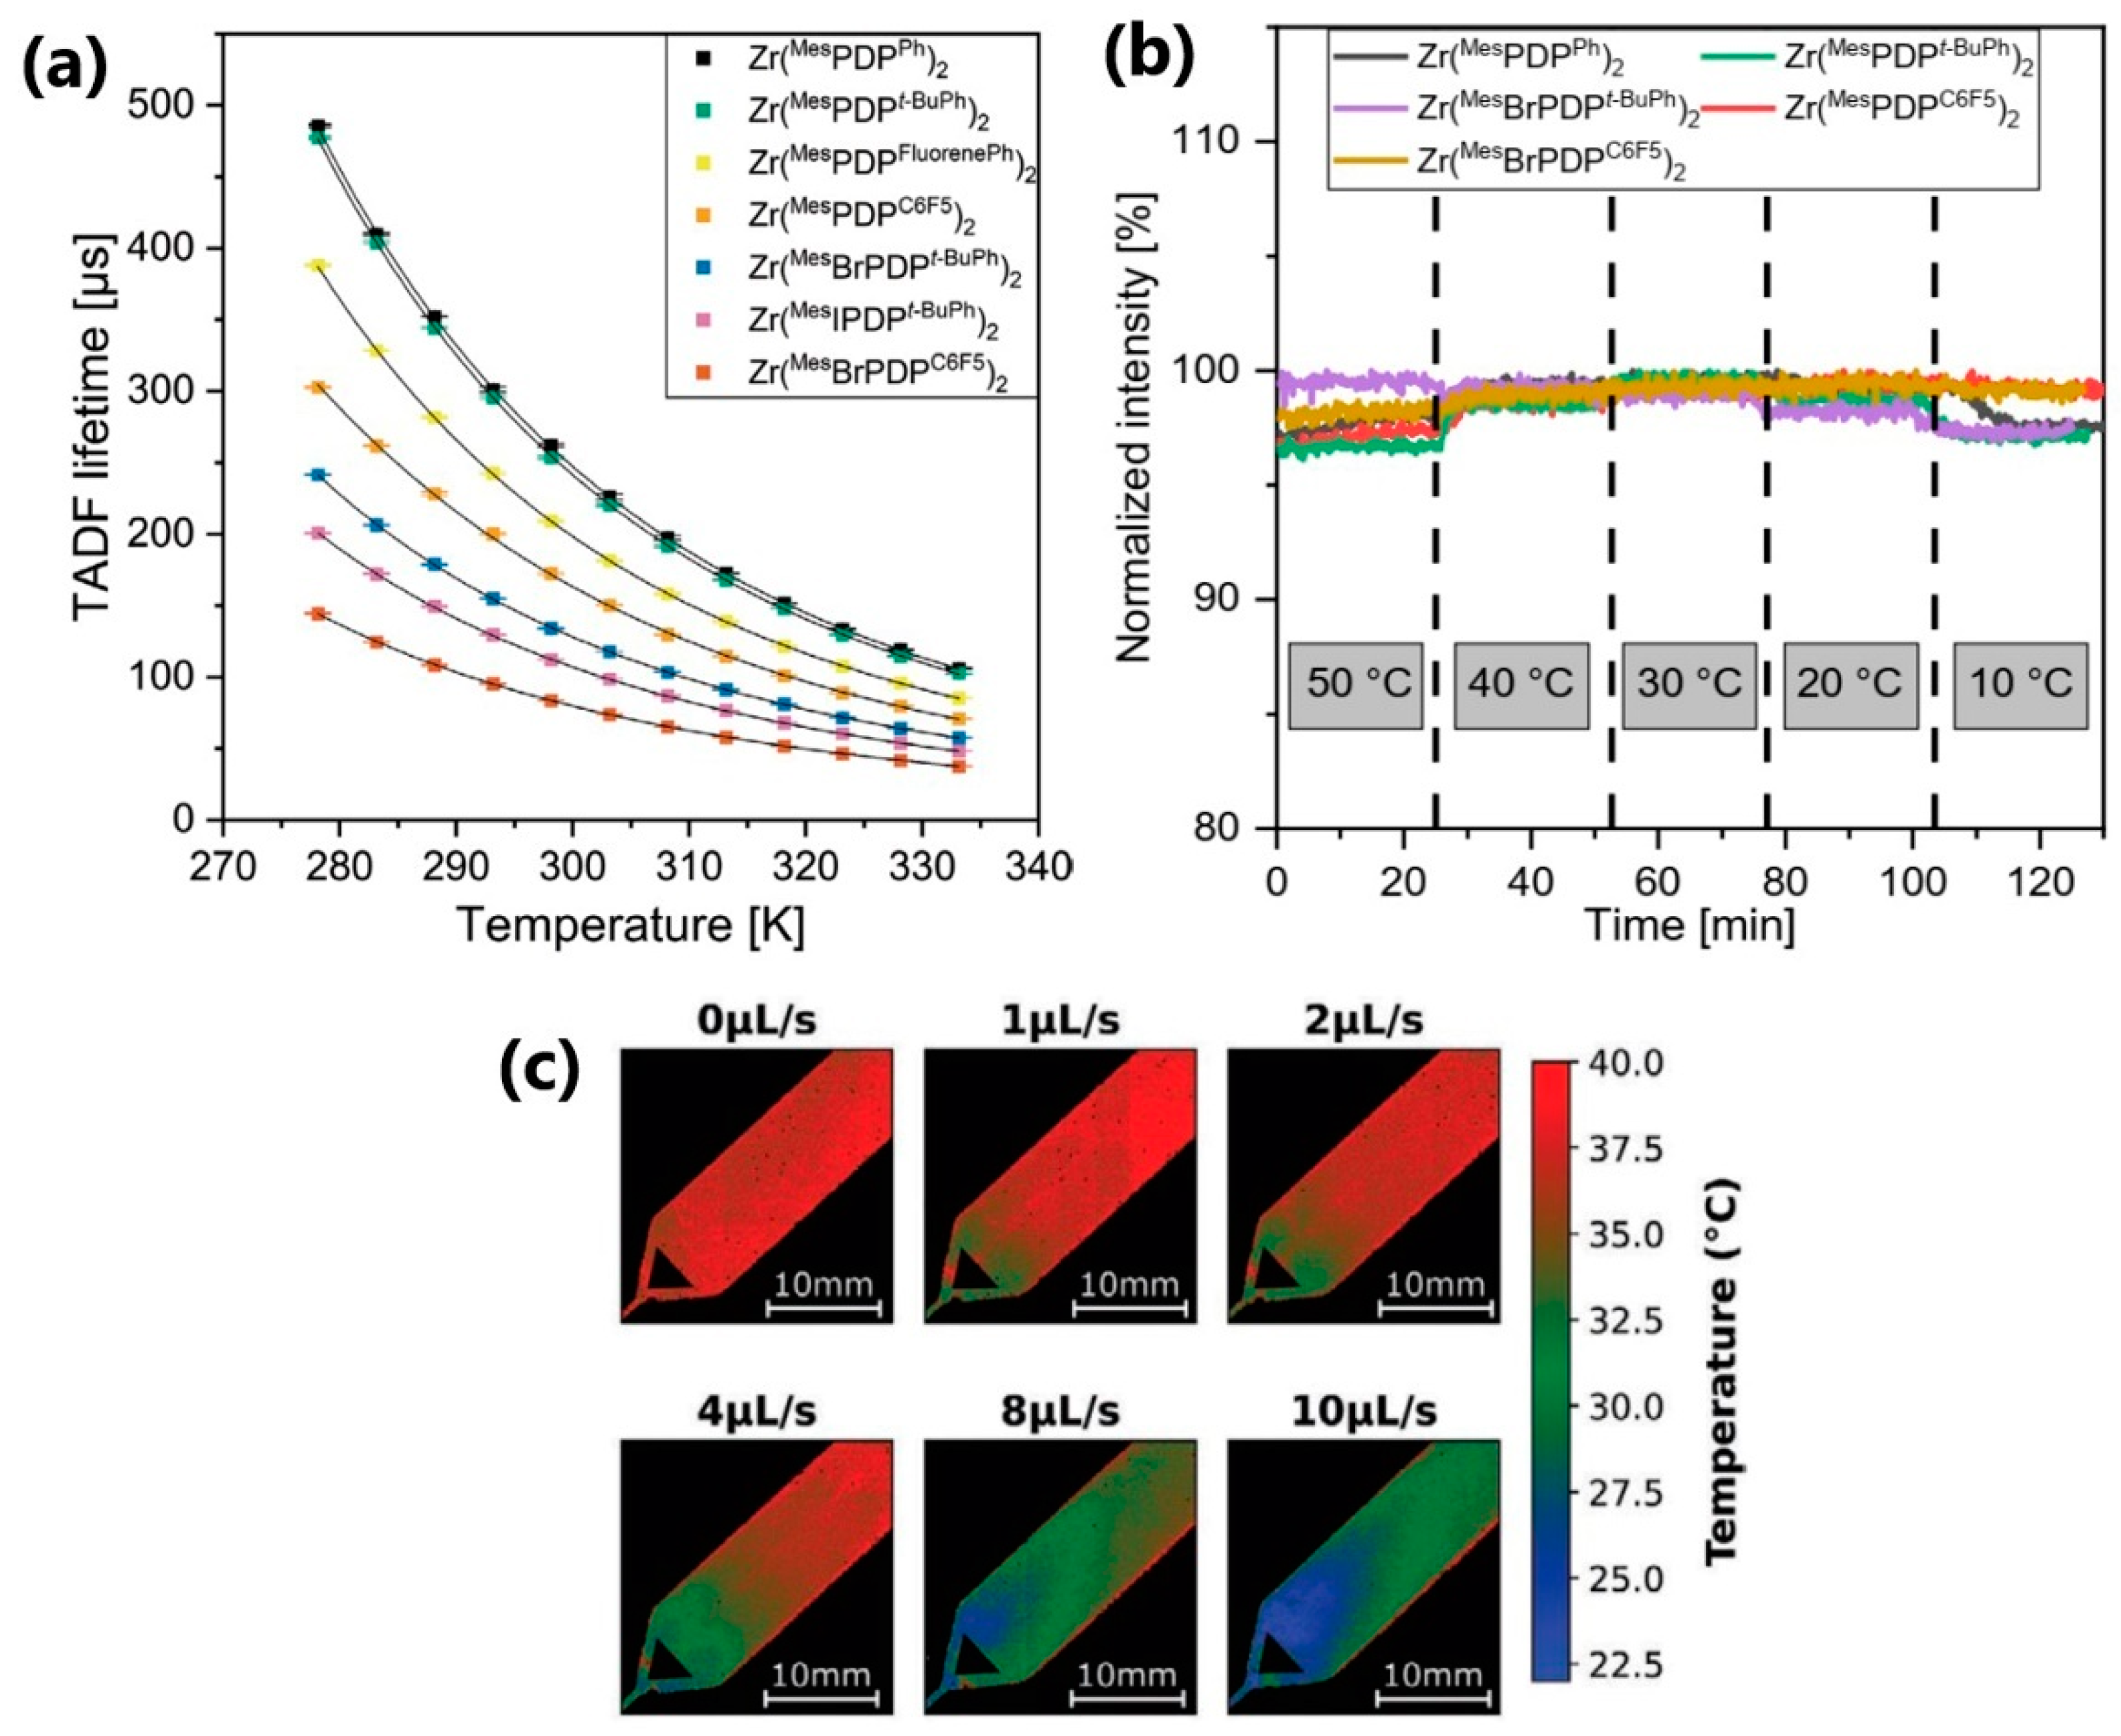
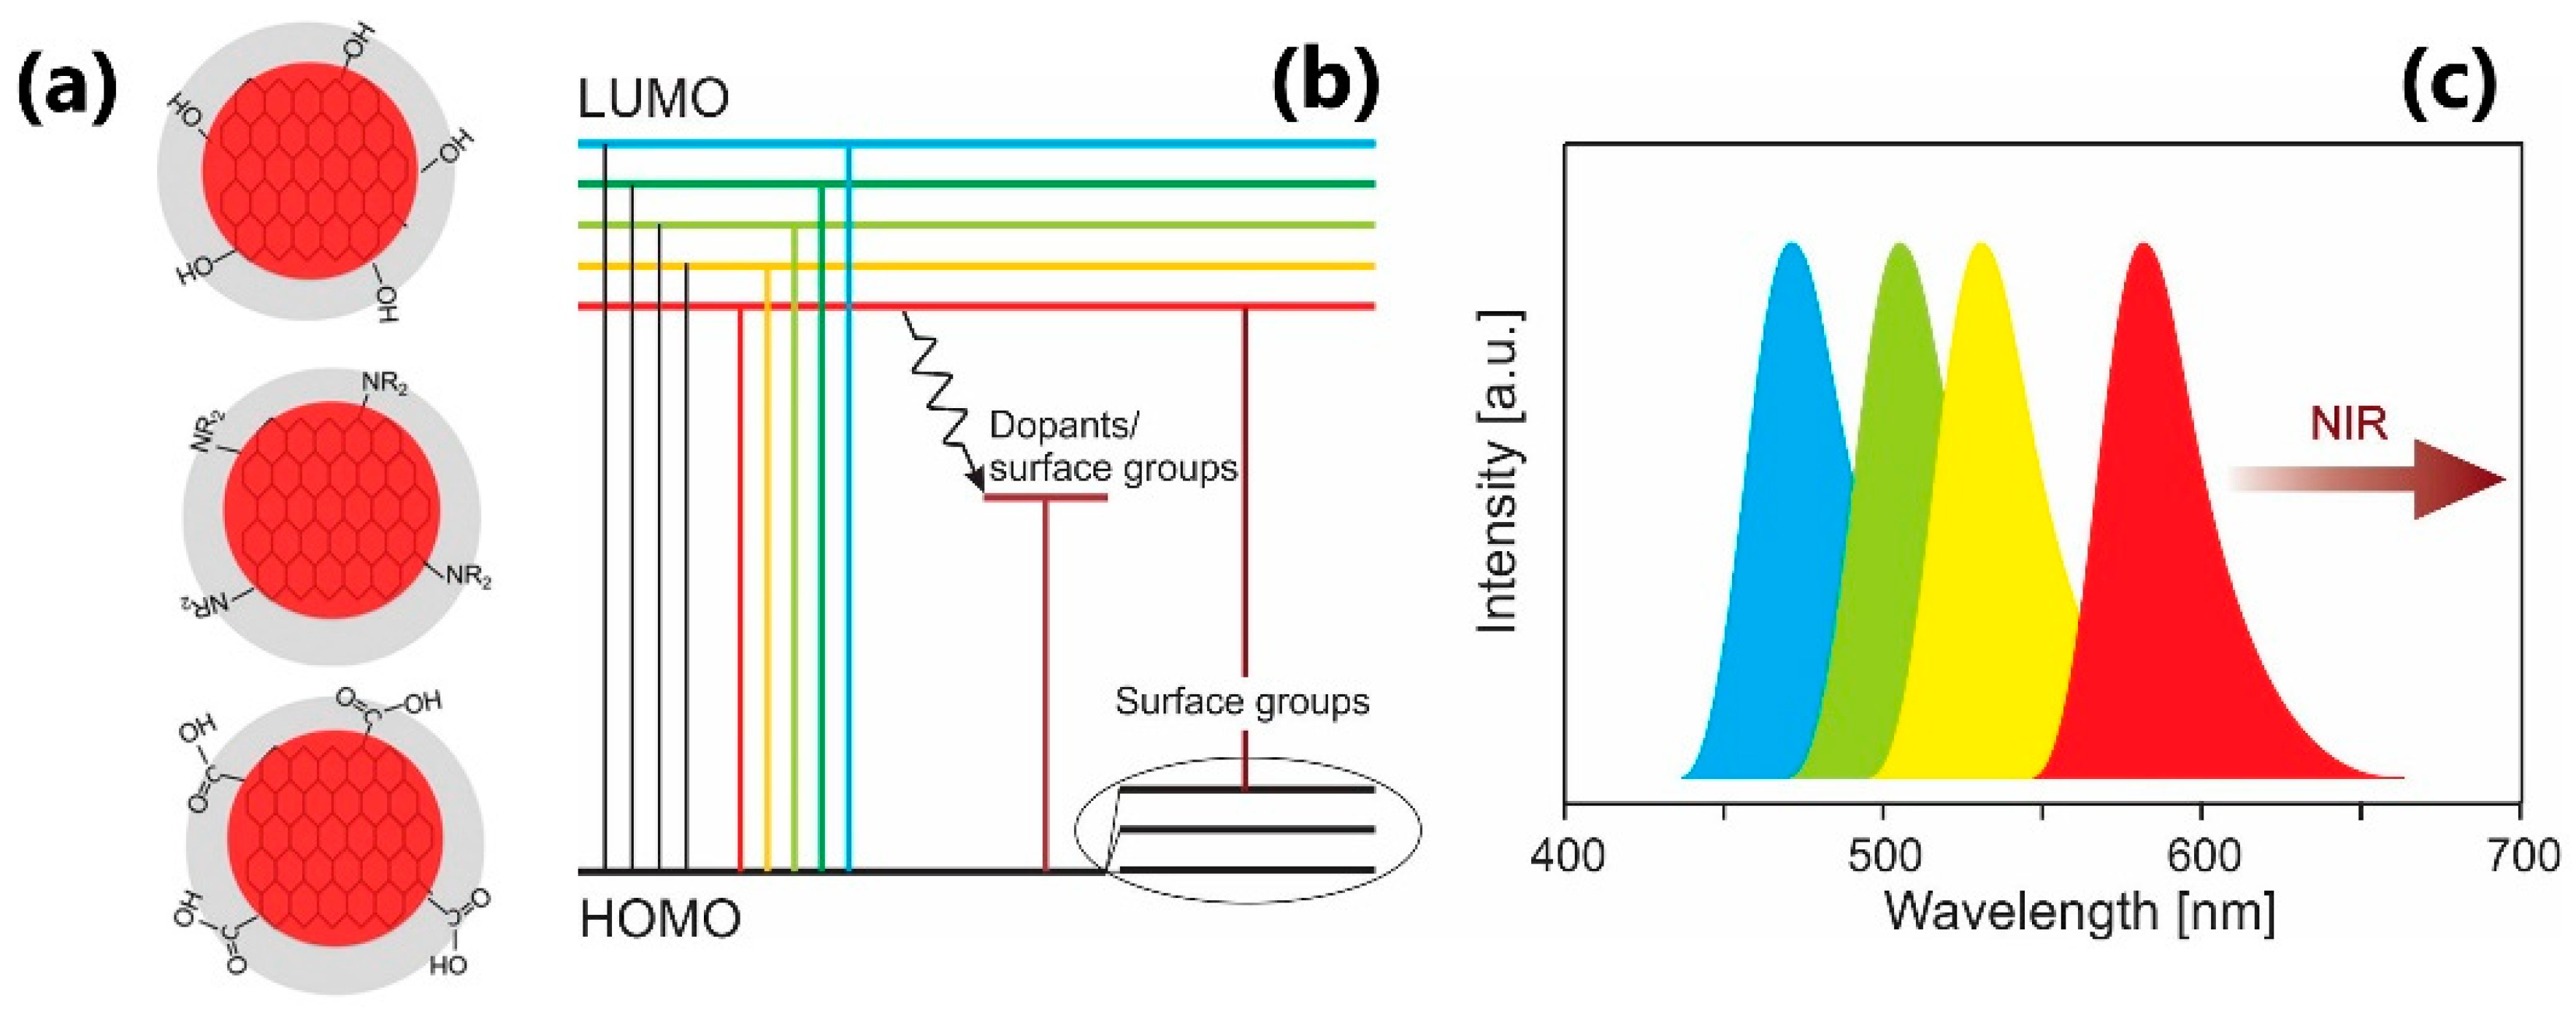
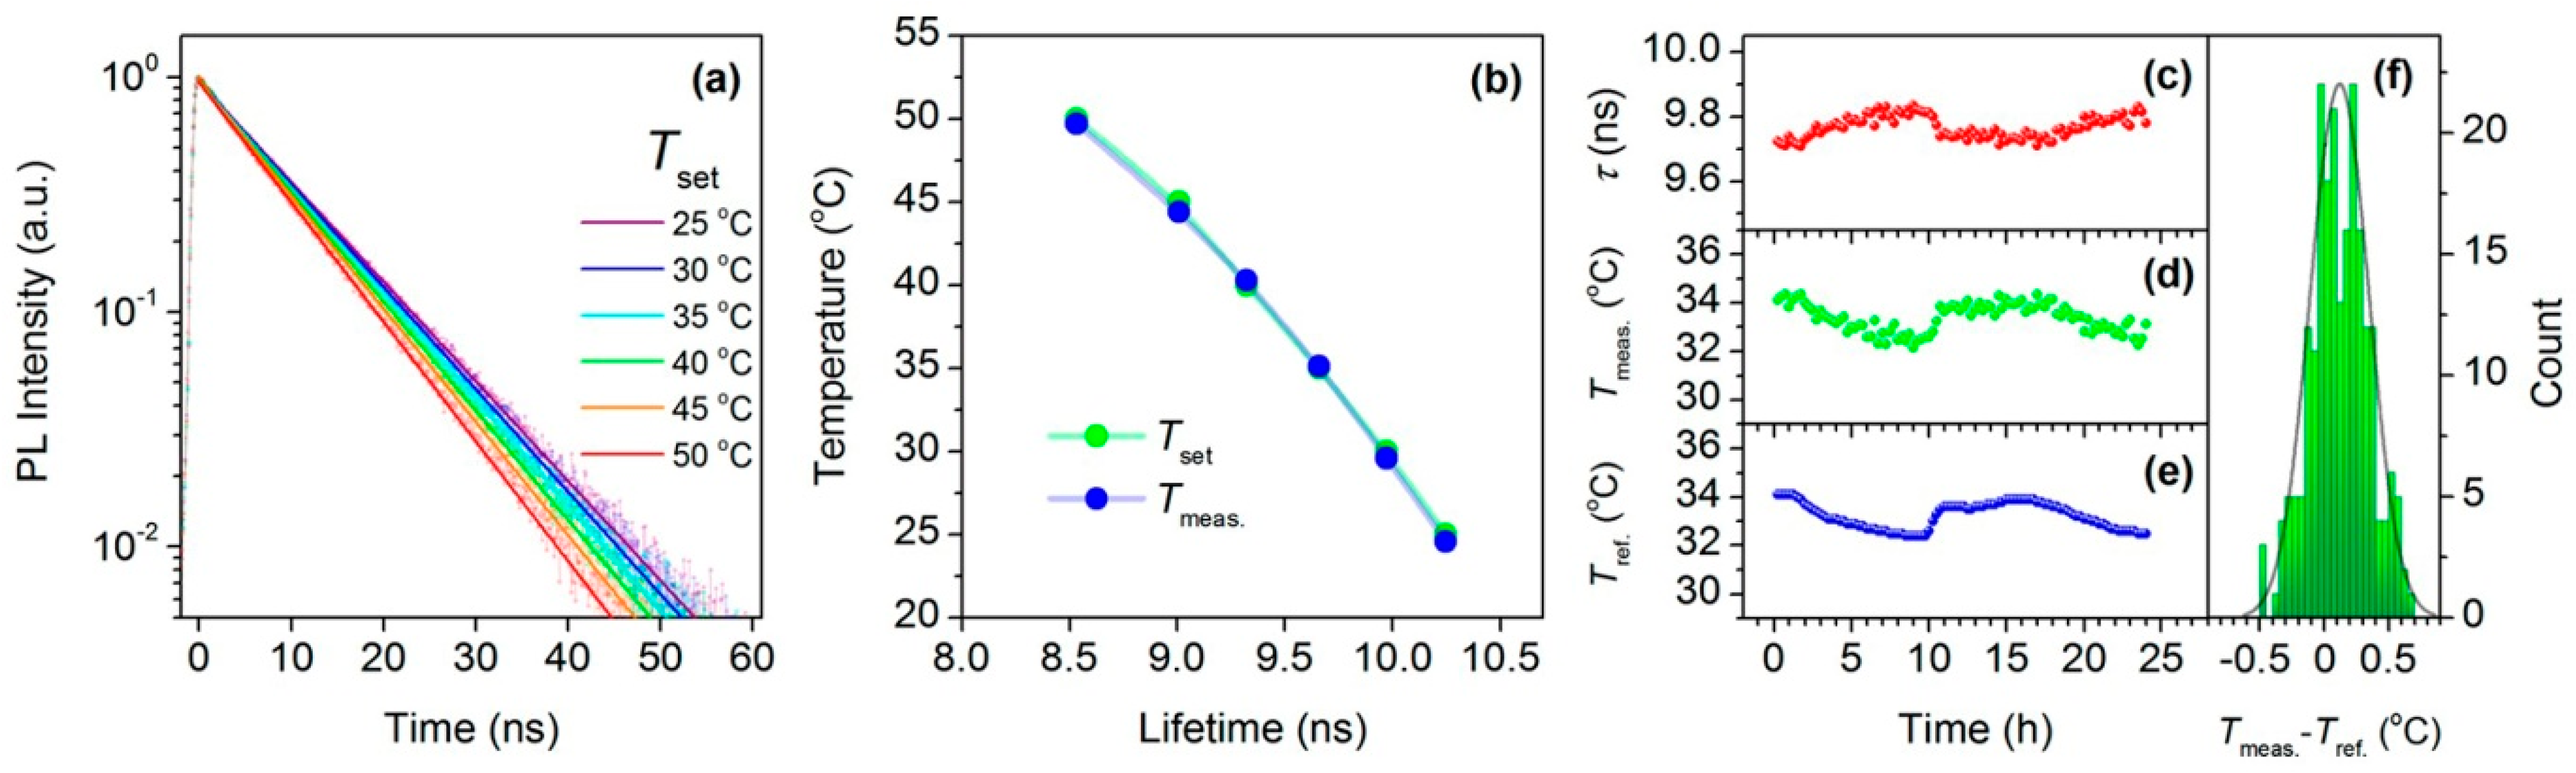
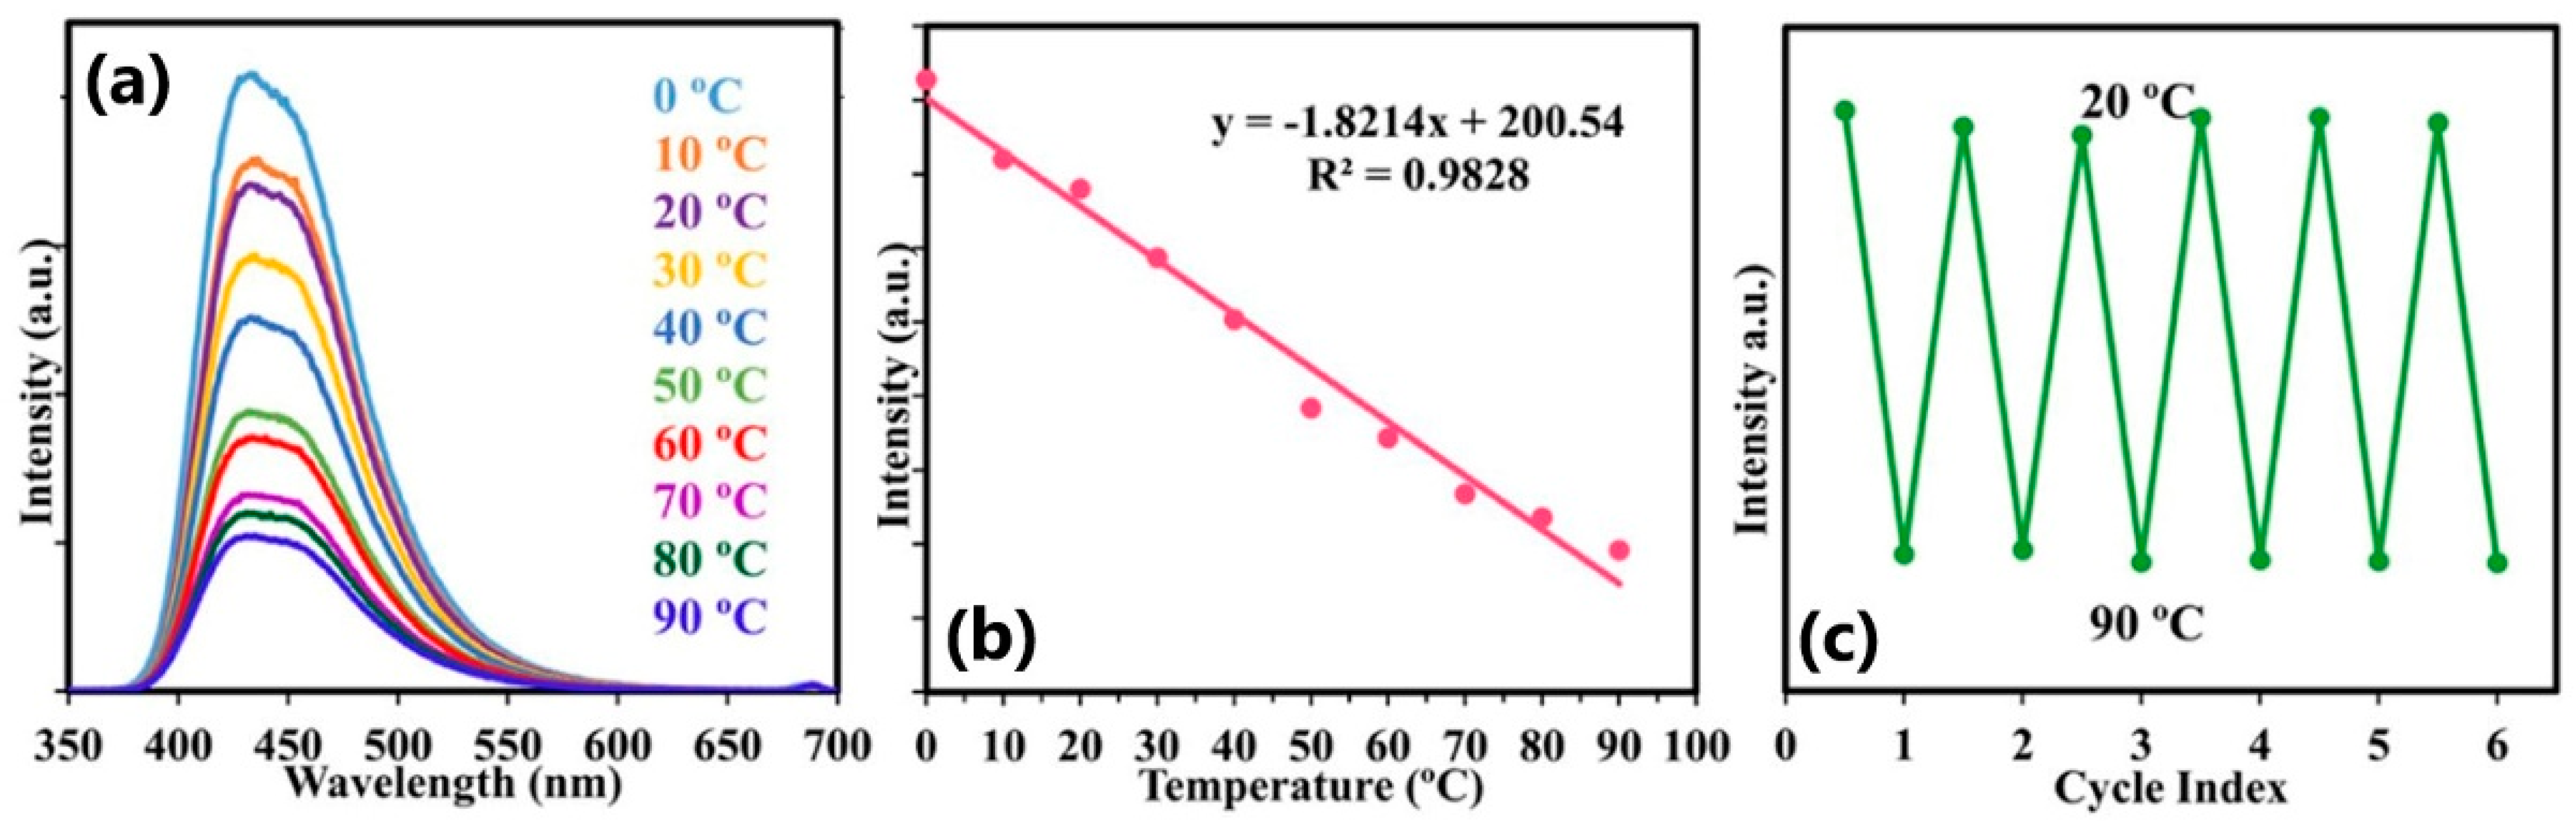
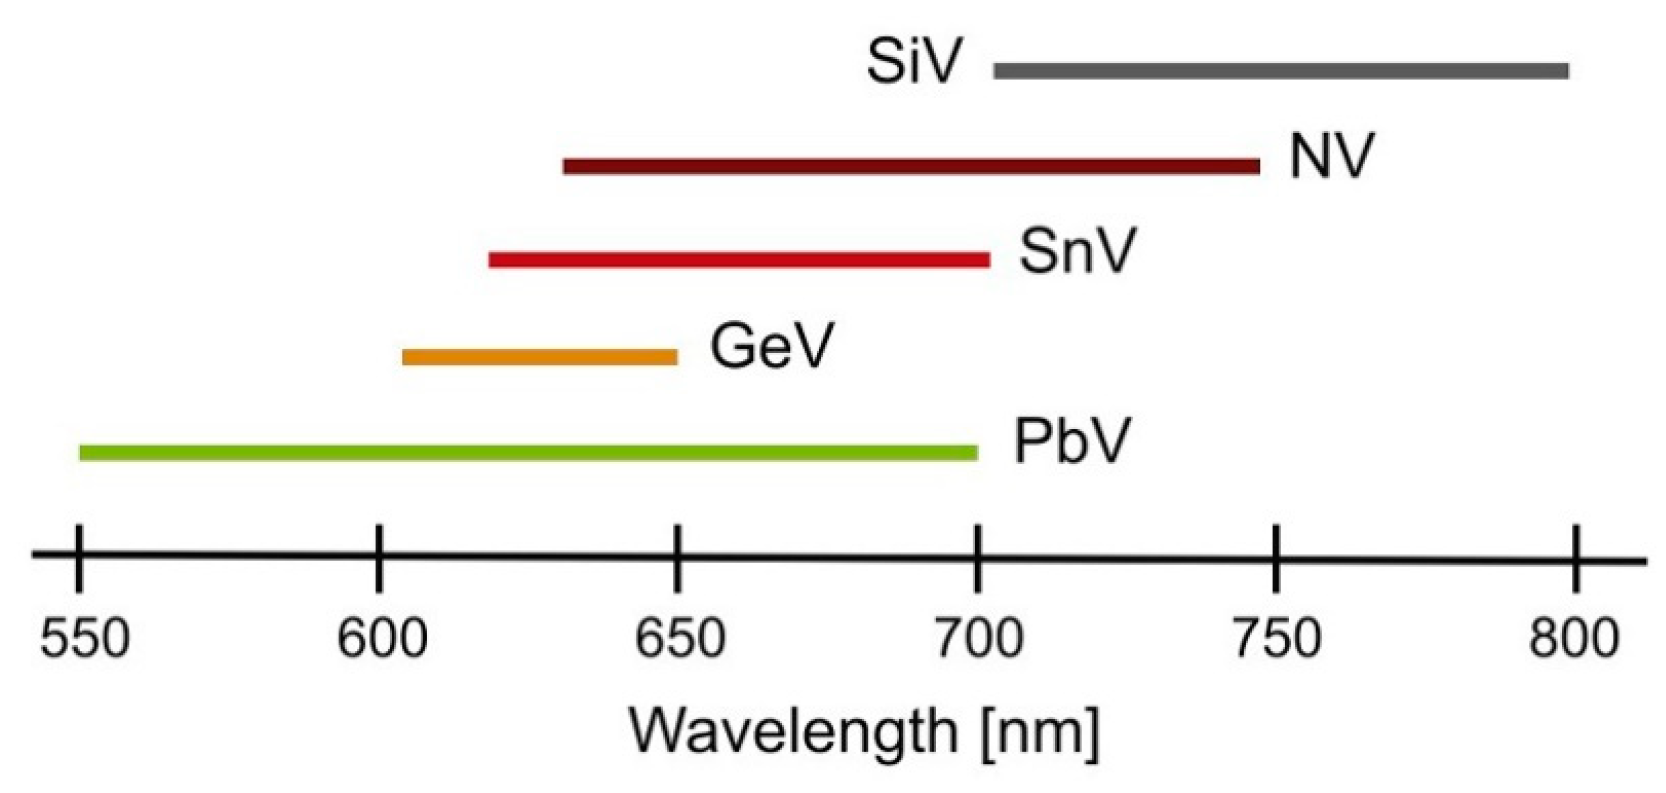
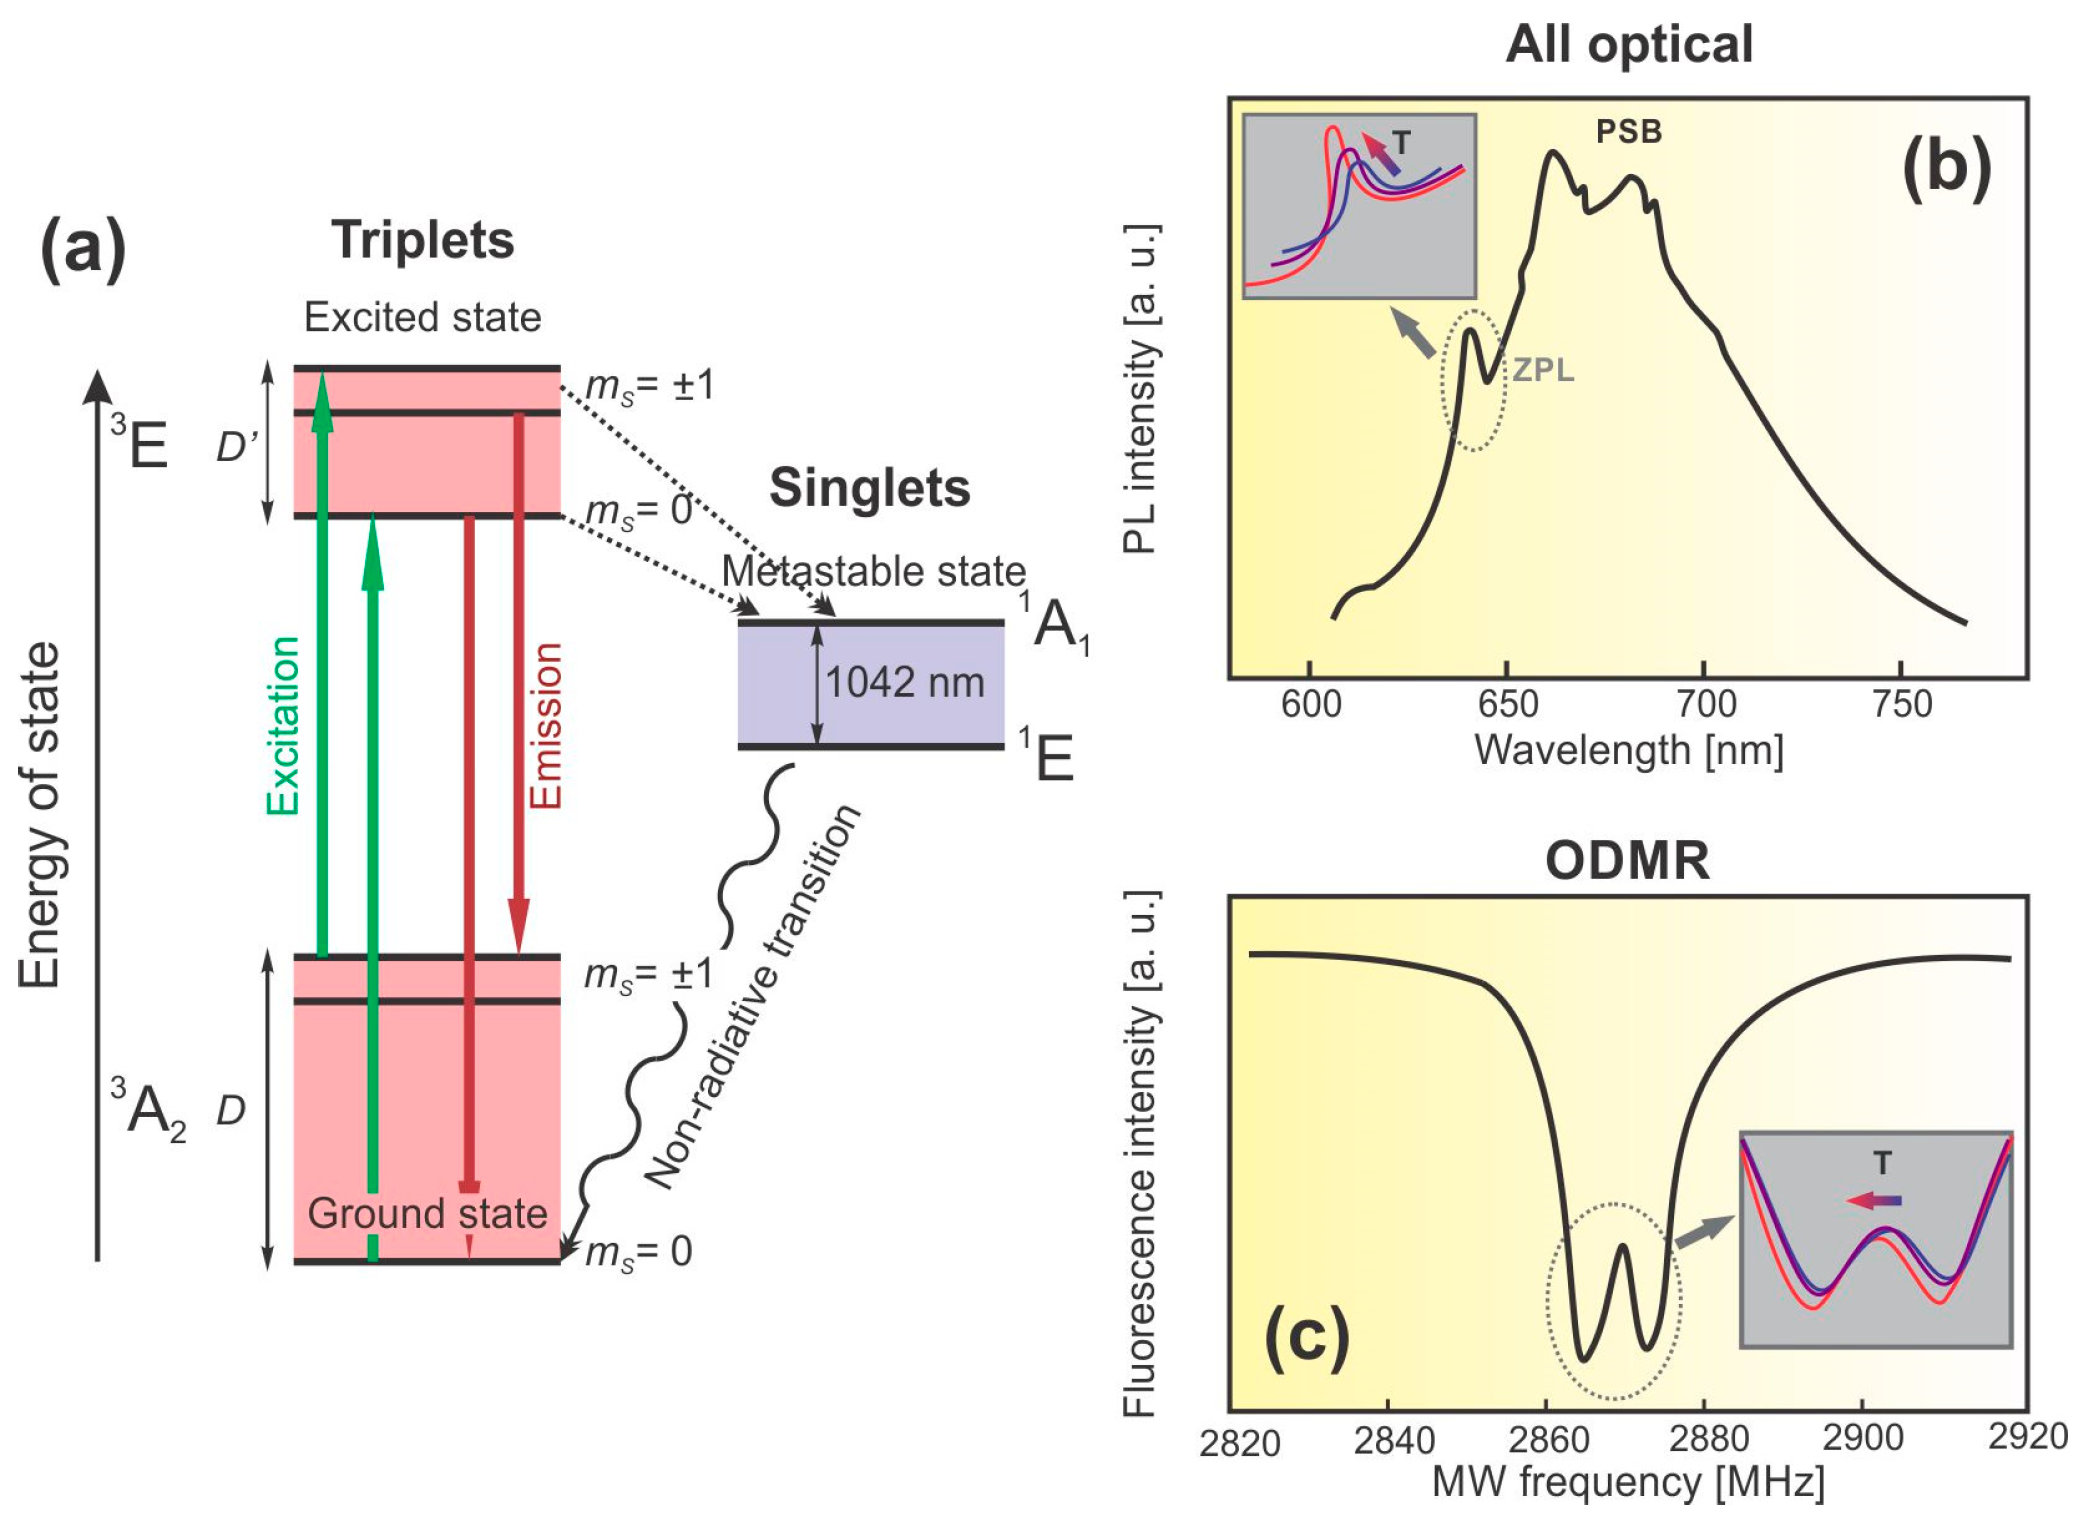
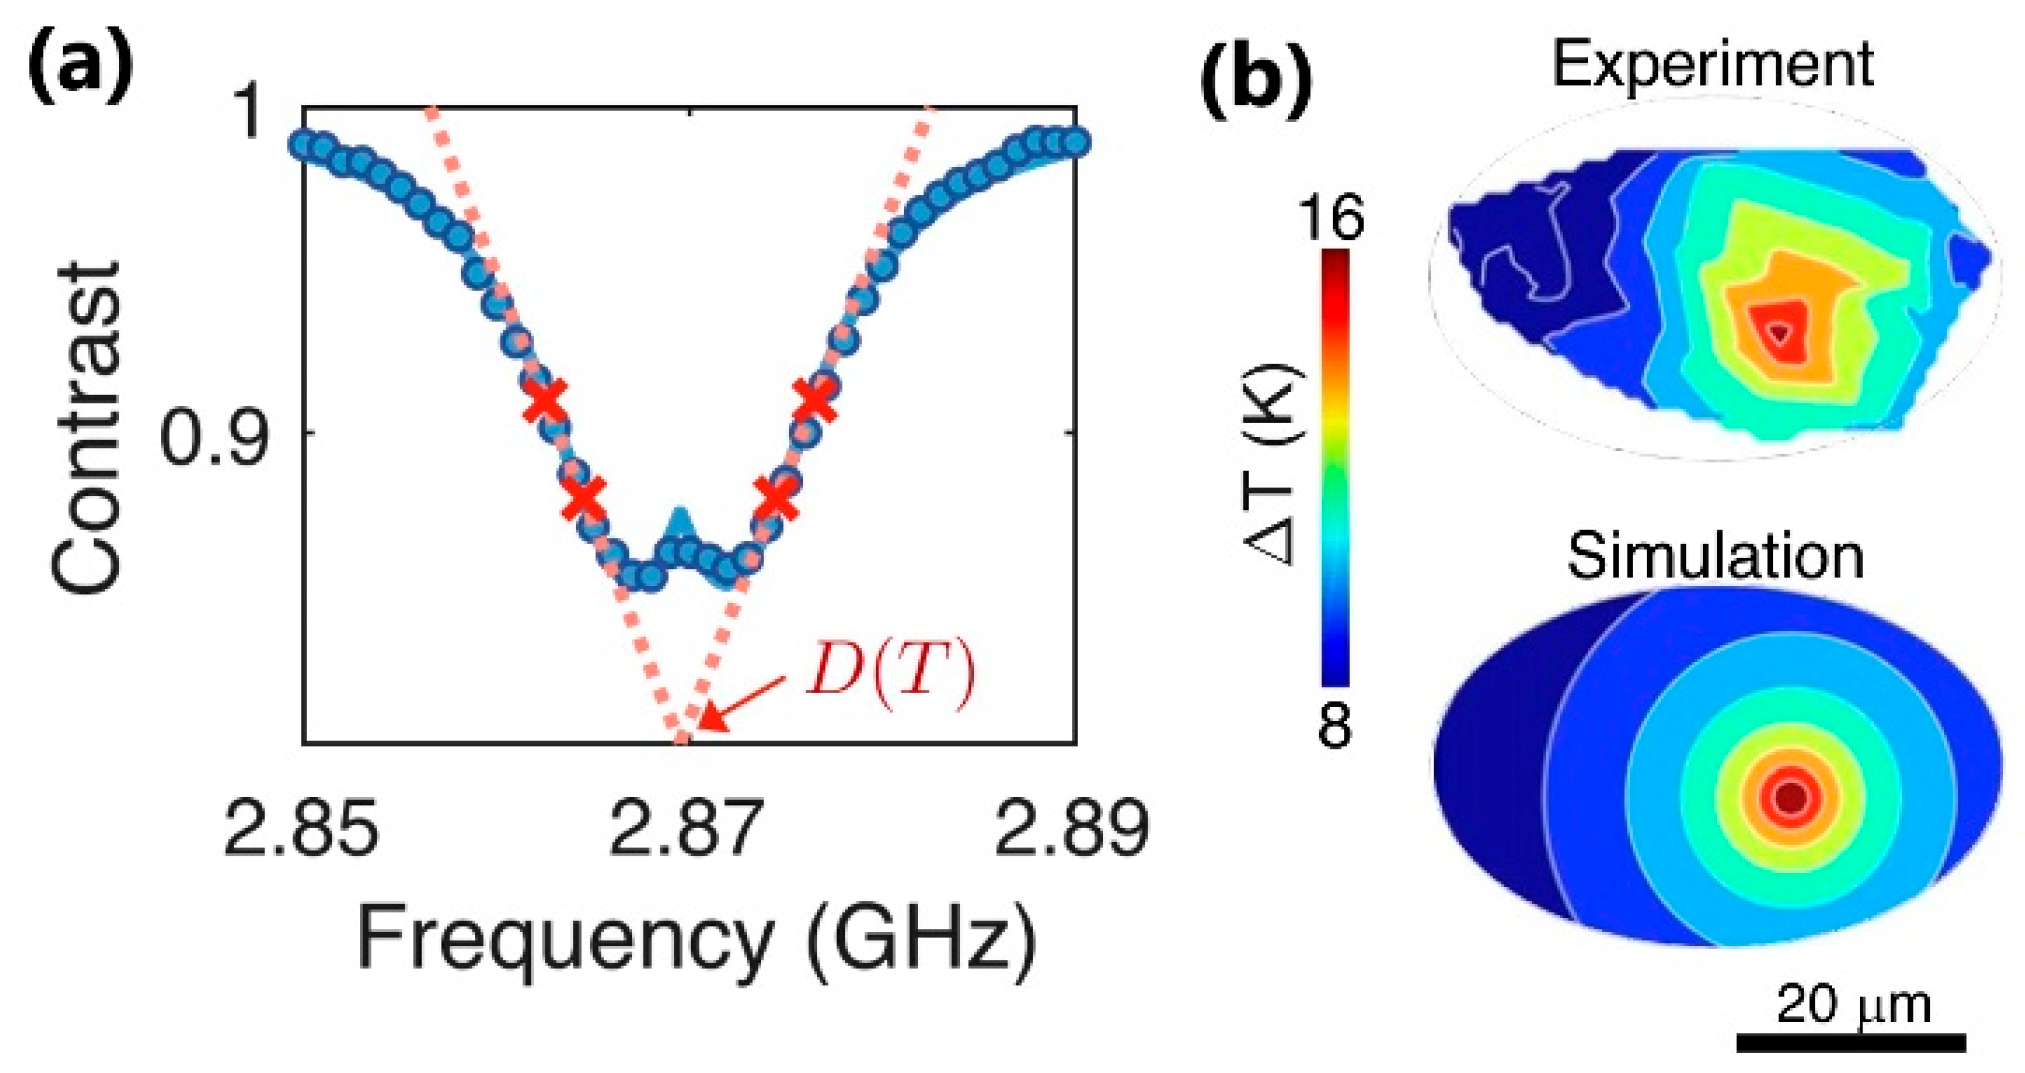
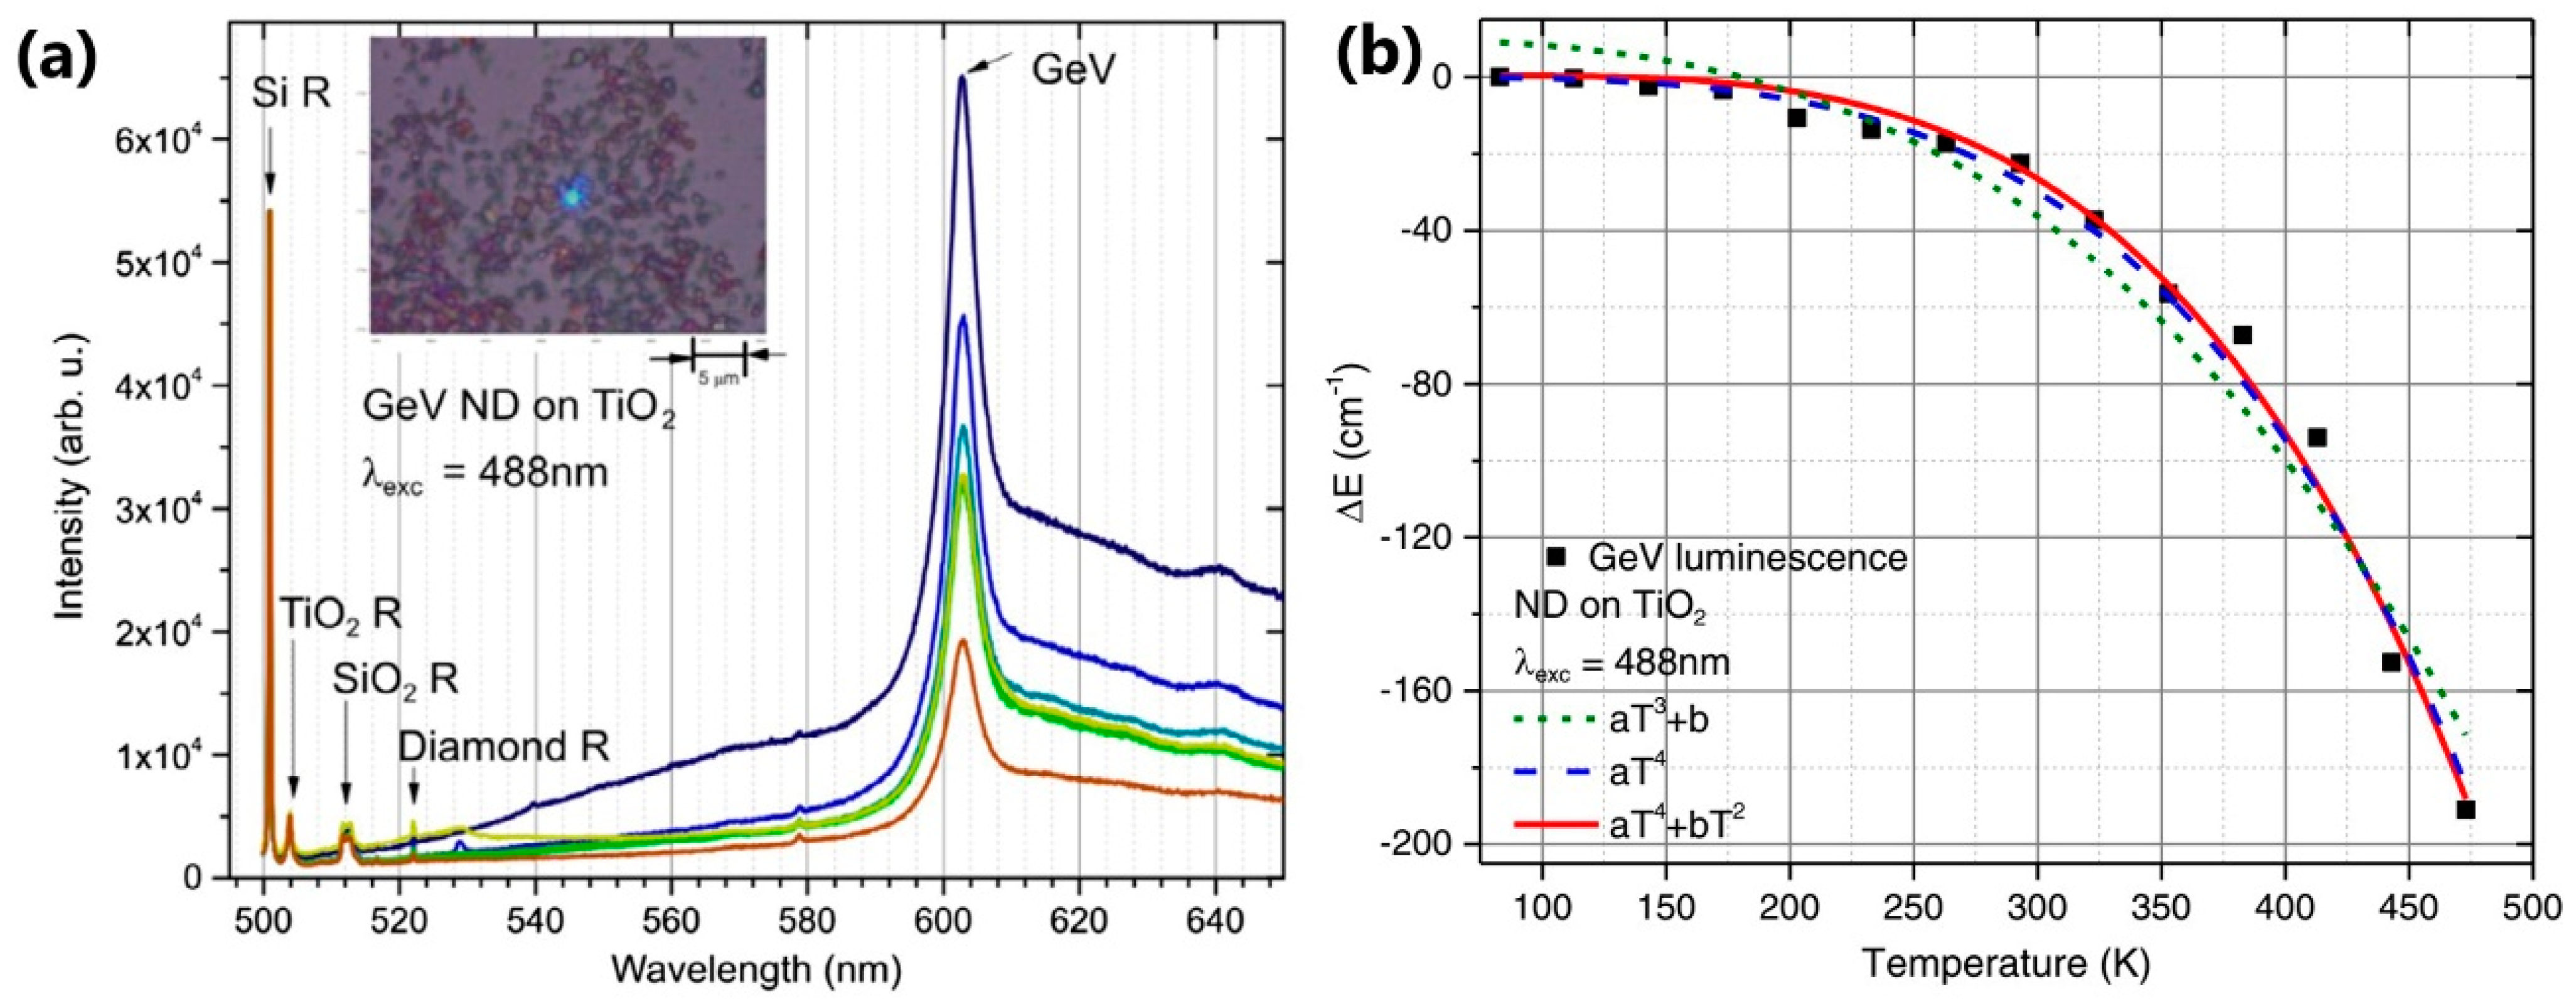
Table 1.
The overview of the most recent literature reports on downshifting lanthanide-based nanoparticles for luminescence temperature sensing.
Table 1.
The overview of the most recent literature reports on downshifting lanthanide-based nanoparticles for luminescence temperature sensing.
| NPs Size [nm] | Host | Lanthanide Ion | Measurement Method | Temperature Range [K] | Maximal Sensitivity [%K−1] | Application | Ref. |
|---|---|---|---|---|---|---|---|
| 50–100 | Gd2Zr2O7 | Eu3+ | Ratiometric | 300–700 | 0.92 | Temperature sensing | [22] |
| 15–20 | TiO2 | Eu3+ | Luminescence intensity | 293–313 | 2 | Sensing temperature within L929 fibroblast cells | [23] |
| 100–200 | LaVO4 | Eu3+ | Ratiometric, dual-excited single band, CT band position | 98–773 | 2.3 | Remote thermometry | [24] |
| 17 × 25 | NaYF4 | Eu3+ | Ratiometric, dual-excited single band, resonant to GSA and ESA | 123–473 | 4.11 | Remote thermometry | [25] |
| 12 × 25 | NaGdF4 | 16.9 | |||||
| 70–80 | YVO4 | Eu3+ | Ratiometric, dual-excited single band, CT band position | 299–466 | 2.23 | Remote thermometry | [26] |
| Dy3+ | 2.36 | ||||||
| Sm3+ | 3.09 | ||||||
| 10–30 | Gd2Ti2O7 | Dy3+ | Ratiometric, trap emission of host and Dy3+ emission band | 293–443 | 0.9 | Temperature sensing | [27] |
| 80–100 | YAlO3 | Dy3+ | Ratiometric, three-level | 300–850 | 0.86 | Temperature sensing at high temperatures | [28] |
| ~20 | La2Zr2O7 | Pr3+ | Ratiometric | 85–705 | 0.41 | Temperature sensing at high temperatures | [29] |
| ~100 | YAlO3 | Nd3+ | Ratiometric | 290–610 | 1.8 | Sub-tissue luminescence imaging in I- and II-biological window | [30] |
| 60–70 | YVO4 | Nd3+ | Ratiometric | 123–398 | 0.54 | Temperature sensing in I- and II-biological window | [31] |
| ~50 | CaSrSiO4 | Tb3+ | Ratiometric | 10–290 | 0.18 | Low-temperature sensor | [32] |
| ~50 | Y3Al5O12 | Er3+, Yb3+ | Ratiometric (Stark components of Er3+) | 80–600 | 1 | Temperature sensing in biological windows | [33] |
| Ratiometric (emissions of Yb3+ and Er3+) | 0.8 | ||||||
| Yb3+ bandshift and bandwidth change | 0.4 | ||||||
| Yb3+ 2F5/2 state kinetics | 0.86 |
Table 2.
The overview of the most recent literature reports on upconverting lanthanide-based nanoparticles for luminescence temperature sensing.
Table 2.
The overview of the most recent literature reports on upconverting lanthanide-based nanoparticles for luminescence temperature sensing.
| NPs Size [nm] | Host | Lanthanide Ion | Measurement Method | Temperature Range [K] | Maximal Sensitivity [%K−1] | Application | Ref. |
|---|---|---|---|---|---|---|---|
| ~50 | NaNbO3 | Tm3+ | Ratiometric (1390 nm excitation) | 295–363 | 0.80 | Subtissue thermal sensing with deep penetration | [42] |
| 70–150 | LaPO4 | Tm3+, Yb3+ | Ratiometric | 293–773 | ~3 | In situ pressure and temperature measurements | [43] |
| 20–50 | YPO4 | ~2.3 | |||||
| 15 | NaYbF4@CaF2@ NaYF4:Yb3+/Er3+@ CaF2 core/multishell | Tm3+, Er3+/Yb3+ | Ratiometric (Tm3+) | 10–295 | 3.06 | Ultralow temperature sensing of the contactless luminescence nanoprobe | [15] |
| Ratiometric (Er3+) | 0.82 | ||||||
| 10–50 | NaYF4@ NaGdF4:Nd core/shell | Er3+/Yb3+ | Ratiometric (Er3+) | 283–338 | 9.3 | Temperature monitoring in photothermal therapy | [44] |
| ~25 | NaYbF4/NaYF4:Tm3+-Yb3+ /NaYF4 core/shell/shell | Tm3+, Yb3+ | Ratiometric | 303–423 | 3.9 | Temperature detection in bio-systems | [45] |
| 50–150 | KLu(WO4)2 | Tm3+, Ho3+ | Ratiometric (Tm3+ and Ho3+ lines) | 300–333 | 2.84 | Estimation of thermal resistance | [46] |
| 40 × 70 | YVO4 | Tm3+, Er3+/Yb3+ | Ratiometric (Er3+ lines) | 267–673 | 7.4 | Temperature sensing | [47] |
| Tm3+, Ho3+, Er3+/Yb3+ | Ratiometric (Er3+ lines) | 2.4 | |||||
| 20–60 | Y2O3 | Nd3+/Yb3+ | Ratiometric (Nd3+ and Yb3+ lines) | 303–333 | 2.9 | Temperature sensing in different temperature ranges | [48] |
| 423–773 | 2.3 |
Table 3.
The overview of the most recent literature reports on transition metals-based nanoparticles for luminescence temperature sensing.
Table 3.
The overview of the most recent literature reports on transition metals-based nanoparticles for luminescence temperature sensing.
| NPs Size [nm] | Host | Transition Metal Ion (Co-Doping ion) | Measurement Method | Temperature Range [K] | Maximal Sensitivity [%K−1] | Application | Ref. |
|---|---|---|---|---|---|---|---|
| <100 | Y3Al5O12 | Ti4+/Ti3+ | Ratiometric, Ti4+/Ti3+ bands | 123–573 | 0.71 | Temperature sensing | [65] |
| Ti4+/Ln3+ (Nd3+, Eu3+, Dy3+) | Ratiometric, Ti4+/Nd3+ bands | 3.70 | |||||
| 30 ± 10 | Y3Al5O12 | Ti3+ (Eu3+) | Ratiometric, Eu3+/Ti4+ bands | 123–573 | 1.37 | Temperature sensing | [66] |
| Ratiometric, Eu3+/Ti3+ bands | ~0.90 | ||||||
| 50 ± 10 | Gd3Al5−xGaxO12 | Cr3+ (Nd3+) | Ratiometric, Cr3+/Nd3+ bands | 123–573 | 1.90 | Temperature sensing | [60] |
| Ratiometric, Cr3+/Cr3+ bands | 1.30 | ||||||
| 70 ± 10 | Y3Al5O12 | Cr3+ (Nd3+) | Ratiometric, (Cr3+/Cr3+ bands, Cr3+/Nd3+ bands) | 123–573 | 2.64 | Temperature sensing | [62] |
| Y3Ga5O12 | ~2 | ||||||
| Y3Al2Ga3O12 | 2.16 | ||||||
| 40–50 | ZnGa2O4/ZnGaGeO4/ | Cr3+ | Ratiometric, Cr3+/Cr3+ bands | 295–328 | ~1 | Bioimaging and biosensing | [67] |
| 10–30 | La2LuGa5O12 | Cr3+ (Nd3+) | Ratiometric, (Nd3+/Cr3+ bands) | 123–573 | 1.47 | Temperature sensing | [61] |
| 35–55 | LaScO3 | Cr3+ (Yb3+) | Lifetime | 123–573 | 1.70 | Temperature sensing | [68] |
| ~100 | Mg2SiO4 | Cr3+ | Emission intensity | 10–350 | 0.7 | Temperature sensing | [69] |
| Lifetime | 0.8 | ||||||
| Emission band position | 0.85 | ||||||
| 22–47.6 | Y3Al5O12 | V3+,V5+ (Eu3+, Dy3+, Nd3+) | Ratiometric, (V3+/V5+ bands) | 123–573 | 4–6 | Temperature sensing | [61] |
| Ratiometric, (V3+/Eu3+ bands) | 0.4 | ||||||
| Ratiometric, (V3+/Dy3+ bands) | 3.5 | ||||||
| Ratiometric, (V3+/Nd3+ bands) | 0.91 | ||||||
| <100 | Y3Al5−xGaxO12 | V3+ | Emission intensity | 123–573 | 1.08 | Temperature sensing | [70] |
| V4+ | 1.34 | ||||||
| V5+ | 2 | ||||||
| V5+/V4+ | Ratiometric (V5+/V4+ bands) | 2.64 | |||||
| <100 | GAG, GGG, LuAG, YAP, YAG | Mn3+ Mn4+ | Lifetime (decay time) | 120–570 | 2.08 (GAG) | Temperature sensing | [71] |
| Lifetime (risetime) | 3.58 (GGG) | ||||||
| 20–200 | Sr4Al14O25 | Mn4+ (Tb3+) | Ratiometric, (Mn4+/Tb3+ bands) | 123–543 | 2.8 | Thermal imaging | [72] |
| <100 | Ba3(VO4)2 | Mn5+ (Nd3+) | Ratiometric, (Nd3+/Mn5+ bands) | 83–683 | 0.94 | Deep-tissue thermal imaging | [73] |
| 10–50 | SrTiO3 | Ni2+ (Er3+) | Ratiometric, (Ni2+ bands) | 123–483 | 0.25 | Temperature sensing in the second biological window | [74] |
| Ratiometric (Er3+/Ni2+ bands) | 0.80 |
Table 4.
The overview of the most recent literature reports on semiconductor quantum dots for luminescence temperature sensing.
Table 4.
The overview of the most recent literature reports on semiconductor quantum dots for luminescence temperature sensing.
| QDs Size [nm] | Type of QDs | Measurement Method | Temperature Range [K] | Maximal Sensitivity [%K−1] | Application | Ref. |
|---|---|---|---|---|---|---|
| 5–6 | CdSe/CdS/ZnS dispersed in squalane | 295–393 | NA | Temperature measurement in situ of thin films of liquids in dynamic conditions | [88] | |
| ~7.5 | CdSe/ZnS immobilised in silicone matrix | 303–333 | 0.93 | In situ thermal analysis and calibration within the microfluidics | [89] | |
| ~7.5 | CsPbCl3:Mn2+ | ) | 298–353 | 7.38 | Highly sensitive temperature measurement of nanoprobes | [90] |
| FWHM method (Exciton emission) | 2.13 | |||||
| ~6 | CdHgTe in NaCl matrix | 80–340 | 0.02 | NIR LED, NIR noncontact thermometry | [91] | |
| Lifetime | 1.4 | |||||
| ~4 | PbS/CdS/ZnS | Intensity | 283–333 | 1 | Minimally invasive photothermal tumor treatments with real-time intratumoral thermal feedback | [92] |
| NA | CdSe/CdSxSe1−x | Ratiometric (FWHM and the maximum emission intensity) | 306–343 | 6.9 | Supersensitive luminescent nanothermometers with low toxicity | [93] |
Table 5.
The overview of the most recent literature reports on polymer nanoparticles for luminescence temperature sensing.
Table 5.
The overview of the most recent literature reports on polymer nanoparticles for luminescence temperature sensing.
| PNPs Size [nm] | Type of PNPs | Measurement Method | Temperature Range [K] | Maximal Sensitivity [% K−1] | Application | Ref. |
|---|---|---|---|---|---|---|
| 20–50 | NIR775 dye in MEH-PPV polymer | Lifetime of persistent luminescence | 277–308 | NA | Optical imaging in living mice | [98] |
| 90 | Rhodamine dye in F127-melamine-formaldehyde polymer | Ratiometric (R110 emission/RB emission) | 253–383 | 7.6 | Cellular temperature monitoring in HeLa cells during microwave exposure | [99] |
| NA | Ru(II) polypyridyl complexes embedded in poly(cyanoacrylate) | ) | 273–323 | 3.3 | Production of temperature-sensitive optical fiber tips for temperature and O2 monitoring | [100] |
| ~20 | Eu3+,Sm3+-btfa-based polymeric micelles | Ratiometric, dual emission (Sm emission/Eu emission) | 300–328 | 1.5 | Intracellular temperature mapping of breast metastatic adenocarcinoma cells | [101] |
| Eu3+,Sm3+-DNPD-based polymeric micelles | 1.7 | |||||
| NA (water solutions) | Tetrasulfonatophenylporphyrinate (tetra sodium salt) TSPH2 | Ratiometric (peak-to-valley ratio) | 293–318 | 1.04 | Molecular thermometers for phototherapy to avoid heat-induced adverse effects | [102] |
| Mono(4-pyridyl)-triphenylporphyrinato)phosphorus(V) bromide MPyPP(OH)2 | Lifetime-based | 0.24 | ||||
| 8 | Poly(N-vinylcaprolactam) | Aggregation-induced emission after heating | 293–313 | NA | Intracellular temperature imaging in MCF-7 cells | [103] |
| NA (in solutions) | Green Fluorescent Protein | Peak Fractions analysis | 293–333 | 2.5 | Determination of chemically induced heat production in the HeLa cells | [104] |
| NA | Carbazole-substituted dicyanobenzenes, anthraquinone based dyes in RL100 nanoparticles | Lifetime-based | 278–323 | 2.8 | Temperature sensing and imaging | [105] |
| 150 (178) | Nanocapsules consisting of PdPc(OBu)8, PCU, perylene, nujol (medium), albumin (stabilizer) | Lifetime-based | 293–318 | ~7.5 | Detection of the temperature changes in vivo in mice | [106] |
Table 6.
The overview of the most recent literature reports on carbon dots for luminescence temperature sensing.
Table 6.
The overview of the most recent literature reports on carbon dots for luminescence temperature sensing.
| CDs Size [nm] | Type of CDs | Measurement Method | Temperature Range [K] | Maximal Sensitivity [% K−1] | Application | Ref. |
|---|---|---|---|---|---|---|
| ~4 | CD | (intensity rises with temperature) | 283–353 | 1.07 | Temperature measurement in living MC3T3-E1 cells | [123] |
| ~2.3 | N, S—CD | 298–348 | NA | Temperature sensor | [124] | |
| ~27 | CD | Ratiometric, dual emission | 288–358 | 0.93 | Cellular temperature imaging of MC3T3-EI cells | [125] |
| ~1.5 | CD | Ratiometric, dual emission | 278–358 | 1.48 | Temperature sensor | [126] |
| ~2.5 | N, S—CD | 278–348 | 0.41 | Temperature sensor | [120] | |
| ~7.5 | CD | Ratiometric, dual emission | 278–333 | 3.71 | In vitro thermal sensing using HeLa cells | [127] |
| ~3 | CD | Ratiometric (intensity rises with temperature) | 277–353 | 1.2 | Intracellular temperature sensing in different cells | [128] |
| ~3.6 | N, S—CD | Ratiometric | 283–343 | 0.64 | Temperature sensor | [129] |
| ~5.6 | MnO—CD | Ratiometric | 283–333 | NA | In vitro thermal sensing using HepG2 cells | [130] |
| <5 | CD | Ratiometric, dual emission | 305–315 | 8.2 | Intracellular temperature measurement in HEK293T cells | [115] |
Table 7.
The overview of the most recent literature reports on nanodiamonds for luminescence temperature sensing.
Table 7.
The overview of the most recent literature reports on nanodiamonds for luminescence temperature sensing.
| NDs Size [nm] | Type of luminescent Center | Measurement Method | Temperature Range [K] | Maximal Sensitivity | Application | Ref. |
|---|---|---|---|---|---|---|
| 100 | NV | All-optical | 85–300 | ~15 K/Hz−1/2 | Low-temperature thermometry | [149] |
| 100 | NV | ODMR | RT | ~2 K/Hz−1/2 | Camera-based thermometry of living cells | [150] |
| 100 | NV | All-optical | RT | ~0.2 K/Hz−1/2 | Nanothermometry in the biological transparency window | [151] |
| NiV | ODMR | ~0.9 K/Hz−1/2 | ||||
| 40 | NV | ODMR (frequency-jump modulation) | RT ∆T~20 K | NA | Thermal probing and heat diffusion measurements in the microelectronic circuit | [152] |
| 100 | NV | All-optical | 301–348 | 2 K/Hz−1/2 | Hyperthermia research in human embryonic kidney cells | [153] |
| 168 | NV | ODMR | 303.4–317.3 | 1.4 K/Hz−1/2 | Temperature measurement in living animals which may allow quantification of their biological activities | [154] |
| 150 | NV | ODMR | 302.1–313.9 | 2.2 K/Hz−1/2 | Measurement of the intracellular thermal conductivities of HeLa and MCF-7 cells | [155] |
| 70 | SiV | All-optical | RT | 0.037 K−1 | Temperature monitoring and mapping within intracellular regions | [144] |
| 200 | SiV | All-optical | RT ∆T~20 K | ~0.5 K/Hz−1/2 | Calibration-free thermometry for sensing and control of complex nanoscale systems | [156] |
| 300 | SiV | All-optical | 200–400 | ~0.5 K/Hz−1/2 | Practical nanoscale thermometry and sensing | [157] |
Disclaimer/Publisher’s Note: The statements, opinions and data contained in all publications are solely those of the individual author(s) and contributor(s) and not of MDPI and/or the editor(s). MDPI and/or the editor(s) disclaim responsibility for any injury to people or property resulting from any ideas, methods, instructions or products referred to in the content. |
© 2023 by the authors. Licensee MDPI, Basel, Switzerland. This article is an open access article distributed under the terms and conditions of the Creative Commons Attribution (CC BY) license (https://creativecommons.org/licenses/by/4.0/).
Share and Cite
MDPI and ACS Style
Đačanin Far, L.; Dramićanin, M.D. Luminescence Thermometry with Nanoparticles: A Review. Nanomaterials 2023, 13, 2904. https://doi.org/10.3390/nano13212904
AMA Style
Đačanin Far L, Dramićanin MD. Luminescence Thermometry with Nanoparticles: A Review. Nanomaterials. 2023; 13(21):2904. https://doi.org/10.3390/nano13212904
Chicago/Turabian StyleĐačanin Far, Ljubica, and Miroslav D. Dramićanin. 2023. "Luminescence Thermometry with Nanoparticles: A Review" Nanomaterials 13, no. 21: 2904. https://doi.org/10.3390/nano13212904
Note that from the first issue of 2016, this journal uses article numbers instead of page numbers. See further details here.