
Resonance-Based Sensing of Magnetic Nanoparticles Using Microfluidic Devices with Ferromagnetic Antidot Nanostructures
 , ,
, ,
Abstract
:1. Introduction
2. Materials and Methods
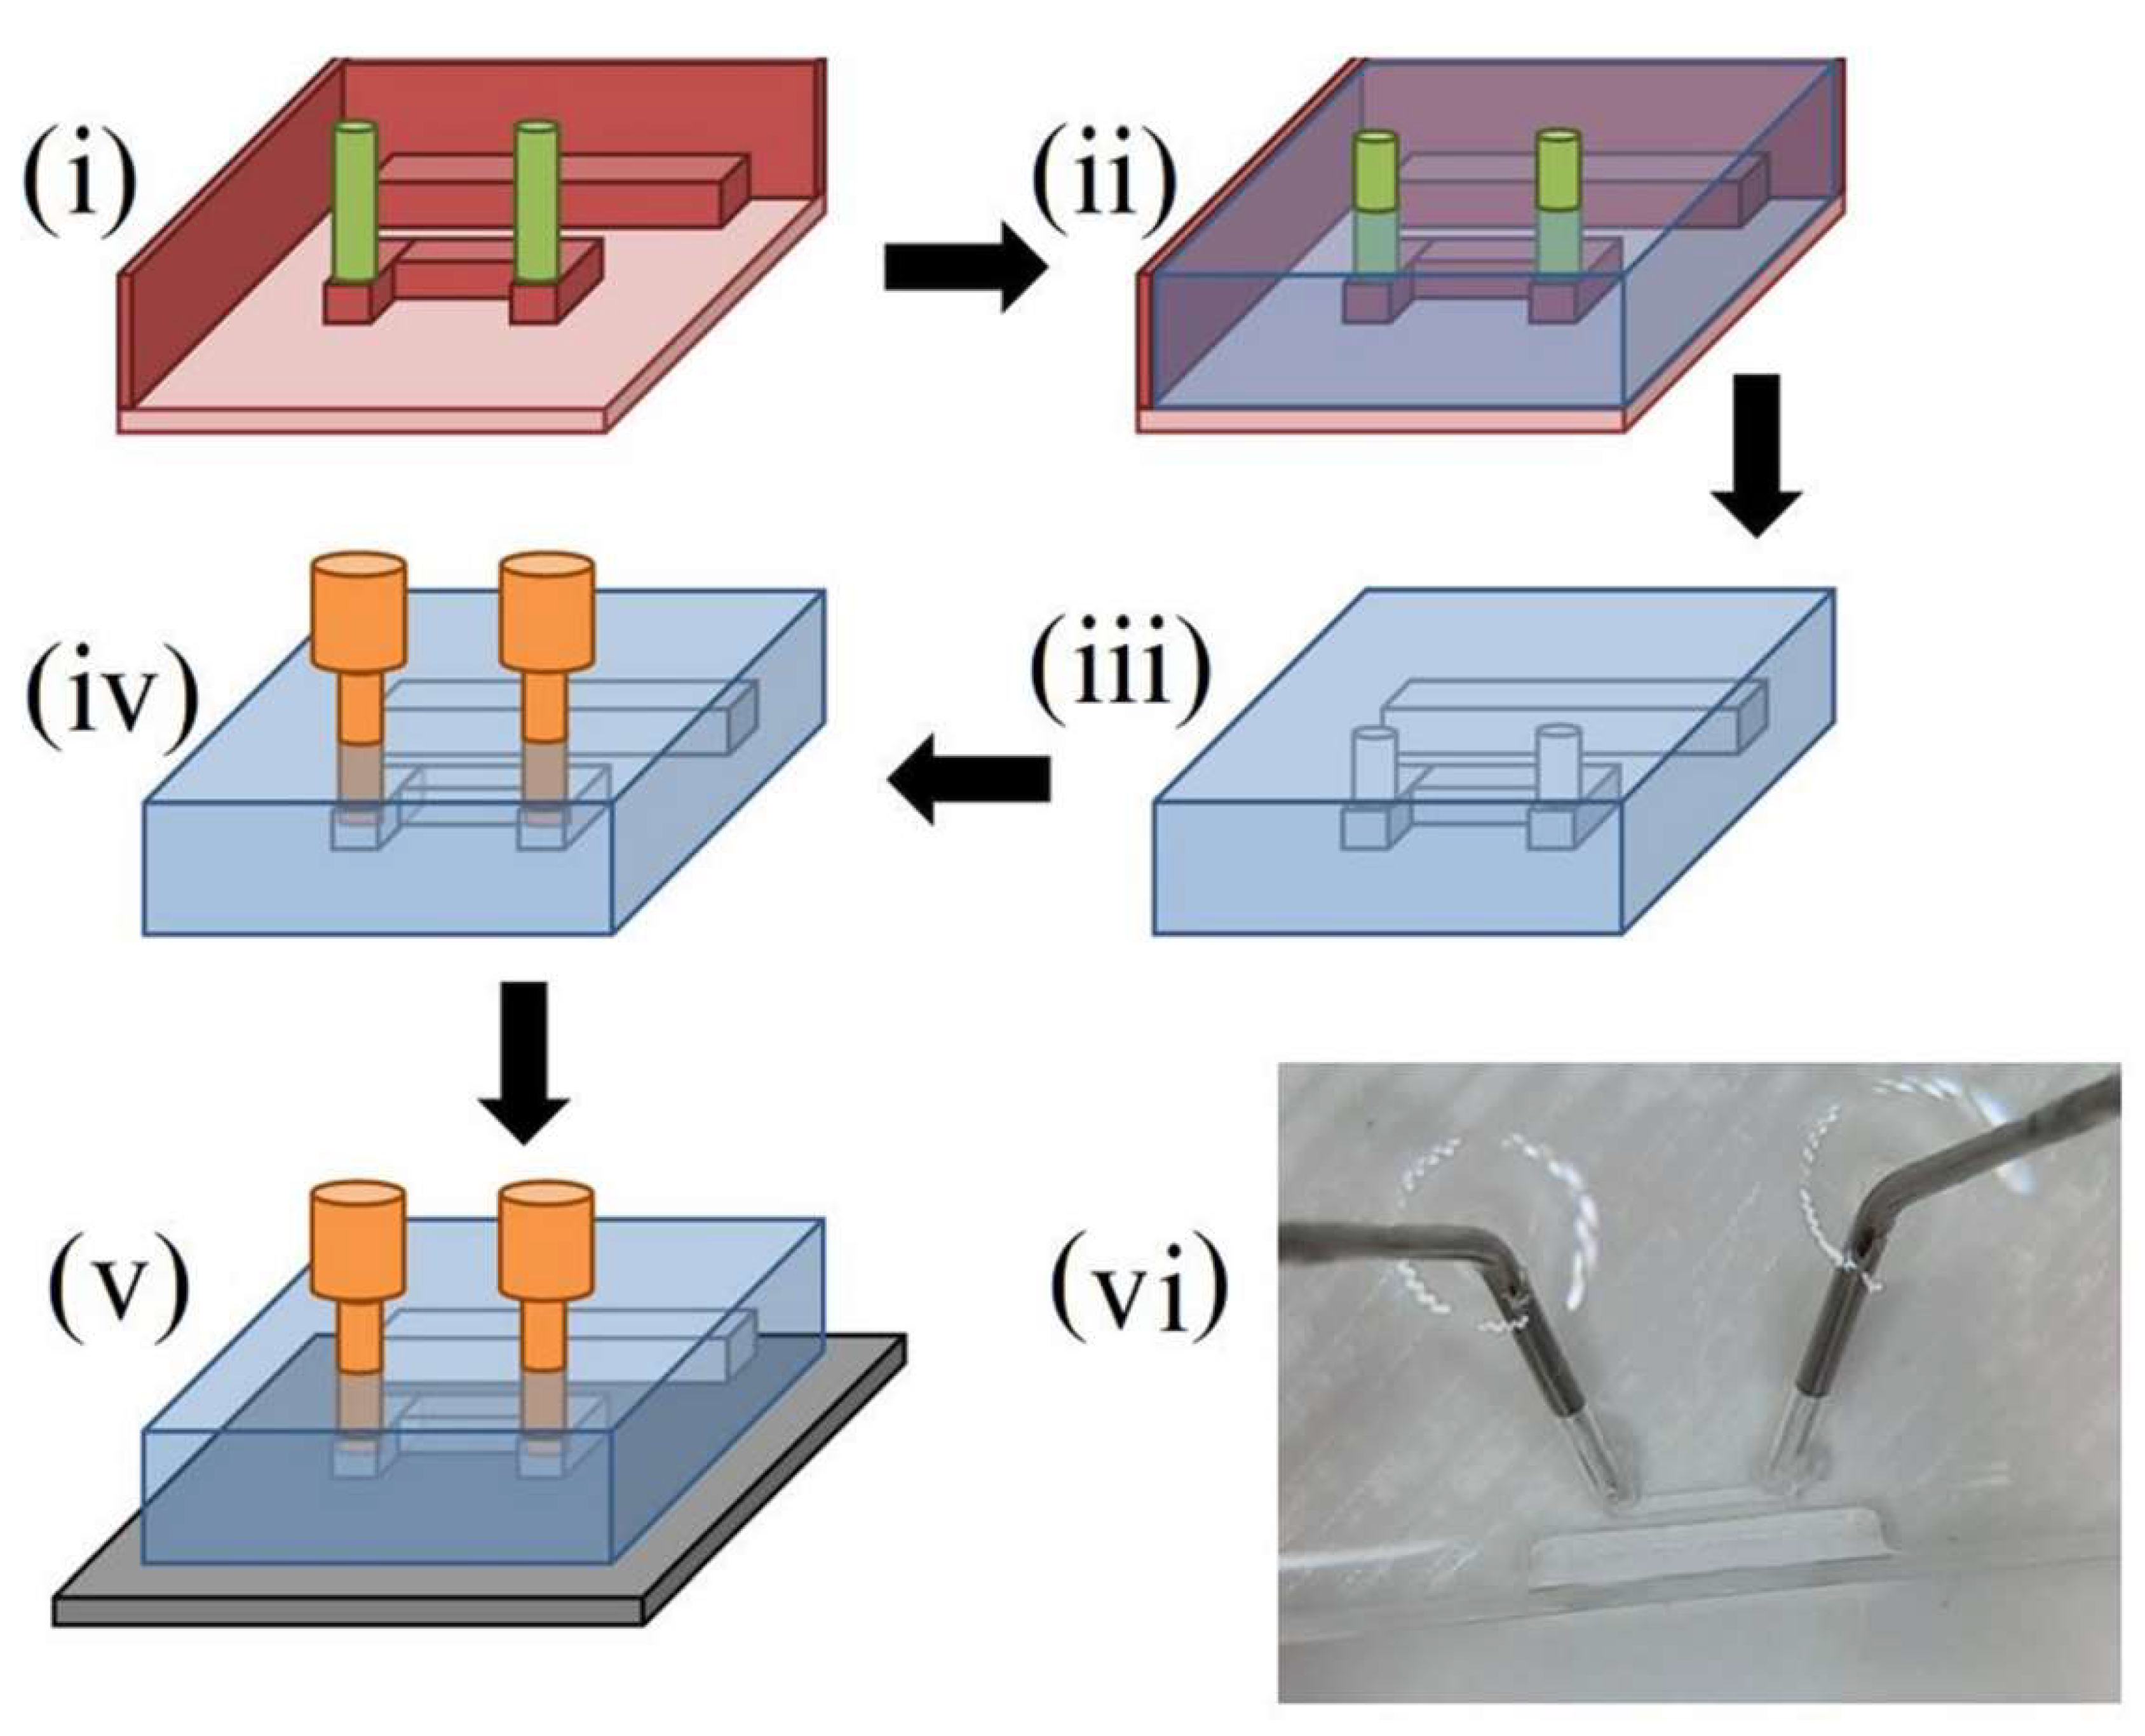
2.1. Fabricating Microresonators
2.2. Fabricating Microfluidic Films
2.3. Obtaining FMR Spectra before Introduction of MNPs
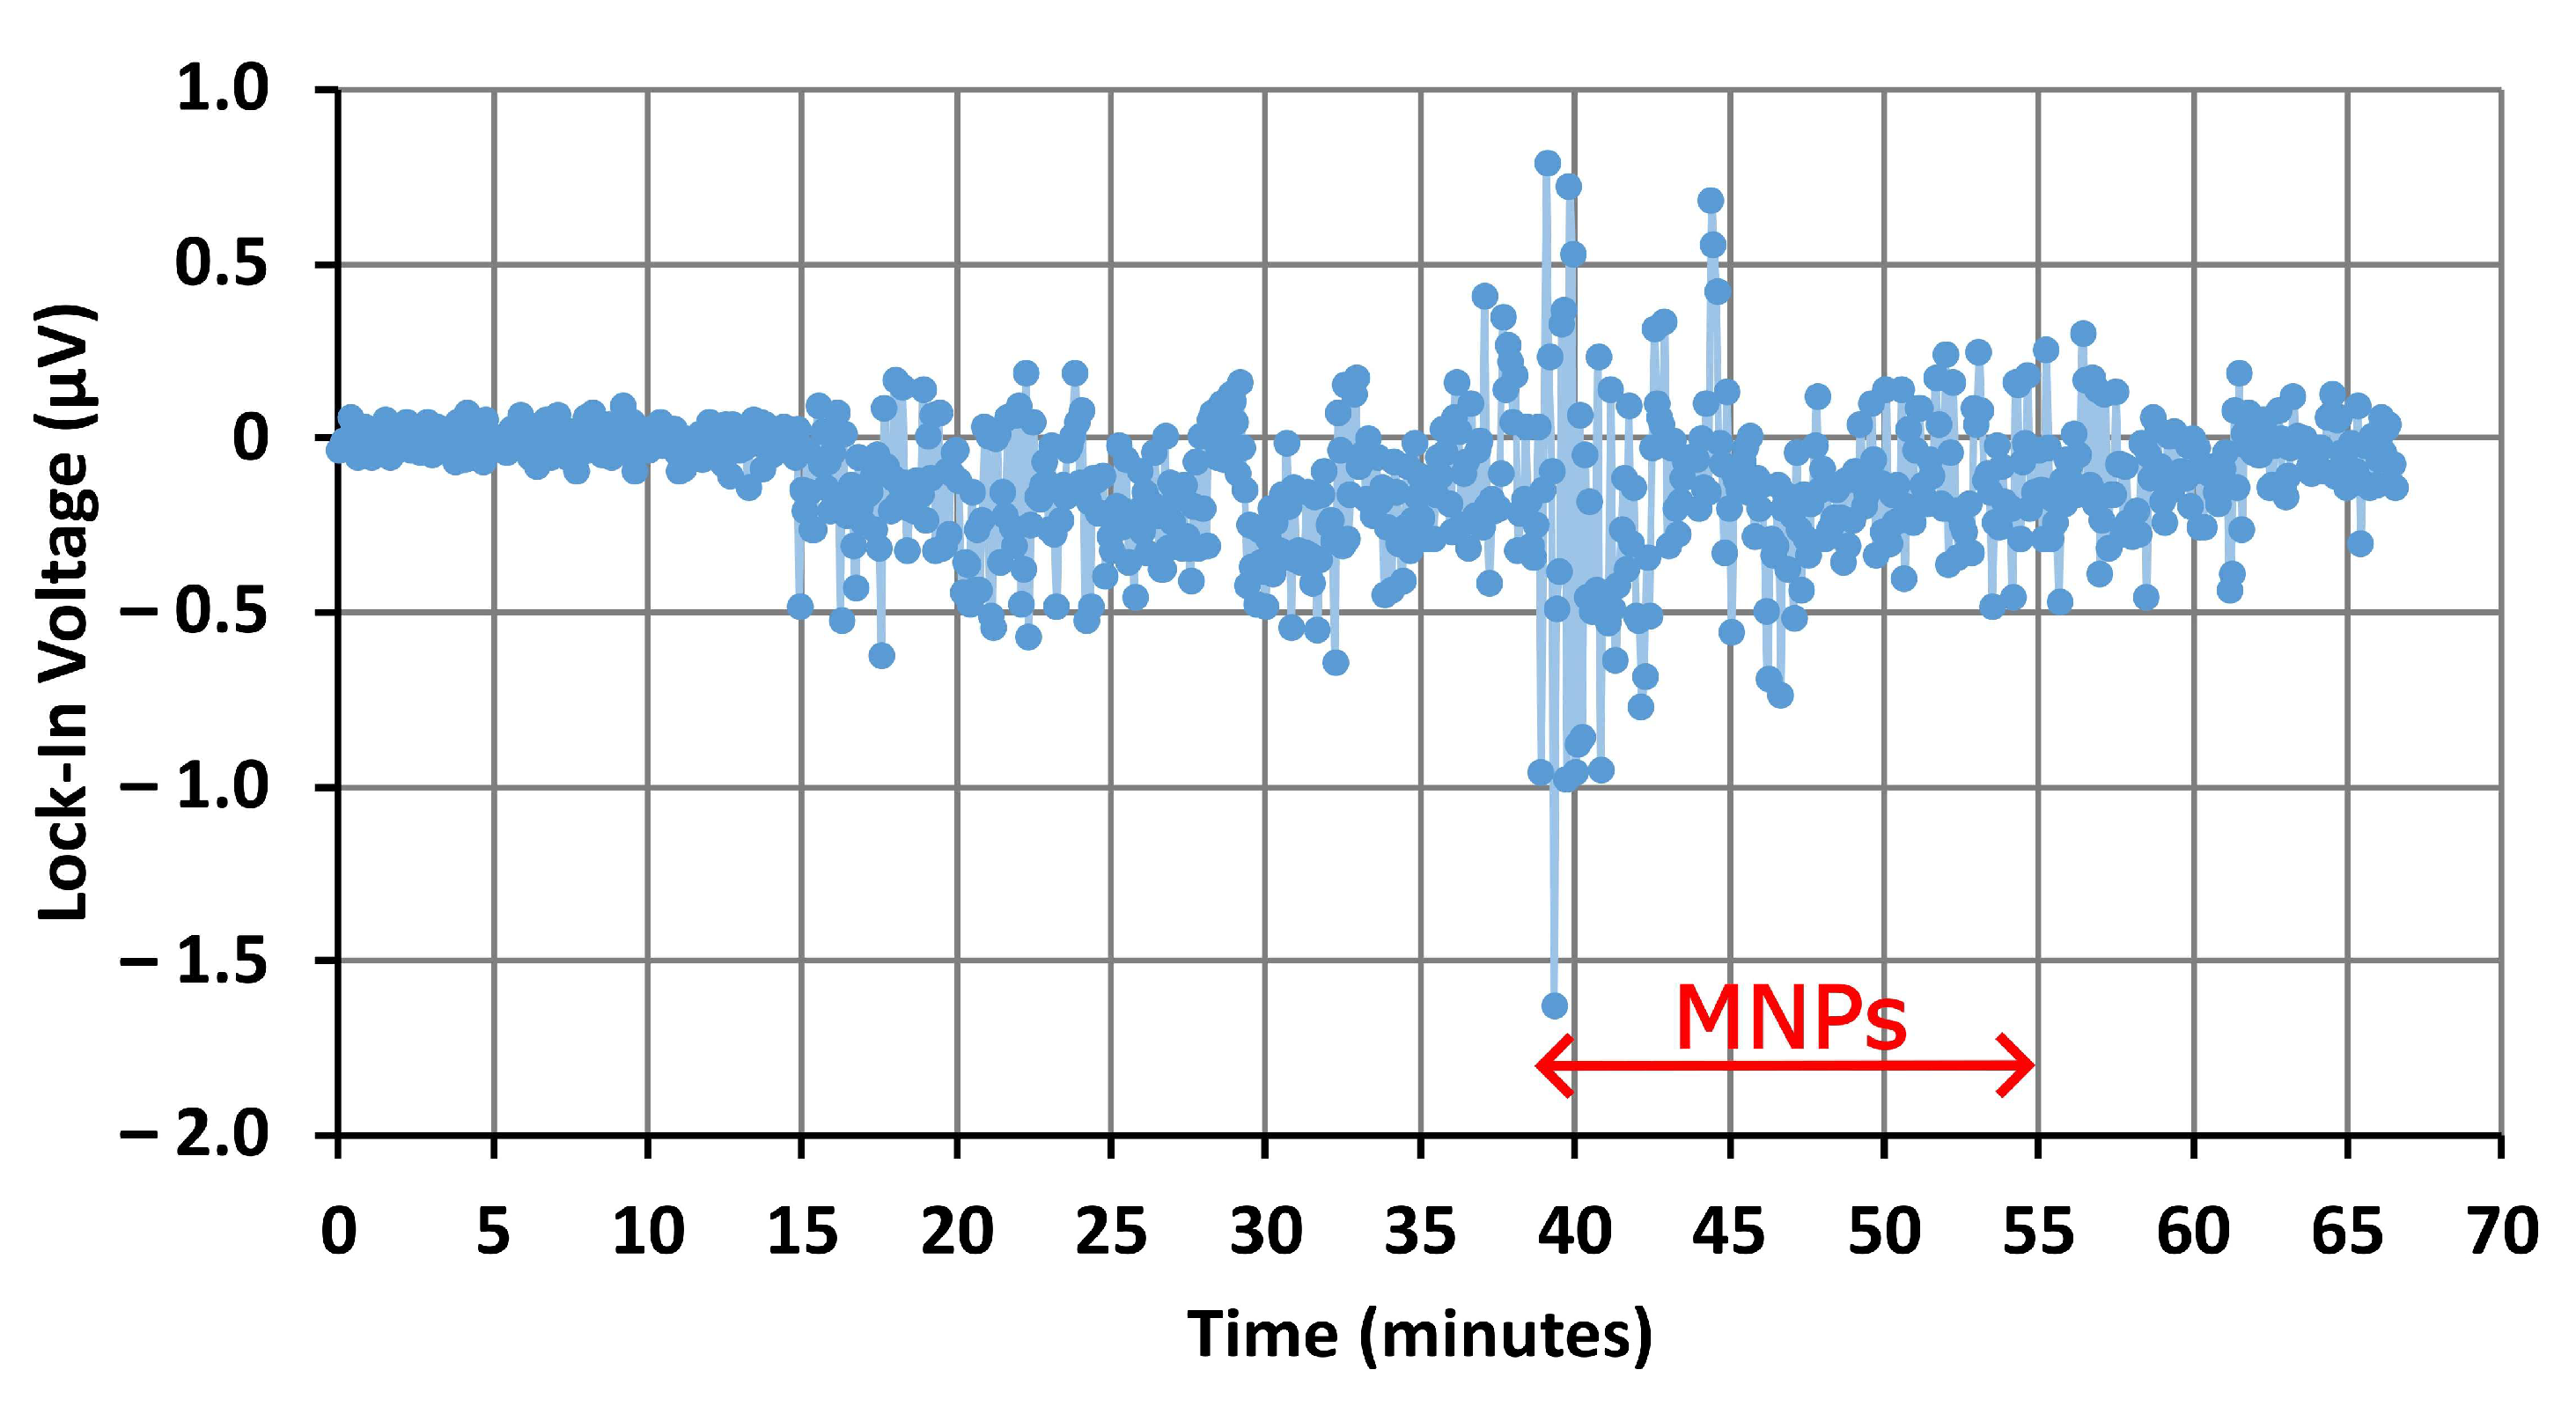
2.4. Sensing MNPs Passing through Microfluidic Channels
2.5. Obtaining FMR Spectra after Introduction of MNPs
2.6. Sensing MNPs in Microresonator Device without Microfluidics
3. Results and Discussion
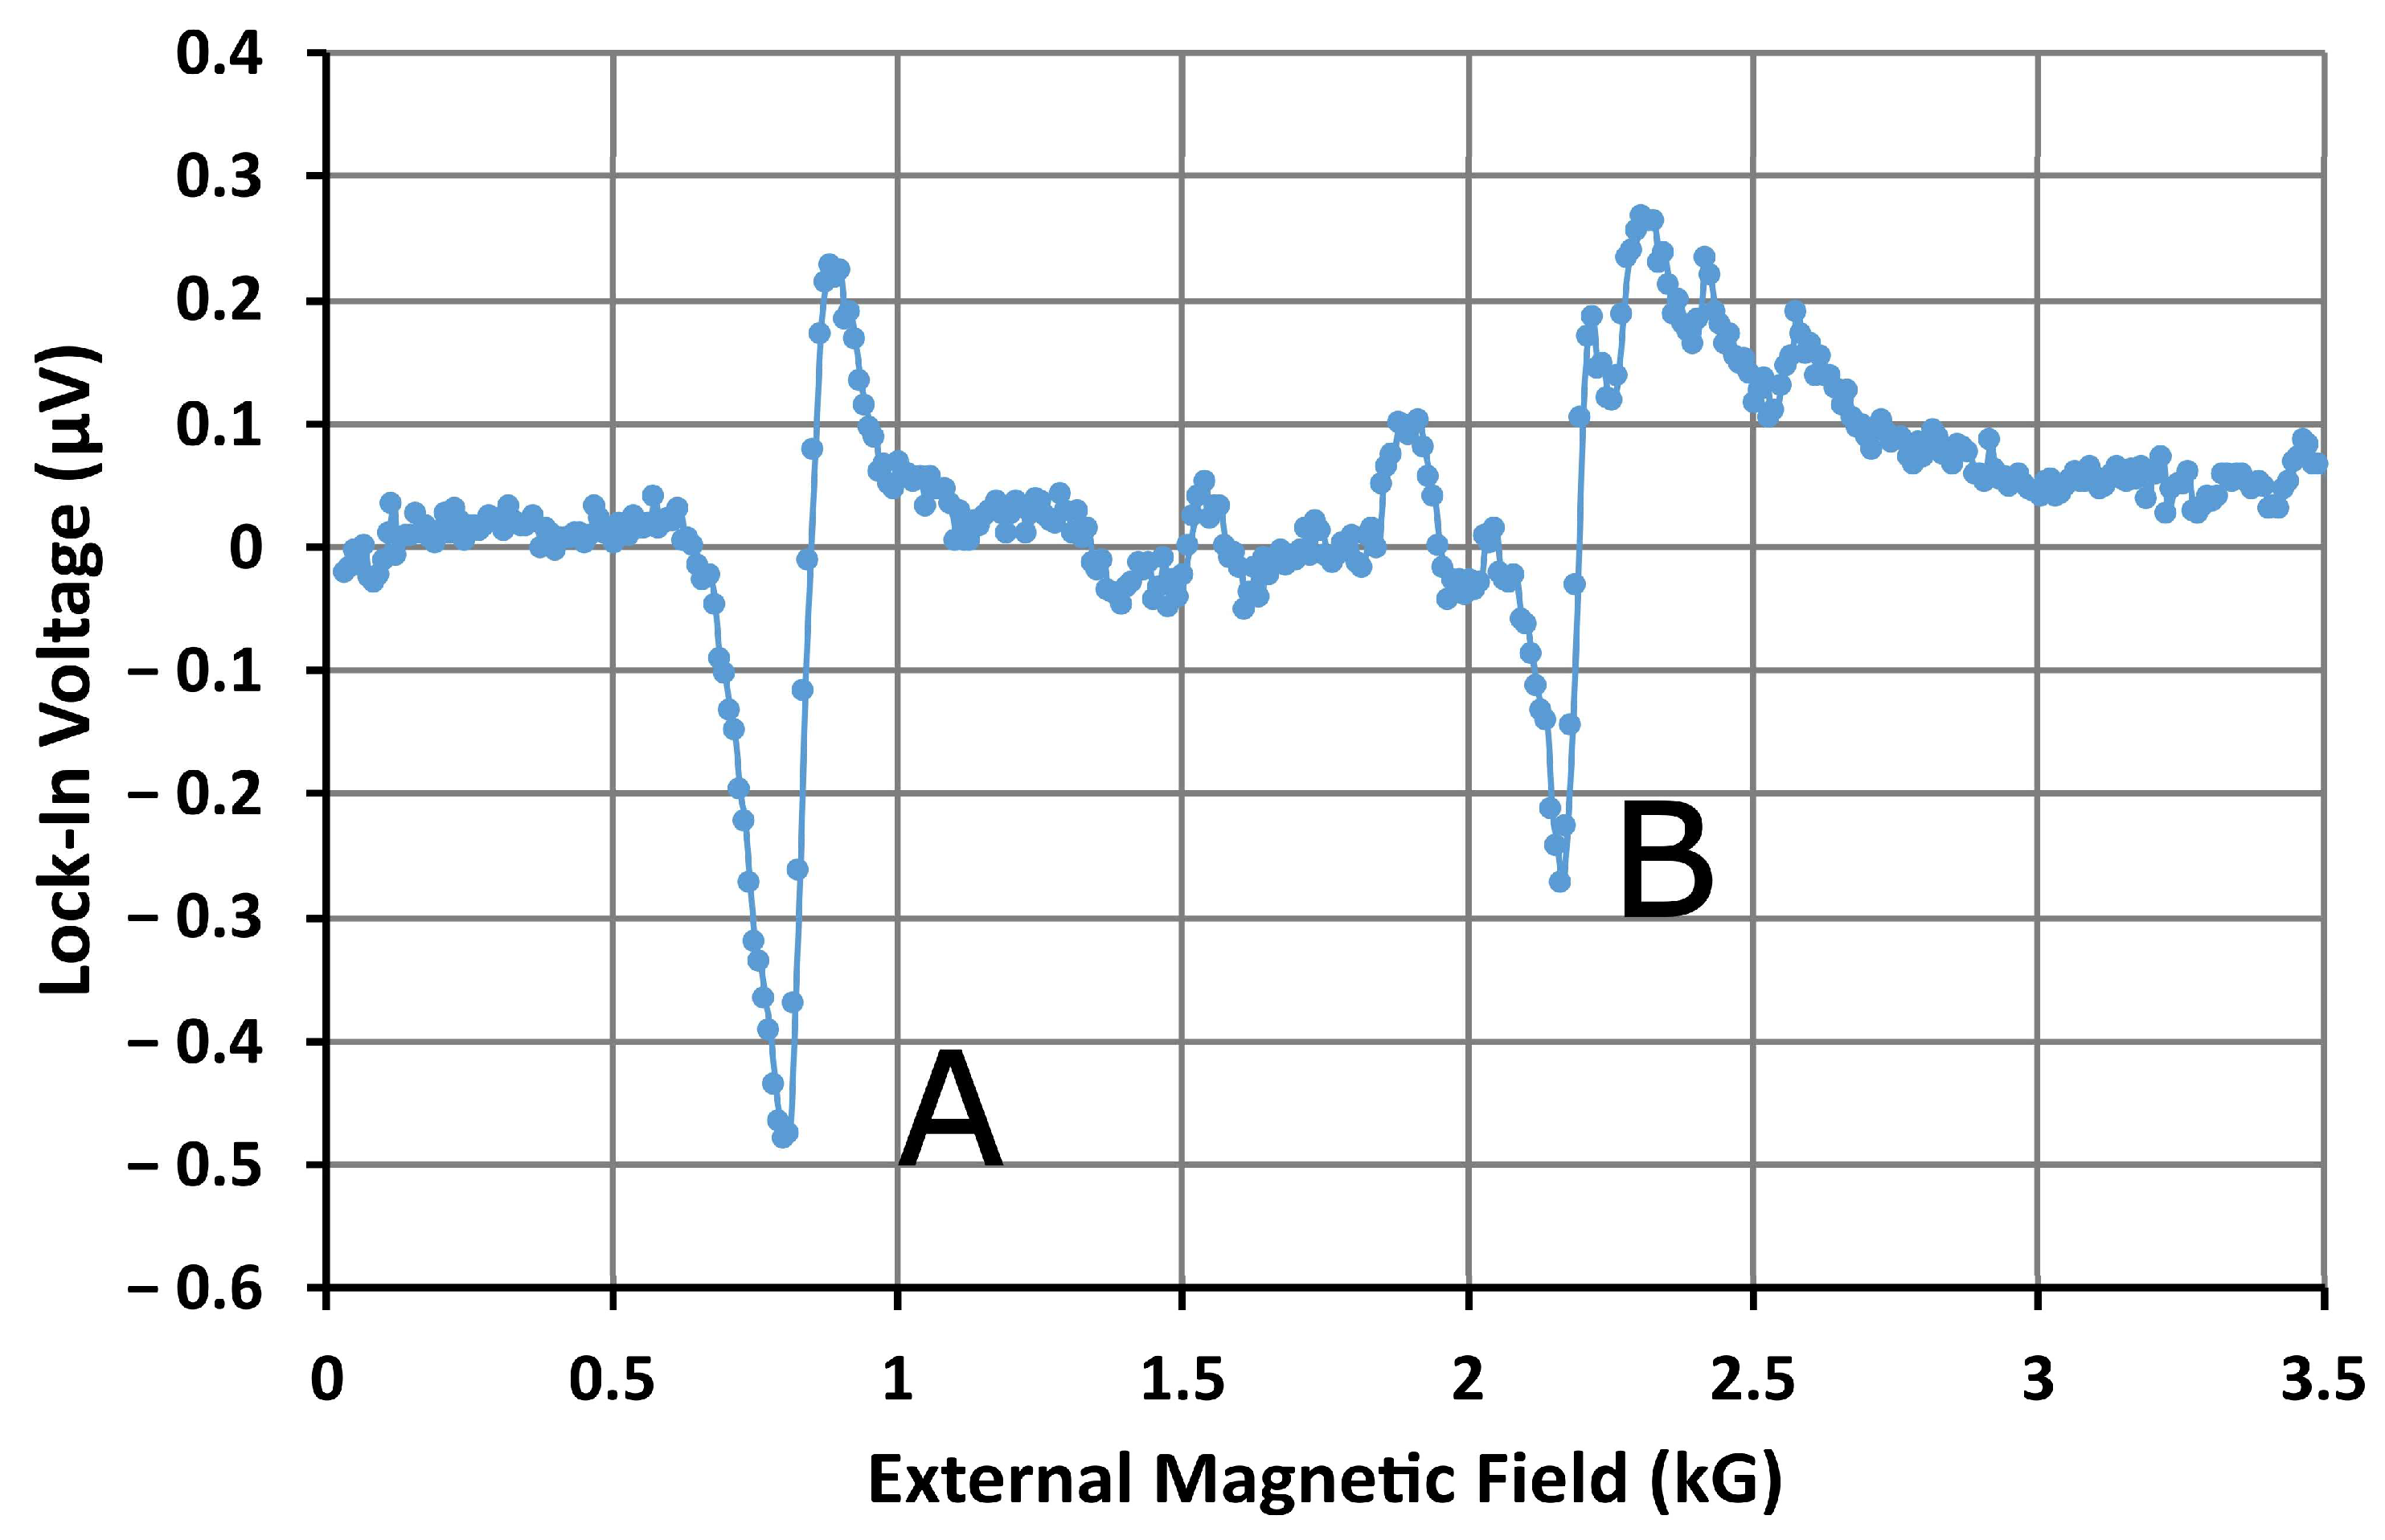
3.1. Detecting MNPs with a Bare Microresonator
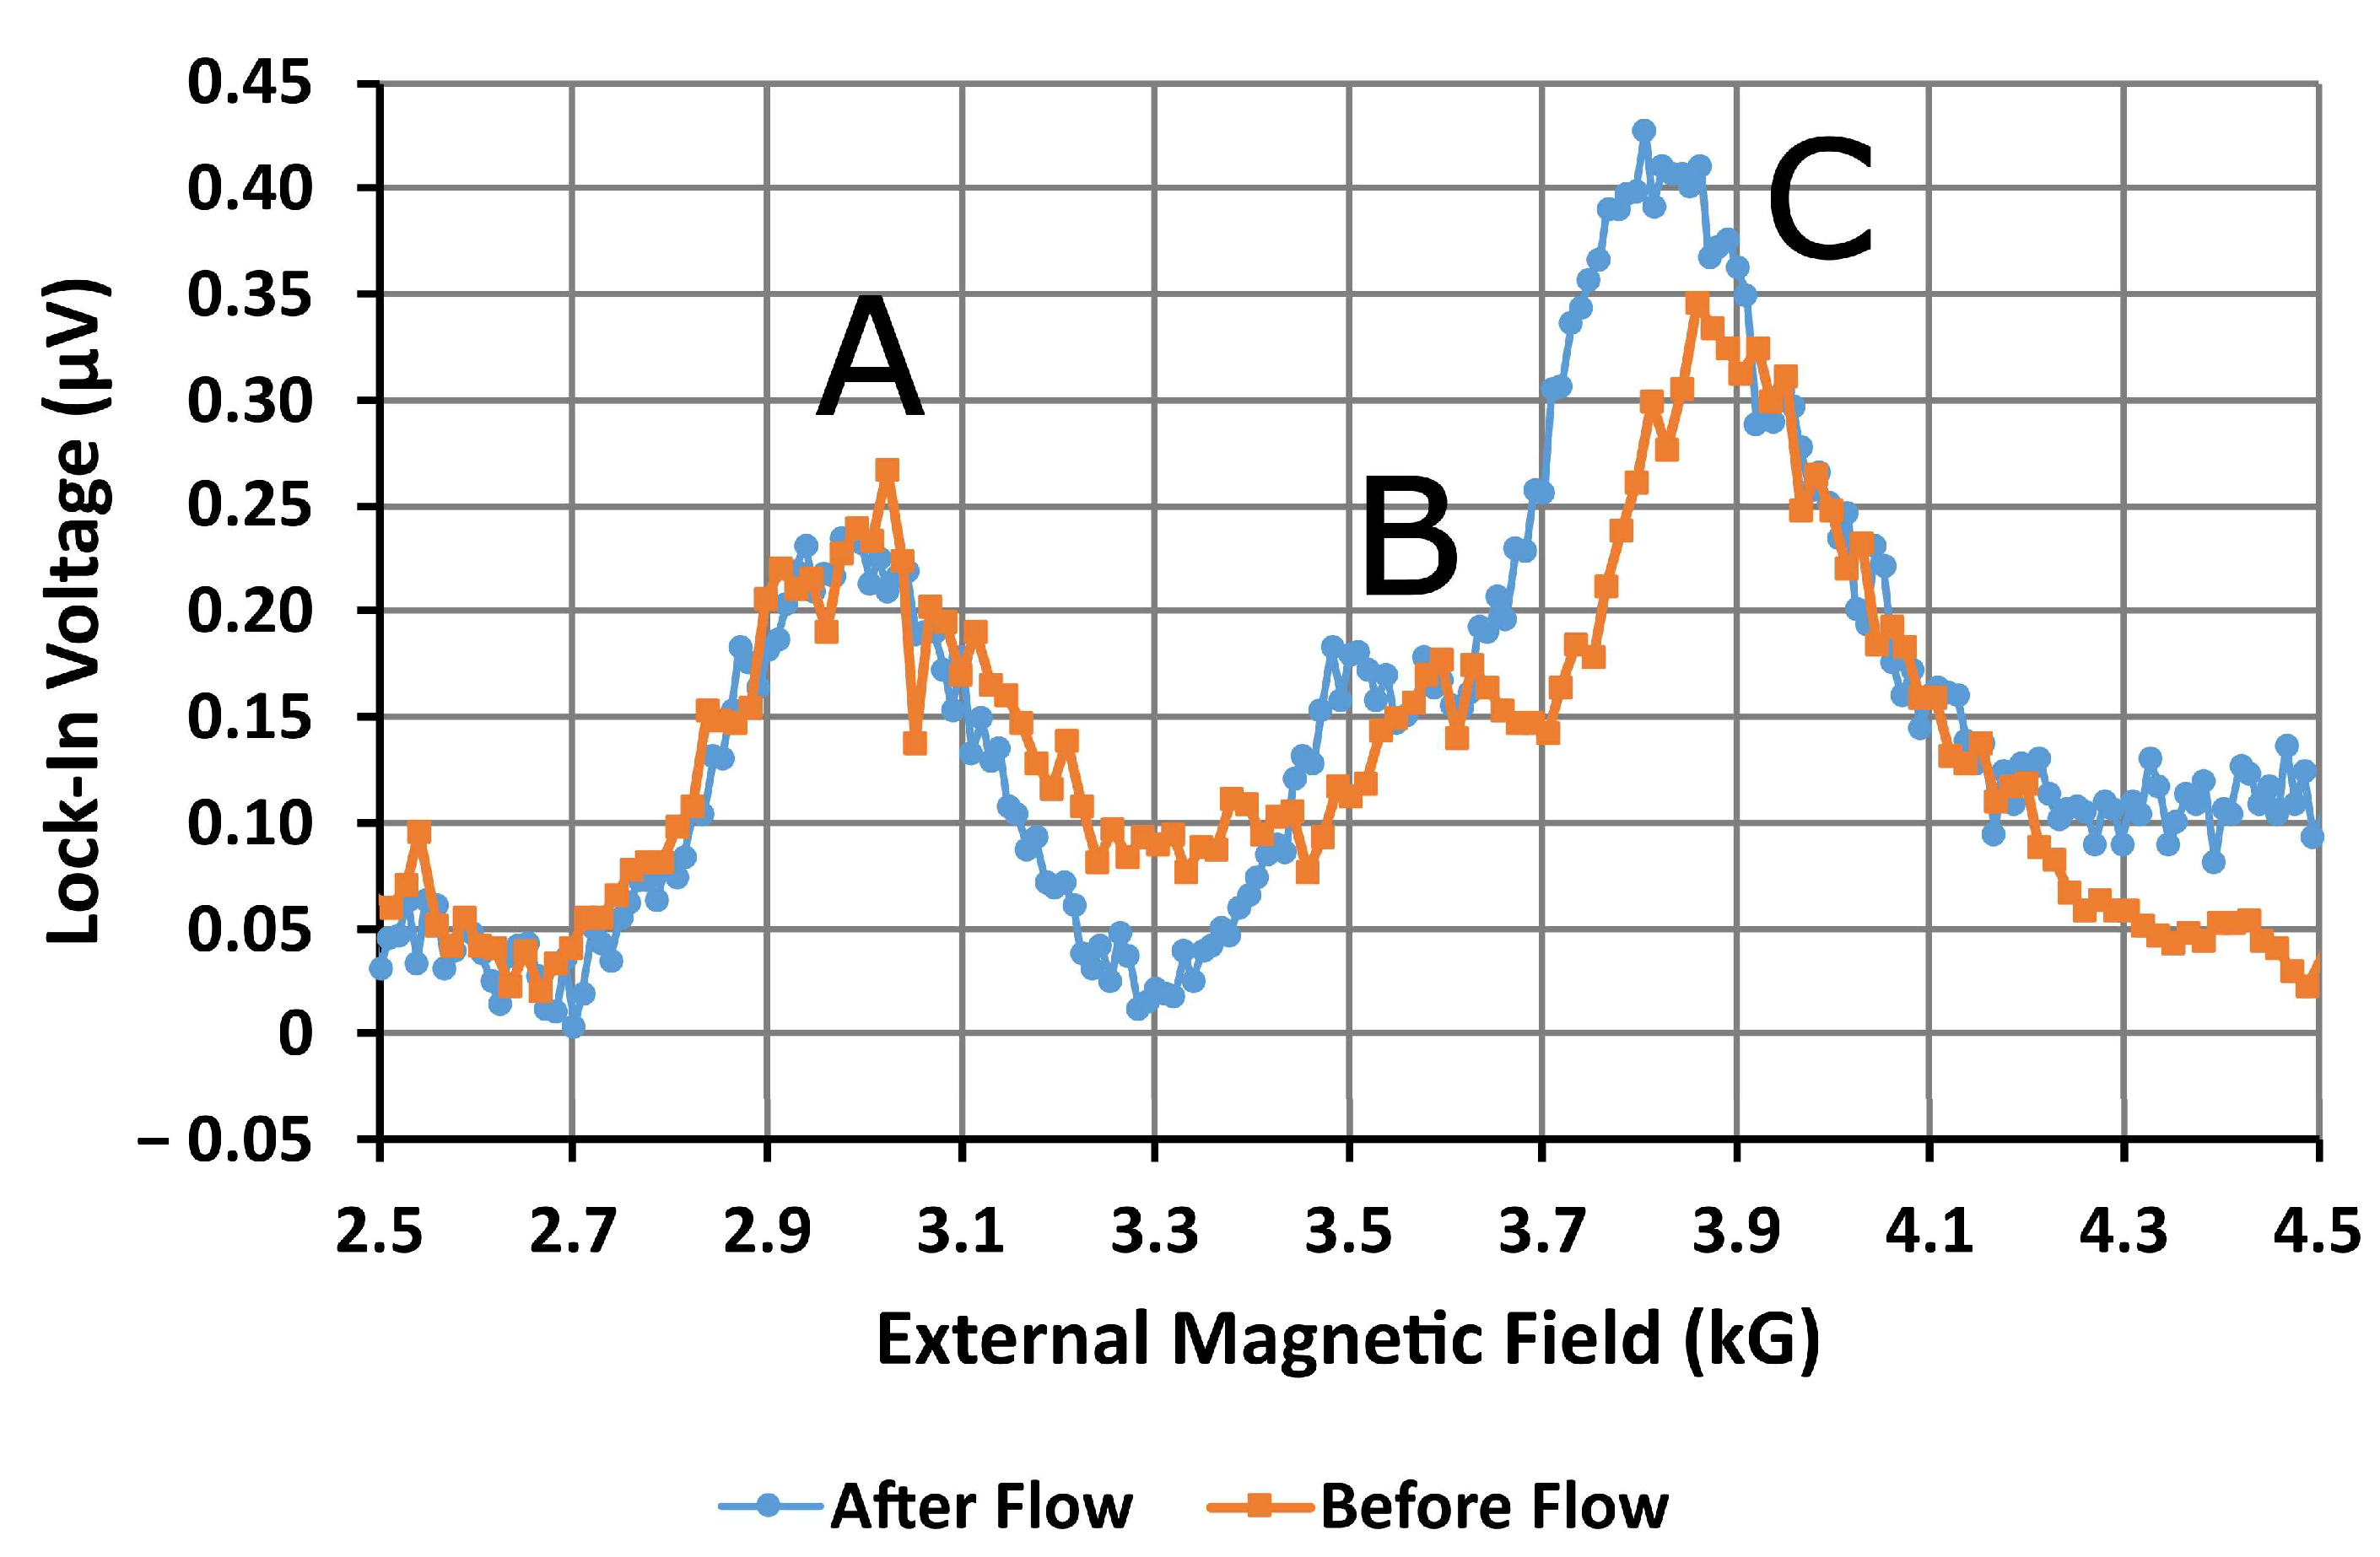
3.2. Detecting MNPs with an Antidot Microresonator
3.3. Detecting MNPs with an Antidot Microresonator without Microfluidics
4. Conclusions
Author Contributions
Funding
Data Availability Statement
Acknowledgments
Conflicts of Interest
Appendix A. Magnetic Nanoparticles Captured by a Bare Microresonator
Appendix B. Magnetic Nanoparticles Captured by an Antidot Microresonator with Microfluidics

Appendix C. Magnetic Nanoparticles Captured by an Antidot Microresonator without Microfluidics
References
- Hasany, S.F.; Rehman, A.; Jose, R.; Ahmed, I. Iron oxide magnetic nanoparticles: A short review. AIP Conf. Proc. 2012, 1502, 298–321. [Google Scholar] [CrossRef]
- Ali, A.; Shah, T.; Ullah, R.; Zhou, P.; Guo, M.; Ovais, M.; Tan, Z.; Rui, Y. Review on recent progress in magnetic nanoparticles: Synthesis, characterization, and diverse applications. Front. Chem. 2021, 9, 629054. [Google Scholar] [CrossRef] [PubMed]
- Shipway, A.N.; Katz, E.; Willner, I. Nanoparticle arrays on surfaces for electronic, optical, and sensor applications. Chem. Phys. Chem. 2000, 1, 18–52. [Google Scholar] [CrossRef] [PubMed]
- Wu, K.; Su, D.; Saha, R.; Wong, D.; Wang, J.-P. Magnetic particle spectroscopy-based bioassays: Methods, applications, advances, and future opportunities. J. Phys. D Appl. Phys. 2019, 52, 173001. [Google Scholar] [CrossRef]
- Chen, Y.-T.; Kolhatkar, A.G.; Zenasni, O.; Xu, S.; Randall Lee, T. Biosensing using magnetic nanoparticle detection techniques. Sensors 2017, 17, 2300. [Google Scholar] [CrossRef]
- Wu, C.C.; Lin, L.Y.; Lin, L.C.; Huang, H.C.; Yang, Y.F.; Liu, Y.B.; Tsai, M.C.; Gao, Y.L.; Wang, W.C.; Hung, S.W.; et al. Biofunctionalized magnetic nanoparticles for in vitro labeling and in vivo locating specific biomolecules. Appl. Phys. Lett. 2008, 92, 142504. [Google Scholar] [CrossRef]
- Pietschmann, J.; Voepel, N.; Voβ, L.; Rasche, S.; Schubert, M.; Kleines, M.; Krausse, H.-J.; Shaw, T.M.; Spiegel, H.; Schroeper, F. Development of fast and portable frequency magnetic mixing-based serological SARS-CoV-2-specific antibody detection assay. Front. Microbiol. 2021, 12, 643275. [Google Scholar] [CrossRef] [PubMed]
- Wu, K.; Saha, R.; Su, D.; Krishna, V.D.; Liu, J.; Cheeran, M.C.-J.; Wang, J.-P. Magnetic-nanosensor-based virus and pathogen detection strategies before and during COVID-19. ACS Appl. Nano Mater. 2020, 3, 9560–9580. [Google Scholar] [CrossRef]
- Luo, Y.; Alocilja, E.C. Portable nuclear magnetic resonance biosensor and assay for a highly sensitive and rapid detection of foodborne bacteria in complex matrices. J. Biol. Eng. 2017, 11, 14. [Google Scholar] [CrossRef]
- Li, C.; Hai, J.; Li, S.; Wang, B.; Yang, Z. Luminescent magnetic nanoparticles encapsulated in MOFs for highly selective and sensitive detection of ClO-/SCN- and anti-counterfeiting. Nanoscale 2018, 10, 8667–8676. [Google Scholar] [CrossRef]
- Fallahianbijan, F.; Giglia, S.; Carbrello, C.; Bell, D.; Zydney, A.L. Impact of protein fouling on nanoparticle capture within the Viresolve® Pro and Viresolve® NFP virus removal membranes. Biotechnol. Bioeng. 2019, 116, 2285–2291. [Google Scholar] [CrossRef] [PubMed]
- Pageni, P.; Yang, P.; Bam, M.; Zhu, T.; Chen, Y.P.; Decho, A.W.; Nagarkatti, M.; Tang, C. Recyclable magnetic nanoparticles grafted with antimicrobial metallopolymer-antibiotic bioconjugates. Biomaterials 2018, 178, 363–372. [Google Scholar] [CrossRef] [PubMed]
- Singh, P.; Gupta, R.; Choudhary, M.; Pinnaka, A.K.; Kumar, R.; Bhalla, V. Drug and nanoparticle mediated rapid naked eye water test for pathogens detection. Sens. Actuators B 2018, 262, 603–610. [Google Scholar] [CrossRef]
- Yang, J.; Wang, K.; Xu, H.; Yan, W.; Jin, Q.; Cui, D. Detection platforms for point-of-care testing based on colorimetric, luminescent and magnetic assays: A review. Talanta 2019, 202, 96–110. [Google Scholar] [CrossRef] [PubMed]
- Guo, T.; Wang, C.; Zhou, H.; Zhang, Y.; Ma, L. A multifunctional near-infrared fluorescent sensing material based on core-shell upconversion nanoparticles@magnetic nanoparticles and molecularly imprinted polymers for detection of deltamethrin. Microchim. Acta 2021, 188, 165. [Google Scholar] [CrossRef] [PubMed]
- Hakeem, D.A.; Su, S.; Mo, Z.; Wen, H. Upconversion luminescent nanomaterials: A promising new platform for food safety analysis. Crit. Rev. Food Sci. Nutr. 2022, 62, 8866–8907. [Google Scholar] [CrossRef]
- Hagan, A.K.; Zuchner, T. Lanthanide-based time-resolved luminescence immunoassays. Anal. Bioanal. Chem. 2011, 400, 2847–2864. [Google Scholar] [CrossRef]
- Päkkilä, H.; Malmi, E.; Lahtinen, S.; Soukka, T. Rapid homogeneous immunoassay for cardiac troponin I using switchable lanthanide luminescence. Biosens. Bioelectron. 2014, 62, 201–207. [Google Scholar] [CrossRef]
- Lim, J.; Lanni, C.; Evarts, E.R.; Lanni, F.; Tilton, R.D.; Majetich, S.A. Magnetophoresis of Nanoparticles. ACS Nano 2011, 5, 217–226. [Google Scholar] [CrossRef]
- Suwa, M.; Watarai, H. Magnetoanalysis of micro/nanoparticles: A review. Anal. Chim. Acta 2011, 690, 137–147. [Google Scholar] [CrossRef]
- Sun, X.; Lei, C.; Guo, L.; Zhou, Y. Separable detecting of Escherichia coli O157H:H7 by a giant magneto-resistance-based bio-sensing system. Sens. Actuators B 2016, 234, 485–492. [Google Scholar] [CrossRef]
- Wang, S.X.; Li, G. Advances in giant magnetoresistance biosensors with magnetic nanoparticle tags: Review and outlook. IEEE Trans. Magn. 2008, 44, 1687–1702. [Google Scholar] [CrossRef]
- Nikitin, M.P.; Orlov, A.V.; Znoyko, S.L.; Bragina, V.A.; Gorshkov, B.G.; Ksenevich, T.I.; Cherkasov, V.R.; Nikitin, P.I. Multiplex biosensing with highly sensitive magnetic nanoparticle quantification method. J. Magn. Magn. Mater. 2018, 459, 260–264. [Google Scholar] [CrossRef]
- Dey, C.; Yari, P.; Wu, K. Recent advances in magnetoresistance biosensors: A short review. Nano Futures 2023, 7, 012002. [Google Scholar] [CrossRef]
- Ren, C.; Bayin, Q.; Feng, S.; Fu, Y.; Ma, X.; Guo, J. Biomarkers detection with magnetoresistance-based sensors. Biosens. Bioelectron. 2020, 165, 112340. [Google Scholar] [CrossRef] [PubMed]
- Quynh, L.K.; Tu, B.D.; Dang, D.X.; Viet, D.Q.; Hien, L.T.; Huong Giang, D.T.; Duc, N.H. Detection of magnetic nanoparticles using simple AMR sensors in Wheatstone bridge. J. Sci. Adv. Mater. Devices 2016, 1, 98–102. [Google Scholar] [CrossRef]
- Jin, Z.; Koo, T.M.; Kim, M.S.; Al-Mahdawi, M.; Oogane, M.; Ando, Y.; Kim, Y.K. Highly-sensitive magnetic sensor for detecting magnetic nanoparticles based on magnetic tunnel junctions at a low static field. AIP Adv. 2021, 11, 015046. [Google Scholar] [CrossRef]
- Chung, K.H.; Kim, S.N.; Lim, S.H. Magnetic parameters in giant magnetoresistance spin valve and their roles in magnetoresistance sensitivity. Thin Solid Film. 2018, 650, 44–50. [Google Scholar] [CrossRef]
- Schotter, J.; Kamp, P.B.; Becker, A.; Pühler, A.; Reiss, G.; Brückl, H. Comparison of a prototype magnetoresistive biosensor to standard fluorescent DNA detection. Biosens. Bioelectron. 2004, 19, 1149–1156. [Google Scholar] [CrossRef]
- Choi, J.; Gani, A.W.; Bechstein, D.J.B.; Lee, J.-R.; Utz, P.J.; Wang, S.X. Portable, one-step, and rapid GMR biosensor platform with smartphone interface. Biosens. Bioelectron. 2016, 85, 1–7. [Google Scholar] [CrossRef]
- Sushruth, M.; Ding, J.; Duczynski, J.; Woodward, R.C.; Begley, R.A.; Fangohr, H.; Fuller, R.O.; Adeyeye, A.O.; Kostylev, M.; Metaxas, P. Resonance-based detection of magnetic nanoparticles and microbeads using nanopatterned ferromagnets. Phys. Rev. Appl. 2016, 6, 044005. [Google Scholar] [CrossRef]
- Kittel, C. On the theory of ferromagnetic resonance absorption. Phys. Rev. 1948, 73, 155–161. [Google Scholar] [CrossRef]
- Stancil, D.D.; Prabhakar, A. Spin Waves Theory and Applications; Springer Science+Business Media, LLC.: Berlin/Heidelberg, Germany, 2009. [Google Scholar] [CrossRef]
- Chatterjee, E.; Marr, T.; Dhagat, P.; Remcho, V.T. A microfluidic sensor based on ferromagnetic resonance induced in magnetic bead labels. Sens. Actuators B 2011, 156, 651–656. [Google Scholar] [CrossRef]
- Manzin, A.; Ferroro, R.; Vicentini, M. Application of magnonic crystals in magnetic bead detection. Nanomaterials 2022, 12, 3278. [Google Scholar] [CrossRef] [PubMed]
- Banholzer, A.; Narkowicz, R.; Hasssel, A.; Meckenstock, R.; Stienen, S.; Posth, O.; Suter, D.; Farle, M.; Lindner, J. Visualization of spin dynamics in single nanosized magnetic elements. Nanotechnology 2011, 22, 295713. [Google Scholar] [CrossRef] [PubMed]
- Cansever, H.; Anwar, M.S.; Stienen, S.; Lenz, K.; Narkowicz, R.; Hlawacek, G.; Potzger, K.; Hellwig, O.; Fassbender, J.; Lindner, J.; et al. Resonance behavior of embedded and freestanding microscale ferromagnets. Sci. Rep. 2022, 12, 14809. [Google Scholar] [CrossRef] [PubMed]
- Cardoso, S.; Leitao, D.C.; Dias, T.M.; Valadeiro, J.; Silva, M.D.; Chicharo, A.; Silverio, V.; Gaspar, J.; Freitas, P.P. Challenges and trends in magnetic sensor integration with microfluidics for biomedical applications. J. Phys. D Appl. Phys. 2017, 50, 213001. [Google Scholar] [CrossRef]
- Giouroudi, I.; Kokkinis, G. Recent advances in magnetic microfluidic biosensors. Nanomaterials 2017, 7, 171. [Google Scholar] [CrossRef]
- DIXIT, C.K.; Kaushik, A. Microfluidics for Biologists Fundamentals and Applications; Springer International Publishing: Berlin/Heidelberg, Germany, 2016. [Google Scholar] [CrossRef]
- Dowling, R.; Kostylev, M. External magnetic fields enhance capture of magnetic nanoparticles flowing through molded microfluidic channel by ferromagnetic nanostructures. arXiv 2023, arXiv:2308.14543. [Google Scholar]
- Boero, G.; Bouterfas, M.; Massin, C.; Vincent, F.; Besse, P.-A.; Popovic, R.S.; Schweiger, A. Electron-spin resonance probe based on a 100 μm planar microcoil. Rev. Sci. Instrum. 2003, 74, 4794–4798. [Google Scholar] [CrossRef]
- Narkowicz, R.; Suter, D.; Stonies, R. Planar microresonators for EPR experiments. J. Magn. Reson. 2005, 175, 275–284. [Google Scholar] [CrossRef] [PubMed]
- McDonald, J.C.; Duffy, D.C.; Anderson, J.R.; Chiu, D.T.; Wu, H.; Schueller, O.J.A.; Whitesides, G.M. Fabrication of microfluidic systems in poly(dimethylsiloxane). Electrophoresis 2000, 21, 27–40. [Google Scholar] [CrossRef]
- Becker, H.; Gӓrtner, C. Polymer microfabrication methods for microfluidic analytical applications. Electrophoresis 2000, 21, 12–26. [Google Scholar] [CrossRef]
- Fiorini, G.S.; Chiu, D.T. Disposable microfluidic devices: Fabrication, function, and application. BioTechniques 2005, 38, 429–446. [Google Scholar] [CrossRef] [PubMed]
- Stone, H.A.; Stroock, A.D.; Ajdari, A. Engineering flows in small devices: Microfluidics toward a lab-on-a-chip. Annu. Rev. Fluid Mech. 2004, 36, 381–411. [Google Scholar] [CrossRef]
- Ren, K.; Zhou, J.; Wu, H. Materials for microfluidic chip fabrication. Acc. Chem. Res. 2013, 46, 2396–2406. [Google Scholar] [CrossRef]
- Felton, H.; Hughes, R.; Diaz-Gaxiola, A. Negligible-cost microfluidic device fabrication using 3D-printed interconnecting channel scaffolds. PLoS ONE 2021, 16, e0245206. [Google Scholar] [CrossRef]
- Montoya, E.; McKinnon, T.; Zamani, A.; Girt, E.; Heinrich, B. Broadband ferromagnetic resonance system and methods for ultrathin magnetic films. J. Magn. Magn. Mater. 2014, 356, 12–20. [Google Scholar] [CrossRef]
- Maksymov, I.S.; Mikhail, K. Broadband stripline ferromagnetic resonance spectroscopy of ferromagnetic films, multilayers and nanostructures. Phys. E Low Dimens. Syst. Nanostructures 2015, 69, 253–293. [Google Scholar] [CrossRef]
- Ivanov, E.N.; Kostylev, M. Extremely high-resolution measurements of microwave magnetisation dynamics in magnetic thin films and nanostructures. arXiv 2014, arXiv:1402.3459. [Google Scholar] [CrossRef]
- Vansteenkiste, A.; Leliaert, J.; Dvornik, M.; Helsen, M.; Garcia-Sanchez, F.; Waeyenberge, B.V. The design and verification of MuMax3. AIP Adv. 2014, 4, 107133. [Google Scholar] [CrossRef]
- Vansteenkiste, A.; Van de Wiele, B. MuMax: A new high-performance micromagnetic simulation tool. J. Magn. Magn. Mater. 2011, 323, 2585–2591. [Google Scholar] [CrossRef]
- Berthier, J.; Brakke, K.A. The Physics of Microdroplets; John Wiley & Sons, Inc.: Hoboken, NJ, USA, 2012. [Google Scholar]
- Tripathi, D.; Tripathi, S.; Rawat, R.K.; Chauhan, P. Highly sensitive humidity sensor based on freestanding graphene oxide sheets for respiration and moisture detection. J. Electron. Mater. 2023, 52, 2396–2408. [Google Scholar] [CrossRef]
- Krivoruchko, V.N.; Marchenko, A.I. Apparent sixfold configurational anisotropy and spatial confinement of ferromagnetic resonances in hexagonal magnetic antidot lattices. J. Appl. Phys. 2011, 109, 083912. [Google Scholar] [CrossRef]
- Neusser, S.; Botters, B.; Grundler, D. Localization, confinement, and field-controlled propagation of spin waves in Ni80Fe20 antidot lattices. Phys. Rev. B 2008, 78, 054406. [Google Scholar] [CrossRef]
- Dowling, R.; Kostylev, M. Enhancing the capture of magnetic nanoparticles inside of ferromagnetic nanostructures using external magnetic fields. arXiv 2023, arXiv:2308.12321. [Google Scholar]


| Ferromagnetic Resonance Fields before and after MNP Flow | |||
|---|---|---|---|
| Resonance Mode | Before Flow (G) | After Flow (G) | Difference (G) |
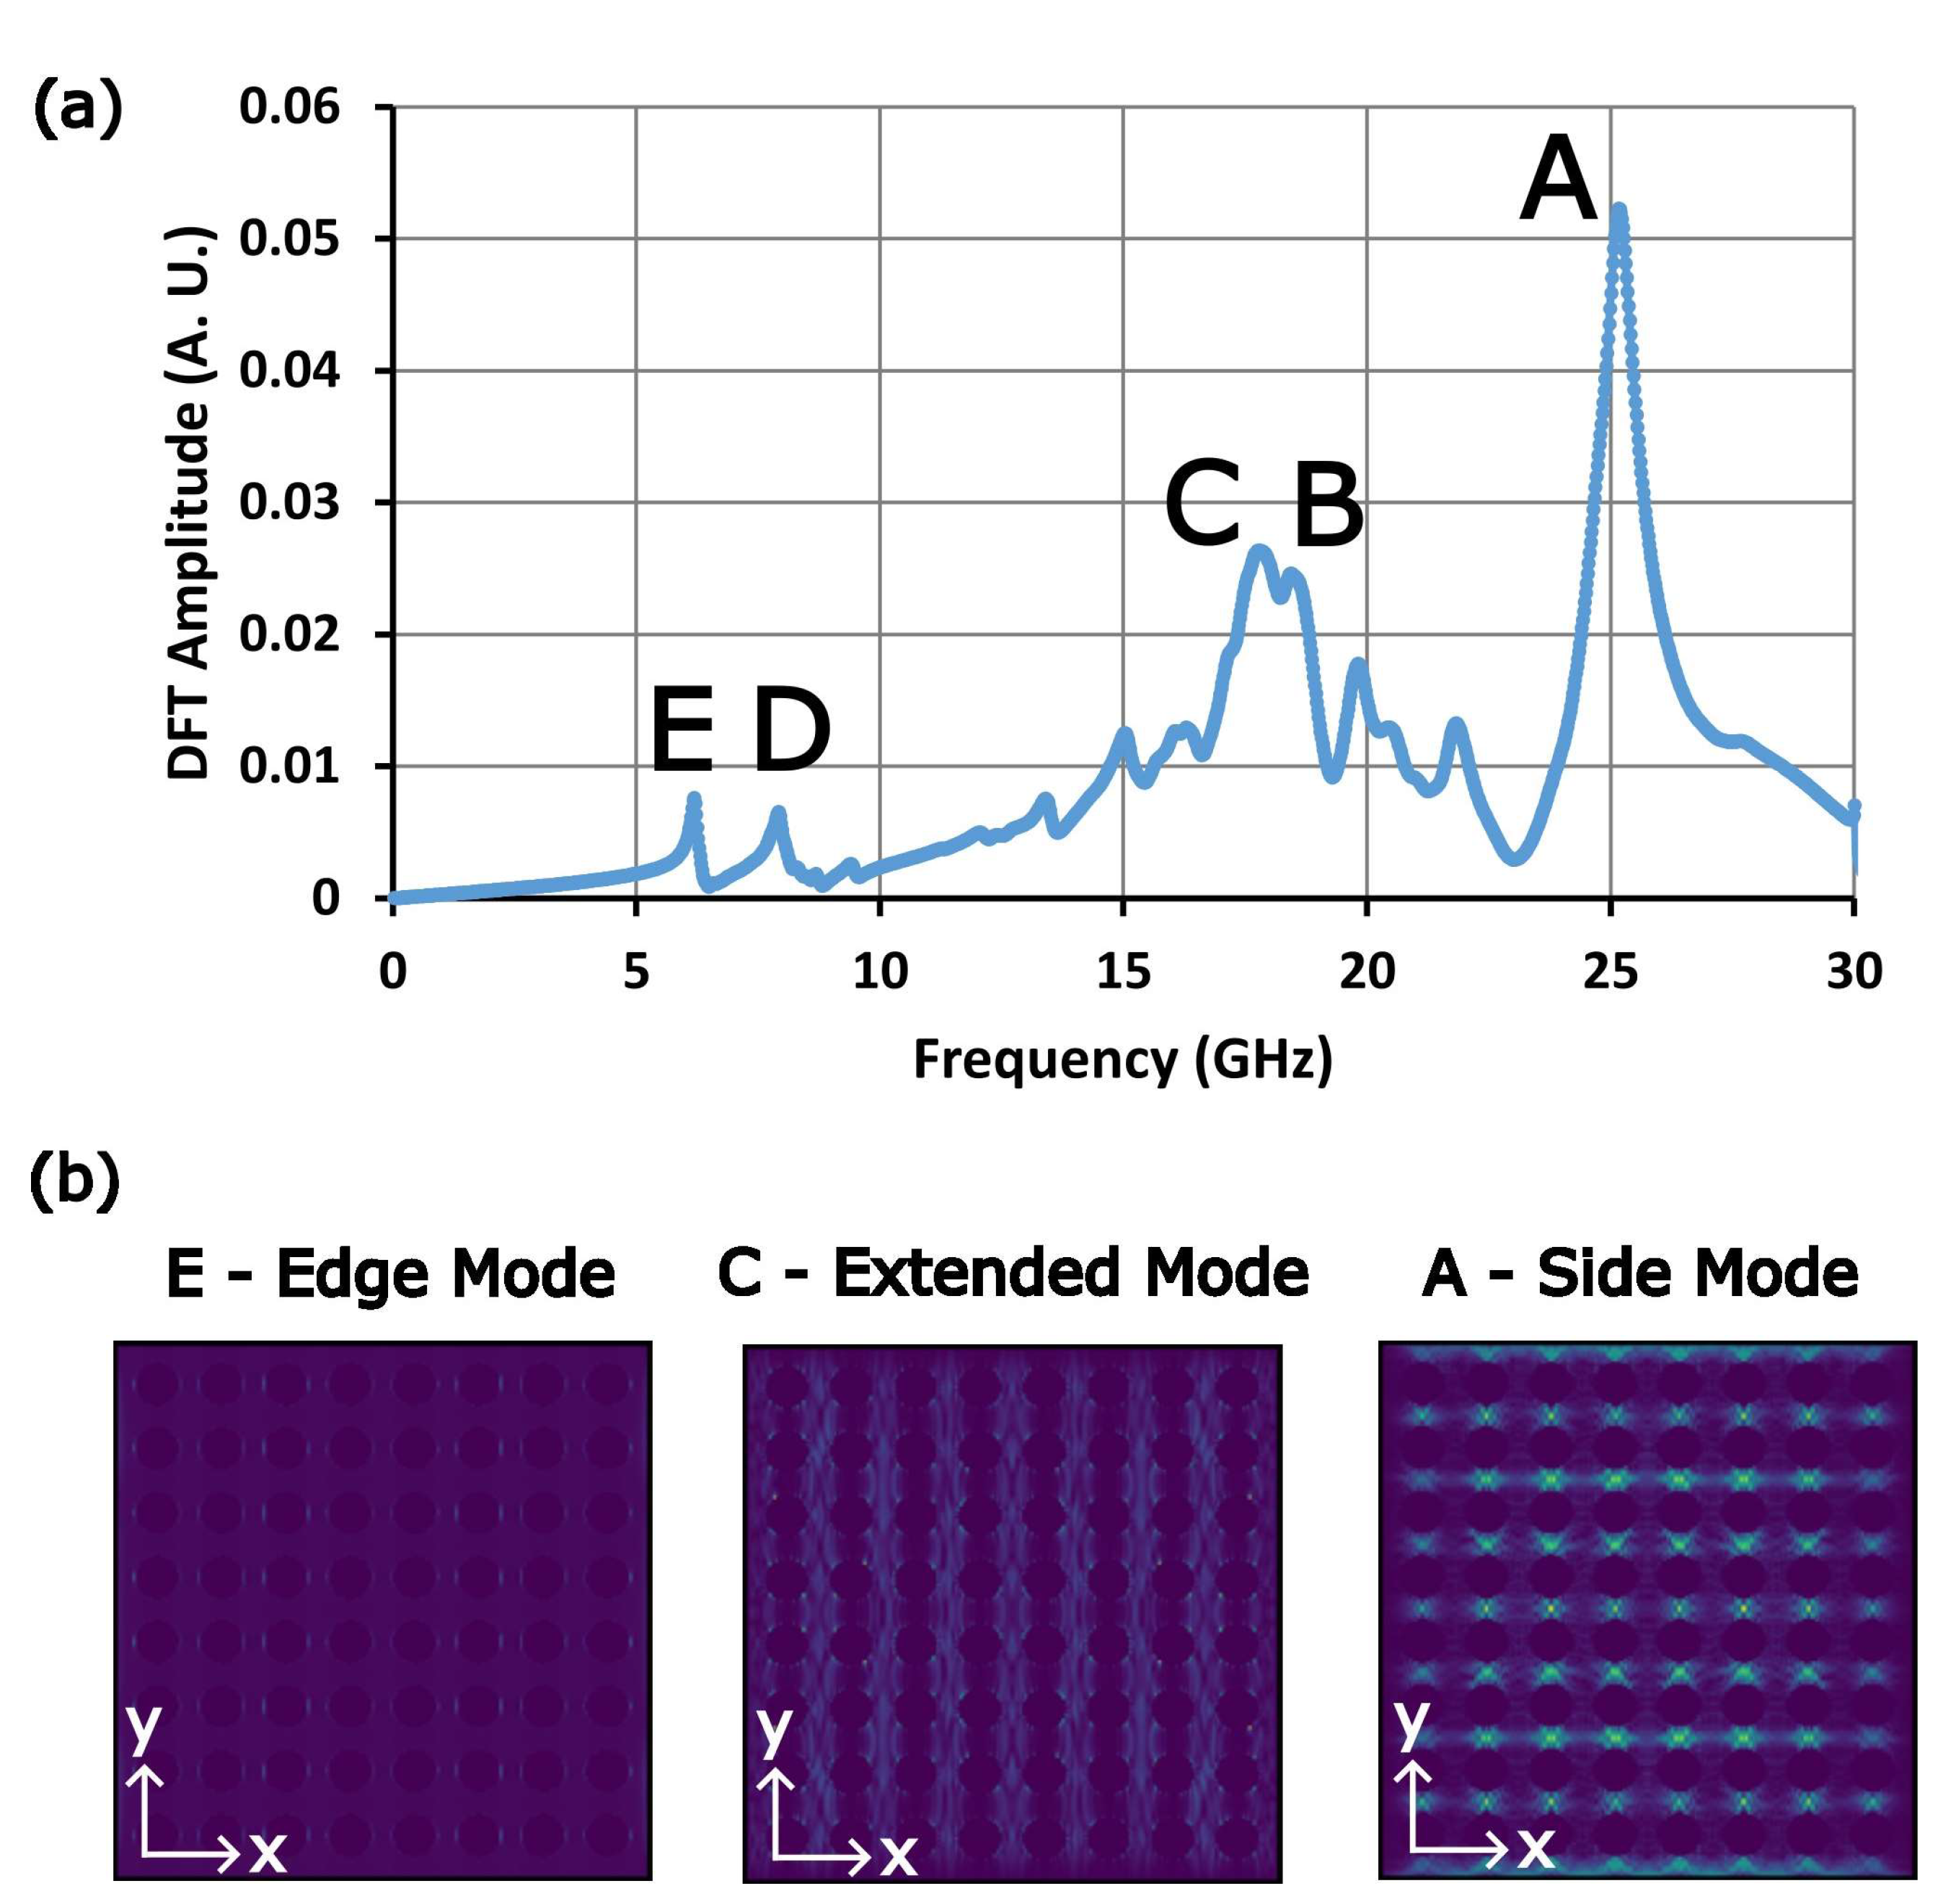
| A | 2962 | 2950 | −12 |
| B | 3713 | 3506 | −207 |
| C | 3893 | 3765 | −128 |
Disclaimer/Publisher’s Note: The statements, opinions and data contained in all publications are solely those of the individual author(s) and contributor(s) and not of MDPI and/or the editor(s). MDPI and/or the editor(s) disclaim responsibility for any injury to people or property resulting from any ideas, methods, instructions or products referred to in the content. |
© 2023 by the authors. Licensee MDPI, Basel, Switzerland. This article is an open access article distributed under the terms and conditions of the Creative Commons Attribution (CC BY) license (https://creativecommons.org/licenses/by/4.0/).
Share and Cite
Dowling, R.; Narkowicz, R.; Lenz, K.; Oelschlägel, A.; Lindner, J.; Kostylev, M. Resonance-Based Sensing of Magnetic Nanoparticles Using Microfluidic Devices with Ferromagnetic Antidot Nanostructures. Nanomaterials 2024, 14, 19. https://doi.org/10.3390/nano14010019
Dowling R, Narkowicz R, Lenz K, Oelschlägel A, Lindner J, Kostylev M. Resonance-Based Sensing of Magnetic Nanoparticles Using Microfluidic Devices with Ferromagnetic Antidot Nanostructures. Nanomaterials. 2024; 14(1):19. https://doi.org/10.3390/nano14010019
Chicago/Turabian StyleDowling, Reyne, Ryszard Narkowicz, Kilian Lenz, Antje Oelschlägel, Jürgen Lindner, and Mikhail Kostylev. 2024. "Resonance-Based Sensing of Magnetic Nanoparticles Using Microfluidic Devices with Ferromagnetic Antidot Nanostructures" Nanomaterials 14, no. 1: 19. https://doi.org/10.3390/nano14010019