
Plasma-Engineered CeOx Nanosheet Array with Nitrogen-Doping and Porous Architecture for Efficient Electrocatalysis

Key Laboratory of Liquid-Solid Structural Evolution and Processing of Materials of Ministry of Education, School of Materials Science and Engineering, Shandong University, Jinan 250061, China
*
Author to whom correspondence should be addressed.
Nanomaterials 2024, 14(2), 185; https://doi.org/10.3390/nano14020185
Submission received: 13 December 2023
/
Revised: 8 January 2024
/
Accepted: 10 January 2024
/
Published: 13 January 2024
(This article belongs to the Special Issue Modification Strategies on Engineering Electrocatalysts Related to Nanomaterials)
Abstract
:Surface engineering has been proved efficient and universally applicable in improving the performance of CeO2 in various fields. However, previous approaches have typically required high-temperature calcination or tedious procedures, which makes discovery of a moderate and facile modification approach for CeO2 an attractive subject. In this paper, porous CeO2 nanosheets with effective nitrogen-doping were synthesized via a low-temperature NH3/Ar plasma treatment and exhibited boosted hydrogen evolution reaction performance with low overpotential (65 mV) and long-term stability. The mechanism of the elevated performance was investigated by introducing Ar-plasma-treated CeO2 with no nitrogen-doping as the control group, which revealed the dominant role of nitrogen-doping by providing abundant active sites and improving charge transfer characteristics. This work illuminates further investigations into the surface engineering methodologies boosted by plasma and the relative mechanism of the structure–activity relationship.
1. Introduction
In recent years, with the increasing attention paid to environmental pollution and sustainable development issues, hydrogen energy has received widespread attention as a sustainable and clean substitute for fossil fuels by virtue of its high energy density and pollution-free combustion products [1,2,3,4]. Among various approaches for hydrogen production, electrocatalytic water splitting through hydrogen evolution reaction (HER) is believed to be a promising strategy with great application prospects and competitiveness [5,6,7]. The active electrode material, which dominantly determines the performance of the electrocatalytic devices, involves numerous kinds of emerging materials [5,6,7,8]. Noble metals, represented by Pt, have been universally acknowledged as excellent HER catalysts. However, the disadvantages of high cost, low long-term reliability, and limited reserves hinder their practical applications [9].
CeO2, as a common transition metal oxides catalyst, has two distinctive characteristics: one is that CeO2 prepared by conventional methods usually has a certain amount of oxygen vacancies (OVs), and the other is the flexible and reversible conversion between Ce3+ and Ce4+ oxidation states [10]. These two characteristics are conducive to achieving better electrocatalytic performance, but the low concentration of naturally generated Ce3+ and OVs always restrict the performance improvement of CeO2-based electrocatalysts [11]. Considering the heterogeneous reactions that take place on the surface of active materials, surface engineering has been applied as a popular approach to boost the catalytic activity of CeO2 [10,12,13,14,15]. Among various surface engineering strategies, doping can effectively boost activity through the regulation of the electronic structure and the chemical bonding conditions. In regard to oxides, nitrogen-doping has attracted special interest and has been confirmed beneficial in three aspects as follows: (1) the incorporation of nitrogen facilitates electron transfer and drives down the Schottky barrier between catalyst and electrolyte, thereby lowering the HER overpotential [16]; (2) the adsorption/desorption energy of reaction intermediates can be regulated by the injected N element, hence improving the reaction kinetics [17]; (3) the lower electronegativity of doped N element can raise the percentage of covalent bonds, leading to the enhancement of environmental, chemical, and structural stability, hence strengthening corrosion resistance to acidic or alkali solutions [18]. In addition, morphology modification is another common strategy which affects active reaction area, ion transfer, and surface energy. Porous structures with adequate active reaction sites and facilitated ion transfer characteristics are typically thought to be advantageous for electrocatalysis [19,20]. Previous studies have demonstrated that the fabrication of porous structure and the introduction of nitrogen-doping can significantly improve the electrochemical performance of CeO2. However, the strategies reported always entail calcination at high temperatures [21,22], which is prone to cause agglomeration in the pristine nanostructure and produce detrimental impacts on the final performance.
In this study, NH3/Ar plasma treatment was implemented to conduct surface engineering on hydrothermally constructed CeO2 nanosheets. Profiting from the energetic and activated plasma, porous CeO2 nanosheets with effective nitrogen-doping were produced at a low temperature. To validate the synergistic effect of etching and nitrogen-doping, systematic characterizations, encompassing morphology, phase, electron structure, and HER performance, were conducted on CeO2 nanosheets before/after NH3/Ar or pure Ar plasma treatment. Additionally, the mechanism underlying the superior HER performance was explored. Our work not only introduces a facile method to develop high-activity materials, but also reveals the mechanism in a kinetic thermodynamic view, which provides a valuable basis for future research on surface engineering with excellent catalytic performance.
2. Materials and Methods
Scheme 1 depicts the fabrication procedures, which include the hydrothermal process and subsequent plasma treatment.
2.1. Direct Growth of CeO2 Nanosheets on Ni Foam
Ni foam was cut into pieces with a fixed size of 2 cm × 3 cm which were ultrasonically cleaned for 15 min each with acetone, ethanol, and deionized water. Subsequently, the Ni foam substrates were soaked in 2M HCl for 10 min to etch the oxide layer and finally cleaned several times until the pH was neutral before storing in ethanol for further use.
CeO2 nanosheets were grown in situ on nickel foams via a hydrothermal method. In detail, 0.7 mmol Ce(NO3)3·6H2O, 3.5 mmol urea, and 2.8 mmol NH4F were dissolved in 35 mL distilled water under magnetic stirring in a 70 mL Teflon-lined stainless-steel autoclave. A piece of pre-cleaned Ni foam was transferred into the autoclave and immersed into the mixed solution. After being heated in an electric oven at 120 °C for 5 h and naturally cooled down to room temperature, the autoclave was unsealed to take out the Ni foam. In order to remove the residual solution and weakly adhered powder on the surface, the Ni foam was thoroughly washed with deionized water under ultrasonication and dried at 70 °C for 6 h. Afterwards, the samples were annealed in air at 500 °C for 2 h to transform the Ce-precursor into CeO2. The mass loading of CeO2 was determined to be approximately 8.3 mg/cm2 by comparing the mass difference before and after deposition. As a control experiment, a bare Ni foam received the same heat treatment.
2.2. Plasma-Induced Fabrication of N-Doped CeOx
The N-doped CeO2 nanosheets were fabricated through treating samples in the NH3/Ar (NH3:Ar = 1:9) plasma induced by a 13.56 MHz radio frequency (RF) source. Firstly, the Ni foam assembled with CeO2 nanosheets was fixed vertically in the plasma reactor chamber, which was vacuumed until achieving a base pressure of 1 × 10⁻⁵ Pa. Then, the pressure of the chamber was adjusted by controlling the NH3/Ar gas flow and stabilized at 40 ± 1 Pa. The RF plasma process was operated at a working power of 250 W. The doping amount of N and the plasma etching effect could be controlled by regulating the heating temperature and RF time. The N-doped CeO2 nanosheets obtained via plasma-induced fabrication were denoted as N-CeO2.
As control experiments, bare nickel foam after calcination was denoted as Ni foam. Bare nickel foam which had undergone the same calcination and RF plasma treatment as N-CeO2 was denoted as N-Ni foam. The CeO2 nanosheets treated by high-quality pure Ar plasma with the same parameters as N-CeO2 was denoted as Ar-CeO2.
2.3. Characterization
Scanning electron microscopy (SEM) was performed on an ultra-high-resolution field-emission scanning electron microscope (JEOL 7800F, from Tokyo, Japan). JEM-2100F (Tokyo, Japan) operated at an accelerating voltage of 200 kV and was used to capture transmission electron microscopy (TEM) pictures. The crystallographic structure was studied by analyzing X-ray diffraction (XRD) patterns recorded by a Rigaku D/Max-KA diffractometer (Bruker from Billerica, Mass., USA), which was equipped with Cu Kα radiation (λ = 1.5418 Å). The chemical composition and valence state were characterized by X-ray photoelectron spectra (XPS) conducted on an Axis Supra (Kratos from Manchester, UK) using Mg Kα radiation of 1253.6 eV.
2.4. Electrochemical Measurements
An IVIUM Vertax (Eindhoven, Netherlands) electrochemical workstation was applied to perform the electrochemical measurements. The electrochemical performances were studied via a series of electrochemical testing approaches in a three-electrode system composed of a sample (working electrode), platinum (counter electrode), and the Hg/HgO (reference electrode) in 1.0 M KOH aqueous electrolyte at room temperature.
The performances of electrocatalytic hydrogen evolution were evaluated by the linear sweep voltammetry (LSV) method. The as-measured potential (EHg/HgO), which used the Hg/HgO electrode as the reference, was transformed into the potential versus the reversible hydrogen electrode (RHE) using the following formula: ERHE = EHg/HgO + 0.0591 × pH + 0.098.
Electrochemical impedance spectroscopy (EIS) was recorded at an over potential of 100 mV (vs. RHE) in a frequency range of 100 kHz ~ 0.01 Hz with a constant amplitude of 5 mV. The electrochemical active surface areas (EASA) of different electrodes were evaluated by the double layer capacitance values (Cdl), which were derived from fitting their CV curves in the potential range of −0.8 ~ 1.5 V at different scan rates (5 ~ 25 mV s−1). All tests were conducted without iR compensation.
3. Results and Discussion
3.1. Physicochemical Properties
According to previous reports, the effect of plasma treatment mainly depends on the RF time, heating temperature, plasma power, atmosphere, etc. [23,24,25]. In this work, in an effort to optimize the electrocatalytic performance of N-CeO2, the influence of RF time and heating temperature were chosen to be preferentially studied based on morphology characterization and systematic electrochemical testing (Overpotential, Tafel slope, Nyquist plot, Electrochemical active surface area). Finally, the optimal RF time and heating temperature were determined as 20 min and 300 °C, respectively (See Supporting Information Section S1 and S2 for detailed discussion). In the subsequent discussion, N-CeO2 refers in particular to CeO2 nanosheets plasma-treated at 300 °C for 20 min in NH3/Ar.
During the NH3/Ar plasma treatment, two mechanisms, including nitrogen-doping and etched porous structure, for improving catalytic activity were introduced simultaneously [19]. In order to distinguish the contribution of each mechanism in the HER performance, a CeO2 nanosheet array treat in pure Ar gas (Ar-CeO2) at the same temperature and time was fabricated and set as the control group, since an identical etching effect accompanied with no nitrogen-doping was involved. In order to figure out the influence of plasma on the morphology, field-emission scanning electron microscopy (FESEM) images of pristine CeO2, Ar-CeO2, and N-CeO2 were recorded (Figure 1). For pristine CeO2, homogeneous nanosheets with a diameter of ~1 μm and rough edge were vertically assembled on an Ni framework. After plasma treatment in pure Ar, the nanosheets basically maintained the origin morphology at low magnification. But detailed scope shows a porous and cracked structure under the bombardment of plasma-induced energetic particles, especially for the edge area with barely linked nanoparticles. N-CeO2 displays an identical porous structure and broken edge to Ar-CeO2, revealing a comparable etching effect. The TEM image of N-CeO2 (Figure 1c3) also displays porous structure with a pore diameter of 10–30 nm. The high-resolution TEM (HRTEM) image (Figure 1c4) exhibits an interplanar distance of 0.21 nm, which can be ascribed to the (044) facet of CeO2. The calibration of the selected-area electron diffraction (SAED) pattern (inset of Figure 1c4) further confirms the composition.
In order to discover the effect of plasma treatment on the crystal phase, X-ray diffraction (XRD) characterizations were conducted on CeO2, Ar-CeO2, and N-CeO2 for comparison. As illustrated in Figure 2a, all samples show identical patterns with major peaks fitting well with Ni and NiO, which originate from the Ni foam substrate. The abnormal signal of NiO was caused by the oxidation of Ni during the calcination in air. In addition to the standard pattern of Ni and NiO, one peak located at 29.3° can be detected in the XRD pattern of CeO2, which is in good accordance with the characteristic signal from (111) crystal planes in the fluorite structure (face-centered cubic, FCC) of CeO2 crystal with an Fm-3m space group (PDF #34-0394). The strong intensity and narrow width of the peak indicates the considerable loading mass and good crystallinity of CeO2. However, the characteristic peak cannot be detected in the XRD patterns of Ar-CeO2 and N-CeO2. Since the SEM images in Figure 1 have confirmed the identical distribution of CeO2 nanosheets, the absence of an XRD peak can be ascribed to the low crystallinity caused by the plasma bombardment, which disrupts the long-range order of the lattice. Detailed investigation was carried out based on the magnified patterns within a diffraction angle of 24°–34°, as shown in Figure S5. After the Ar plasma etching, the original (111) peak collapses into a weak bump, which can barely be identified from the background. The central position of the signal seems to show a slight shift towards lower angle direction, implying an expansion of the lattice after plasma treatment, which can be attributed to the repulsive power of charged OVs. Compared to Ar-CeO2, the more recognizable bump of N-CeO2 can possibly be attributed to the relatively lower ionization capability of NH3, which weakened the etching effect of plasma. In addition, a reverse shift in the bump towards a high-angle direction was observed and can be explained by the injected nitrogen atoms, which are able to consume the electrons previously located at the OVs and, thus, to some extent eliminate the repulsive effect on the lattice and recover the pristine lattice constant.
Since the electron transportation from OVs or doped nitrogen atoms to adjacent Ce atoms directly changes the electronic structure, X-ray photoelectron spectroscopy (XPS) was applied as an effective approach in our investigation. The wide XPS survey spectra of CeO2, Ar-CeO2, and N-CeO2 (Figure S6) confirm the identical element composition of Ce and O for all samples, except for the detection of N in the spectrum of N-CeO2 with a considerable concentration of 11.7%. The introduced N element was further analyzed by the high-resolution N 1s spectrum, which can be deconvoluted into two characteristic peaks (Figure 2b). The sharp peak centered at 397.6 eV corresponds to the chemical bonding between Ce and incorporated N (Ce-N), while the broad one originates from the absorbed N2 (N≡N) [26,27]. The Ce-N confirms that N elements were successfully introduced into the CeO2 lattice.
Previous reports have proved that plasma-induced etching and doping are prone to create OVs on the surface of metal oxides, which usually plays an important role in achieving superior performance [28,29,30]. Therefore, the high-resolution O 1s and Ce 3d spectra of CeO2, Ar-CeO2, and N-CeO2 were investigated (Figure 2c–f). As depicted in Figure 2c, the O 1s XPS spectra of all samples display three deconvoluted peaks at O1, O2, and O3 with binding energy values of ~529.2, ~530.7, and ~532.1 eV. The O1 peak represents the Ce–O bond and the O2 peak is assigned to the OVs, whereas the surface-adsorbed hydroxyl groups are responsible for the O3 peak [31]. Therefore, the concentration of OVs can be evaluated by the ratio of the peak area of O2 in the total peak area of (O1 + O2 + O3). According to the fitted spectra in Figure 2c, the proportion of O2 in Ar-CeO2 (51.83%) and N-CeO2 (77.89%) is obviously higher than that in CeO2 (25.58%), suggesting that extra OVs are generated during the plasma treatment. The highest OV concentration in N-CeO2 can be explained as follows. When lattice O atoms escape from the lattice, they leave previously bound electrons in the oxide and form charged OVs, which create localized electron fields and set extra constraint on the neighboring O atoms. Therefore, the detachment of O atoms becomes harder with the increasing concentration of OVs. When it comes to N-CeO2, the released electrons can be consumed by the injected N atoms, thus weakening the electron fields and producing more OVs.
The formation of OVs in metal oxides is usually accompanied by the generation of metal ions with lower valence states [32], so the Ce 3d spectra CeO2, Ar-CeO2, and N-CeO2 were also recorded for comparison. As shown in Figure 2d–f, all Ce 3d spectra can be deconvoluted into two sets of overlapped peaks. The peaks corresponding to Ce3+ are labeled with α, β, and β′, while peaks related to Ce4+ are denoted as v, u, and u′ [33]. The concentration of Ce3+ can be estimated by the peak area ratio of Ce3+-related peaks to all fitted peaks, which was calculated to be 65.8%, 78.3%, and 62.1% for CeO2, Ar-CeO2, and N-CeO2, respectively. The increased concentration of Ce3+ in Ar-CeO2 is in accord with the previously discussed OVs. However, the amount of Ce3+ in N-CeO2 sharply decreased, which is inconsistent with the highest content of OVs. The low concentration can be explained by the bonding between N and Ce, which promotes the transition from Ce3+ to Ce4+.
3.2. HER Performance
The electrocatalytic capability of CeO2, Ar-CeO2, and N-CeO2 toward HER was evaluated by three key indexes (overpotential, Tafel slope, and long-term durability), whereas Ni foam and N-Ni foam were also involved to avoid interference from the substrate.
Firstly, overpotential, which represents the actual voltage required to reach a certain current density that exceeds the theoretical voltage, was investigated by a linear sweep voltammetry (LSV) test. As presented in Figure 3a, bare Ni foam displays unsatisfactory performance with a large overpotential of 370 mV at the current density of 10 mA/cm2, while the hydrothermal growth of CeO2 nanosheets improves the performance by reducing the overpotential to 230 mV, which indicates that CeO2 nanosheets have considerable catalytic activity towards HER. Contrary to our expectations, Ar-CeO2 with abundant OVs and Ce3+ exhibits an almost overlapping LSV curve over that of CeO2 at low potential range and shows the same value of overpotential, indicating that OVs and Ce3+ are not able to perform well as active HER sites in Ar-CeO2. Favorably, N-CeO2 achieves the lowest overpotential of 65 mV, indicating its superior HER activity. Meanwhile, N-Ni foam displays a lower overpotential (~200 mV) than untreated Ni foam. Although both N-Ni foam and N-CeO2 receive decreased overpotential, the effect of NH3/Ar-plasma treatment is much more obvious on CeO2. Considering the fact that most of substrate is covered by the assembled CeO2 nanosheets, it is reasonable to draw the conclusion that the superior overpotential of N-CeO2 mainly originates from nitrogen-doping sites, which are capable of catalyzing HER.
Tafel slope is a crucial metric in evaluating the kinetic characteristics of reactions and the activity of electrochemical catalysts. Normally, catalysts with a lower Tafel slope are believed to have higher activity and better ability to accelerate the reaction rate. Based on the linear part in the low potential range of the LSV plots (Figure 3a), the Tafel slope of each sample can be acquired through linear fitting in the coordinate system of log|j|–overpotential (Figure 3b). In a general view, electrodes with CeO2 loading show a lower Tafel slope than bare Ni foam, whether before or after plasma treatment, demonstrating the superior HER dynamics of CeO2. The values of Tafel slopes are in the range of 110–150 mV/dec for all CeO2-involved samples, indicating the Volmer–Heyrovsky mechanism. Among them, N-CeO2 achieves the lowest Tafel slope of 109.2 mV/dec, which is much better than the similar values of CeO2 (142.7 mV/dec) and Ar-CeO2 (141.4 mV/dec), confirming its superior HER dynamics.
Long-term durability, as a crucial factor to evaluate the practicality of electrocatalysts, was investigated through chronopotentiometric testing at different current densities. As can be seen in Figure 3c, all CeO2-involved samples were tested at the current densities of 10, 20, and 40 mA/cm2, with each current density for 4 h. During the 12 h testing time, the voltage of all samples remained almost steady at each current density level. Significantly, the overpotential of N-CeO2 remained an apparent advantage at each current level during the whole test. In order to verify the influence of long-term testing, the LSV plot of N-CeO2 was recorded after the test and compared with the initial plot in Figure 3d. The LSV plot after the test shows a slight shift towards a negative potential direction and gains an increased overpotential of ~90 mV, which is acceptable as an experimental electrode. The morphology of N-CeO2 remains a porous nanosheet array, indicating that the larger overpotential is not due to structure collapse.
At last, the performance of our N-CeO2 was compared with previously reported HER catalysts, most of which are CeO2-based materials [34,35,36,37,38,39,40,41,42]. As listed in Table 1, the overpotential and Tafel slope of N-CeO2 are superior or comparable to most of the previously developed CeO2-based catalysts, even when they are incorporated with other functional substance which may improve their conductivity or directly act as active components. Notably, Co4N-CeO2 and CoP-CeO2 exhibit extremely low overpotentials and Tafel slopes, which can be ascribed to the difference in their main active species and HER mechanisms. This mechanism can be judged from the low Tafel values of 61 mV/dec and 45 mV/dec, corresponding to the Heyrovsky or Tafel-rate-determining mechanism, respectively [39,40]. If these active substances were compounded with our N-CeO2 instead of normal CeO2, the HER performance would probably improve to the next level, considering the boosted performance of N-CeO2.
3.3. Mechanism Study
Previous reports indicate that N-CeO2 is primarily affected by NH3/Ar plasma treatment in three ways: (1) creating porous structure and expanding active surface area; (2) introducing oxygen vacancies; (3) injecting nitrogen-dopant into CeO2 lattice. The first two effects also work on Ar-CeO2. In Section 3.2, the key role of N-doping and its leading contribution to the HER performance of N-CeO2 have been confirmed by comparative investigation, but its working mechanism is still unknown. To solve this problem, electrochemical active surface areas (EASA) and Nyquist tests were conducted.
Firstly, the EASA tests were performed to evaluate the effect of etching and nitrogen -doping on the activation of reaction sites. The CV curves of various samples were recorded in the non-faradic regions (1.02–1.12 V) at various scan rates (5–25 mV/s), as illustrated in Figure S7. By linear fitting the anode current densities on each group of CV curves, the slopes of all sample were obtained in the coordinate system of scan rate vs. current density (Figure 4a). The EASA of each electrode is represented by the obtained slope in the form of double-layer capacitance since the double-layer capacitance is in direct ratio. Among all samples, the low EASA values of Ni foam and N-Ni foam are consistent with expectations, However, the sharply decreased EASA from 19.69 mF/cm2 (for CeO2) to 3.61 mF/cm2 (for Ar-CeO2) is unexpected, since the generation of a porous structure should create abundant extra sites. The “collapsed” EASA could be explained as follows. The etching effect of plasma indeed creates more exposed sites, but these sites are incapable of catalyzing the HER reaction, making them “inactive” sites. In that case, the disappointing HER performance of Ar-CeO2 is understandable. In regard to N-CeO2, although a similar etching effect of plasma passivates the surface sites, the nitrogen injection effectively activates some of the reaction sites and endows them with higher activity. Therefore, a superior HER performance can be achieved by N-CeO2 with a relatively lower EASA (15.28 mF/cm2).
Secondly, charge transfer behavior is also important for electrocatalysis, especially for semiconductors, such as N-CeO2. Thus, EIS characterization was conducted in a three-electrode system to study electron transportation behavior. As displayed in Figure 4b, the high-frequency part of each Nyquist plot differs significantly from each other in the diameter of the semicircle, which represents different charge transfer resistances (Rct). The largest Rct value for Ni foam can be attributed to the surface oxidation during calcination at 500 °C. The Rct of CeO2, Ar-CeO2, and N-CeO2 were determined to be 121.3 Ω, 193.5 Ω, and 2.1 Ω, respectively. The increased Rct of Ar-CeO2 can be ascribed to the hindered charge transfer between electrode and electrolyte. As can be seen from the extremely low Rct value of N-CeO2, nitrogen-doping effectively facilitates charge transfer, which also promotes the improvement in HER performance.
Above all, nitrogen incorporation, which activates surface reaction sites and facilitates charge transfer, plays the dominant role in achieving superior HER performance.
4. Conclusions
In summary, this work successfully developed nitrogen-doped CeO2 nanosheet arrays through low-temperature NH3/Ar plasma treatment and achieved an obviously improved HER performance. The systematic design of control groups and characterizations on reaction kinetics confirm the critical role of introducing nitrogen-doping, which promotes electron transfer and generates abundant electroactive sites. As a consequence, the optimized N-CeO2 electrode possessed a decreased overpotential of 65 mV vs. RHE at 10 mA/cm2 as well as a smaller Tafel slope of 109.2 mV/dec. Meanwhile, the N-CeO2 electrode also performed well in the long-term durability test. Given these properties, the as-constructed N-CeO2 electrode is superior to most of the reported CeO2-based HER catalysts. We believe this work not only introduces a favorable pathway for the modification of high-performance catalysts, but also offers a deeper understanding of the working mechanism of multiple influencing factors.
Supplementary Materials
The following supporting information can be downloaded at: https://www.mdpi.com/article/10.3390/nano14020185/s1, Figure S1: SEM images of CeO2 nanosheets plasma-treated at 300 °C for different duration; Figure S2: (a) LSV curves, (b) Tafel plots, (c) EASA test and (d) Nyquist plots for CeO2 nanosheets plasma-treated at 300 °C for different duration; Figure S3: SEM images of CeO2 nanosheets plasma-treated for 20 min at different heating temperature; Figure S4: (a) LSV curves, (b) Tafel plots, (c) EASA test and (d) Nyquist plots for CeO2 nanosheets plasma-treated for 20 min at different heating temperature; Figure S5: Magnified XRD patterns within the diffraction angle of 24°–34°; Figure S6: Wide XPS survey spectra of CeO2, Ar-CeO2, and N-CeO2; Figure S7: CV curves under different scan rates (5–25 mV/s).
Author Contributions
Conceptualization, Q.W.; Data curation, Z.W. and T.L.; Formal analysis, Z.W. and Q.W.; Funding acquisition, Z.W. and Q.W.; Investigation, Z.W. and T.L.; Methodology, Z.W.; Project administration, Q.W.; Resources, Z.W.; Software, T.L.; Supervision, Q.W.; Validation, Z.W.; Visualization, Z.W. and T.L.; Writing—original draft, Z.W.; Writing—review and editing, Q.W. All authors have read and agreed to the published version of the manuscript.
Funding
This research was funded by the National Natural Science Foundation of China (No. 51702188, No. 51502159), the Shandong Provincial Natural Science Foundation (No. ZR2022ME222, ZR2023ME013), the Young Scholars Program of Shandong University (No. 2018WLJH25).
Data Availability Statement
The data presented in this study are available on request from the corresponding author.
Conflicts of Interest
The authors declare no conflicts of interest.
References
- Li, Y.; Suryadi, B.; Yan, J.; Feng, J.; Bhaskoro, A.G.A. strategic roadmap for ASEAN to develop hydrogen energy: Economic prospects and carbon emission reduction. Inter. J. Hydrogen Energ. 2023, 48, 11113–11130. [Google Scholar] [CrossRef]
- Liu, G. Forward perspective on the development and strategic pathway of green hydrogen in China. Clean Energy 2023, 7, 1–7. [Google Scholar] [CrossRef]
- Zhou, Y.; Li, R.; Lv, Z.; Liu, J.; Zhou, H.; Xu, C. Green hydrogen: A promising way to the carbon-free society. Chin. J. Chem. Eng. 2022, 43, 2–13. [Google Scholar] [CrossRef]
- Zhao, X.; Liu, M.; Wang, Y.; Xiong, Y.; Yang, P.; Qin, J.; Xiong, X.; Lei, Y. Designing a built-in electric gield for efficient energy electrocatalysis. ACS Nano 2022, 16, 19959–19979. [Google Scholar] [CrossRef]
- Zhang, Z.; Liu, P.; Song, Y.; Hou, Y.; Xu, B.; Liao, T.; Zhang, H.; Guo, J.; Sun, Z. heterostructure engineering of 2D superlattice materials for electrocatalysis. Adv. Sci. 2022, 9, e2204297. [Google Scholar] [CrossRef]
- Zhao, X.; Levell, Z.H.; Yu, S.; Liu, Y. Atomistic understanding of two-dimensional electrocatalysts from first principles. Chem. Rev. 2022, 122, 10675–10709. [Google Scholar] [CrossRef]
- Liu, F.; Cai, X.; Tang, Y.; Liu, W.; Chen, Q.; Dong, P.; Xu, M.; Tan, Y.; Bao, S. Nano-Ni-induced electronic modulation of MoS2 nanosheets enables energy-saving H2 production and sulfide degradation. Energy Environ. Mater. 2023, 0, e12644. [Google Scholar] [CrossRef]
- Zhang, F.; Chen, J.; Yang, J. Fiber materials for electrocatalysis applications. Adv. Fiber Mater. 2022, 4, 720–735. [Google Scholar] [CrossRef]
- You, B.; Tang, M.T.; Tsai, C.; Abild-Pedersen, F.; Zheng, X.; Li, H. Enhancing electrocatalytic water splitting by strain engineering. Adv. Mater. 2019, 31, e1807001. [Google Scholar] [CrossRef]
- Zheng, X.; Li, Y.; Zhang, L.; Shen, L.; Xiao, Y.; Zhang, Y.; Au, C.; Jiang, L. Insight into the effect of morphology on catalytic performance of porous CeO2 nanocrystals for H2S selective oxidation. Appl. Catal. B Environ. 2019, 252, 98–110. [Google Scholar] [CrossRef]
- Li, T.; Wang, Q.; Wang, Z. Oxygen Vacancy Injection on (111) CeO2 Nanocrystal Facets for Efficient H2O2 Detection. Biosensors 2022, 12, 592. [Google Scholar] [CrossRef] [PubMed]
- Spezzati, G.; Benavidez, A.D.; DeLaRiva, A.T.; Su, Y.; Hofmann, J.P.; Asahina, S.; Olivier, E.J.; Neethling, J.H.; Miller, J.T.; Datye, A.K.; et al. CO oxidation by Pd supported on CeO2(100) and CeO2(111) facets. Appl. Catal. B Environ. 2019, 243, 36–46. [Google Scholar] [CrossRef]
- Wang, M.; Shen, M.; Jin, X.; Tian, J.; Li, M.; Zhou, Y.; Zhang, L.; Li, Y.; Shi, J. Oxygen vacancy generation and stabilization in CeO2–x by Cu introduction with improved CO2 photocatalytic reduction activity. ACS Catal. 2019, 9, 4573–4581. [Google Scholar] [CrossRef]
- Wang, Z.; Huang, Z.; Brosnahan, J.T.; Zhang, S.; Guo, Y.; Guo, Y.; Wang, L.; Wang, Y.; Zhan, W. Ru/CeO2 catalyst with optimized CeO2 support morphology and surface facets for propane combustion. Environ. Sci. Technol. 2019, 53, 5349–5358. [Google Scholar] [CrossRef]
- Su, Z.; Yang, W.; Wang, C.; Xiong, S.; Cao, X.; Peng, Y.; Si, W.; Weng, Y.; Xue, M.; Li, J. Roles of oxygen vacancies in the bulk and surface of CeO2 for toluene catalytic combustion. Environ. Sci. Technol. 2020, 54, 12684–12692. [Google Scholar] [CrossRef] [PubMed]
- Chen, P.; Xu, K.; Fang, Z.; Tong, Y.; Wu, J.; Lu, X.; Peng, X.; Ding, H.; Wu, C.; Xie, Y. Metallic Co4N porous nanowire arrays activated by surface oxidation as electrocatalysts for the oxygen evolution reaction. Angew. Chem. Int. Ed. Engl. 2015, 54, 14710–14714. [Google Scholar] [CrossRef] [PubMed]
- Hinnemann, B.; Moses, P.G.; Bonde, J.; Jørgensen, K.P.; Nielsen, J.H.; Horch, S.; Chorkendorff, I.; Nørskov, J.K. Biomimetic hydrogen evolution: MoS2 nanoparticles as catalyst for hydrogen evolution. J. Am. Chem. Soc. 2005, 127, 5308–5309. [Google Scholar] [CrossRef]
- Souza Filho, E.A.d.; Pieretti, E.F.; Bento, R.T.; Pillis, M.F. Effect of nitrogen-doping on the surface chemistry and corrosion stability of TiO2 films. J. Mater. Res. Technol. 2020, 9, 922–934. [Google Scholar] [CrossRef]
- Wang, Q.; Zhong, T.; Wang, Z. Plasma-Engineered N-CoOx Nanowire Array as a Bifunctional Electrode for Supercapacitor and Electrocatalysis. Nanomaterials 2022, 12, 2984. [Google Scholar] [CrossRef]
- Wang, H.; Liu, X.; Niu, P.; Wang, S.; Shi, J.; Li, L. Porous two-dimensional materials for photocatalytic and electrocatalytic applications. Matter 2020, 2, 1377–1413. [Google Scholar] [CrossRef]
- Yin, C.; Liu, Y.; Xia, Q.; Kang, S.; Li, X.; Wang, Y.; Cui, L. Oxygen vacancy-rich nitrogen-doped Co3O4 nanosheets as an efficient water-resistant catalyst for low temperature CO oxidation. J. Colloid Interface Sci. 2019, 553, 427–435. [Google Scholar] [CrossRef] [PubMed]
- Wang, Z.; Xu, W.; Chen, X.; Peng, Y.; Song, Y.; Lv, C.; Liu, H.; Sun, J.; Yuan, D.; Li, X.; et al. Defect-rich nitrogen doped Co3O4/C porous nanocubes enable high-efficiency bifunctional oxygen electrocatalysis. Adv. Funct. Mater. 2019, 29, 1902875. [Google Scholar] [CrossRef]
- Tang, J.; Su, C.; Shao, Z. Nonthermal plasma treatment for electrocatalysts structural and surface engineering. Energy Technol. 2022, 10, 2200235. [Google Scholar] [CrossRef]
- Li, D.; Xu, K.; Zhang, Y. A review on research progress in plasma-controlled superwetting surface structure and properties. Polymers 2022, 14, 3759. [Google Scholar] [CrossRef] [PubMed]
- Chen, Q.; Song, B.; Li, X.; Wang, R.; Wang, S.; Xu, S.; Reniers, F.; Lam, C.H. Enhancing the properties of photocatalysts via nonthermal plasma modification: Recent advances, treatment variables, mechanisms, and perspectives. Ind. Eng. Chem. 2021, 60, 16813–16826. [Google Scholar] [CrossRef]
- Liu, C.; Sun, H.; Qian, J.; Chen, Z.; Lv, Y.; Chen, F.; Lu, X.; Wu, Z. Biotemplating synthesis and photocatalytic activities of N-doped CeO2 microcapsule tailored by hemerocallis pollen. Adv. Powder Technol. 2017, 28, 2741–2746. [Google Scholar] [CrossRef]
- Kesarla, M.K.; Fuentez-Torres, M.O.; Alcudia-Ramos, M.A.; Ortiz-Chi, F.; Espinosa-González, C.G.; Aleman, M.; Torres-Torres, J.G.; Godavarthi, S. Synthesis of g-C3N4/N-doped CeO2 composite for photocatalytic degradation of an herbicide. J. Mater. Res. Technol. 2019, 8, 1628–1635. [Google Scholar] [CrossRef]
- Lei, X.; Wang, J.; Wang, T.; Wang, X.; Xie, X.; Huang, H.; Li, D.; Ao, Z. Toluene decomposition by non-thermal plasma assisted CoOx-gamma-Al2O3: The relative contributions of specific energy input of plasma, Co3+ and oxygen vacancy. J. Hazard. Mater. 2023, 456, 131613. [Google Scholar] [CrossRef]
- Yun, J.; Wu, L.; Hao, Q.; Teng, Z.; Gao, X.; Dou, B.; Bin, F. Non-equilibrium plasma enhanced oxygen vacancies of CuO/CeO2 nanorod catalysts for toluene oxidation. J. Environ. Chem. Eng. 2022, 10, 107847. [Google Scholar] [CrossRef]
- Jang, D.; Maeng, J.; Kim, J.; Han, H.; Park, G.H.; Ha, J.; Shin, D.; Hwang, Y.J.; Kim, W.B. Boosting electrocatalytic nitrate reduction reaction for ammonia synthesis by plasma-induced oxygen vacancies over MnCuOx. Appl. Surf. Sci. 2023, 610, 155521. [Google Scholar] [CrossRef]
- Lin, J.H.; Yan, Y.T.; Xu, T.X.; Qu, C.Q.; Li, J.; Cao, J.; Feng, J.C.; Qi, J.L. S doped NiCo2O4 nanosheet arrays by Ar plasma: An efficient and bifunctional electrode for overall water splitting. J. Colloid Interface Sci. 2020, 560, 34–39. [Google Scholar] [CrossRef]
- Wang, Q.; Li, M.; Wang, Z. Supercapacitive performance of TiO2 boosted by a unique porous TiO2/Ti network and activated Ti3+. RSC. Adv. 2019, 9, 7811–7817. [Google Scholar] [CrossRef] [PubMed]
- Wang, X.; Yang, Y.; Diao, L.; Tang, Y.; He, F.; Liu, E.; He, C.; Shi, C.; Li, J.; Sha, J.; et al. CeOx-decorated NiFe-layered double hydroxide for efficient alkaline hydrogen evolution by oxygen vacancy engineering. ACS Appl. Mater. Interf. 2018, 10, 35145–35153. [Google Scholar] [CrossRef]
- Sung, M.-C.; Lee, G.-H.; Kim, D.-W. CeO2/Co(OH)2 hybrid electrocatalysts for efficient hydrogen and oxygen evolution reaction. J. Alloys Compd. 2019, 800, 450–455. [Google Scholar] [CrossRef]
- Liu, M.; Ji, Z.; Shen, X.; Zhou, H.; Zhu, J.; Xie, X.; Song, C.; Miao, X.; Kong, L.; Zhu, G. An electrocatalyst for a hydrogen evolution reaction in an alkaline medium: Three-dimensional graphene supported CeO2 hollow microspheres. Eur. J. Inorg. Chem. 2018, 2018, 3952–3959. [Google Scholar] [CrossRef]
- Zhiani, M.; Kamali, S. Synergistic effect of ceria on the structure and hydrogen evolution activity of nickel nanoparticles grown on reduced graphene oxide. J. Mater. Chem. A 2017, 5, 8108–8116. [Google Scholar] [CrossRef]
- Sun, Z.; Zhang, J.; Xie, J.; Zheng, X.; Wang, M.; Li, X.; Tang, B. High-performance alkaline hydrogen evolution electrocatalyzed by a Ni3N–CeO2 nanohybrid. Inorg. Chem. Front. 2018, 5, 3042–3045. [Google Scholar] [CrossRef]
- Zhao, M.; Li, Y.; Dong, H.; Wang, L.; Chen, Z.; Wang, Y.; Li, Z.; Xia, M.; Shao, G. The effects of CeO2 nanorods and CeO2 nanoflakes on Ni–S alloys in hydrogen evolution reactions in alkaline solutions. Catalysts 2017, 7, 197. [Google Scholar] [CrossRef]
- Sun, H.; Tian, C.; Fan, G.; Qi, J.; Liu, Z.; Yan, Z.; Cheng, F.; Chen, J.; Li, C.P.; Du, M. Boosting activity on Co4N porous nanosheet by coupling CeO2 for efficient electrochemical overall water splitting at high current densities. Adv. Funct. Mater. 2020, 30, 1910596. [Google Scholar] [CrossRef]
- Zhang, R.; Ren, X.; Hao, S.; Ge, R.; Liu, Z.; Asiri, A.M.; Chen, L.; Zhang, Q.; Sun, X. Selective phosphidation: An effective strategy toward CoP/CeO2 interface engineering for superior alkaline hydrogen evolution electrocatalysis. J. Mater. Chem. A 2018, 6, 1985–1990. [Google Scholar] [CrossRef]
- Xu, L.; Zhang, F.-T.; Chen, J.-H.; Fu, X.-Z.; Sun, R.; Wong, C.-P. Amorphous NiFe nanotube arrays bifunctional electrocatalysts for efficient electrochemical overall water splitting. ACS Appl. Energ. Mater. 2018, 1, 1210–1217. [Google Scholar] [CrossRef]
- Chen, L.; Yang, S.; Qian, K.; Wei, W.; Sun, C.; Xie, J. In situ growth of N-doped carbon coated CoNi alloy with graphene decoration for enhanced HER performance. J. Energ. Chem. 2019, 29, 129–135. [Google Scholar] [CrossRef]
Scheme 1.
Schematic diagram of the fabrication procedures.

Figure 1.
SEM images of (a1,a2) pristine CeO2, (b1,b2) Ar-CeO2, (c1,c2) N-CeO2. (c3,c4) HRTEM images of N-CeO2.
Figure 1.
SEM images of (a1,a2) pristine CeO2, (b1,b2) Ar-CeO2, (c1,c2) N-CeO2. (c3,c4) HRTEM images of N-CeO2.
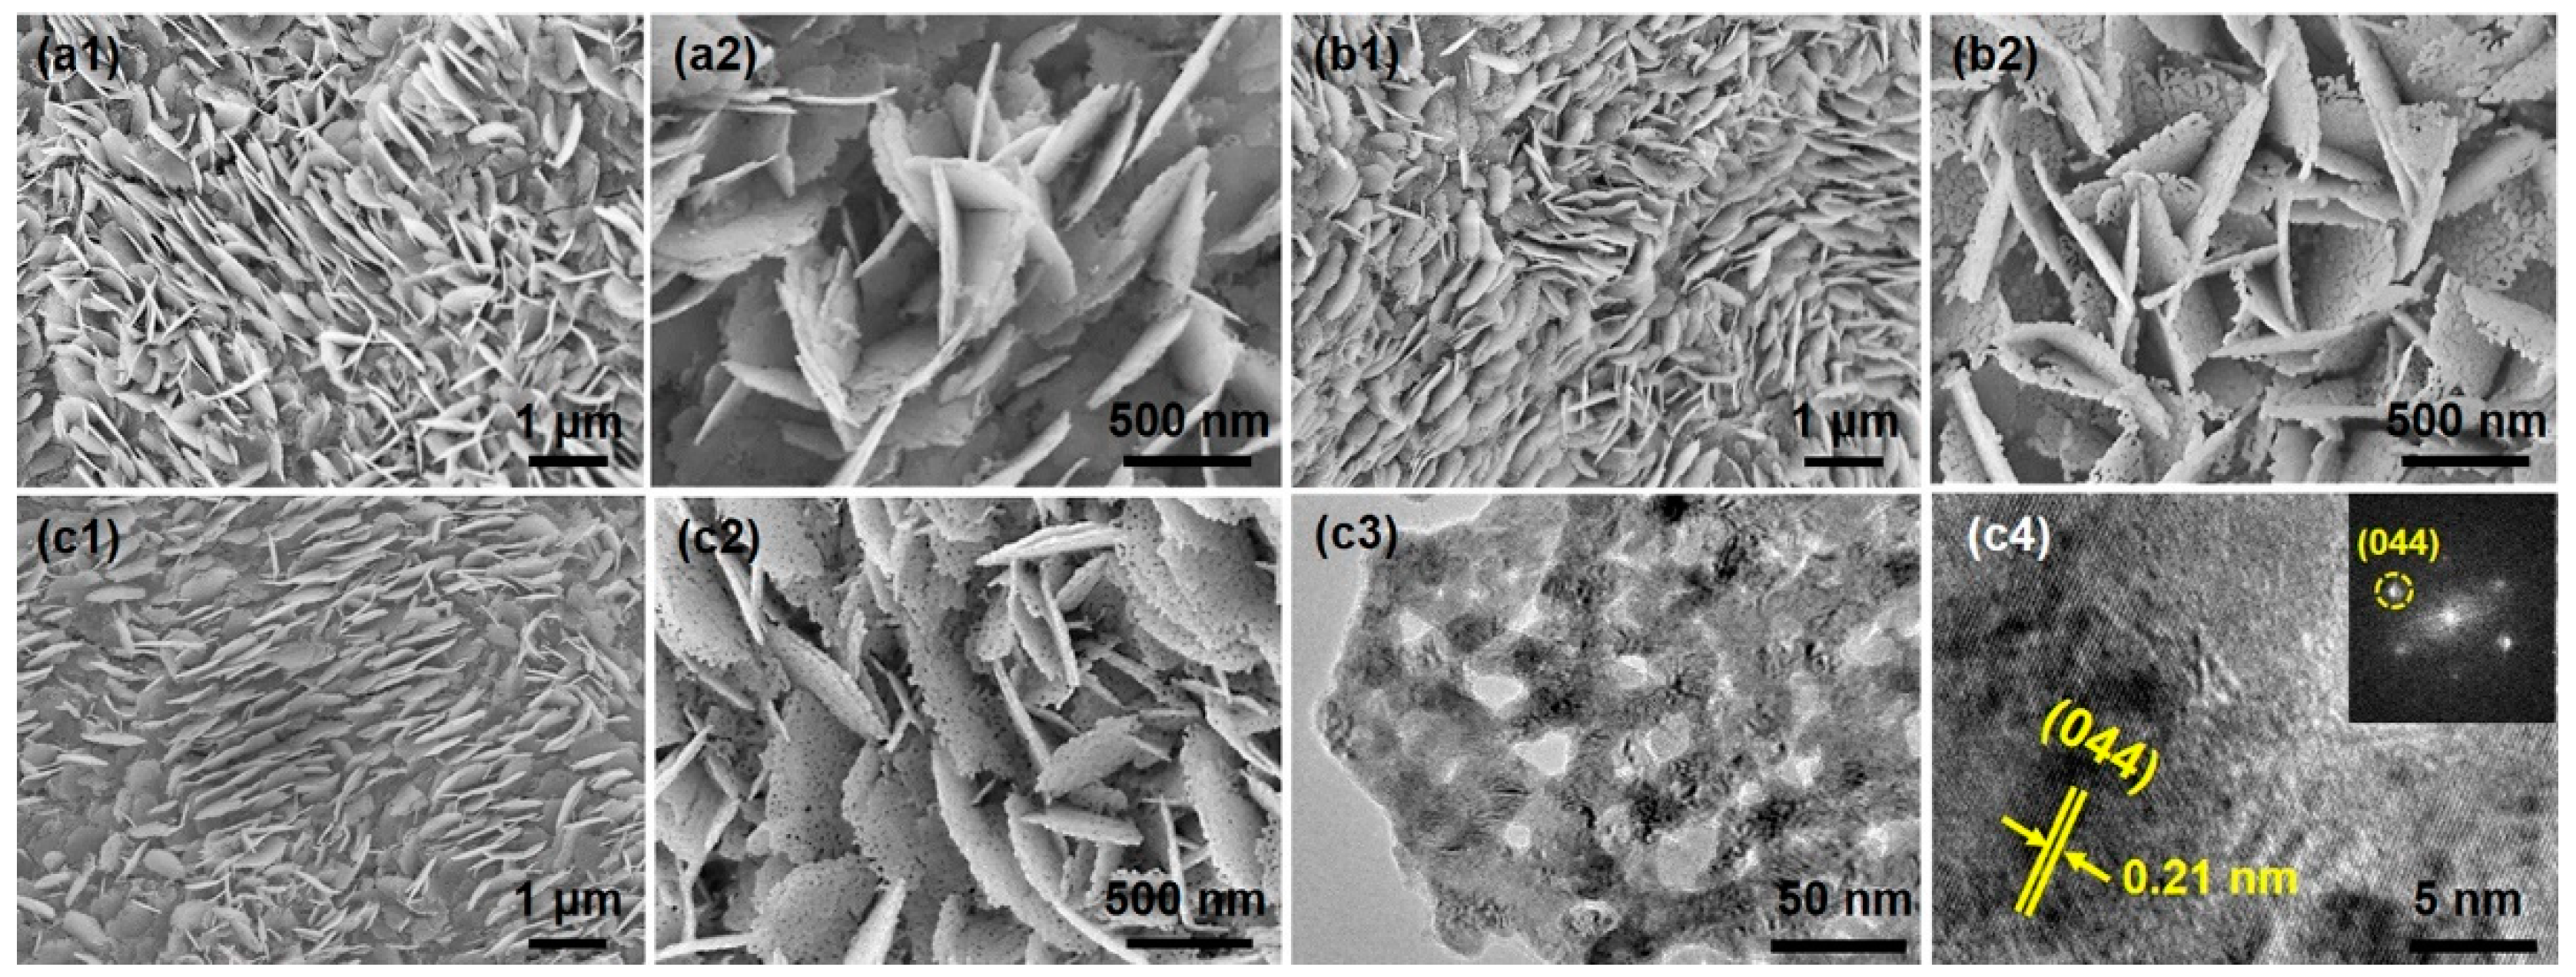
Figure 2.
(a) XRD patterns of CeO2, Ar-CeO2, and N-CeO2. (b) High-resolution N 1s XPS spectra of N-CeO2. (c) High-resolution O 1s XPS spectra of CeO2, Ar-CeO2, and N-CeO2. High-resolution Ce 3d XPS spectra of (d) CeO2, (e) Ar-CeO2, and (f) N-CeO2.
Figure 2.
(a) XRD patterns of CeO2, Ar-CeO2, and N-CeO2. (b) High-resolution N 1s XPS spectra of N-CeO2. (c) High-resolution O 1s XPS spectra of CeO2, Ar-CeO2, and N-CeO2. High-resolution Ce 3d XPS spectra of (d) CeO2, (e) Ar-CeO2, and (f) N-CeO2.
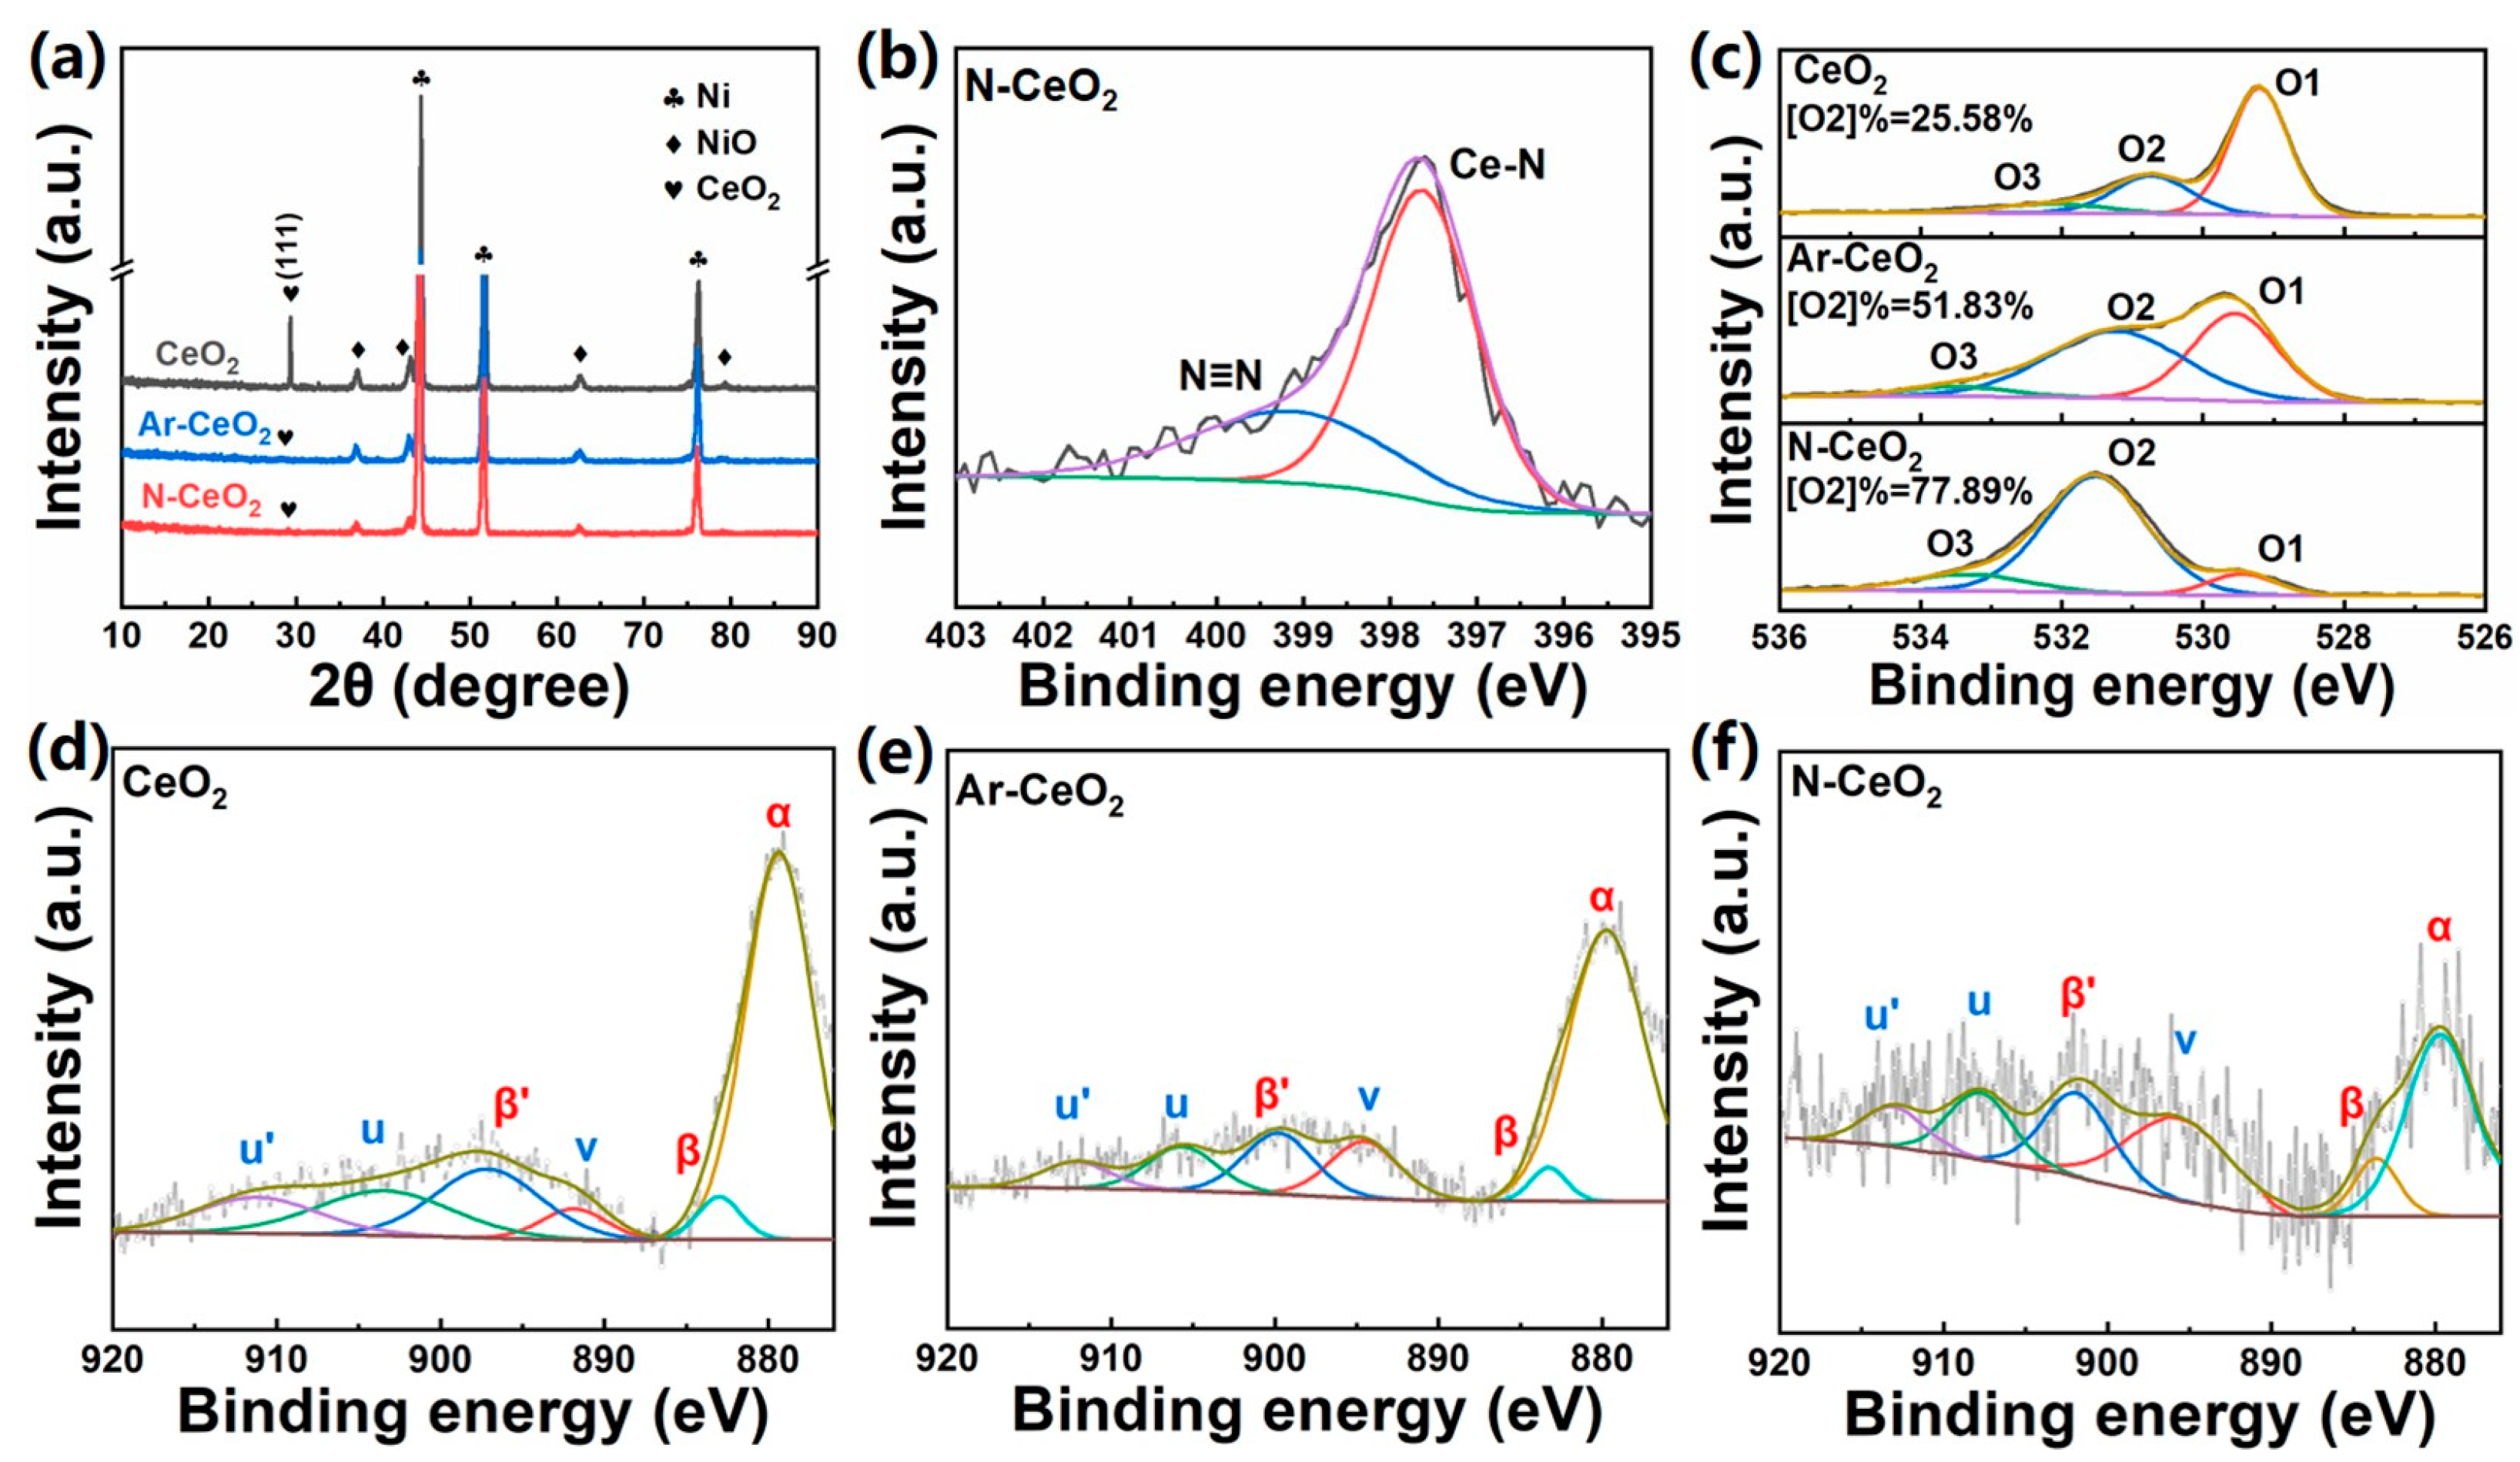
Figure 3.
HER performance: (a) LSV curves, (b) Tafel plots, (c) long-term chronopotentiometric curves at different current densities, and (d) LSV curves of N-CeO2 before and after chronopotentiometric test. Inset is the SEM image of N-CeO2 after chronopotentiometric test. The current densities in all figures are based on geometric area.
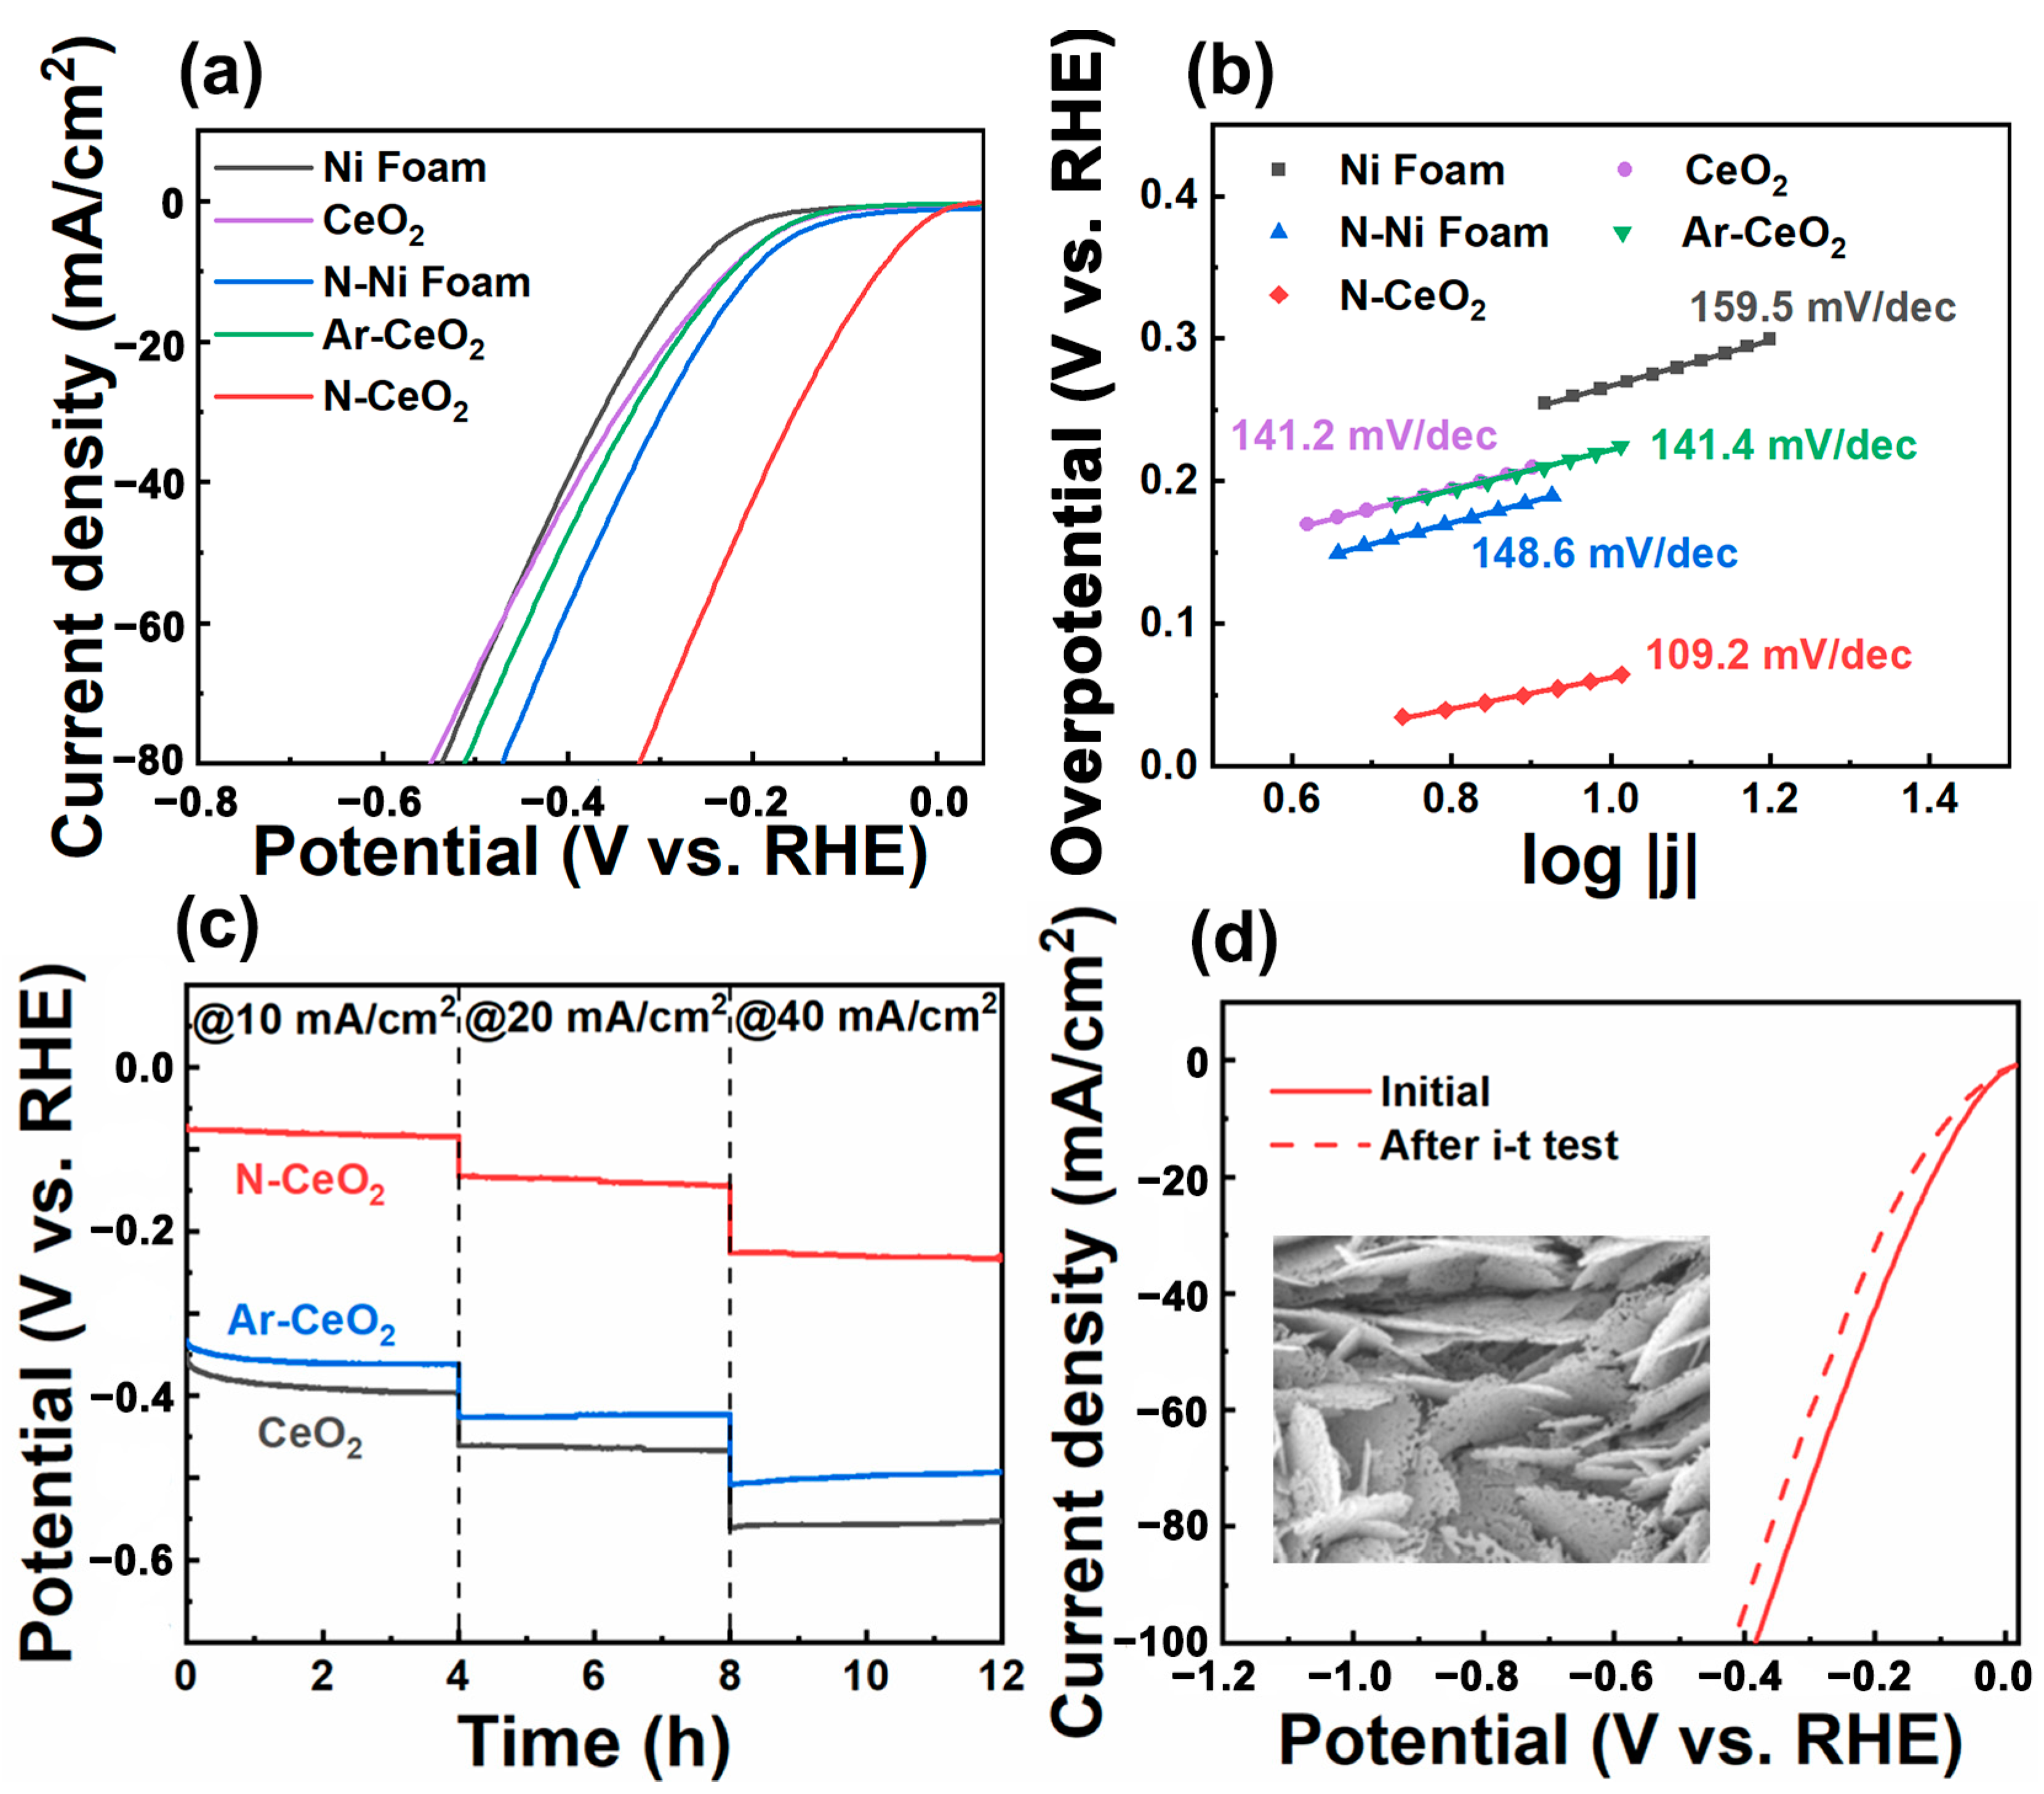
Figure 4.
(a) The linear fitting plots of anode currents (derived from Figure S7) vs. scan rates for EASA evaluation. (b) Nyquist curves.
Figure 4.
(a) The linear fitting plots of anode currents (derived from Figure S7) vs. scan rates for EASA evaluation. (b) Nyquist curves.


Table 1.
Comparison of N-CeO2 nanosheets with other HER catalysts in terms of overpotential at 10 mA/cm2 and Tafel slope.
Table 1.
Comparison of N-CeO2 nanosheets with other HER catalysts in terms of overpotential at 10 mA/cm2 and Tafel slope.
| Active Materials | Overpotential (mV vs. RHE) | Tafel Slope (mV/dec) | Ref. |
|---|---|---|---|
| N-CeO2 | 65 | 109.2 | Our work |
| CeO2/Co(OH)2 | 317 | 144 | [34] |
| 3D CeO2/rGO | 341 | 112. 8 | [35] |
| Ni-CeO2/rGO | 111 | 107.3 | [36] |
| Ni3N-CeO2 | 80 | 122 | [37] |
| Ni-S/CeO2 | 180 | 158 | [38] |
| Co4N/CeO2 | 24 | 61 | [39] |
| CoP/CeO2 | 43 | 45 | [40] |
| NiFe nanotube | 181 | 147 | [41] |
| CoNi@N-C/rGO | 510 | 133.7 | [42] |
Disclaimer/Publisher’s Note: The statements, opinions and data contained in all publications are solely those of the individual author(s) and contributor(s) and not of MDPI and/or the editor(s). MDPI and/or the editor(s) disclaim responsibility for any injury to people or property resulting from any ideas, methods, instructions or products referred to in the content. |
© 2024 by the authors. Licensee MDPI, Basel, Switzerland. This article is an open access article distributed under the terms and conditions of the Creative Commons Attribution (CC BY) license (https://creativecommons.org/licenses/by/4.0/).
Share and Cite
MDPI and ACS Style
Wang, Z.; Li, T.; Wang, Q. Plasma-Engineered CeOx Nanosheet Array with Nitrogen-Doping and Porous Architecture for Efficient Electrocatalysis. Nanomaterials 2024, 14, 185. https://doi.org/10.3390/nano14020185
AMA Style
Wang Z, Li T, Wang Q. Plasma-Engineered CeOx Nanosheet Array with Nitrogen-Doping and Porous Architecture for Efficient Electrocatalysis. Nanomaterials. 2024; 14(2):185. https://doi.org/10.3390/nano14020185
Chicago/Turabian StyleWang, Zhou, Tong Li, and Qi Wang. 2024. "Plasma-Engineered CeOx Nanosheet Array with Nitrogen-Doping and Porous Architecture for Efficient Electrocatalysis" Nanomaterials 14, no. 2: 185. https://doi.org/10.3390/nano14020185
Note that from the first issue of 2016, this journal uses article numbers instead of page numbers. See further details here.