
Multifaceted Assessment of Porous Silica Nanocomposites: Unraveling Physical, Structural, and Biological Transformations Induced by Microwave Field Modification
 , , , , , , ,
Abstract
:1. Introduction
2. Materials and Methods
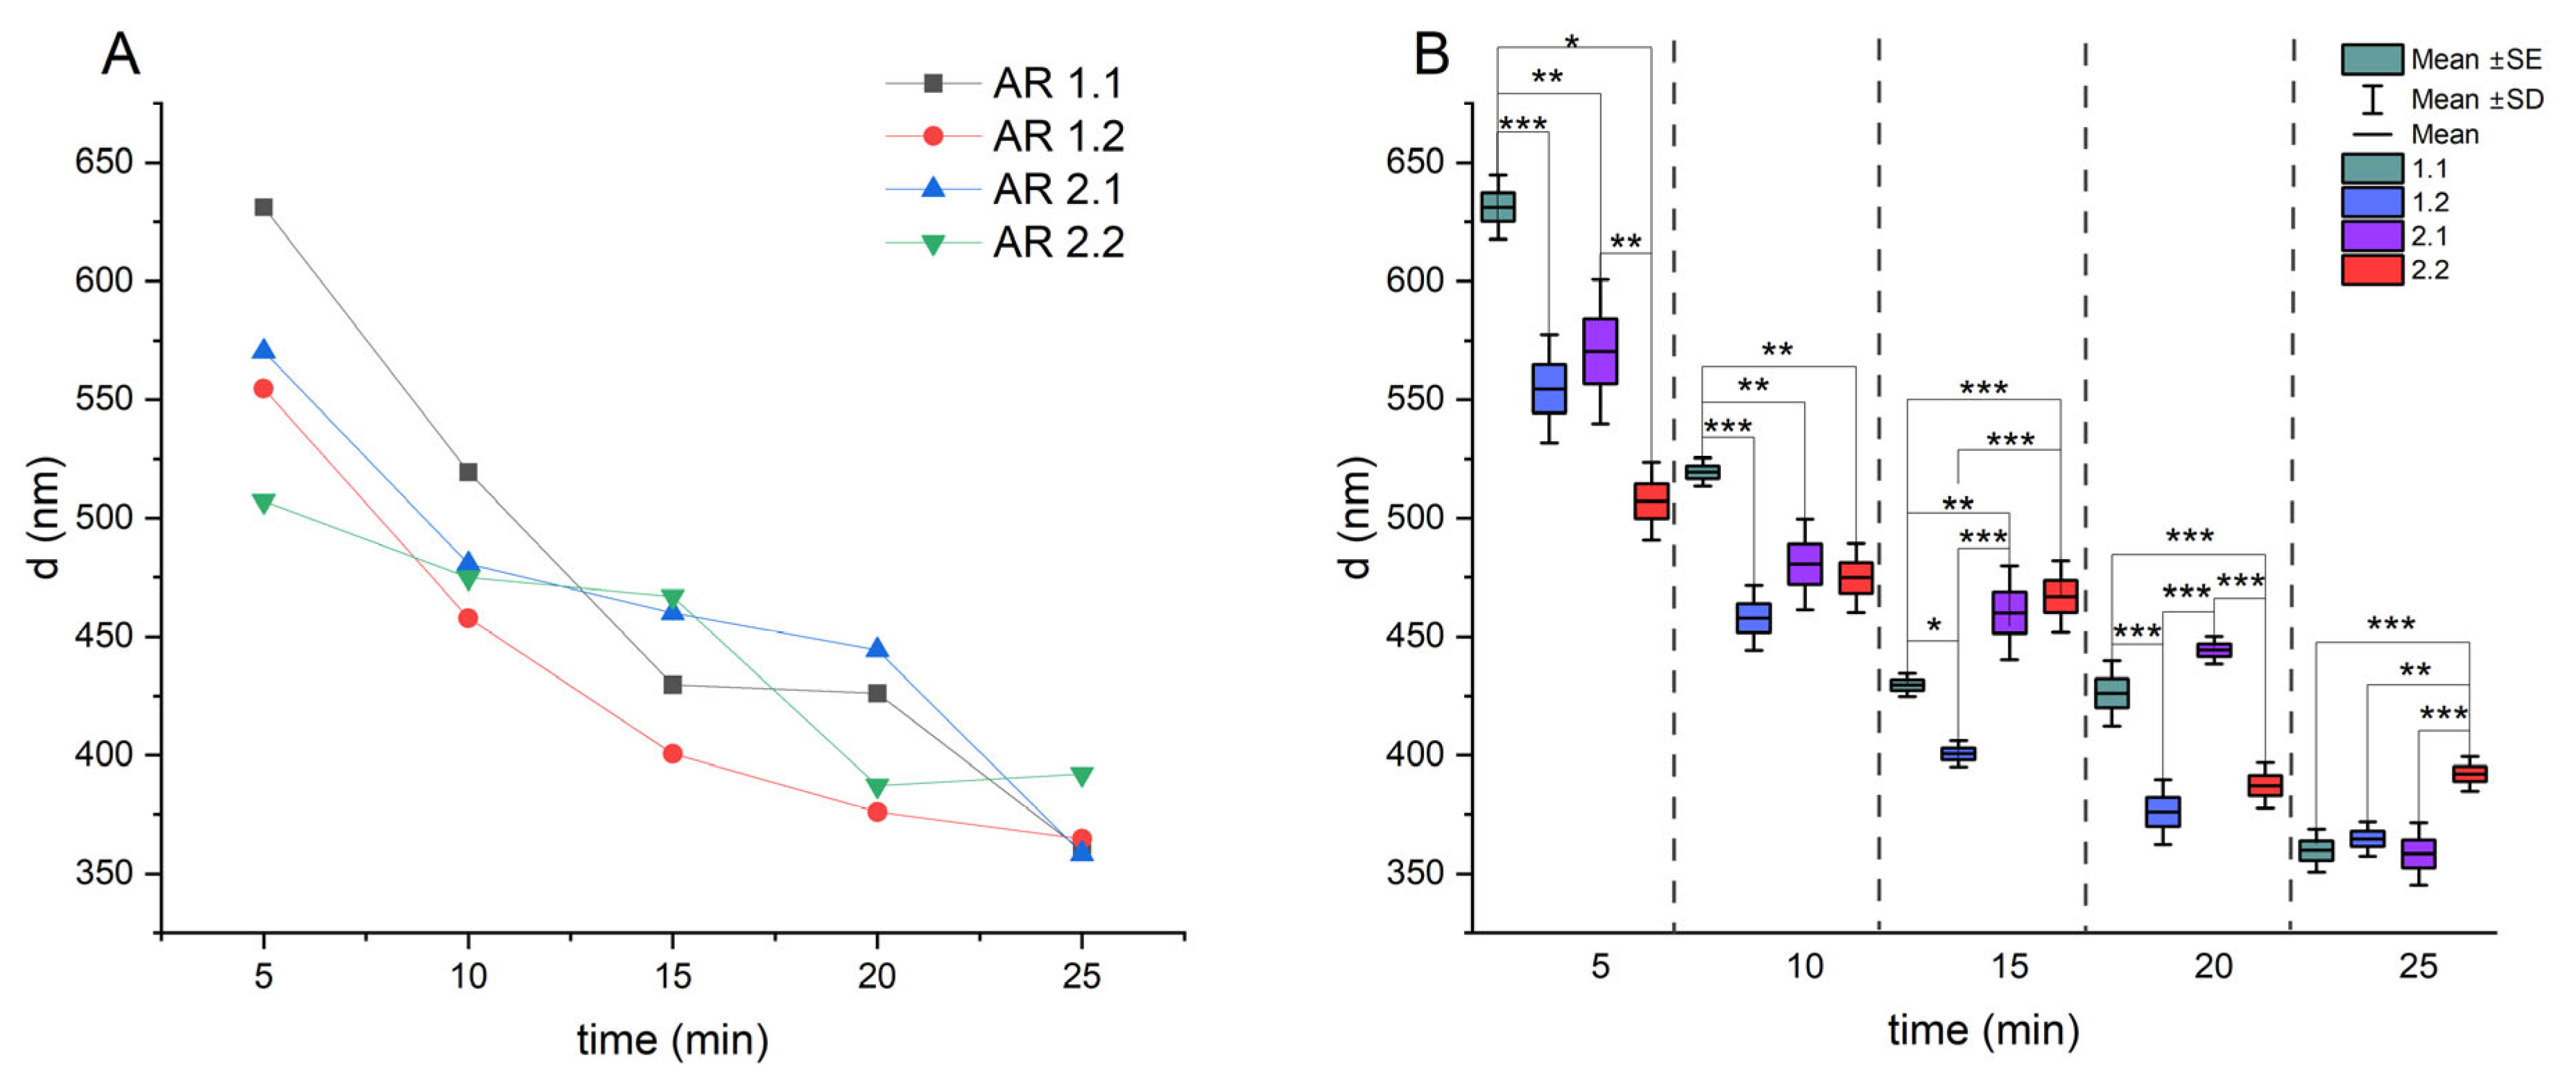
2.1. Estimation of the Particle Size and Zeta Potential
2.2. Sorption of Ag+ and Crystallization of Ag Nanoparticles
2.3. Determination of the Surface Area, Pore Volume, and Pore Diameter
2.4. Structural Analysis
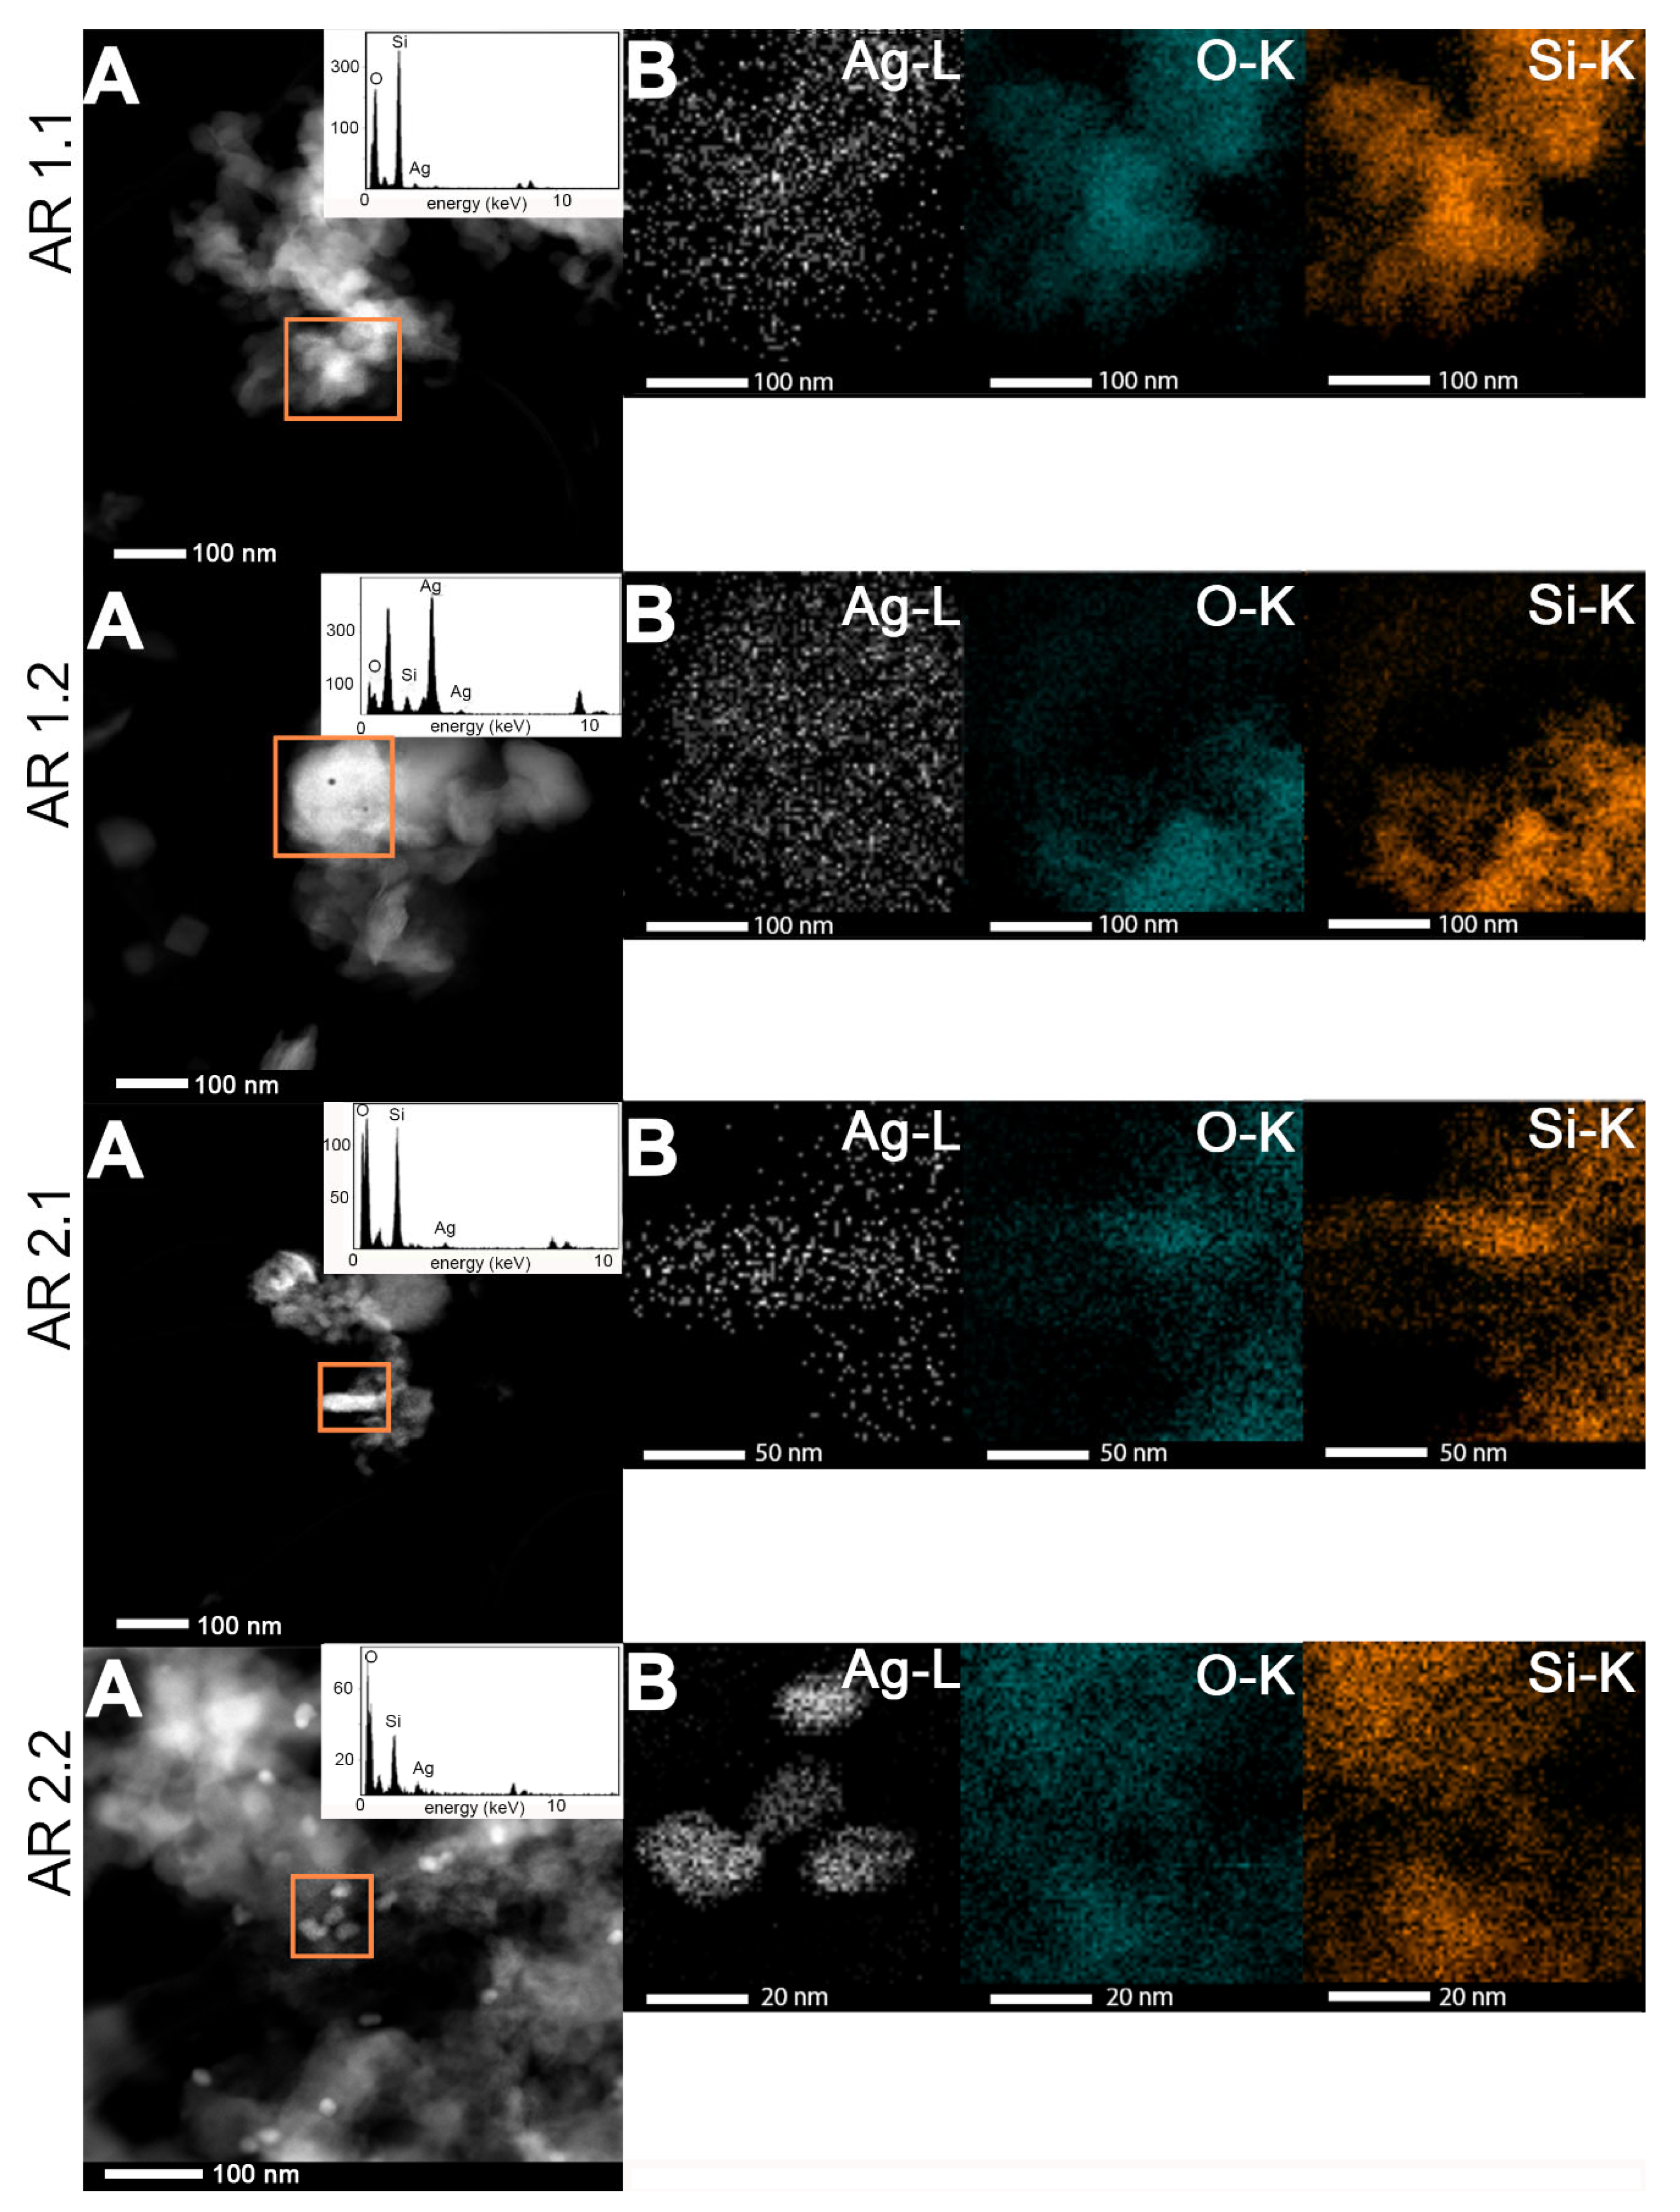
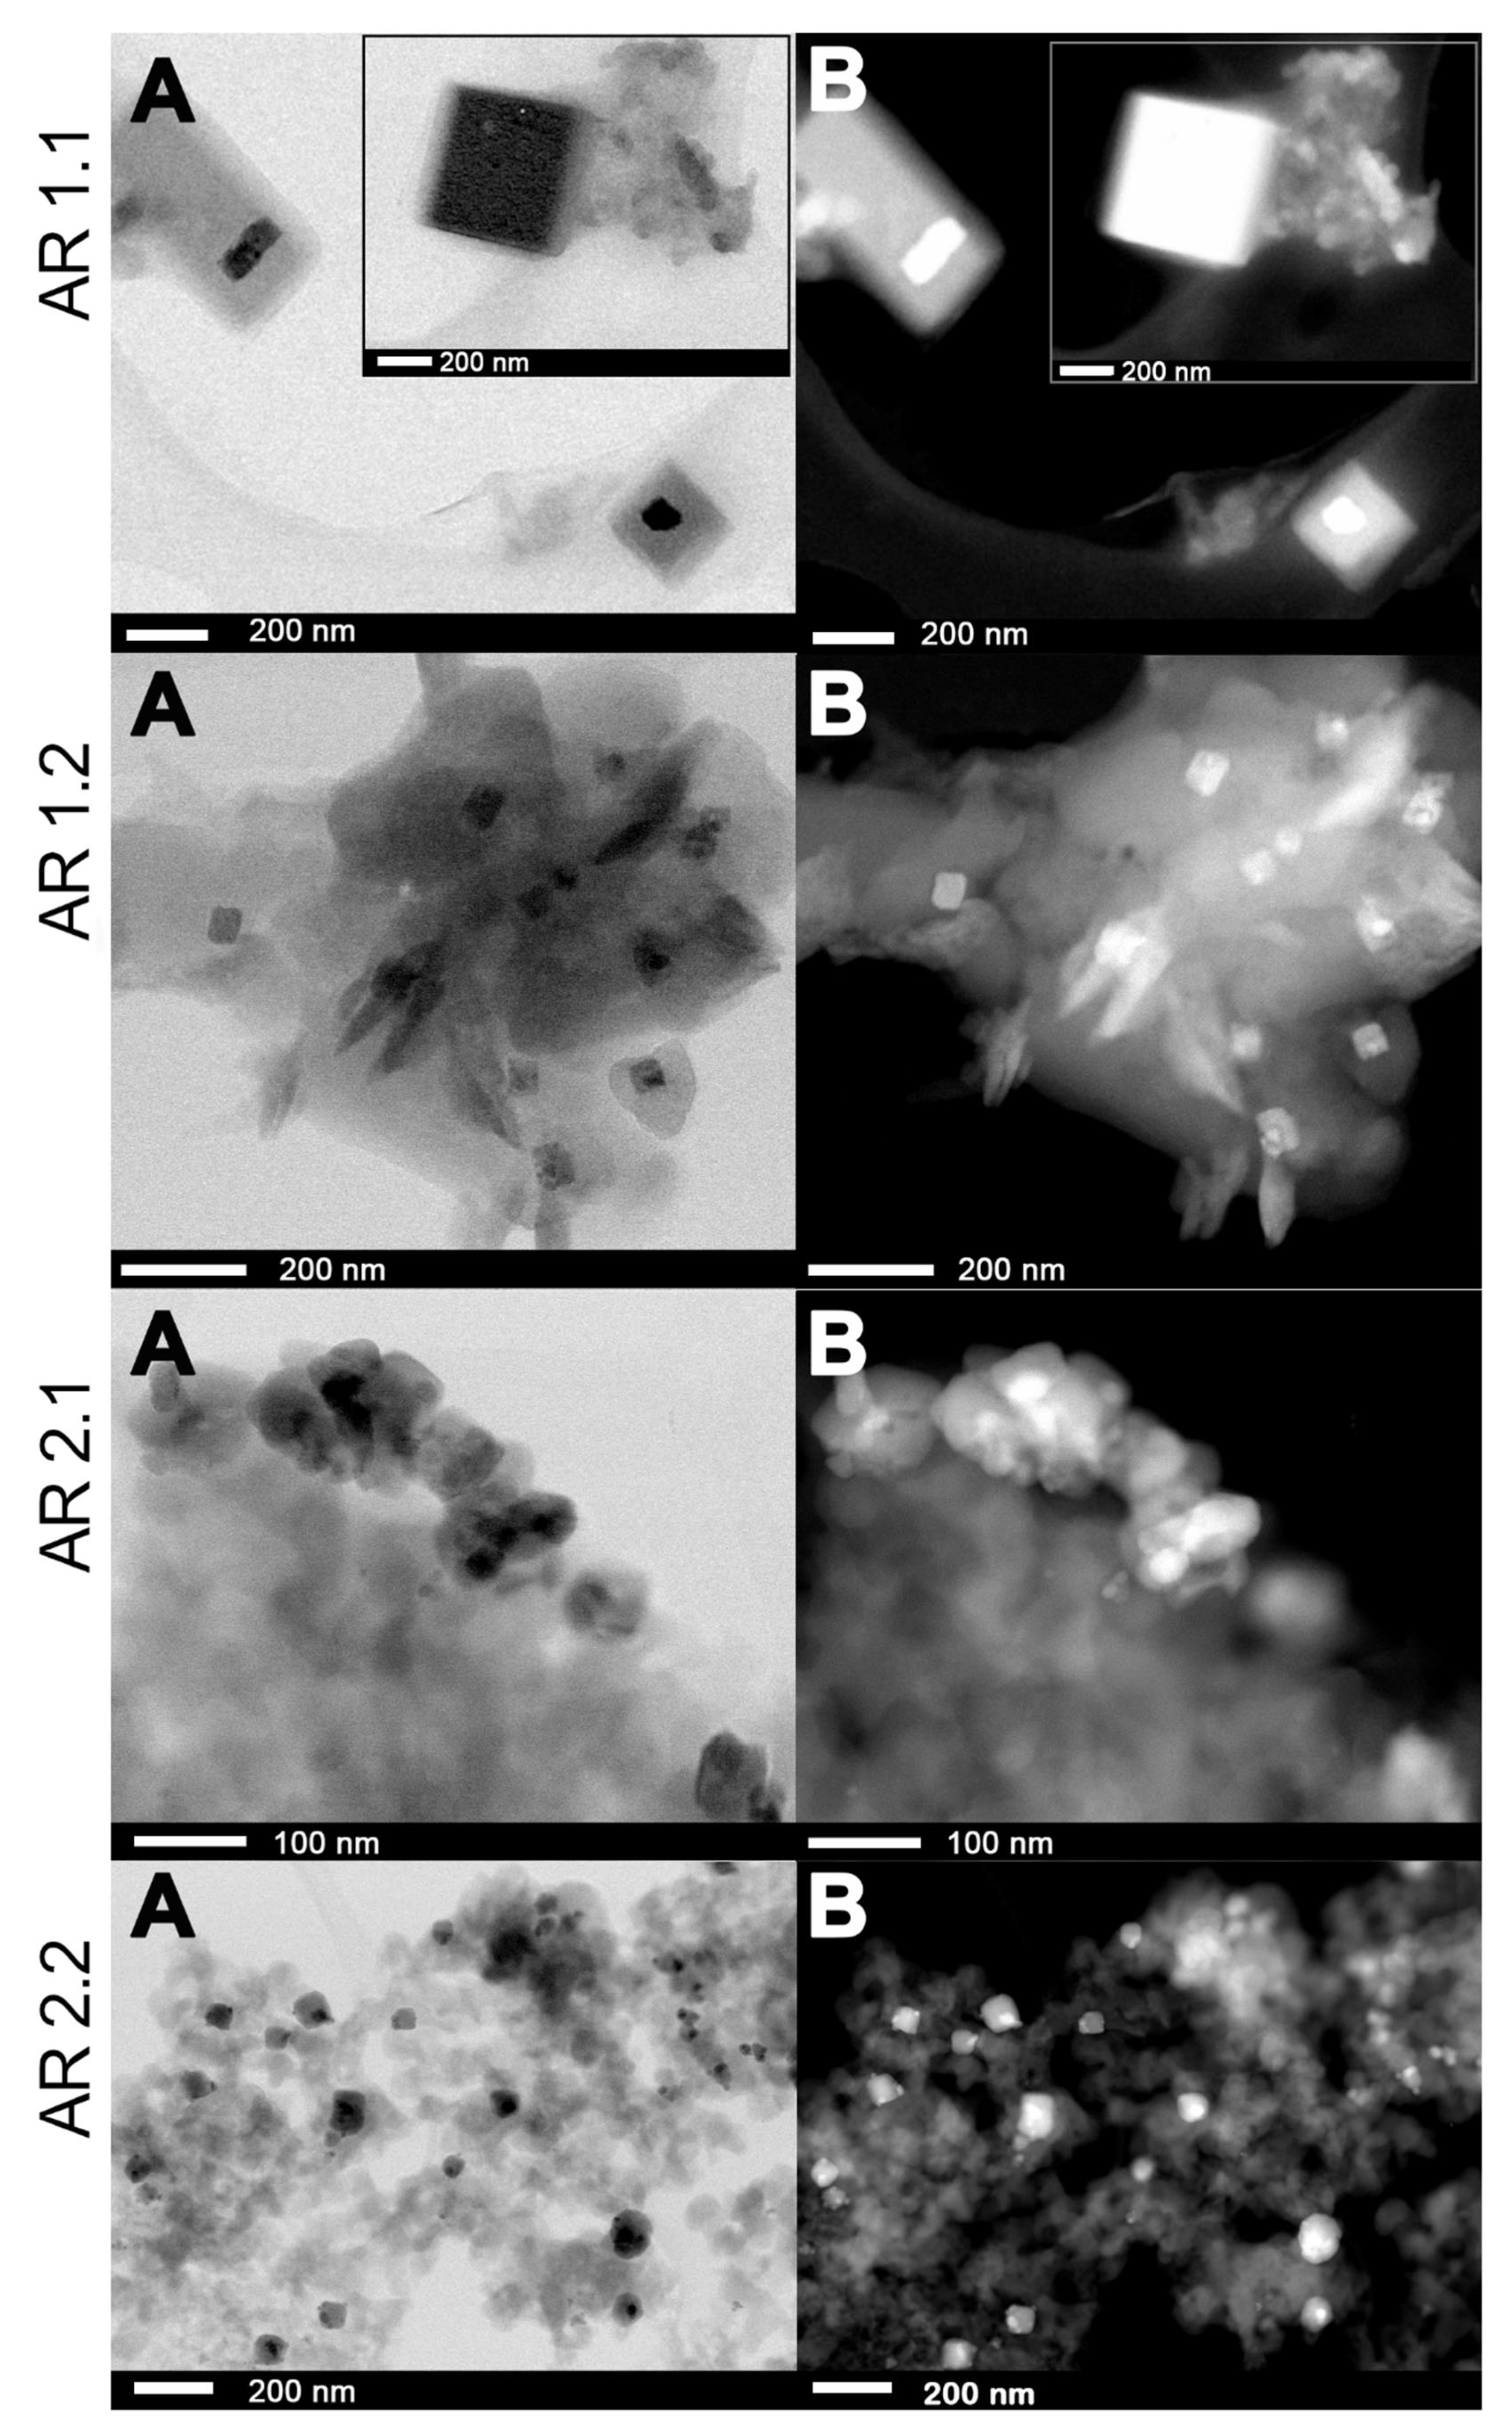
2.5. Morphological Studies and Chemical Composition
2.6. Ag Ion Release
2.7. Microbial Studies
2.7.1. Susceptibility to Antibacterial Agents
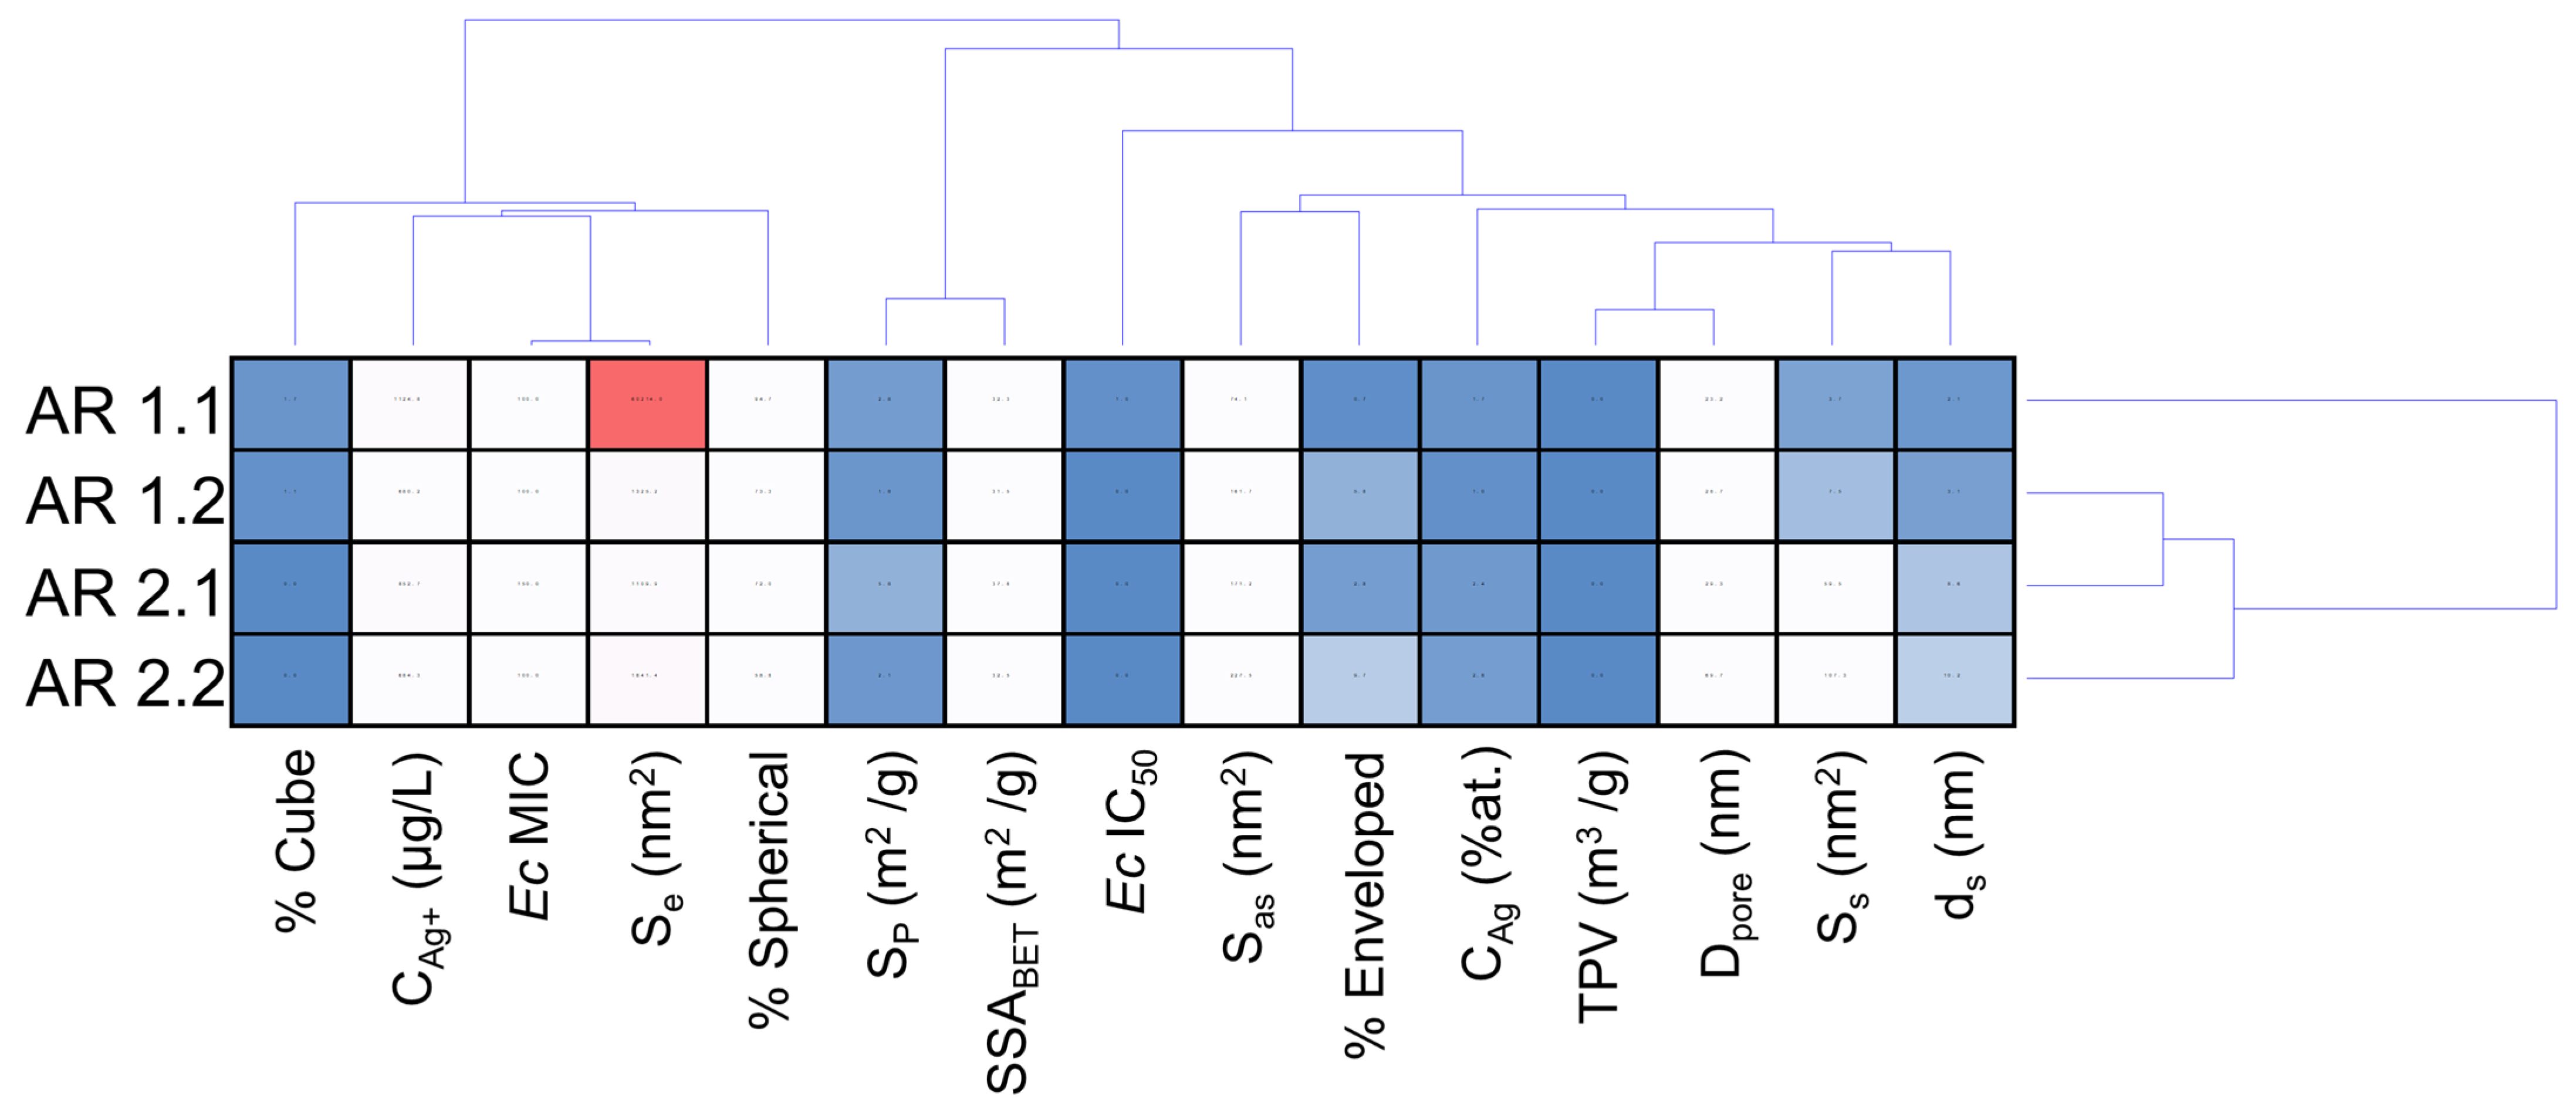
2.7.2. Statistical Analysis
3. Results and Discussion
3.1. Microwave-Assisted Sintering: Deagglomeration, Specific Surface Area, Pore Diameter, Porosity
3.2. Sorption
3.3. Crystallization, Particle Size Diameter of Silver–Silica Nanocomposites
3.4. Structural Analysis
3.5. Microscopic Studies
3.6. Kinetics of the Ag+ Release
3.7. Bacterial Viability Assay on Bacterial Strains Exposed to Various Nanocomposites Silver–Silica
4. Conclusions
Supplementary Materials
Author Contributions
Funding
Data Availability Statement
Conflicts of Interest
References
- Azimi, A.; Azari, A.; Rezakazemi, M.; Ansarpour, M. Removal of Heavy Metals from Industrial Wastewaters: A Review. ChemBioEng Rev. 2017, 4, 37–59. [Google Scholar] [CrossRef]
- Guo, Z.; Gao, Y.; Yuan, X.; Yuan, M.; Huang, L.; Wang, S.; Liu, C.; Duan, C. Effects of Heavy Metals on Stomata in Plants: A Review. Int. J. Mol. Sci. 2023, 24, 9302. [Google Scholar] [CrossRef] [PubMed]
- Pachaiappan, R.; Cornejo-Ponce, L.; Rajendran, R.; Manavalan, K.; Femilaa Rajan, V.; Awad, F. A review on biofiltration techniques: Recent advancements in the removal of volatile organic compounds and heavy metals in the treatment of polluted water. Bioengineered 2022, 13, 8432–8477. [Google Scholar] [CrossRef] [PubMed]
- Yu, X.; Jiang, N.; Yang, Y.; Liu, H.; Gao, X.; Cheng, L. Heavy metals remediation through bio-solidification: Potential application in environmental geotechnics. Ecotoxicol. Environ. Saf. 2023, 263, 115305. [Google Scholar] [CrossRef]
- Gidudu, B.; Chirwa, E.M.N. The Role of pH, Electrodes, Surfactants, and Electrolytes in Electrokinetic Remediation of Contaminated Soil. Molecules 2022, 27, 7381. [Google Scholar] [CrossRef] [PubMed]
- Zhang, K.; Zhang, D.; Wu, X.; Xue, Y. Continuous and efficient immobilization of heavy metals by phosphate-mineralized bacterial consortium. J. Hazard. Mater. 2021, 416, 125800. [Google Scholar] [CrossRef]
- Morozova, O.V. Silver Nanostructures: Limited Sensitivity of Detection, Toxicity and Anti-Inflammation Effects. Int. J. Mol. Sci. 2021, 22, 9928. [Google Scholar] [CrossRef]
- Kim, K.-T.; Truong, L.; Wehmas, L.; Tanguay, R.L. Silver nanoparticle toxicity in the embryonic zebrafish is governed by particle dispersion and ionic environment. Nanotechnology 2013, 24, 115101. [Google Scholar] [CrossRef]
- Dedman, C.J.; Newson, G.C.; Davies, G.-L.; Christie-Oleza, J.A. Mechanisms of silver nanoparticle toxicity on the marine cyanobacterium Prochlorococcus under environmentally-relevant conditions. Sci. Total Environ. 2020, 747, 141229. [Google Scholar] [CrossRef]
- Zeumer, R.; Hermsen, L.; Kaegi, R.; Kühr, S.; Knopf, B.; Schlechtriem, C. Bioavailability of silver from wastewater and planktonic food borne silver nanoparticles in the rainbow trout Oncorhynchus mykiss. Sci. Total Environ. 2020, 706, 135695. [Google Scholar] [CrossRef]
- Jo, Y.-K.; Kim, B.H.; Jung, G. Antifungal Activity of Silver Ions and Nanoparticles on Phytopathogenic Fungi. Plant Dis. 2009, 93, 1037–1043. [Google Scholar] [CrossRef] [PubMed]
- Krishnaraj, C.; Ramachandran, R.; Mohan, K.; Kalaichelvan, P.T. Optimization for rapid synthesis of silver nanoparticles and its effect on phytopathogenic fungi. Spectrochim. Acta A Mol. Biomol. Spectrosc. 2012, 93, 95–99. [Google Scholar] [CrossRef] [PubMed]
- Sohn, E.K.; Johari, S.A.; Kim, T.G.; Kim, J.K.; Kim, E.; Lee, J.H.; Chung, Y.S.; Yu, I.J. Aquatic Toxicity Comparison of Silver Nanoparticles and Silver Nanowires. BioMed Res. Int. 2015, 2015, 893049. [Google Scholar] [CrossRef]
- Krizkova, S.; Ryant, P.; Krystofova, O.; Adam, V.; Galiova, M.; Beklova, M.; Babula, P.; Kaiser, J.; Novotny, K.; Novotny, J.; et al. Multi-instrumental Analysis of Tissues of Sunflower Plants Treated with Silver(I) Ions—Plants as Bioindicators of Environmental Pollution. Sensors 2008, 8, 445–463. [Google Scholar] [CrossRef] [PubMed]
- Seiffert, J.; Buckley, A.; Leo, B.; Martin, N.G.; Zhu, J.; Dai, R.; Hussain, F.; Guo, C.; Warren, J.; Hodgson, A.; et al. Pulmonary effects of inhalation of spark-generated silver nanoparticles in Brown-Norway and Sprague–Dawley rats. Respir. Res. 2016, 17, 85. [Google Scholar] [CrossRef]
- Gao, J.; Mahapatra, C.T.; Mapes, C.D.; Khlebnikova, M.; Wei, A.; Sepúlveda, M.S. Vascular toxicity of silver nanoparticles to developing zebrafish (Danio rerio). Nanotoxicology 2016, 10, 1363–1372. [Google Scholar] [CrossRef]
- Báez, D.F.; Gallardo-Toledo, E.; Oyarzún, M.P.; Araya, E.; Kogan, M.J. The Influence of Size and Chemical Composition of Silver and Gold Nanoparticles on in vivo Toxicity with Potential Applications to Central Nervous System Diseases. Int. J. Nanomed. 2021, 16, 2187–2201. [Google Scholar] [CrossRef]
- Asghari, S.; Johari, S.A.; Lee, J.H.; Kim, Y.S.; Jeon, Y.B.; Choi, H.J.; Moon, M.C.; Yu, I.J. Toxicity of various silver nanoparticles compared to silver ions in Daphnia magna. J. Nanobiotechnol. 2012, 10, 14. [Google Scholar] [CrossRef]
- Nie, P.; Zhao, Y.; Xu, H. Synthesis, applications, toxicity and toxicity mechanisms of silver nanoparticles: A review. Ecotoxicol. Environ. Saf. 2023, 253, 114636. [Google Scholar] [CrossRef]
- Tareq, M.; Khadrawy, Y.A.; Rageh, M.M.; Mohammed, H.S. Dose-dependent biological toxicity of green synthesized silver nanoparticles in rat’s brain. Sci. Rep. 2022, 12, 22642. [Google Scholar] [CrossRef]
- Otari, S.V.; Patel, S.K.S.; Kalia, V.C.; Kim, I.-W.; Lee, J.-K. Antimicrobial Activity of Biosynthesized Silver Nanoparticles Decorated Silica Nanoparticles. Indian J. Microbiol. 2019, 59, 379–382. [Google Scholar] [CrossRef]
- Van Aerle, R.; Lange, A.; Moorhouse, A.; Paszkiewicz, K.; Ball, K.; Johnston, B.D.; de-Bastos, E.; Booth, T.; Tyler, C.R.; Santos, E.M. Molecular Mechanisms of Toxicity of Silver Nanoparticles in Zebrafish Embryos. Environ. Sci. Technol. 2013, 47, 8005–8014. [Google Scholar] [CrossRef]
- Almatroudi, A. Silver nanoparticles: Synthesis, characterisation and biomedical applications. Open Life Sci. 2020, 15, 819–839. [Google Scholar] [CrossRef]
- Farouk, M.M.; El-Molla, A.; Salib, F.A.; Soliman, Y.A.; Shaalan, M. The Role of Silver Nanoparticles in a Treatment Approach for Multidrug-Resistant Salmonella Species Isolates. Int. J. Nanomed. 2020, 15, 6993–7011. [Google Scholar] [CrossRef]
- Bedlovičová, Z.; Strapáč, I.; Baláž, M.; Salayová, A. A Brief Overview on Antioxidant Activity Determination of Silver Nanoparticles. Molecules 2020, 25, 3191. [Google Scholar] [CrossRef] [PubMed]
- Yin, I.X.; Zhang, J.; Zhao, I.S.; Mei, M.L.; Li, Q.; Chu, C.H. The Antibacterial Mechanism of Silver Nanoparticles and Its Application in Dentistry. Int. J. Nanomed. 2020, 15, 2555–2562. [Google Scholar] [CrossRef] [PubMed]
- Yu, C.; Li, G.; Kumar, S.; Yang, K.; Jin, R. Phase Transformation Synthesis of Novel Ag2O/Ag2CO3 Heterostructures with High Visible Light Efficiency in Photocatalytic Degradation of Pollutants. Adv. Mater. 2014, 26, 892–898. [Google Scholar] [CrossRef] [PubMed]
- Buckley, J.J.; Gai, P.L.; Lee, A.F.; Olivi, L.; Wilson, K. Silver carbonate nanoparticles stabilised over alumina nanoneedles exhibiting potent antibacterial properties. Chem. Commun. 2008, 4013–4015. [Google Scholar] [CrossRef] [PubMed]
- Yu, C.; Wei, L.; Zhou, W.; Dionysiou, D.D.; Zhu, L.; Shu, Q.; Liu, H. A visible-light-driven core-shell like Ag2S@Ag2CO3 composite photocatalyst with high performance in pollutants degradation. Chemosphere 2016, 157, 250–261. [Google Scholar] [CrossRef] [PubMed]
- Yu, C.; Wei, L.; Chen, J.; Xie, Y.; Zhou, W.; Fan, Q. Enhancing the Photocatalytic Performance of Commercial TiO2 Crystals by Coupling with Trace Narrow-Band-Gap Ag2CO3. Ind. Eng. Chem. Res. 2014, 53, 5759–5766. [Google Scholar] [CrossRef]
- Purohit, G.; Rawat, D.S.; Reiser, O. Palladium Nanocatalysts Encapsulated on Porous Silica @ Magnetic Carbon-Coated Cobalt Nanoparticles for Sustainable Hydrogenation of Nitroarenes, Alkenes and Alkynes. ChemCatChem 2020, 12, 569–575. [Google Scholar] [CrossRef]
- Strach, A.; Dulski, M.; Wasilkowski, D.; Metryka, O.; Nowak, A.; Matus, K.; Dudek, K.; Rawicka, P.; Kubacki, J.; Waloszczyk, N.; et al. Microwave Irradiation vs. Structural, Physicochemical, and Biological Features of Porous Environmentally Active Silver–Silica Nanocomposites. Int. J. Mol. Sci. 2023, 24, 6632. [Google Scholar] [CrossRef] [PubMed]
- Mahjoubian, M.; Naeemi, A.S.; Sheykhan, M. Toxicological effects of Ag2O and Ag2CO3 doped TiO2 nanoparticles and pure TiO2 particles on zebrafish (Danio rerio). Chemosphere 2021, 263, 128182. [Google Scholar] [CrossRef] [PubMed]
- Mohaghegh, N.; Eshaghi, B.; Rahimi, E.; Gholami, M.R. Ag2CO3 sensitized TiO2 nanoparticles prepared in ionic liquid medium: A new Ag2CO3/TiO2/RTIL heterostructure with highly efficient photocatalytic activity. J. Mol. Catal. A Chem. 2015, 406, 152–158. [Google Scholar] [CrossRef]
- Zhang, M.; Lidder, J.; Bahri, M.; Zhang, H. Preparation of PLGA-Coated Porous Silica Nanofibers for Drug Release. Pharmaceutics 2022, 14, 2660. [Google Scholar] [CrossRef]
- Rossi, N.R.; de Menezes, B.R.C.; Sampaio, A.d.G.; da Silva, D.M.; Koga-Ito, C.Y.; Thim, G.P.; de Arruda Paes-Junior, T.J. Silver-Coated Silica Nanoparticles Modified with MPS: Potential Antimicrobial Biomaterials Applied in Glaze and Soft Reliner. Polymers 2022, 14, 4306. [Google Scholar] [CrossRef]
- Canhaci, S.J.; Perez, R.F.; Borges, L.E.P.; Fraga, M.A. Direct conversion of xylose to furfuryl alcohol on single organic–inorganic hybrid mesoporous silica-supported catalysts. Appl. Catal. B Environ. 2017, 207, 279–285. [Google Scholar] [CrossRef]
- Chen, K.; Fan, W.; Huang, C.; Qiu, X. Enhanced stability and catalytic activity of bismuth nanoparticles by modified with porous silica. J. Phys. Chem. Solids 2017, 110, 9–14. [Google Scholar] [CrossRef]
- Jaroniec, M.; Kruk, M.; Olivier, J.P. Standard Nitrogen Adsorption Data for Characterization of Nanoporous Silicas. Langmuir 1999, 15, 5410–5413. [Google Scholar] [CrossRef]
- Holland, B.T.; Blanford, C.F.; Do, T.; Stein, A. Synthesis of Highly Ordered, Three-Dimensional, Macroporous Structures of Amorphous or Crystalline Inorganic Oxides, Phosphates, and Hybrid Composites. Chem. Mater. 1999, 11, 795–805. [Google Scholar] [CrossRef]
- Ai, C.; Gong, G.; Zhao, X.; Liu, P. Macroporous hollow silica microspheres-supported palladium catalyst for selective hydrogenation of nitrile butadiene rubber. J. Taiwan Inst. Chem. Eng. 2017, 77, 250–256. [Google Scholar] [CrossRef]
- Li, H.; Hou, B.; Wang, J.; Huang, X.; Chen, C.; Ma, Z.; Cui, J.; Jia, L.; Sun, D.; Li, D. Effect of hierarchical meso–macroporous structures on the catalytic performance of silica supported cobalt catalysts for Fischer–Tropsch synthesis. Catal. Sci. Technol. 2017, 7, 3812–3822. [Google Scholar] [CrossRef]
- Jayan, H.; Sun, D.-W.; Pu, H.; Wei, Q. Mesoporous silica coated core-shell nanoparticles substrate for size-selective SERS detection of chloramphenicol. Spectrochim. Acta Part A Mol. Biomol. Spectrosc. 2023, 284, 121817. [Google Scholar] [CrossRef]
- Ambrogi, V.; Pietrella, D.; Donnadio, A.; Latterini, L.; Di Michele, A.; Luffarelli, I.; Ricci, M. Biocompatible alginate silica supported silver nanoparticles composite films for wound dressing with antibiofilm activity. Mater. Sci. Eng. C 2020, 112, 110863. [Google Scholar] [CrossRef]
- Horikoshi, S.; Serpone, N. Microwave Frequency Effects in Organic Synthesis. In Microwaves in Organic Synthesis; John Wiley & Sons, Ltd.: Hoboken, NJ, USA, 2012; pp. 377–423. ISBN 978-3-527-65131-3. [Google Scholar]
- Schanche, J.-S. Microwave synthesis solutions from personal chemistry. Mol. Divers. 2003, 7, 291–298. [Google Scholar] [CrossRef]
- Stuerga, D.A.C.; Gaillard, P. Microwave Athermal Effects in Chemistry: A Myth’s Autopsy: Part II: Orienting effects and thermodynamic consequences of electric field. J. Microw. Power Electromagn. Energy 1996, 31, 101–113. [Google Scholar] [CrossRef]
- Kappe, C.O. Microwave dielectric heating in synthetic organic chemistry. Chem. Soc. Rev. 2008, 37, 1127–1139. [Google Scholar] [CrossRef]
- Baghbanzadeh, M.; Carbone, L.; Cozzoli, P.D.; Kappe, C.O. Microwave-Assisted Synthesis of Colloidal Inorganic Nanocrystals. Angew. Chem. Int. Ed. 2011, 50, 11312–11359. [Google Scholar] [CrossRef] [PubMed]
- de la Hoz, A.; Díaz-Ortiz, Á.; Moreno, A. Microwaves in organic synthesis. Thermal and non-thermal microwave effects. Chem. Soc. Rev. 2005, 34, 164–178. [Google Scholar] [CrossRef] [PubMed]
- Moseley, J.D.; Oliver Kappe, C. A critical assessment of the greenness and energy efficiency of microwave-assisted organic synthesis. Green Chem. 2011, 13, 794–806. [Google Scholar] [CrossRef]
- Jha, S.K.; Phuah, X.L.; Luo, J.; Grigoropoulos, C.P.; Wang, H.; García, E.; Reeja-Jayan, B. The effects of external fields in ceramic sintering. J. Am. Ceram. Soc. 2019, 102, 5–31. [Google Scholar] [CrossRef]
- Zeng, X.; Li, E.; Xia, G.; Xie, N.; Shen, Z.-Y.; Moskovits, M.; Yu, R. Silica-based ceramics toward electromagnetic microwave absorption. J. Eur. Ceram. Soc. 2021, 41, 7381–7403. [Google Scholar] [CrossRef]
- Whittaker, A.G. Diffusion in Microwave-Heated Ceramics. Chem. Mater. 2005, 17, 3426–3432. [Google Scholar] [CrossRef]
- Robb, G.R.; Harrison, A.; Whittaker, A.G. Temperature-resolved, in-situ powder X-ray diffraction of silver iodide under microwave irradiation. PhysChemComm 2002, 5, 135–137. [Google Scholar] [CrossRef]
- Bykov, Y.V.; Egorov, S.V.; Eremeev, A.G.; Rybakov, K.I.; Semenov, V.E.; Sorokin, A.A.; Gusev, S.A. Evidence for microwave enhanced mass transport in the annealing of nanoporous alumina membranes. J. Mater. Sci. 2001, 36, 131–136. [Google Scholar] [CrossRef]
- Grabicka, B.E.; Jaroniec, M. Adsorption properties of ordered mesoporous silicas synthesized in the presence of block copolymer Pluronic F127 under microwave irradiation. Adsorption 2010, 16, 385–396. [Google Scholar] [CrossRef]
- Lovingood, D.D.; Owens, J.R.; Seeber, M.; Kornev, K.G.; Luzinov, I. Preparation of Silica Nanoparticles Through Microwave-assisted Acid-catalysis. JoVE J. Vis. Exp. 2013, e51022. [Google Scholar] [CrossRef]
- Lovingood, D.D.; Owens, J.R.; Seeber, M.; Kornev, K.G.; Luzinov, I. Controlled Microwave-Assisted Growth of Silica Nanoparticles under Acid Catalysis. ACS Appl. Mater. Interfaces 2012, 4, 6875–6883. [Google Scholar] [CrossRef]
- Zaki, T.; Samy, M.; Temraz, M.G. Synthesis and characterization of nano-silica gel aged under microwave radiation from white sandstone. J. Sol-Gel Sci. Technol. 2012, 64, 224–231. [Google Scholar] [CrossRef]
- Mohamed, R.M.; Aazam, E.S. Synthesis and Characterization of CeO2-SiO2 Nanoparticles by Microwave-Assisted Irradiation Method for Photocatalytic Oxidation of Methylene Blue Dye. Int. J. Photoenergy 2012, 2012, e928760. [Google Scholar] [CrossRef]
- Ahmed, A.; Abdelmagid, W.; Ritchie, H.; Myers, P.; Zhang, H. Investigation on synthesis of spheres-on-sphere silica particles and their assessment for high performance liquid chromatography applications. J. Chromatogr. A 2012, 1270, 194–203. [Google Scholar] [CrossRef]
- Kamarudin, N.H.N.; Jalil, A.A.; Triwahyono, S.; Artika, V.; Salleh, N.F.M.; Karim, A.H.; Jaafar, N.F.; Sazegar, M.R.; Mukti, R.R.; Hameed, B.H.; et al. Variation of the crystal growth of mesoporous silica nanoparticles and the evaluation to ibuprofen loading and release. J. Colloid Interface Sci. 2014, 421, 6–13. [Google Scholar] [CrossRef]
- Silicon Oxide Nanopowder/SiO2 Nanoparticles (SiO2 99.5+% 15–20nm Porous on Surface). Available online: https://www.us-nano.com/inc/sdetail/258 (accessed on 22 December 2023).
- Carneiro Freitas, D.; Odone Mazali, I.; Aparecido Sigoli, F.; Francischini, D.d.S.; Zezzi Arruda, M.A. The microwave-assisted synthesis of silica nanoparticles and their applications in a soy plant culture. RSC Adv. 2023, 13, 27648–27656. [Google Scholar] [CrossRef] [PubMed]
- Díaz de Greñu, B.; de los Reyes, R.; Costero, A.M.; Amorós, P.; Ros-Lis, J.V. Recent Progress of Microwave-Assisted Synthesis of Silica Materials. Nanomaterials 2020, 10, 1092. [Google Scholar] [CrossRef]
- Sohrabi Baba Heidary, D.; Lanagan, M.; Randall, C.A. Contrasting energy efficiency in various ceramic sintering processes. J. Eur. Ceram. Soc. 2018, 38, 1018–1029. [Google Scholar] [CrossRef]
- Borandeh, S.; Laurén, I.; Teotia, A.; Niskanen, J.; Seppälä, J. Dual functional quaternary chitosans with thermoresponsive behavior: Structure–activity relationships in antibacterial activity and biocompatibility. J. Mater. Chem. B 2023, 11, 11300–11309. [Google Scholar] [CrossRef] [PubMed]
- Home|AAT Bioquest. Available online: https://www.aatbio.com/ (accessed on 22 December 2023).
- Ali, P.J.M.; Faraj, R.H.; Ali, P.J.M.; Faraj, R.H. Data Normalization and Standardization: A Technical Report. Mach. Learn. Tech. Rep. 2014, 1, 1–6. [Google Scholar]
- McMillan, J.A. Magnetic properties and crystalline structure of AgO. J. Inorg. Nucl. Chem. 1960, 13, 28–31. [Google Scholar] [CrossRef]
- McMillan, J.A. Higher Oxidation States of Silver. Chem. Rev. 1962, 62, 65–80. [Google Scholar] [CrossRef]
- Furukawa, T.; Fox, K.E.; White, W.B. Raman spectroscopic investigation of the structure of silicate glasses. III. Raman intensities and structural units in sodium silicate glasses. J. Chem. Phys. 1981, 75, 3226–3237. [Google Scholar] [CrossRef]
- Awazu, K.; Kawazoe, H. Strained Si–O–Si bonds in amorphous SiO2 materials: A family member of active centers in radio, photo, and chemical responses. J. Appl. Phys. 2003, 94, 6243–6262. [Google Scholar] [CrossRef]
- Robinet, L.; Coupry, C.; Eremin, K.; Hall, C. The use of Raman spectrometry to predict the stability of historic glasses. J. Raman Spectrosc. 2006, 37, 789–797. [Google Scholar] [CrossRef]
- Kumar Yadav, A.; Singh, P. A review of the structures of oxide glasses by Raman spectroscopy. RSC Adv. 2015, 5, 67583–67609. [Google Scholar] [CrossRef]
- Bykov, V.N.; Koroleva, O.N.; Osipov, A.A. Structure of silicate melts: Raman spectroscopic data and thermodynamic simulation results. Geochem. Int. 2009, 47, 1067. [Google Scholar] [CrossRef]
- McMillan, P.F.; Wolf, G.; Poe, B.T. Vibrational spectroscopy of silicate liquids and glasses. Chem. Geol. 1992, 96, 351–366. [Google Scholar] [CrossRef]
- Matson, D.W.; Sharma, S.K.; Philpotts, J.A. The structure of high-silica alkali-silicate glasses. A Raman spectroscopic investigation. J. Non-Cryst. Solids 1983, 58, 323–352. [Google Scholar] [CrossRef]
- Parkinson, B.G.; Holland, D.; Smith, M.E.; Larson, C.; Doerr, J.; Affatigato, M.; Feller, S.A.; Howes, A.P.; Scales, C.R. Quantitative measurement of Q3 species in silicate and borosilicate glasses using Raman spectroscopy. J. Non-Cryst. Solids 2008, 354, 1936–1942. [Google Scholar] [CrossRef]
- Konijnendijk, W.L.; Stevels, J.M. The structure of borosilicate glasses studied by Raman scattering. J. Non-Cryst. Solids 1976, 20, 193–224. [Google Scholar] [CrossRef]
- Alessi, A.; Agnello, S.; Buscarino, G.; Gelardi, F.M. Structural properties of core and surface of silica nanoparticles investigated by Raman spectroscopy. J. Raman Spectrosc. 2013, 44, 810–816. [Google Scholar] [CrossRef]
- McMillan, P. A Raman spectroscopic study of glasses in the system CaO-MgO-SiO2. Am. Mineral. 1984, 69, 645–659. [Google Scholar]
- Sharma, S.K.; Mammone, J.F.; Nicol, M.F. Raman investigation of ring configurations in vitreous silica. Nature 1981, 292, 140–141. [Google Scholar] [CrossRef]
- McMillan, P. Structural studies of silicate glasses and melts-applications and limitations of Raman spectroscopy. Am. Mineral. 1984, 69, 622–644. [Google Scholar]
- Dulski, M.; Malarz, K.; Kuczak, M.; Dudek, K.; Matus, K.; Sułowicz, S.; Mrozek-Wilczkiewicz, A.; Nowak, A. An Organic–Inorganic Hybrid Nanocomposite as a Potential New Biological Agent. Nanomaterials 2020, 10, 2551. [Google Scholar] [CrossRef]
- Slager, T.L.; Lindgren, B.J.; Mallmann, A.J.; Greenler, R.G. Infrared spectra of the oxides and carbonates of silver. J. Phys. Chem. 1972, 76, 940–943. [Google Scholar] [CrossRef]
- Morimoto, T.; Aoki, K. Effect of adsorbed water on the reaction of silver(I) oxide with carbon dioxide. Langmuir 1986, 2, 525–528. [Google Scholar] [CrossRef]
- Martina, I.; Wiesinger, R.; Jembrih-Simbürger, D.; Schreiner, M. Micro-Raman Characterisation of Silver Corrosion Products: Instrumental Set Up and Reference Database. E-Preserv. Sci. 2012, 9, 1–8. [Google Scholar]
- Dulski, M.; Peszke, J.; Włodarczyk, J.; Sułowicz, S.; Piotrowska-Seget, Z.; Dudek, K.; Podwórny, J.; Malarz, K.; Mrozek-Wilczkiewicz, A.; Zubko, M.; et al. Physicochemical and structural features of heat treated silver-silica nanocomposite and their impact on biological properties. Mater. Sci. Eng. C 2019, 103, 109790. [Google Scholar] [CrossRef]
- Allen, J.A.; Scaife, P.H. Infrared spectra in the Ag2O-CO2-Ag2CO3 system. Aust. J. Chem. 1966, 19, 715–724. [Google Scholar] [CrossRef]
- Shinoda, K.; Hato, M.; Hayashi, T. Physicochemical properties of aqueous solutions of fluorinated surfactants. J. Phys. Chem. 1972, 76, 909–914. [Google Scholar] [CrossRef]
- Zhu, W.; Long, J.; Shi, M. Release Kinetics Model Fitting of Drugs with Different Structures from Viscose Fabric. Materials 2023, 16, 3282. [Google Scholar] [CrossRef] [PubMed]
- Wang, J.; Guo, X. Adsorption isotherm models: Classification, physical meaning, application and solving method. Chemosphere 2020, 258, 127279. [Google Scholar] [CrossRef]
- Ezzati, R. Derivation of Pseudo-First-Order, Pseudo-Second-Order and Modified Pseudo-First-Order rate equations from Langmuir and Freundlich isotherms for adsorption. Chem. Eng. J. 2020, 392, 123705. [Google Scholar] [CrossRef]
- Swolana, D.; Wojtyczka, R.D. Activity of Silver Nanoparticles against Staphylococcus spp. Int. J. Mol. Sci. 2022, 23, 4298. [Google Scholar] [CrossRef] [PubMed]
- Gankhuyag, S.; Bae, D.S.; Lee, K.; Lee, S. One-Pot Synthesis of SiO2@Ag Mesoporous Nanoparticle Coating for Inhibition of Escherichia coli Bacteria on Various Surfaces. Nanomaterials 2021, 11, 549. [Google Scholar] [CrossRef] [PubMed]
- Zhu, Y.; Xu, J.; Wang, Y.; Chen, C.; Gu, H.; Chai, Y.; Wang, Y. Silver nanoparticles-decorated and mesoporous silica coated single-walled carbon nanotubes with an enhanced antibacterial activity for killing drug-resistant bacteria. Nano Res. 2020, 13, 389–400. [Google Scholar] [CrossRef]
- Liu, J.; Li, S.; Fang, Y.; Zhu, Z. Boosting antibacterial activity with mesoporous silica nanoparticles supported silver nanoclusters. J. Colloid Interface Sci. 2019, 555, 470–479. [Google Scholar] [CrossRef] [PubMed]
- Qing, Y.; Cheng, L.; Li, R.; Liu, G.; Zhang, Y.; Tang, X.; Wang, J.; Liu, H.; Qin, Y. Potential antibacterial mechanism of silver nanoparticles and the optimization of orthopedic implants by advanced modification technologies. Int. J. Nanomed. 2018, 13, 3311–3327. [Google Scholar] [CrossRef]
- Wang, X.; Sun, W.; Yang, W.; Gao, S.; Sun, C.; Li, Q. Mesoporous silica-protected silver nanoparticle disinfectant with controlled Ag+ ion release, efficient magnetic separation, and effective antibacterial activity. Nanoscale Adv. 2019, 1, 840–848. [Google Scholar] [CrossRef]
- Li, D.; Qiu, Y.; Zhang, S.; Zhang, M.; Chen, Z.; Chen, J. A Multifunctional Antibacterial and Osteogenic Nanomedicine: QAS-Modified Core-Shell Mesoporous Silica Containing Ag Nanoparticles. BioMed Res. Int. 2020, 2020, 4567049. [Google Scholar] [CrossRef]
- Kang, J.; Dietz, M.J.; Hughes, K.; Xing, M.; Li, B. Silver nanoparticles present high intracellular and extracellular killing against Staphylococcus aureus. J. Antimicrob. Chemother. 2019, 74, 1578–1585. [Google Scholar] [CrossRef]
- Swolana, D.; Kępa, M.; Idzik, D.; Dziedzic, A.; Kabała-Dzik, A.; Wąsik, T.J.; Wojtyczka, R.D. The Antibacterial Effect of Silver Nanoparticles on Staphylococcus Epidermidis Strains with Different Biofilm-Forming Ability. Nanomaterials 2020, 10, 1010. [Google Scholar] [CrossRef] [PubMed]
- Gibała, A.; Żeliszewska, P.; Gosiewski, T.; Krawczyk, A.; Duraczyńska, D.; Szaleniec, J.; Szaleniec, M.; Oćwieja, M. Antibacterial and Antifungal Properties of Silver Nanoparticles—Effect of a Surface-Stabilizing Agent. Biomolecules 2021, 11, 1481. [Google Scholar] [CrossRef] [PubMed]
- Gouyau, J.; Duval, R.E.; Boudier, A.; Lamouroux, E. Investigation of Nanoparticle Metallic Core Antibacterial Activity: Gold and Silver Nanoparticles against Escherichia coli and Staphylococcus aureus. Int. J. Mol. Sci. 2021, 22, 1905. [Google Scholar] [CrossRef] [PubMed]
- Morones, J.R.; Elechiguerra, J.L.; Camacho, A.; Holt, K.; Kouri, J.B.; Ramírez, J.T.; Yacaman, M.J. The bactericidal effect of silver nanoparticles. Nanotechnology 2005, 16, 2346–2353. [Google Scholar] [CrossRef] [PubMed]
- Si, M.; Wang, W.; Guan, Q.; Zhang, H.; Puttaswamy, M. Facile fabrication of highly catalytic-active Ag2CO3/AgBr/graphene oxide ternary composites towards the photocatalytic wastewater treatment. Environ. Sci. Pollut. Res. 2021, 28, 4173–4183. [Google Scholar] [CrossRef]
- Xu, H.; Song, Y.; Song, Y.; Zhu, J.; Zhu, T.; Liu, C.; Zhao, D.; Zhang, Q.; Li, H. Synthesis and characterization of g-C3N4/Ag2CO3 with enhanced visible-light photocatalytic activity for the degradation of organic pollutants. RSC Adv. 2014, 4, 34539. [Google Scholar] [CrossRef]
- Xiao, X.; He, E.-J.; Lu, X.-R.; Wu, L.-J.; Fan, Y.-Y.; Yu, H.-Q. Evaluation of antibacterial activities of silver nanoparticles on culturability and cell viability of Escherichia coli. Sci. Total Environ. 2021, 794, 148765. [Google Scholar] [CrossRef]


| Samples’ Acronyms | AR 1.1 | AR 1.2 | AR 2.1 | AR 2.2 |
|---|---|---|---|---|
| Power (W) | 800 | 150 | ||
| Time (s) | 60 | 150 | 60 | 150 |
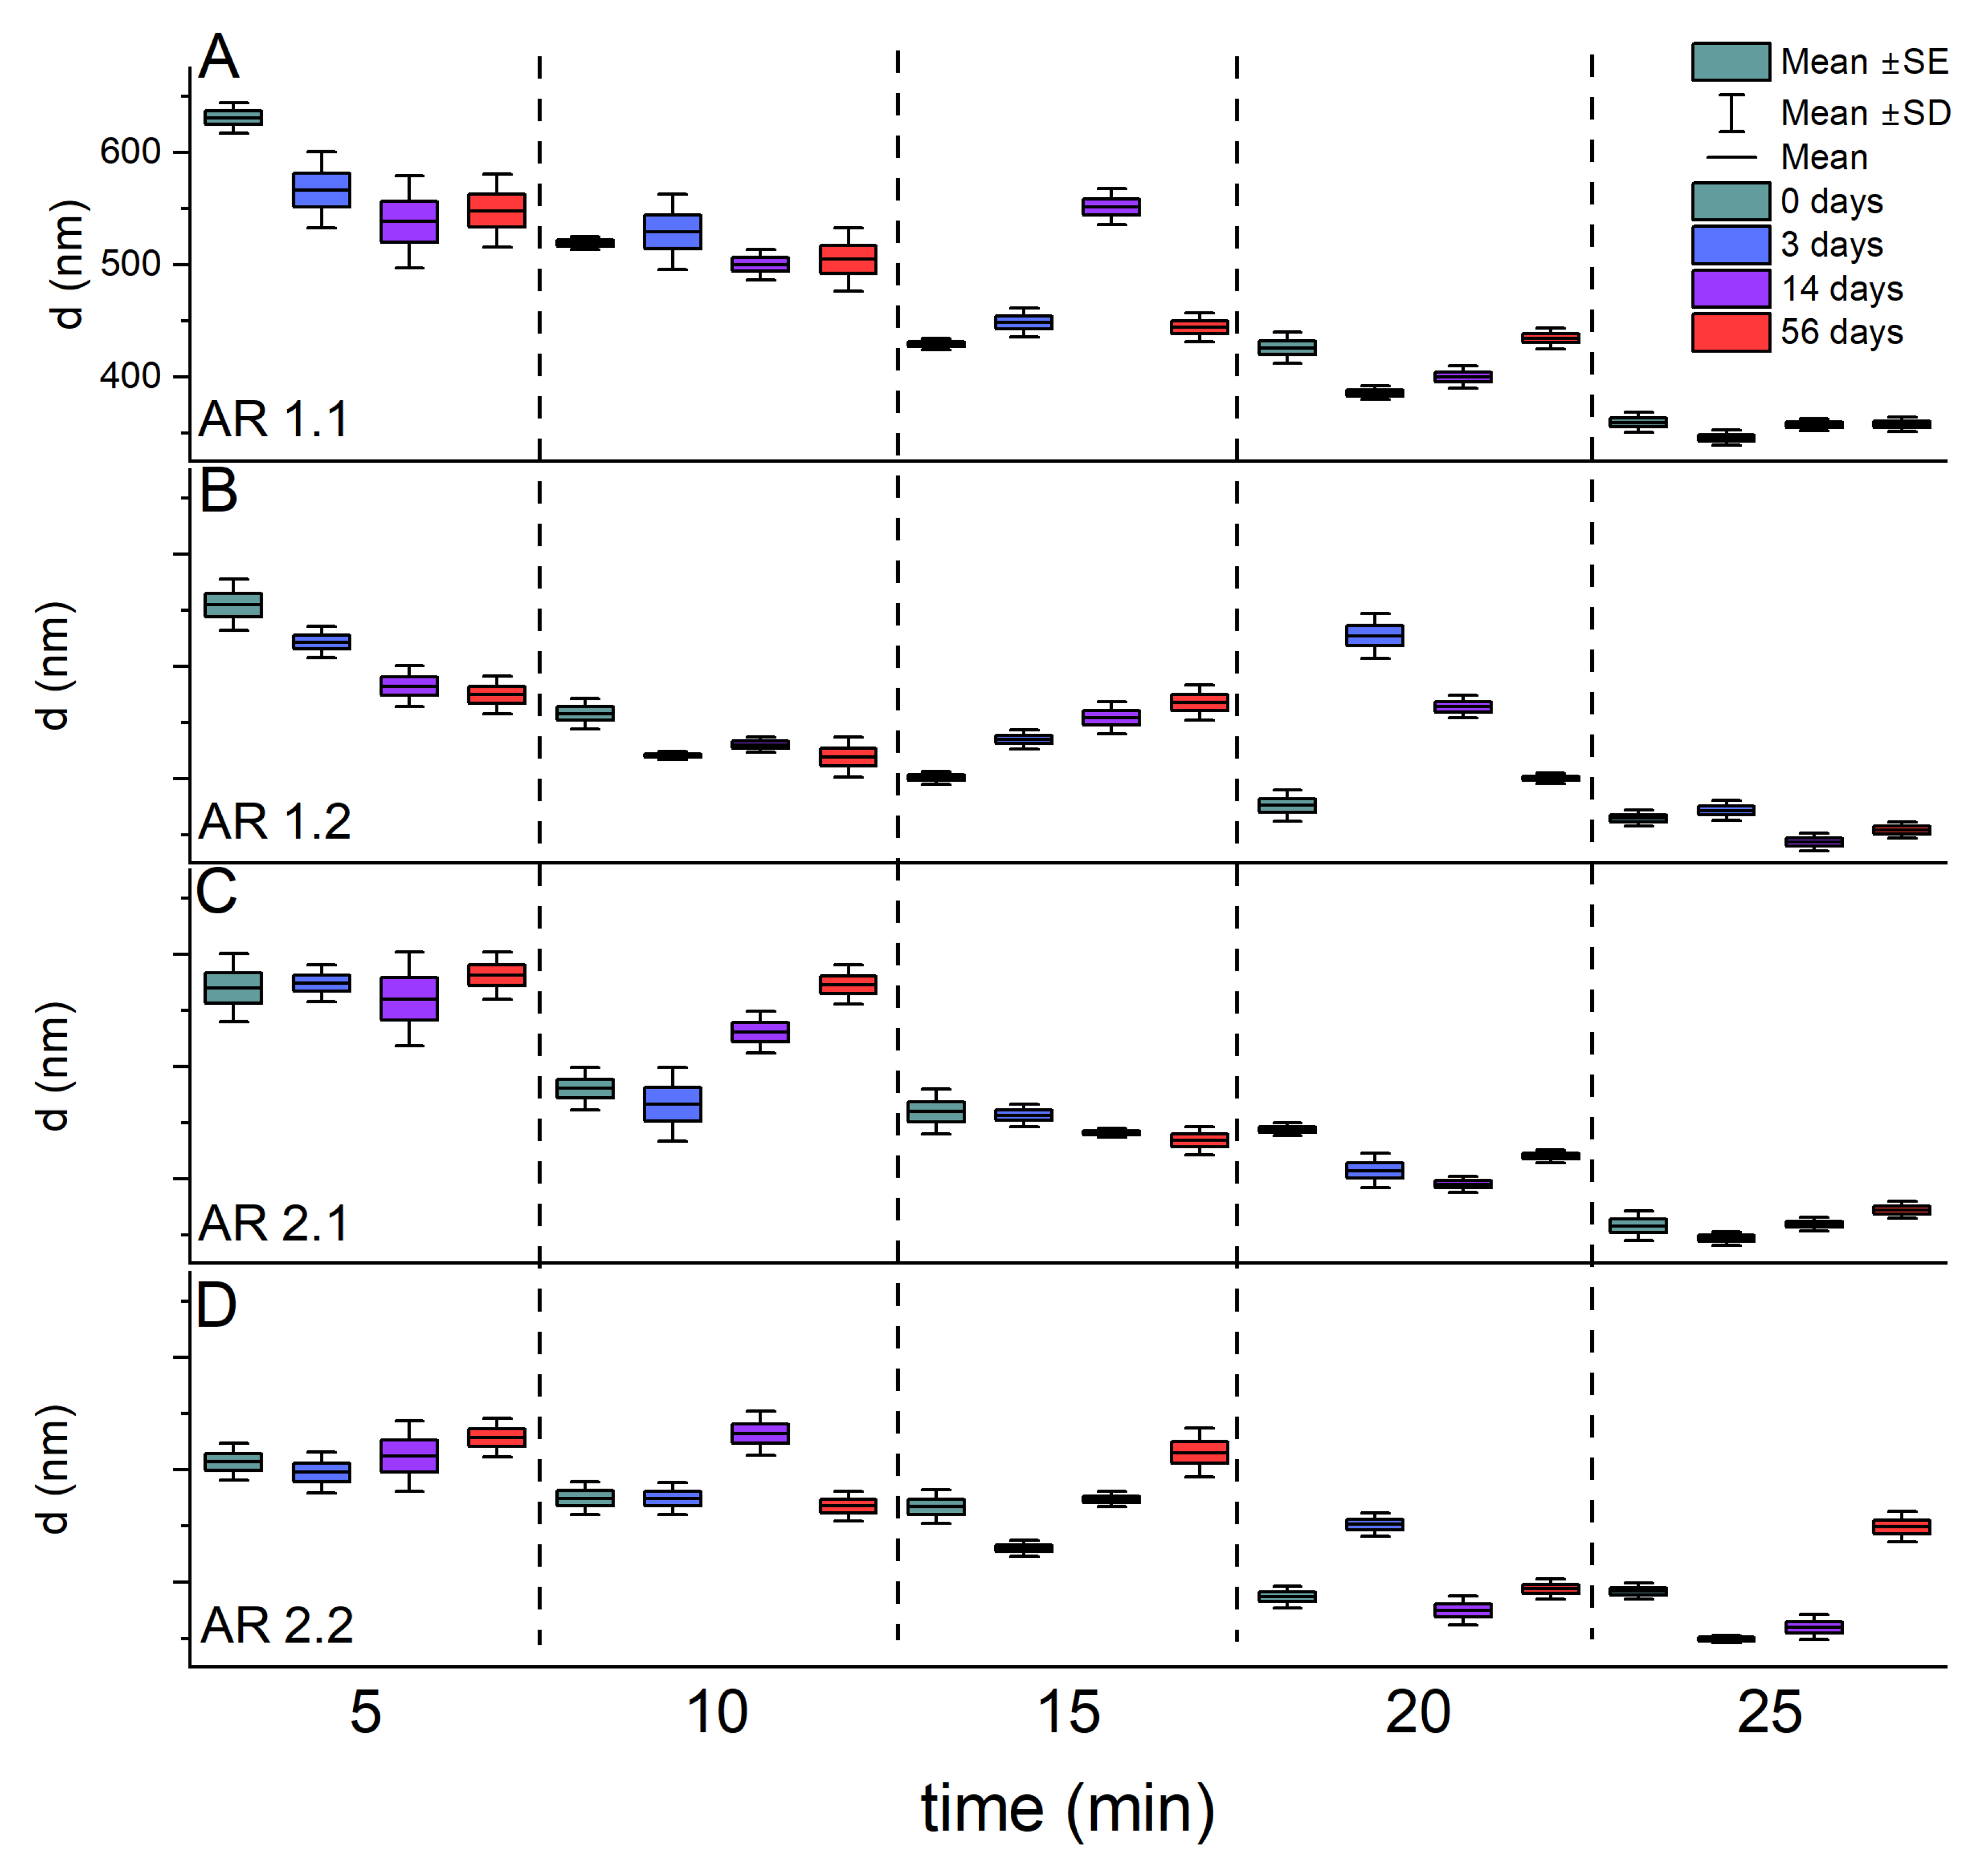
| Sonication Time (min) | AR 1.1 | AR 1.2 | AR 2.1 | AR 2.2 |
|---|---|---|---|---|
| d ± Δd (nm) | d ± Δd (nm) | d ± Δd (nm) | d ± Δd (nm) | |
| 5 | 631 ± 14 | 555 ± 23 | 570 ± 30 | 507 ± 16 |
| 10 | 519 ± 6 | 458 ± 14 | 481 ± 20 | 475 ± 15 |
| 15 | 430 ± 5 | 401 ± 6 | 460 ± 20 | 467 ± 15 |
| 20 | 426 ± 14 | 376 ± 14 | 444 ± 6 | 387 ± 10 |
| 25 | 360 ± 9 | 365 ± 7 | 358 ± 13 | 392 ± 7 |
| Samples’ Acronyms | SSABET (m2/g) | VP (mL/g) * | SP (m2/g) ** | Dpore (nm) | TPV (cm3/g) | Porosity (%) |
|---|---|---|---|---|---|---|
| AR 1.1 | 32.28 ± 0.45 | 0.000545 | 2.76 | 23.17 | 0.186952 | 30.97 |
| AR 1.2 | 31.53 ± 0.17 | 0.000379 | 1.81 | 28.69 | 0.226225 | 35.19 |
| AR 2.1 | 37.79 ± 0.21 | 0.002323 | 5.78 | 29.28 | 0.276651 | 39.90 |
| AR 2.2 | 32.46 ± 0.30 | 0.000386 | 2.11 | 69.73 | 0.565860 | 57.59 |
| Samples’ Acronyms | AR 1.1 | AR 1.2 | AR 2.1 | AR 2.2 |
|---|---|---|---|---|
| CAg (ppm) | 3.94 ± 0.29 | 5.32 ± 0.30 | 1.54 ± 0.25 | 4.31 ± 0.42 |
| tAg (min) | 75.53 ± 9.82 | 72.20 ± 7.62 | 45.37 ± 21.68 | 43.90 ± 13.10 |
| Phase (Space Group) | AR 1.1 | AR 1.2 | AR 2.1 | AR 2.2 |
|---|---|---|---|---|
| (%) | (%) | (%) | (%) | |
| Amorphous SiO2 | 97.4 ± 0.1 | 96.9 ± 0.1 | 96.9 ± 0.1 | 96.4 ± 0.1 |
| Ag2CO3 (P31c) | 0.4 ± 0.1 | 0.5 ± 0.1 | 0.4 ± 0.1 | 1.8 ± 0.1 |
| Ag2CO3 (P21/m) | 1.5 ± 0.1 | 2.1 ± 0.1 | 2.0 ± 0.1 | 1.2 ± 0.1 |
| Ag | 0.7 ± 0.1 | 0.5 ± 0.1 | 0.7 ± 0.1 | 0.6 ± 0.1 |
| Crystallinity index (%) | 2.6 ± 0.2 | 3.1 ± 0.2 | 3.1 ± 0.1 | 3.6 ± 0.1 |
| Phase (Space Group) | Ag2CO3 (P21/m) | Ag2CO3 (P31c) | Ag (Fm-3m) | ||||
|---|---|---|---|---|---|---|---|
| Lattice parameters | a0 (Å) | b0 (Å) | c0 (Å) | β (°) | a0 (Å) | c0 (Å) | a0 (Å) |
| AR 1.1 | 3.256(4) | 9.547(6) | 4.854(7) | 92.04(7) | 9.191(1) | 6.390(7) | 4.089(1) |
| AR 1.2 | 3.254(1) | 9.542(4) | 4.851(7) | 92.03(1) | 9.185(2) | 6.394(8) | 4.089(2) |
| AR 2.1 | 3.254(3) | 9.541(9) | 4.852(8) | 92.01(1) | 9.185(7) | 6.395(2) | 4.088(9) |
| AR 2.1 | 3.256(7) | 9.547(6) | 4.855(1) | 92.03(4) | 9.192(6) | 6.396(8) | 4.089(4) |
| Phase (Space Group) | AR 1.1 | AR 1.2 | AR 2.1 | AR 2.2 | |||||
|---|---|---|---|---|---|---|---|---|---|
| Crystallite Size (Å) | Strain (%) | Crystallite Size (Å) | Strain (%) | Crystallite Size (Å) | Strain (%) | Crystallite Size (Å) | Strain (%) | ||
| Ag2CO3 (P21/m) | [020] | 1148 | 0.342 | 1113 | 0.349 | 1246 | 0.324 | 1109 | 0.350 |
| [110] | 829 | 0.383 | 599 | 0.482 | 690 | 0.435 | 636 | 0.462 | |
| [101] | 539 | 0.319 | 482 | 0.347 | 512 | 0.331 | 488 | 0.343 | |
| Ag2CO3 (P31c) | [110] | 1348 | 0.297 | 866 | 0.397 | 1074 | 0.344 | 971 | 0.367 |
| [300] | 674 | 0.268 | 693 | 0.262 | 543 | 0.313 | 710 | 0.258 | |
| Ag (Fm-3m) | [111] | 285 | 0.465 | 266 | 0.491 | 263 | 0.496 | 180 | 0.687 |
| Samples’ Acronyms | TEM-EDS | SEM-EDS | ||||
|---|---|---|---|---|---|---|
| O (at.%) | Si (at.%) | Ag (at.%) | O (at.%) | Si (at.%) | Ag (at.%) | |
| AR 1.1 | 83.0 ± 8.1 | 14.8 ± 9.2 | 2.2 ±1.8 | 76.2 ± 6.6 | 22.1 ± 7.0 | 1.7 ± 1.3 |
| AR 1.2 | 81.3 ± 2.3 | 11.0 ± 5.3 | 7.8 ± 2.6 | 77.6 ± 0.5 | 21.5 ± 0.5 | 1.0 ± 0.1 |
| AR 2.1 | 79.0 ± 3.5 | 20.3 ± 3.3 | 0. 7 ± 0.5 | 79.7 ± 3.9 | 18.0 ± 4.4 | 2.4 ± 1.4 |
| AR 2.2 | 82.1 ± 1.6 | 16.8 ± 1.3 | 1.1 ± 0.4 | 80.2 ± 1.1 | 17.0 ± 2.6 | 2.8 ± 1.5 |
| Samples’ Acronyms | ds (nm) | Ss (nm2) | Sas (nm2) | %Spherical | %Enveloped * | %Cube * |
|---|---|---|---|---|---|---|
| AR 1.1 | 2.05 ± 0.03 | 3.66 ± 0.10 | 74.14 ± 2.19 | 94.70 | 0.71 | 1.68 |
| AR 1.2 | 3.14 ± 0.09 | 7.47 ± 0.26 | 161.66 ± 3.91 | 73.30 | 5.76 | 1.05 |
| AR 2.1 | 8.59 ± 0.33 | 59.45 ± 5.23 | 171.18 ± 20.03 | 71.96 | 2.8 | 0 |
| AR 2.2 | 10.19 ± 0.36 | 107.33 ± 7.83 | 227.5 ± 8.09 | 58.80 | 9.74 | 0 |
| Samples’ Acronyms | Diagonal of the Envelope (nm) | Envelope Area (nm2) * |
|---|---|---|
| AR 1.1 | 415.84 ± 158.25 | 60,213.97 ± 26,288.26 |
| AR 1.2 | 41.88 ± 8.46 | 1325.23 ± 311.13 |
| AR 2.1 | 49.64 ± 4.23 | 1109.92 ± 470.14 |
| AR 2.2 | 59.05 ± 18.43 | 1841.37 ± 1338.04 |
| Exponential Model | Pseudo-First Order | ||||||
|---|---|---|---|---|---|---|---|
| Samples’ Acronyms | CAg (µg/L) | t (h) | R2 | qe (µg/L) | k1 (1/h) | k1 (h) | R2 |
| AR 1.1 | 1124.75 ± 66.03 | 38.99 ± 5.20 | 0.997 | 1097.50 ± 69.55 | 0.03 ± 0.004 | 33.3 ± 4.4 | 0.991 |
| AR 1.2 | 680.22 ± 37.75 | 15.58 ± 2.56 | 0.986 | 719.68 ± 36.59 | 0.08 ± 0.01 | 12.5 ± 1.6 | 0.973 |
| AR 2.1 | 852.74 ± 56.63 | 19.83 ± 4.46 | 0.978 | 813.50 ± 57.48 | 0.07 ± 0.01 | 14.3 ± 2.1 | 0.952 |
| AR 2.2 | 684.25 ± 69.86 | 17.76 ± 5.41 | 0.957 | 752.22 ± 64.08 | 0.09 ± 0.02 | 11.1 ± 2.5 | 0.911 |
| Samples’ Acronyms | E. coli ATCC® 25922TM | S. epidermidis ATCC® 12228TM | ||
|---|---|---|---|---|
| MIC | IC50 | MIC | IC50 | |
| AR 1.1 | 180 | 13.34 | 120 | 9.88 |
| AR 1.2 | 150 | 61.76 | 120 | 30.27 |
| AR 2.1 | 150 | 47.28 | 120 | 12.33 |
| AR 2.2 | 150 | 38.68 | 80 | 8.72 |
Disclaimer/Publisher’s Note: The statements, opinions and data contained in all publications are solely those of the individual author(s) and contributor(s) and not of MDPI and/or the editor(s). MDPI and/or the editor(s) disclaim responsibility for any injury to people or property resulting from any ideas, methods, instructions or products referred to in the content. |
© 2024 by the authors. Licensee MDPI, Basel, Switzerland. This article is an open access article distributed under the terms and conditions of the Creative Commons Attribution (CC BY) license (https://creativecommons.org/licenses/by/4.0/).
Share and Cite
Strach, A.; Dulski, M.; Wasilkowski, D.; Matus, K.; Dudek, K.; Podwórny, J.; Rawicka, P.; Grebnevs, V.; Waloszczyk, N.; Nowak, A.; et al. Multifaceted Assessment of Porous Silica Nanocomposites: Unraveling Physical, Structural, and Biological Transformations Induced by Microwave Field Modification. Nanomaterials 2024, 14, 337. https://doi.org/10.3390/nano14040337
Strach A, Dulski M, Wasilkowski D, Matus K, Dudek K, Podwórny J, Rawicka P, Grebnevs V, Waloszczyk N, Nowak A, et al. Multifaceted Assessment of Porous Silica Nanocomposites: Unraveling Physical, Structural, and Biological Transformations Induced by Microwave Field Modification. Nanomaterials. 2024; 14(4):337. https://doi.org/10.3390/nano14040337
Chicago/Turabian StyleStrach, Aleksandra, Mateusz Dulski, Daniel Wasilkowski, Krzysztof Matus, Karolina Dudek, Jacek Podwórny, Patrycja Rawicka, Vladlens Grebnevs, Natalia Waloszczyk, Anna Nowak, and et al. 2024. "Multifaceted Assessment of Porous Silica Nanocomposites: Unraveling Physical, Structural, and Biological Transformations Induced by Microwave Field Modification" Nanomaterials 14, no. 4: 337. https://doi.org/10.3390/nano14040337