
Strain-Induced Ferromagnetism in Monolayer T″-Phase VTe2: Unveiling Magnetic States and Anisotropy for Spintronics Advancement

 , , and
Abstract
:1. Introduction
2. Materials and Methods
3. Results
3.1. The Determination of the Hubbard U Value for VTe2
3.2. The Structural, Electronic, and Magnetic Attributes of Monolayer T″-Phase VTe2
4. Conclusions
Author Contributions
Funding
Data Availability Statement
Acknowledgments
Conflicts of Interest
References
- Gong, C.; Li, L.; Li, Z.; Ji, H.; Stern, A.; Xia, Y.; Cao, T.; Bao, W.; Wang, C.; Wang, Y.; et al. Discovery of intrinsic ferromagnetism in two-dimensional van der Waals crystals. Nature 2017, 546, 265–269. [Google Scholar] [CrossRef] [PubMed]
- Huang, B.; Clark, G.; Navarro-Moratalla, E.; Klein, D.R.; Cheng, R.; Seyler, K.L.; Zhong, D.; Schmidgall, E.; McGuire, M.A.; Cobden, D.H.; et al. Layer-dependent ferromagnetism in a van der Waals crystal down to the monolayer limit. Nature 2017, 546, 270–273. [Google Scholar] [CrossRef] [PubMed]
- Jiang, S.; Li, L.; Wang, Z.; Mak, K.F.; Shan, J. Controlling magnetism in 2D CrI3 by electrostatic doping. Nat. Nanotechnol. 2018, 13, 549–553. [Google Scholar] [CrossRef] [PubMed]
- Matsukura, F.; Tokura, Y.; Ohno, H. Control of magnetism by electric fields. Nat. Nanotechnol. 2015, 10, 209–220. [Google Scholar] [CrossRef] [PubMed]
- Feng, Y.P.; Shen, L.; Yang, M.; Wang, A.; Zeng, M.; Wu, Q.; Chintalapati, S.; Chang, C.-R. Prospects of spintronics based on 2D materials. Wiley Interdiscip. Rev. Comput. Mol. Sci. 2017, 7, e1313. [Google Scholar] [CrossRef]
- Cheng, H.-X.; Zhou, J.; Ji, W.; Zhang, Y.-N.; Feng, Y.-P. Two-dimensional intrinsic ferrovalley GdI2 with large valley polarization. Phys. Rev. B 2021, 103, 125121. [Google Scholar] [CrossRef]
- Deng, Y.; Yu, Y.; Song, Y.; Zhang, J.; Wang, N.Z.; Sun, Z.; Yi, Y.; Wu, Y.Z.; Wu, S.; Zhu, J.; et al. Gate-tunable room-temperature ferromagnetism in two-dimensional Fe3GeTe2. Nature 2018, 563, 94–99. [Google Scholar] [CrossRef] [PubMed]
- Bonilla, M.; Kolekar, S.; Ma, Y.; Diaz, H.C.; Kalappattil, V.; Das, R.; Eggers, T.; Gutierrez, H.R.; Phan, M.H.; Batzill, M. Strong room-temperature ferromagnetism in VSe2 monolayers on van der Waals substrates. Nat. Nanotechnol. 2018, 13, 289–293. [Google Scholar] [CrossRef]
- Miao, N.; Xu, B.; Zhu, L.; Zhou, J.; Sun, Z. 2D Intrinsic Ferromagnets from van der Waals Antiferromagnets. J. Am. Chem. Soc. 2018, 140, 2417–2420. [Google Scholar] [CrossRef] [PubMed]
- Jiang, Z.; Wang, P.; Xing, J.; Jiang, X.; Zhao, J. Screening and Design of Novel 2D Ferromagnetic Materials with High Curie Temperature above Room Temperature. ACS Appl. Mater. Interfaces 2018, 10, 39032–39039. [Google Scholar] [CrossRef] [PubMed]
- Zhou, J.; Feng, Y.P.; Shen, L. Atomic-orbital-free intrinsic ferromagnetism in electrenes. Phys. Rev. B 2020, 102, 180407(R). [Google Scholar] [CrossRef]
- Gong, C.; Zhang, X. Two-dimensional magnetic crystals and emergent heterostructure devices. Science 2019, 363, eaav4450. [Google Scholar] [CrossRef] [PubMed]
- Lu, S.; Zhou, Q.; Guo, Y.; Zhang, Y.; Wu, Y.; Wang, J. Coupling a Crystal Graph Multilayer Descriptor to Active Learning for Rapid Discovery of 2D Ferromagnetic Semiconductors/Half-Metals/Metals. Adv. Mater. 2020, 32, e2002658. [Google Scholar] [CrossRef] [PubMed]
- Mermin, N.D.; Wagner, H. Absence of Ferromagnetism or Antiferromagnetism in One- or Two-Dimensional Isotropic Heisenberg Models. Phys. Rev. Lett. 1966, 17, 1133–1136. [Google Scholar] [CrossRef]
- Gibertini, M.; Koperski, M.; Morpurgo, A.F.; Novoselov, K.S. Magnetic 2D materials and heterostructures. Nat. Nanotechnol. 2019, 14, 408–419. [Google Scholar] [CrossRef] [PubMed]
- Torelli, D.; Thygesen, K.S.; Olsen, T. High throughput computational screening for 2D ferromagnetic materials: The critical role of anisotropy and local correlations. 2D Mater. 2019, 6, 045018. [Google Scholar] [CrossRef]
- Chua, R.; Zhou, J.; Yu, X.; Yu, W.; Gou, J.; Zhu, R.; Zhang, L.; Liu, M.; Breese, M.B.H.; Chen, W. Room Temperature Ferromagnetism of Monolayer Chromium Telluride with Perpendicular Magnetic Anisotropy. Adv. Mater. 2021, 33, e2103360. [Google Scholar] [CrossRef] [PubMed]
- Zhou, J.; Song, X.; Yang, M.; Chai, J.; Wong, N.L.M.; Shen, L.; Wang, S.; Feng, Y.P. A first principles study of uniaxial strain-stabilized long–range ferromagnetic ordering in electrenes. J. Mater. Chem. C 2021, 9, 16576–16580. [Google Scholar] [CrossRef]
- Niu, C.; Qiu, G.; Wang, Y.; Zhang, Z.; Si, M.; Wu, W.; Ye, P.D. Gate-tunable strong spin-orbit interaction in two-dimensional tellurium probed by weak antilocalization. Phys. Rev. B 2020, 101, 205414. [Google Scholar] [CrossRef]
- Su, J.; Liu, K.; Wang, F.; Jin, B.; Guo, Y.; Liu, G.; Li, H.; Zhai, T. van der Waals 2D transition metal tellurides. Adv. Mater. Interfaces 2019, 6, 1900741. [Google Scholar] [CrossRef]
- Mitsuishi, N.; Sugita, Y.; Bahramy, M.S.; Kamitani, M.; Sonobe, T.; Sakano, M.; Shimojima, T.; Takahashi, H.; Sakai, H.; Horiba, K.; et al. Switching of band inversion and topological surface states by charge density wave. Nat. Commun. 2020, 11, 2466. [Google Scholar] [CrossRef] [PubMed]
- Naik, M.H.; Regan, E.C.; Zhang, Z.; Chan, Y.-H.; Li, Z.; Wang, D.; Yoon, Y.; Ong, C.S.; Zhao, W.; Zhao, S. Intralayer charge-transfer moiré excitons in van der Waals superlattices. Nature 2022, 609, 52–57. [Google Scholar] [CrossRef] [PubMed]
- Li, J.; Zhao, B.; Chen, P.; Wu, R.; Li, B.; Xia, Q.; Guo, G.; Luo, J.; Zang, K.; Zhang, Z.; et al. Synthesis of Ultrathin Metallic MTe2 (M = V, Nb, Ta) Single-Crystalline Nanoplates. Adv. Mater. 2018, 30, 1801043. [Google Scholar] [CrossRef] [PubMed]
- Whangbo, M.H.; Canadell, E. Analogies between the concepts of molecular chemistry and solid-state physics concerning structural instabilities. Electronic origin of the structural modulations in layered transition metal dichalcogenides. J. Am. Chem. Soc. 1992, 114, 9587–9600. [Google Scholar] [CrossRef]
- Manzeli, S.; Ovchinnikov, D.; Pasquier, D.; Yazyev, O.V.; Kis, A. 2D transition metal dichalcogenides. Nat. Rev. Mater. 2017, 2, 17033. [Google Scholar] [CrossRef]
- Strocov, V.N.; Shi, M.; Kobayashi, M.; Monney, C.; Wang, X.; Krempasky, J.; Schmitt, T.; Patthey, L.; Berger, H.; Blaha, P. Three-dimensional electron realm in VSe2 by soft-X-ray photoelectron spectroscopy: Origin of charge-density waves. Phys. Rev. Lett. 2012, 109, 086401. [Google Scholar] [CrossRef] [PubMed]
- Si, J.G.; Lu, W.J.; Wu, H.Y.; Lv, H.Y.; Liang, X.; Li, Q.J.; Sun, Y.P. Origin of the multiple charge density wave order in 1T−VSe2. Phys. Rev. B 2020, 101, 235405. [Google Scholar] [CrossRef]
- Zhang, K.; Si, C.; Lian, C.-S.; Zhou, J.; Sun, Z. Mottness collapse in monolayer 1T-TaSe2 with persisting charge density wave order. J. Mater. Chem. C 2020, 8, 9742–9747. [Google Scholar] [CrossRef]
- Li, L.J.; O’Farrell, E.C.; Loh, K.P.; Eda, G.; Ozyilmaz, B.; Castro Neto, A.H. Controlling many-body states by the electric-field effect in a two-dimensional material. Nature 2016, 529, 185–189. [Google Scholar] [CrossRef] [PubMed]
- Grüner, G. The dynamics of charge-density waves. Rev. Mod. Phys. 1988, 60, 1129. [Google Scholar] [CrossRef]
- Qian, X.; Liu, J.; Fu, L.; Li, J. Quantum spin Hall effect in two-dimensional transition metal dichalcogenides. Science 2014, 346, 1344–1347. [Google Scholar] [CrossRef] [PubMed]
- Kim, H.; Shim, J.H.; Kim, S.; Park, J.H.; Kim, K.; Min, B.I. Unusual Pressure-Induced Quantum Phase Transition from Superconducting to Charge-Density Wave State in Rare-Earth-Based Heusler LuPd2 In Compound. Phys. Rev. Lett. 2020, 125, 157001. [Google Scholar] [CrossRef] [PubMed]
- Kusmartseva, A.F.; Sipos, B.; Berger, H.; Forro, L.; Tutis, E. Pressure induced superconductivity in pristine 1T-TiSe2. Phys. Rev. Lett. 2009, 103, 236401. [Google Scholar] [CrossRef] [PubMed]
- Chen, C.; Singh, B.; Lin, H.; Pereira, V.M. Reproduction of the Charge Density Wave Phase Diagram in 1T-TiSe2 Exposes its Excitonic Character. Phys. Rev. Lett. 2018, 121, 226602. [Google Scholar] [CrossRef] [PubMed]
- Kolincio, K.K.; Roman, M.; Klimczuk, T. Enhanced Mobility and Large Linear Nonsaturating Magnetoresistance in the Magnetically Ordered States of TmNiC2. Phys. Rev. Lett. 2020, 125, 176601. [Google Scholar] [CrossRef] [PubMed]
- Stoner, E.C. Collective electron ferronmagnetism. Proc. R. Soc. Lond. A 1938, 165, 372–414. [Google Scholar]
- Zhou, J.; Wang, Z.; Wang, S.; Feng, Y.P.; Yang, M.; Shen, L. Coexistence of ferromagnetism and charge density waves in monolayer LaBr2. Nanoscale Horiz. 2023, 8, 1054–1061. [Google Scholar] [CrossRef] [PubMed]
- Won, D.; Kiem, D.H.; Cho, H.; Kim, D.; Kim, Y.; Jeong, M.Y.; Seo, C.; Kim, J.; Park, J.G.; Han, M.J.; et al. Polymorphic spin, charge, and lattice waves in vanadium ditelluride. Adv. Mater. 2020, 32, e1906578. [Google Scholar] [CrossRef]
- Coelho, P.M.; Lasek, K.; Nguyen Cong, K.; Li, J.; Niu, W.; Liu, W.; Oleynik, I.I.; Batzill, M. Monolayer modification of VTe2 and its charge density wave. J. Phys. Chem. Lett. 2019, 10, 4987–4993. [Google Scholar] [CrossRef] [PubMed]
- Dai, T.; Kang, S.; Ma, X.; Dang, S.; Li, H.; Ruan, Z.; Zhou, W.; Hu, P.; Li, S.; Wu, S. Multiple Transitions of Charge Density Wave Order in Epitaxial Few-Layered 1T′-VTe2 Films. J. Phys. Chem. C 2019, 123, 18711–18716. [Google Scholar] [CrossRef]
- Wang, Y.; Ren, J.; Li, J.; Wang, Y.; Peng, H.; Yu, P.; Duan, W.; Zhou, S. Evidence of charge density wave with anisotropic gap in a monolayer VTe2 film. Phys. Rev. B 2019, 100, 241404. [Google Scholar] [CrossRef]
- Sugawara, K.; Nakata, Y.; Fujii, K.; Nakayama, K.; Souma, S.; Takahashi, T.; Sato, T. Monolayer VTe2: Incommensurate Fermi surface nesting and suppression of charge density waves. Phys. Rev. B 2019, 99, 241404. [Google Scholar] [CrossRef]
- Kresse, G.; Hafner, J. Ab initio molecular dynamics for liquid metals. Phys. Rev. B 1993, 47, 558–561. [Google Scholar] [CrossRef] [PubMed]
- Kresse, G.; Hafner, J. Ab initio molecular-dynamics simulation of the liquid-metal--amorphous-semiconductor transition in germanium. Phys. Rev. B 1994, 49, 14251–14269. [Google Scholar] [CrossRef] [PubMed]
- Kresse, G.; Joubert, D. From ultrasoft pseudopotentials to the projector augmented-wave method. Phys. Rev. B 1999, 59, 1758–1775. [Google Scholar] [CrossRef]
- Perdew, J.P.; Burke, K.; Ernzerhof, M. Generalized gradient approximation made simple. Phys. Rev. Lett. 1996, 77, 3865. [Google Scholar] [CrossRef] [PubMed]
- Evans, R.F.; Atxitia, U.; Chantrell, R.W. Quantitative simulation of temperature-dependent magnetization dynamics and equilibrium properties of elemental ferromagnets. Phys. Rev. B 2015, 91, 144425. [Google Scholar] [CrossRef]
- Evans, R.F.; Fan, W.J.; Chureemart, P.; Ostler, T.A.; Ellis, M.O.; Chantrell, R.W. Atomistic spin model simulations of magnetic nanomaterials. J. Phys. Condens. Matter 2014, 26, 103202. [Google Scholar] [CrossRef] [PubMed]
- Bronsema, K.D.; Bus, G.W.; Wiegers, G.A. The crystal structure of vanadium ditelluride, V1+xTe2. J. Solid State Chem. 1984, 53, 415–421. [Google Scholar] [CrossRef]
- Han, G.H.; Duong, D.L.; Keum, D.H.; Yun, S.J.; Lee, Y.H. van der Waals metallic transition metal dichalcogenides. Chem. Rev. 2018, 118, 6297–6336. [Google Scholar] [CrossRef] [PubMed]


| Lattice | x | y | z |
| a | 7.4403 | 0 | 0 |
| b | 6.5837 | 3.4660 | 0 |
| c | −10.8930 | −2.6921 | 8.5749 |
| Atom | a | b | c |
| V1 | 0.3468 | 0.3468 | 0.70819 |
| V2 | 0.6532 | 0.6532 | 0.29181 |
| V3 | 0 | 0 | 0 |
| Te1 | 0.62794 | 0.62794 | 0.98386 |
| Te2 | 0.37206 | 0.37206 | 0.01614 |
| Te3 | 0.08852 | 0.08853 | 0.38103 |
| Te4 | 0.91147 | 0.91148 | 0.61897 |
| Te5 | 0.70404 | 0.70404 | 0.69656 |
| Te6 | 0.29596 | 0.29596 | 0.30344 |
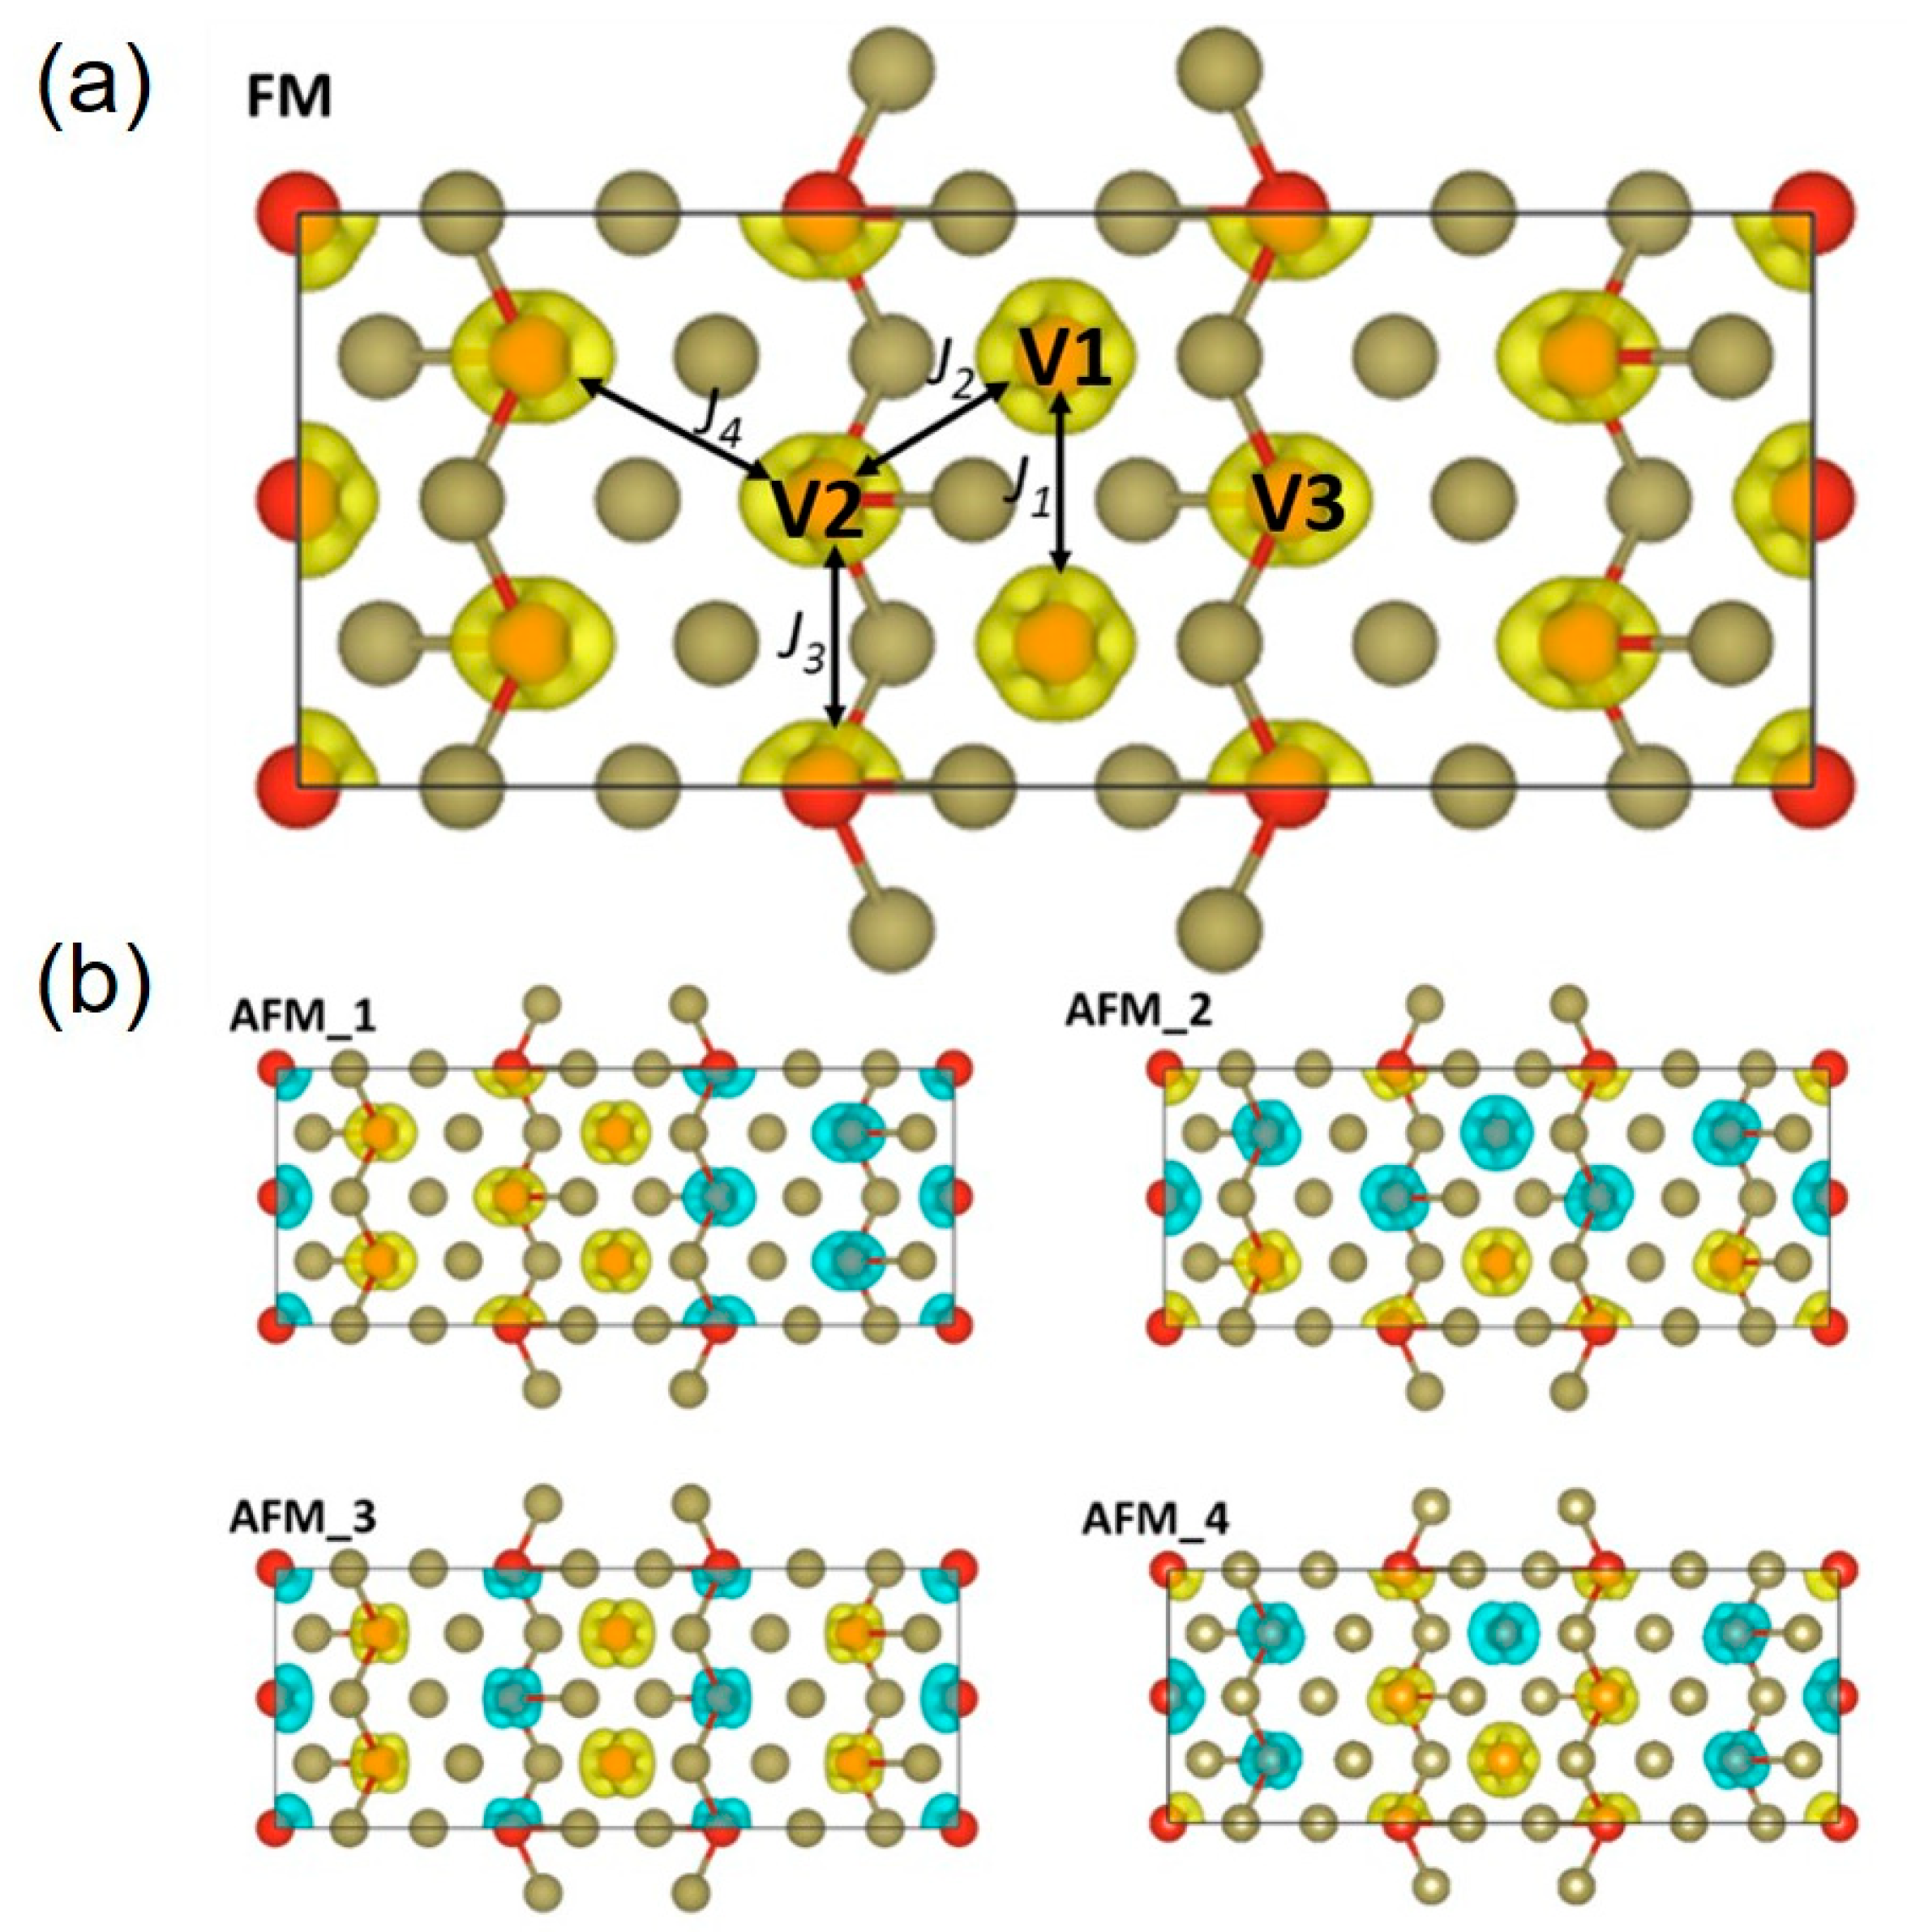
| J1 (meV/Link) | J2 (meV/Link) | J3 (meV/Link) | J4 (meV/Link) | Etot (eV) | |
|---|---|---|---|---|---|
| FM | 8 | 16 | 4 | 8 | −194.33 |
| AFM_1 | −8 | 0 | −4 | 0 | −193.99 |
| AFM_2 | 8 | 0 | 4 | 8 | −194.08 |
| AFM_3 | 8 | −16 | 4 | −8 | −193.90 |
| AFM_4 | 8 | 0 | −4 | −8 | −193.99 |
| 2.77 | −15.61 | −20.93 | 4.85 |
Disclaimer/Publisher’s Note: The statements, opinions and data contained in all publications are solely those of the individual author(s) and contributor(s) and not of MDPI and/or the editor(s). MDPI and/or the editor(s) disclaim responsibility for any injury to people or property resulting from any ideas, methods, instructions or products referred to in the content. |
© 2024 by the authors. Licensee MDPI, Basel, Switzerland. This article is an open access article distributed under the terms and conditions of the Creative Commons Attribution (CC BY) license (https://creativecommons.org/licenses/by/4.0/).
Share and Cite
Tang, X.; Zhou, J.; Wong, N.L.M.; Chai, J.; Liu, Y.; Wang, S.; Song, X. Strain-Induced Ferromagnetism in Monolayer T″-Phase VTe2: Unveiling Magnetic States and Anisotropy for Spintronics Advancement. Nanomaterials 2024, 14, 704. https://doi.org/10.3390/nano14080704
Tang X, Zhou J, Wong NLM, Chai J, Liu Y, Wang S, Song X. Strain-Induced Ferromagnetism in Monolayer T″-Phase VTe2: Unveiling Magnetic States and Anisotropy for Spintronics Advancement. Nanomaterials. 2024; 14(8):704. https://doi.org/10.3390/nano14080704
Chicago/Turabian StyleTang, Xiaoting, Jun Zhou, Nancy Lai Mun Wong, Jianwei Chai, Yi Liu, Shijie Wang, and Xiaohe Song. 2024. "Strain-Induced Ferromagnetism in Monolayer T″-Phase VTe2: Unveiling Magnetic States and Anisotropy for Spintronics Advancement" Nanomaterials 14, no. 8: 704. https://doi.org/10.3390/nano14080704