

Graphene Oxide (GO)-Based Bioink with Enhanced 3D Printability and Mechanical Properties for Tissue Engineering Applications
 , , ,
, , ,
Abstract
:
1. Introduction
2. Materials and Methods
2.1. Biomaterials
2.2. Cell Line
2.3. Rheology
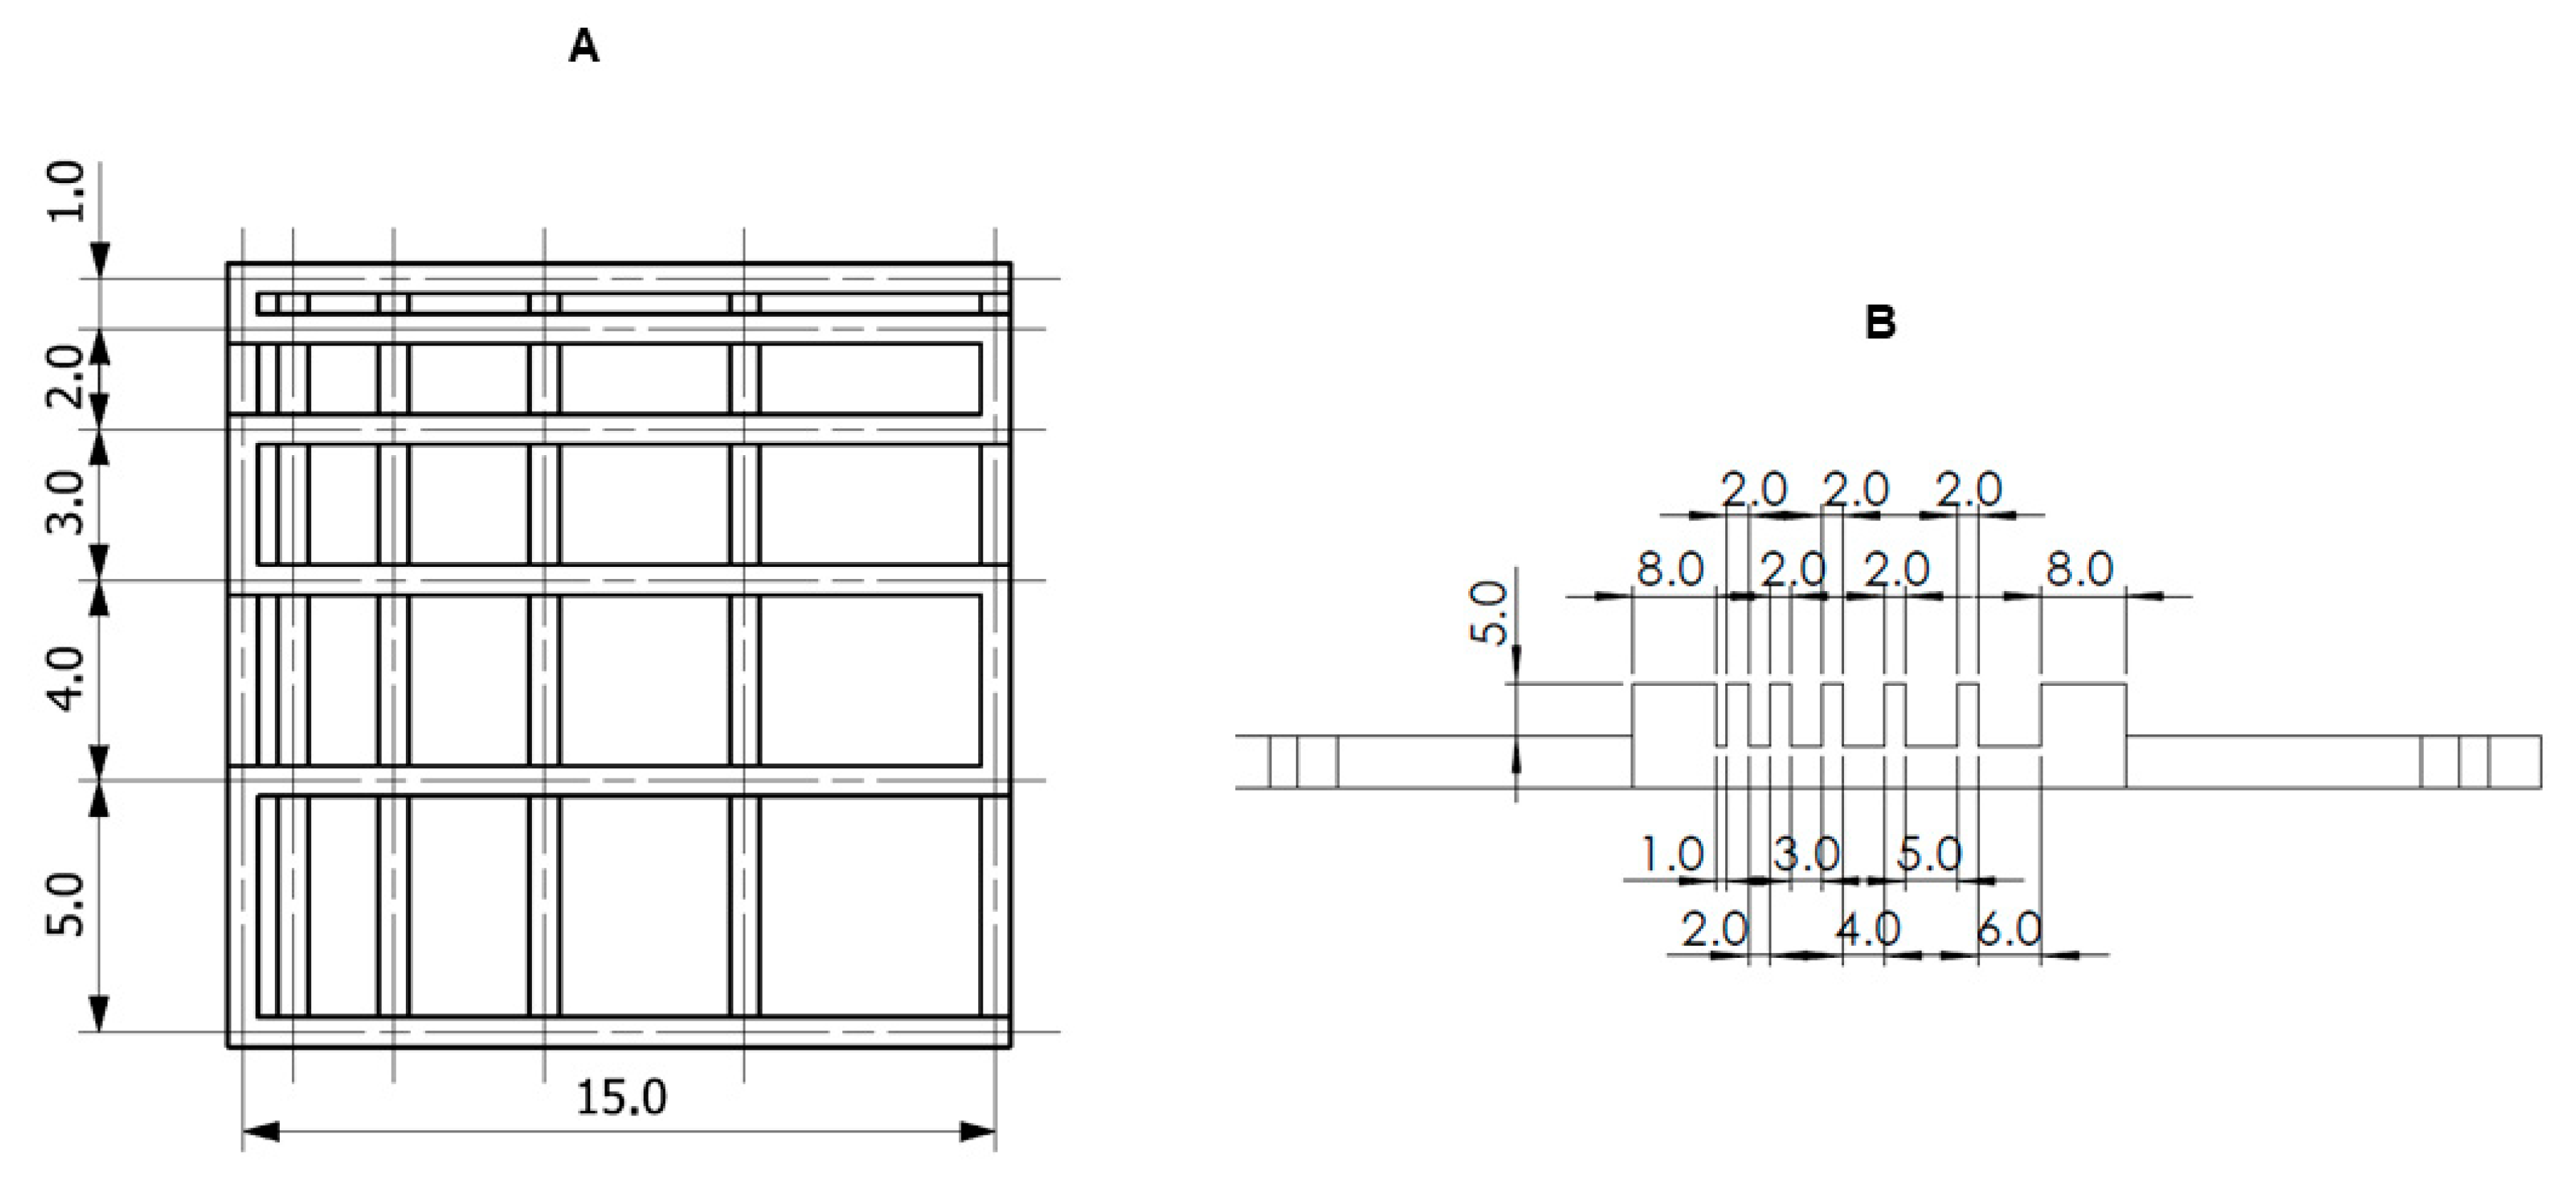
2.4. Printability
2.4.1. Fiber Splicing Test
2.4.2. Fiber Collapse Test
2.4.3. Smoothness and Fiber Continuity
2.5. Mechanical Testing
2.6. Degradation
2.7. Effective Swelling and Absorbability
2.8. Biological Tests
2.8.1. Viability Assay
2.8.2. Cytotoxicity Assay
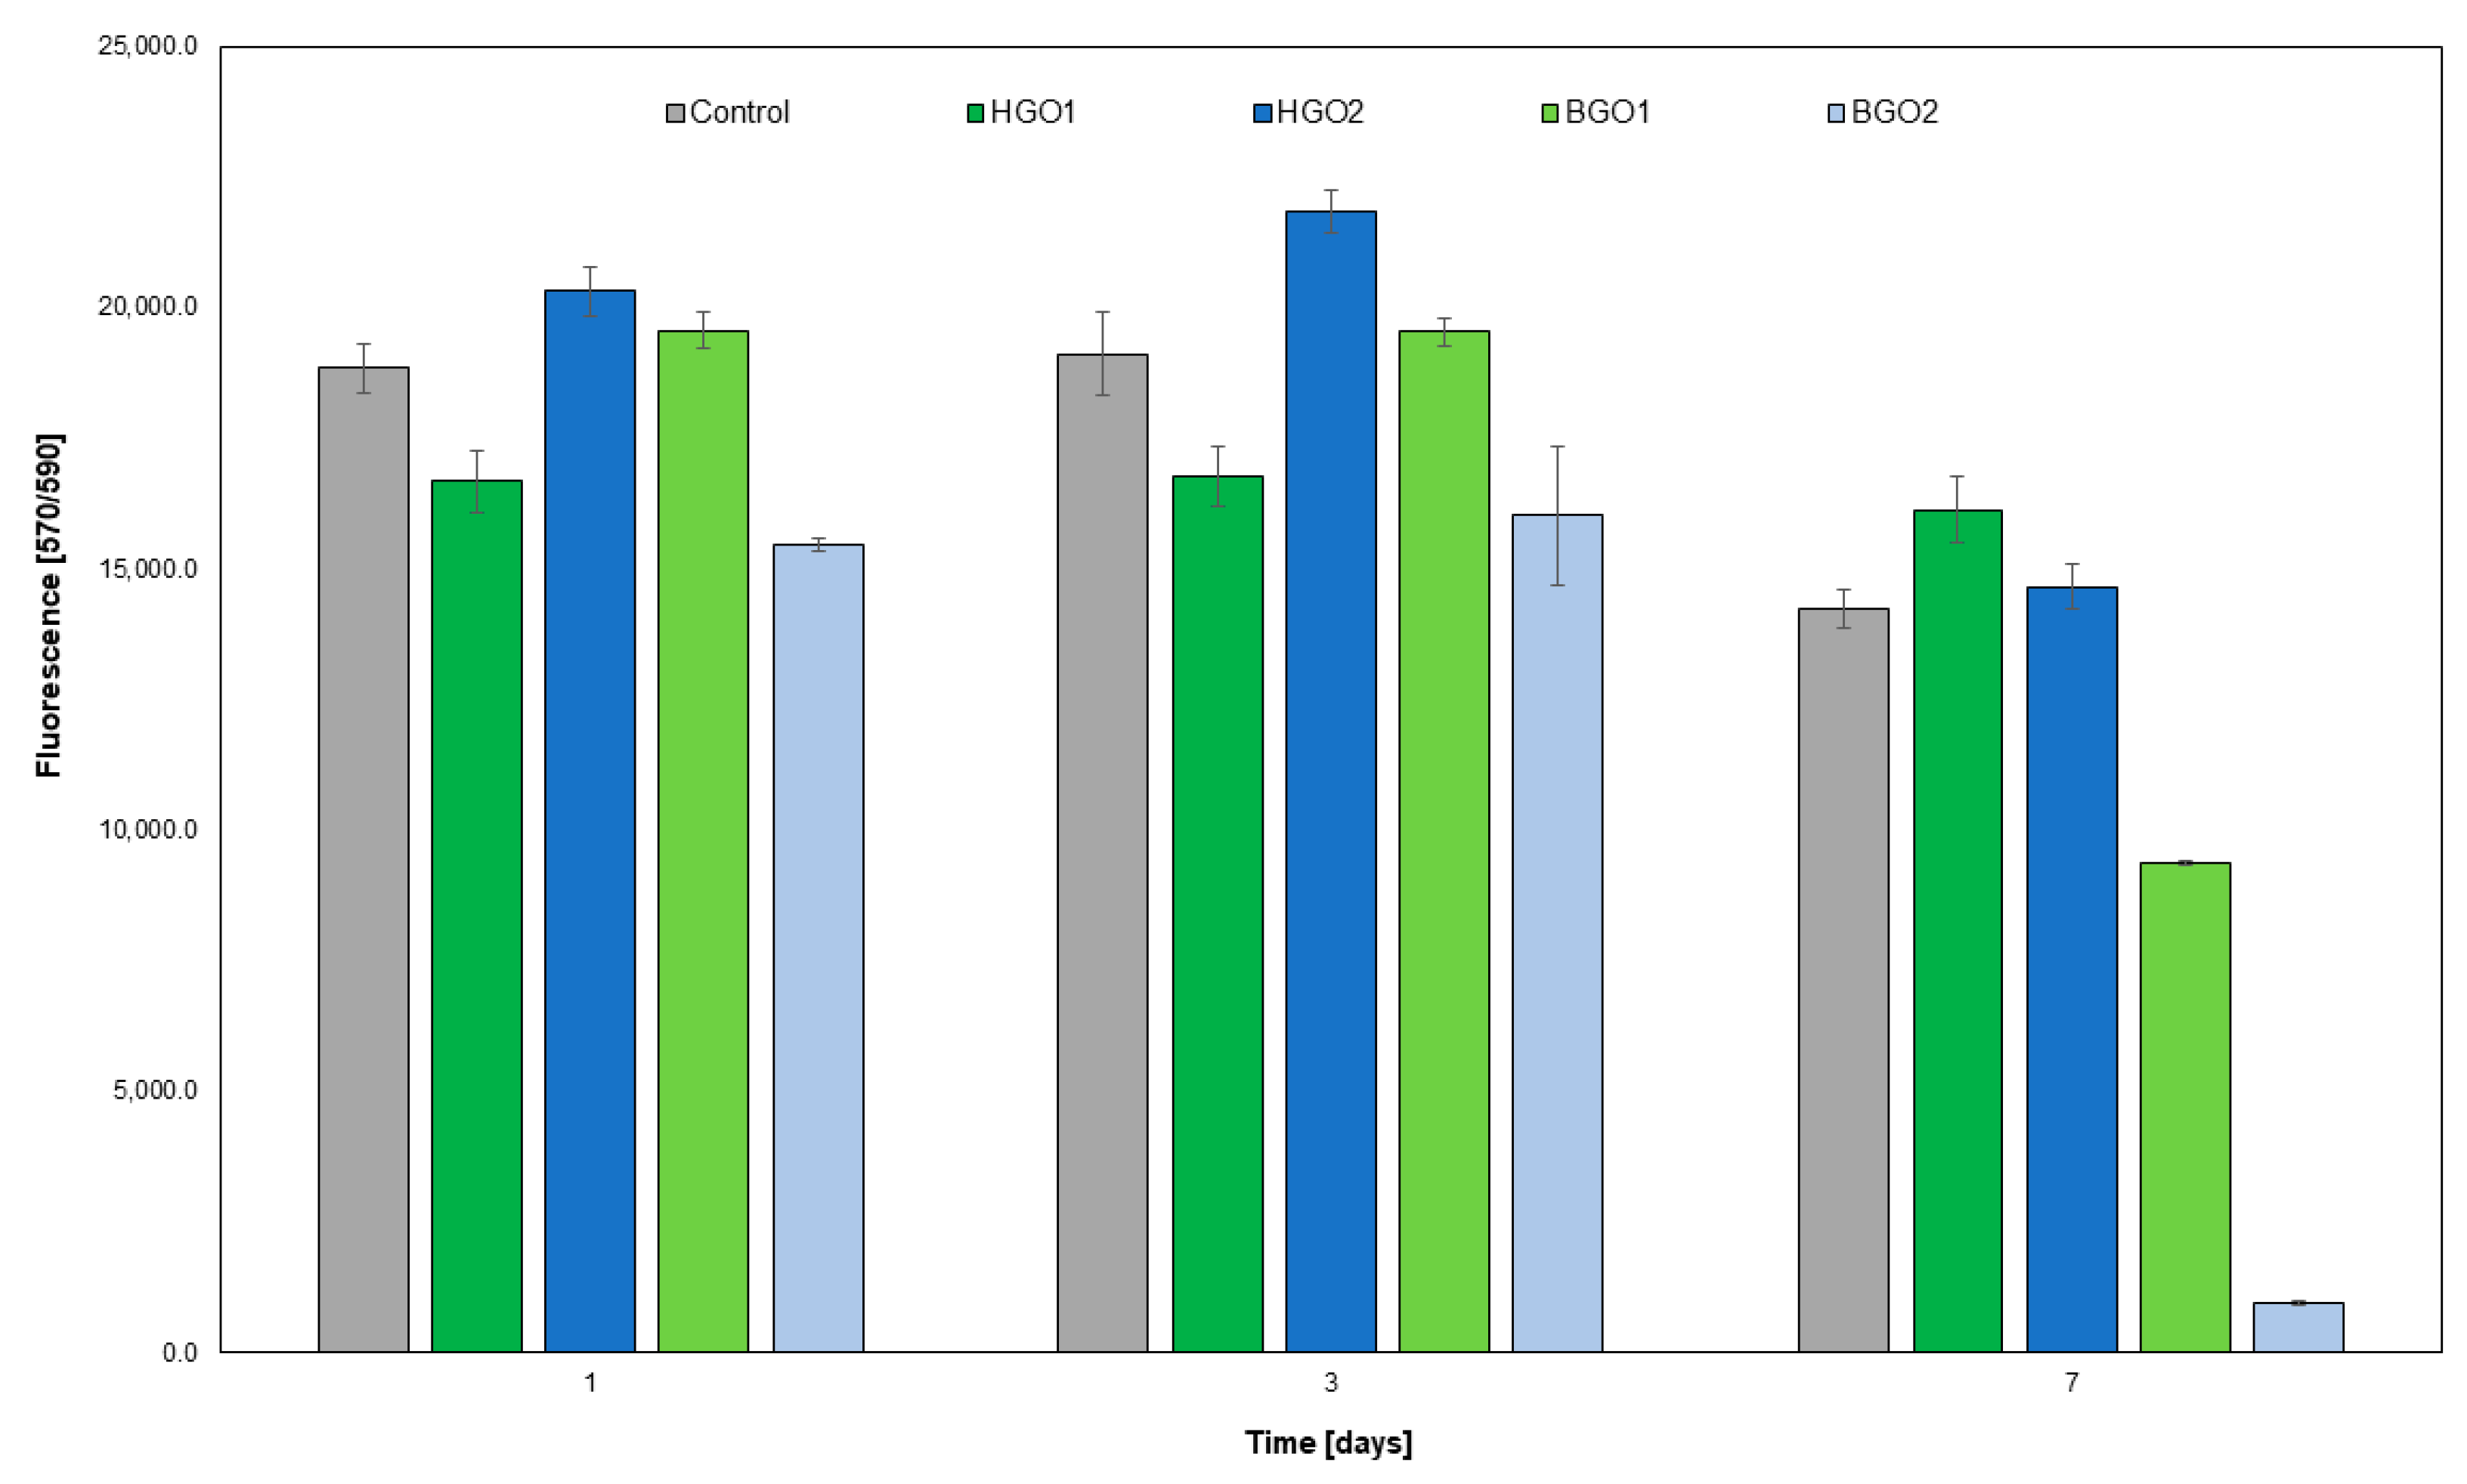
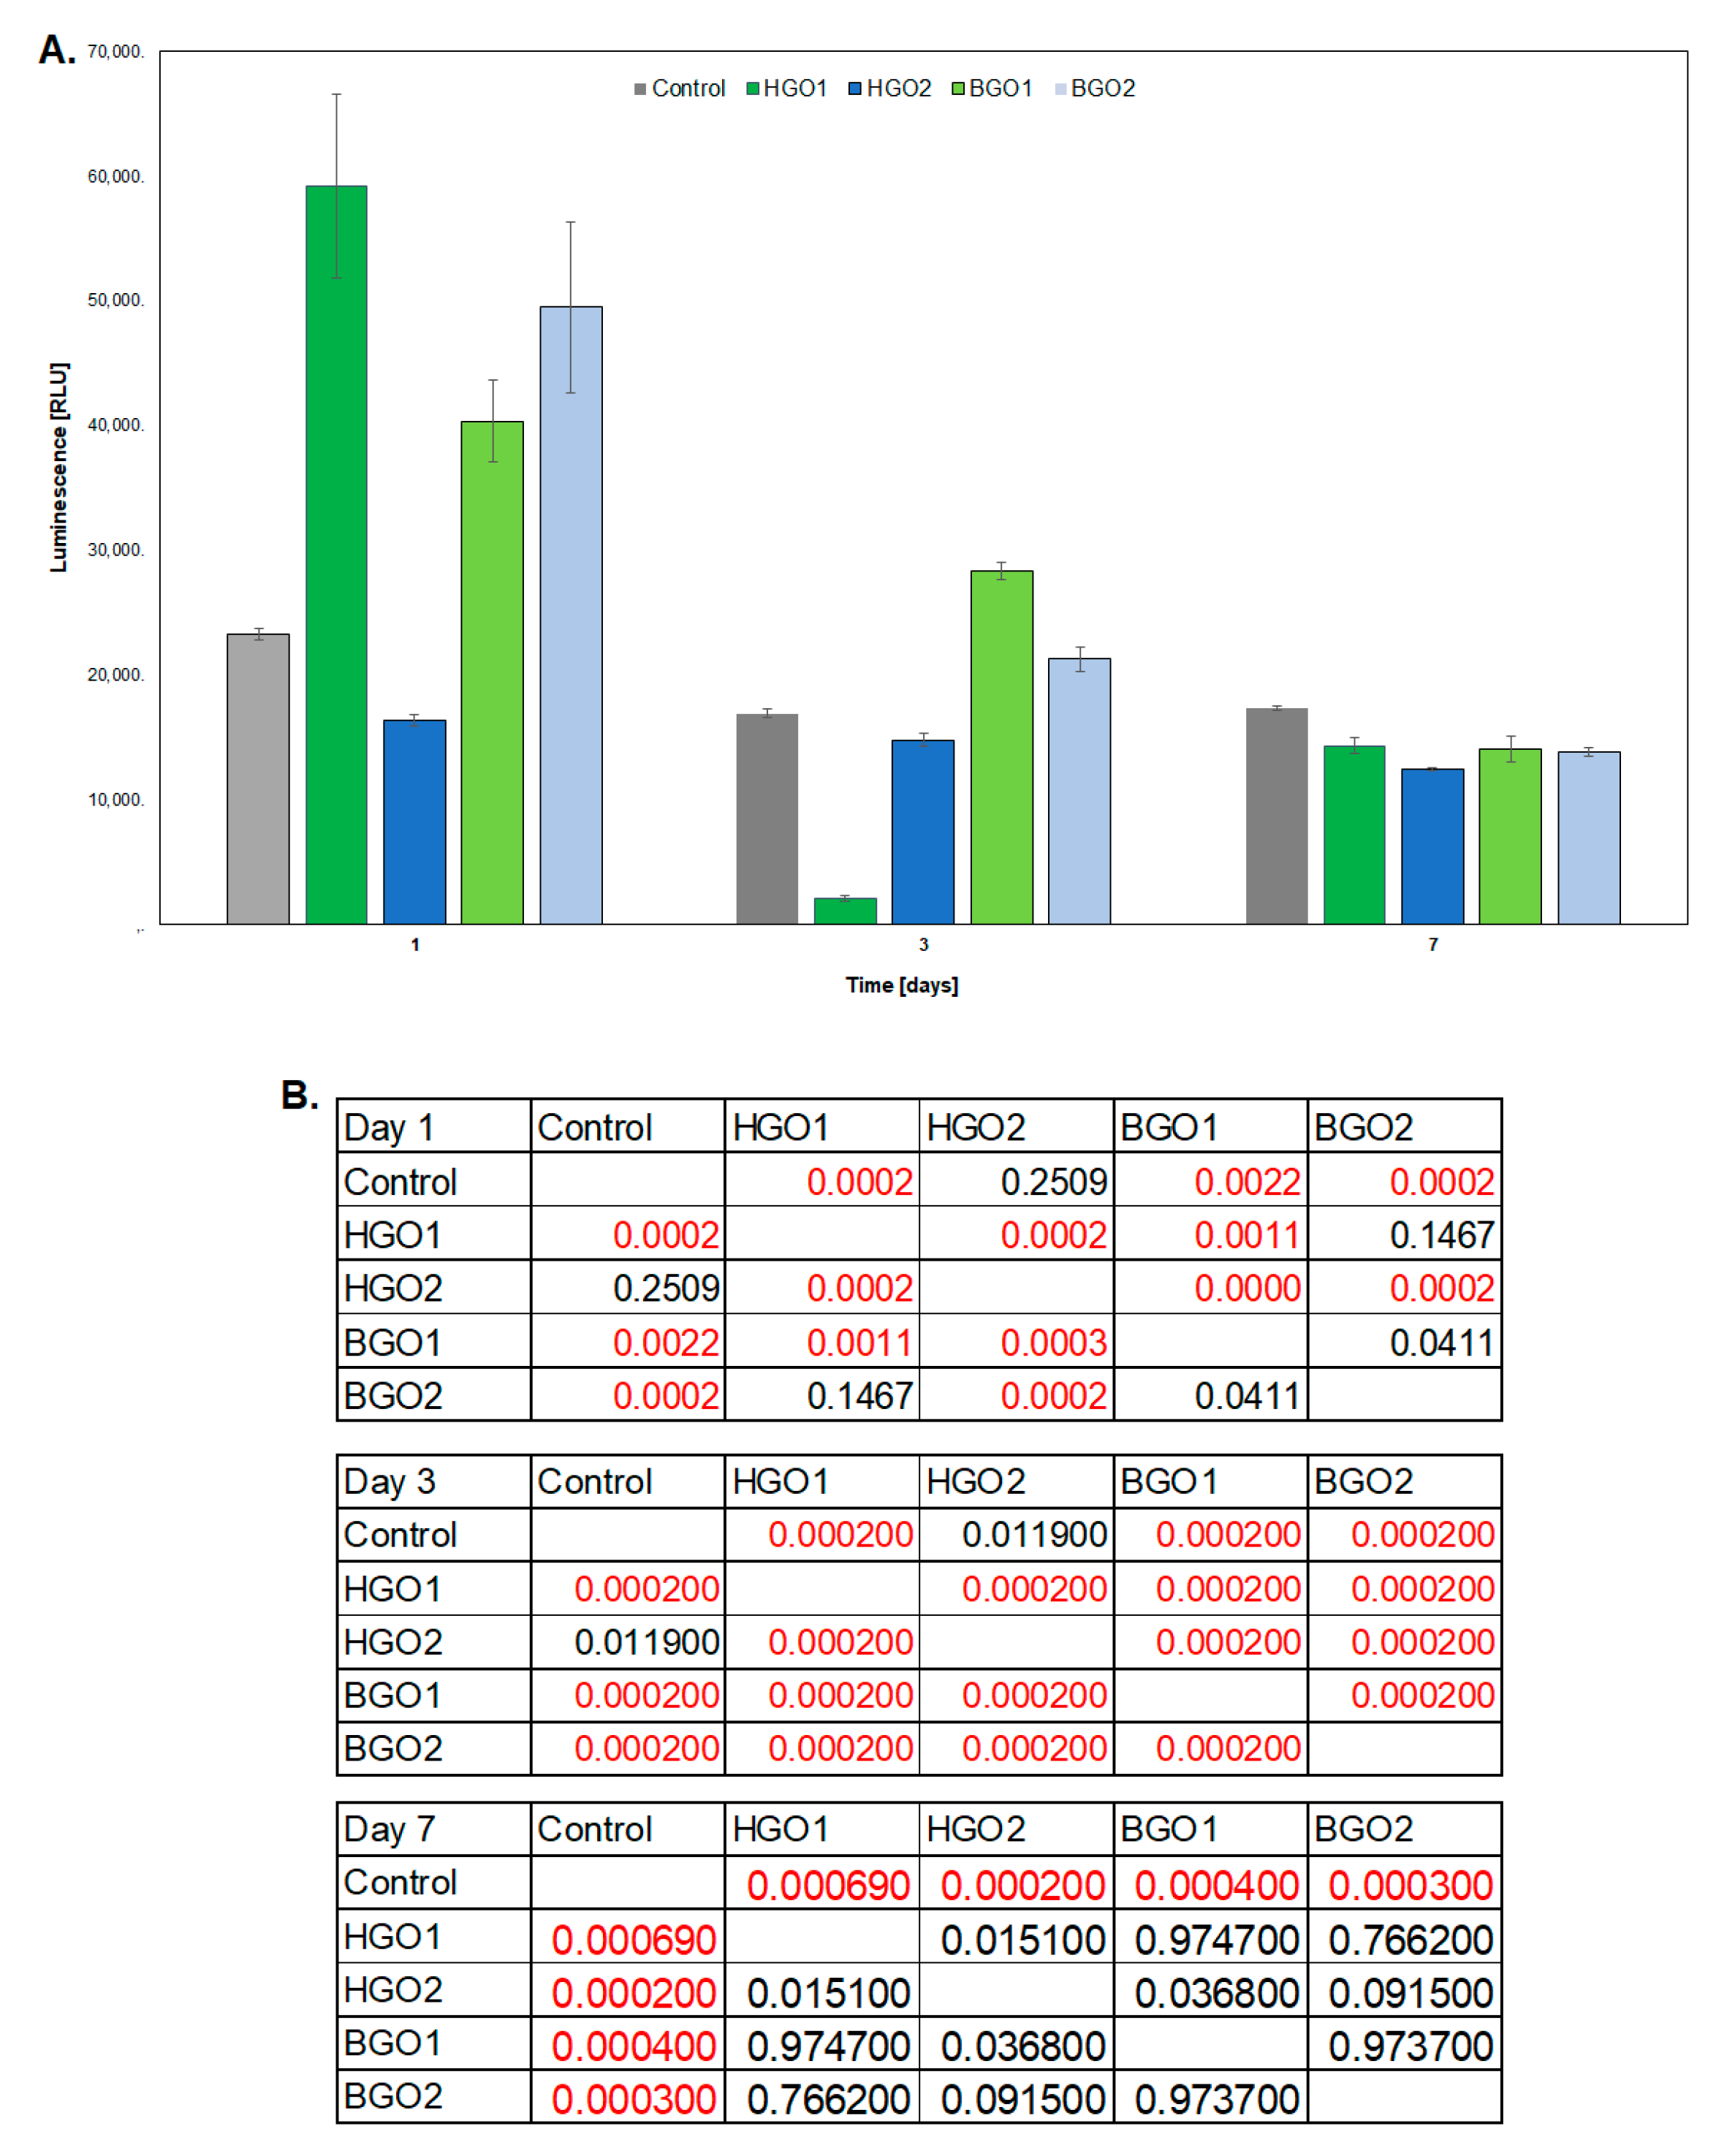
2.8.3. The Evaluation of Cell Proliferation Utilizing the Alamar Blue Assay
2.8.4. The Assessment of the Expression of Immune Response Genes in the L-929 Cell Line Following Its Interaction with BGO1 Biomaterial
2.8.5. Statistical Analysis
3. Results and Discussion
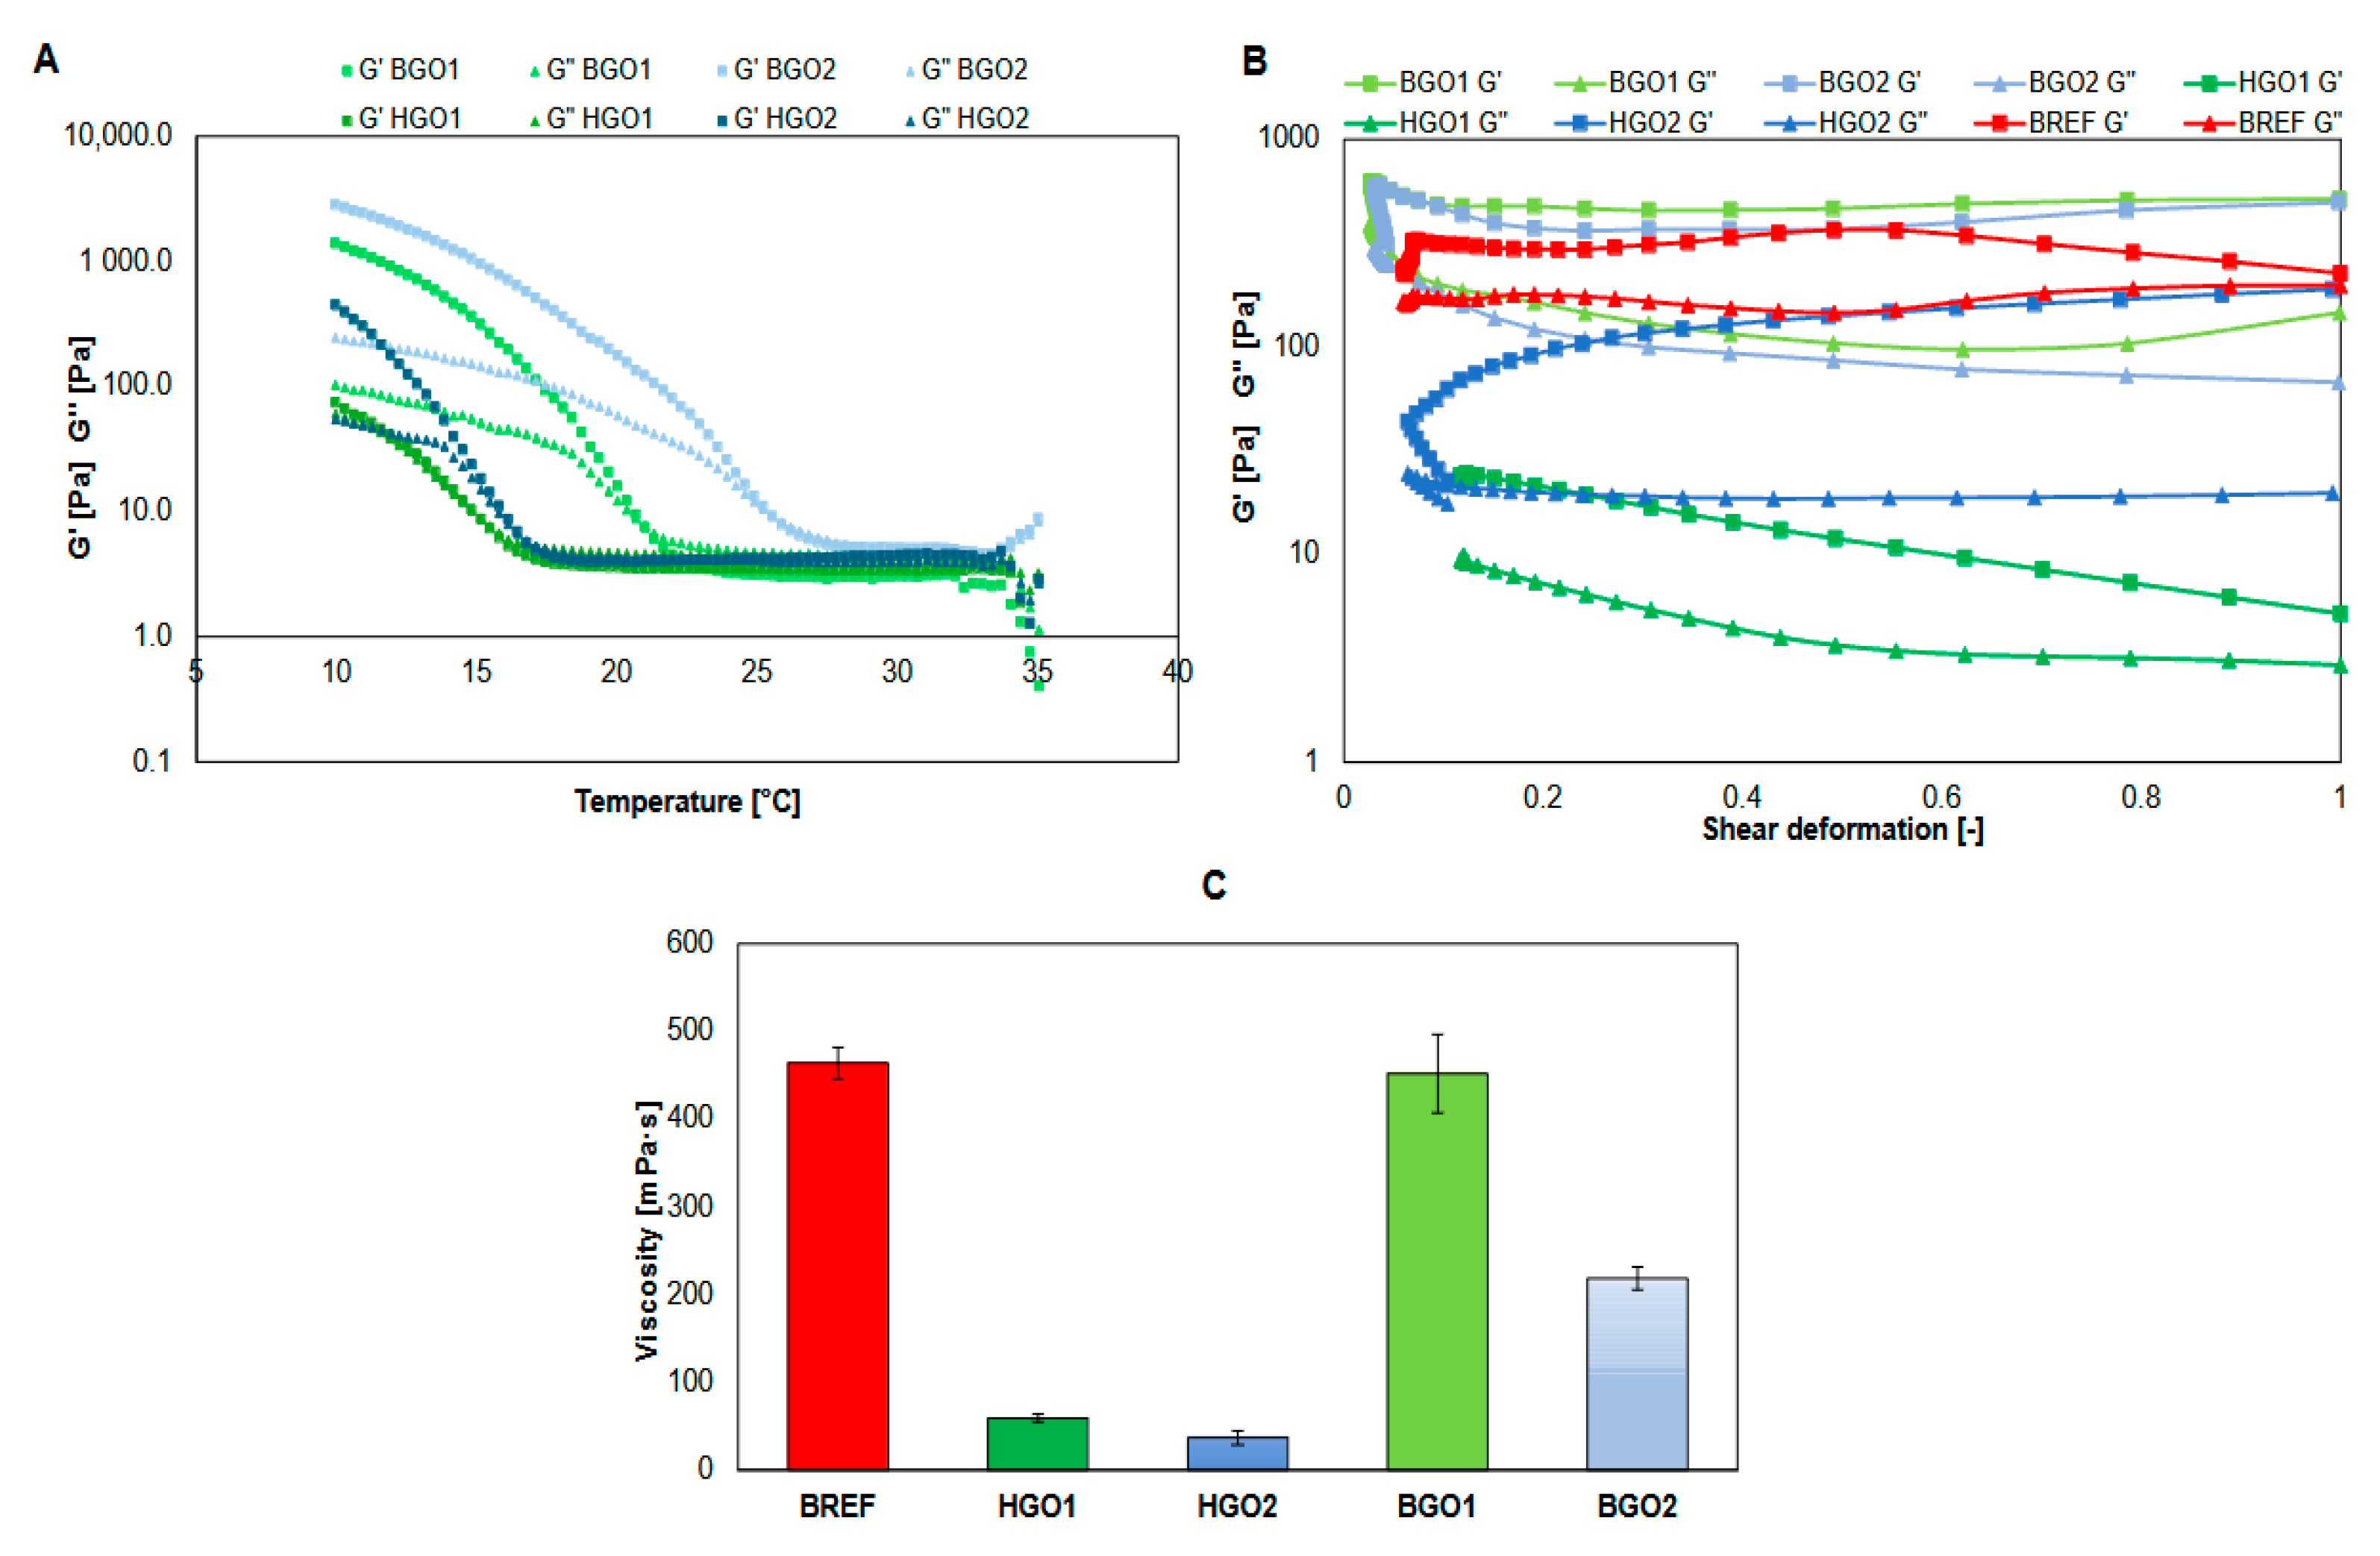
3.1. Rheology
3.2. Degradation, Absorbability and Swelling Ratio
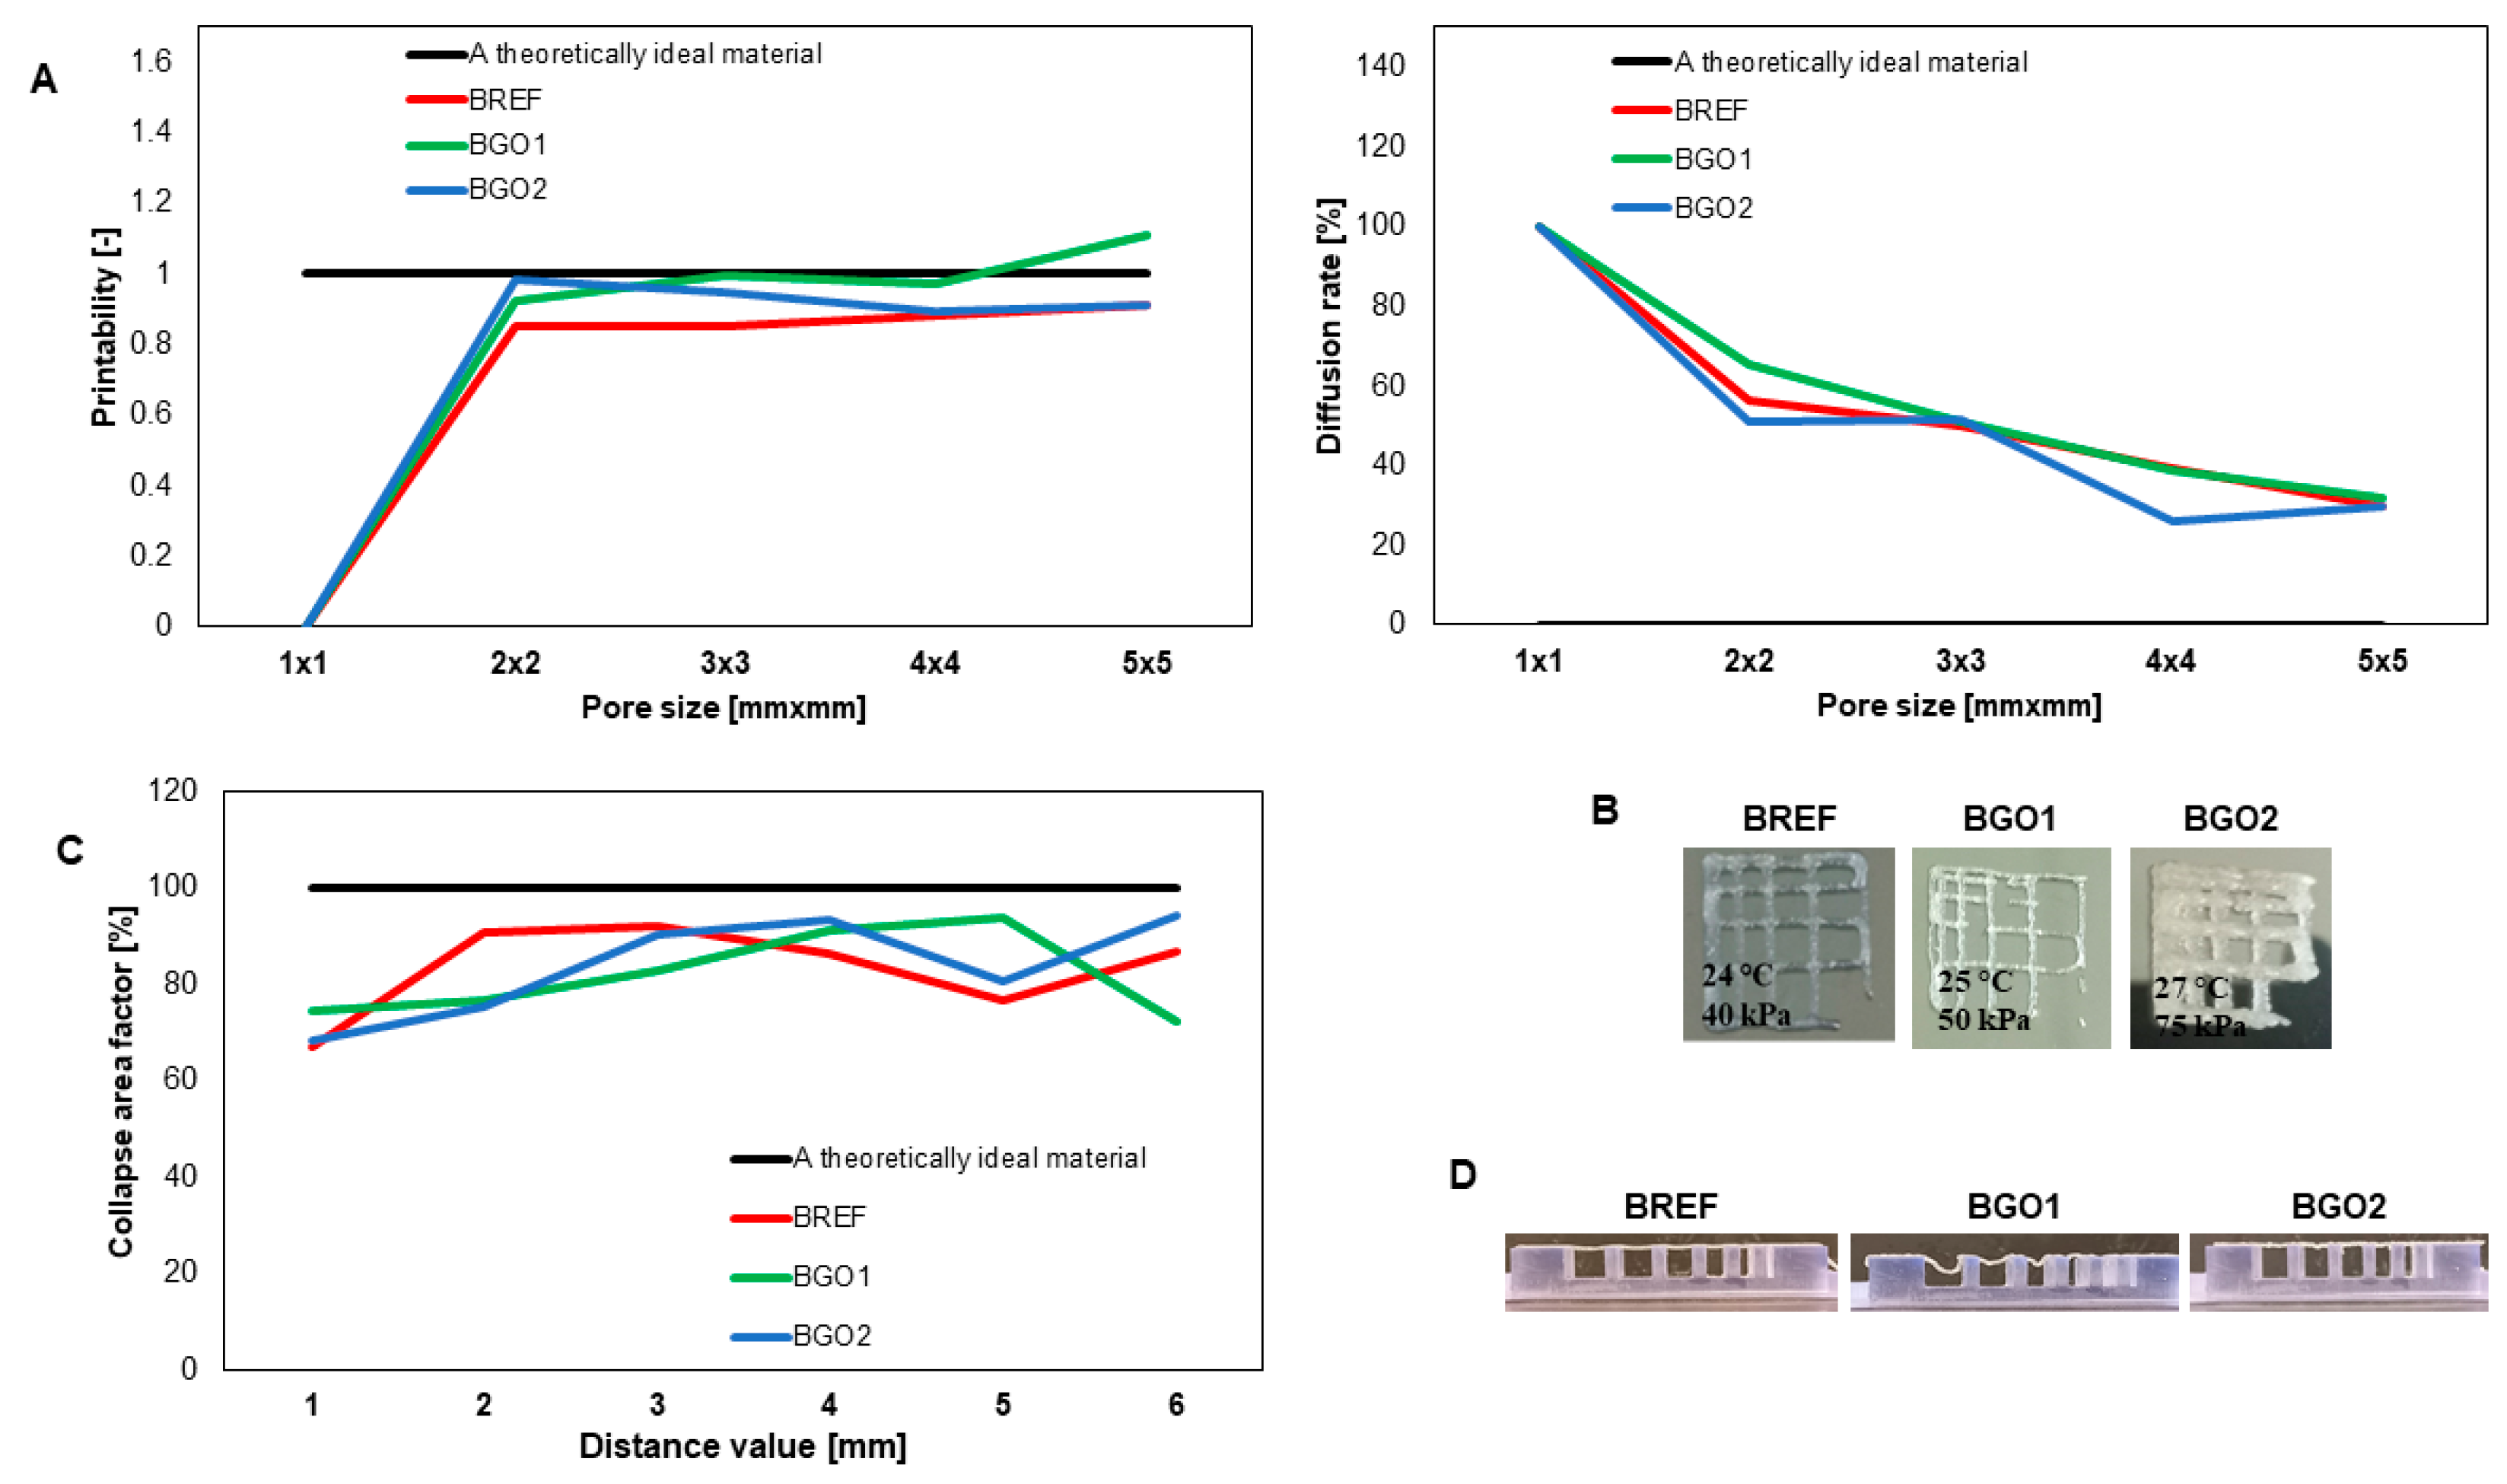
3.3. Printability
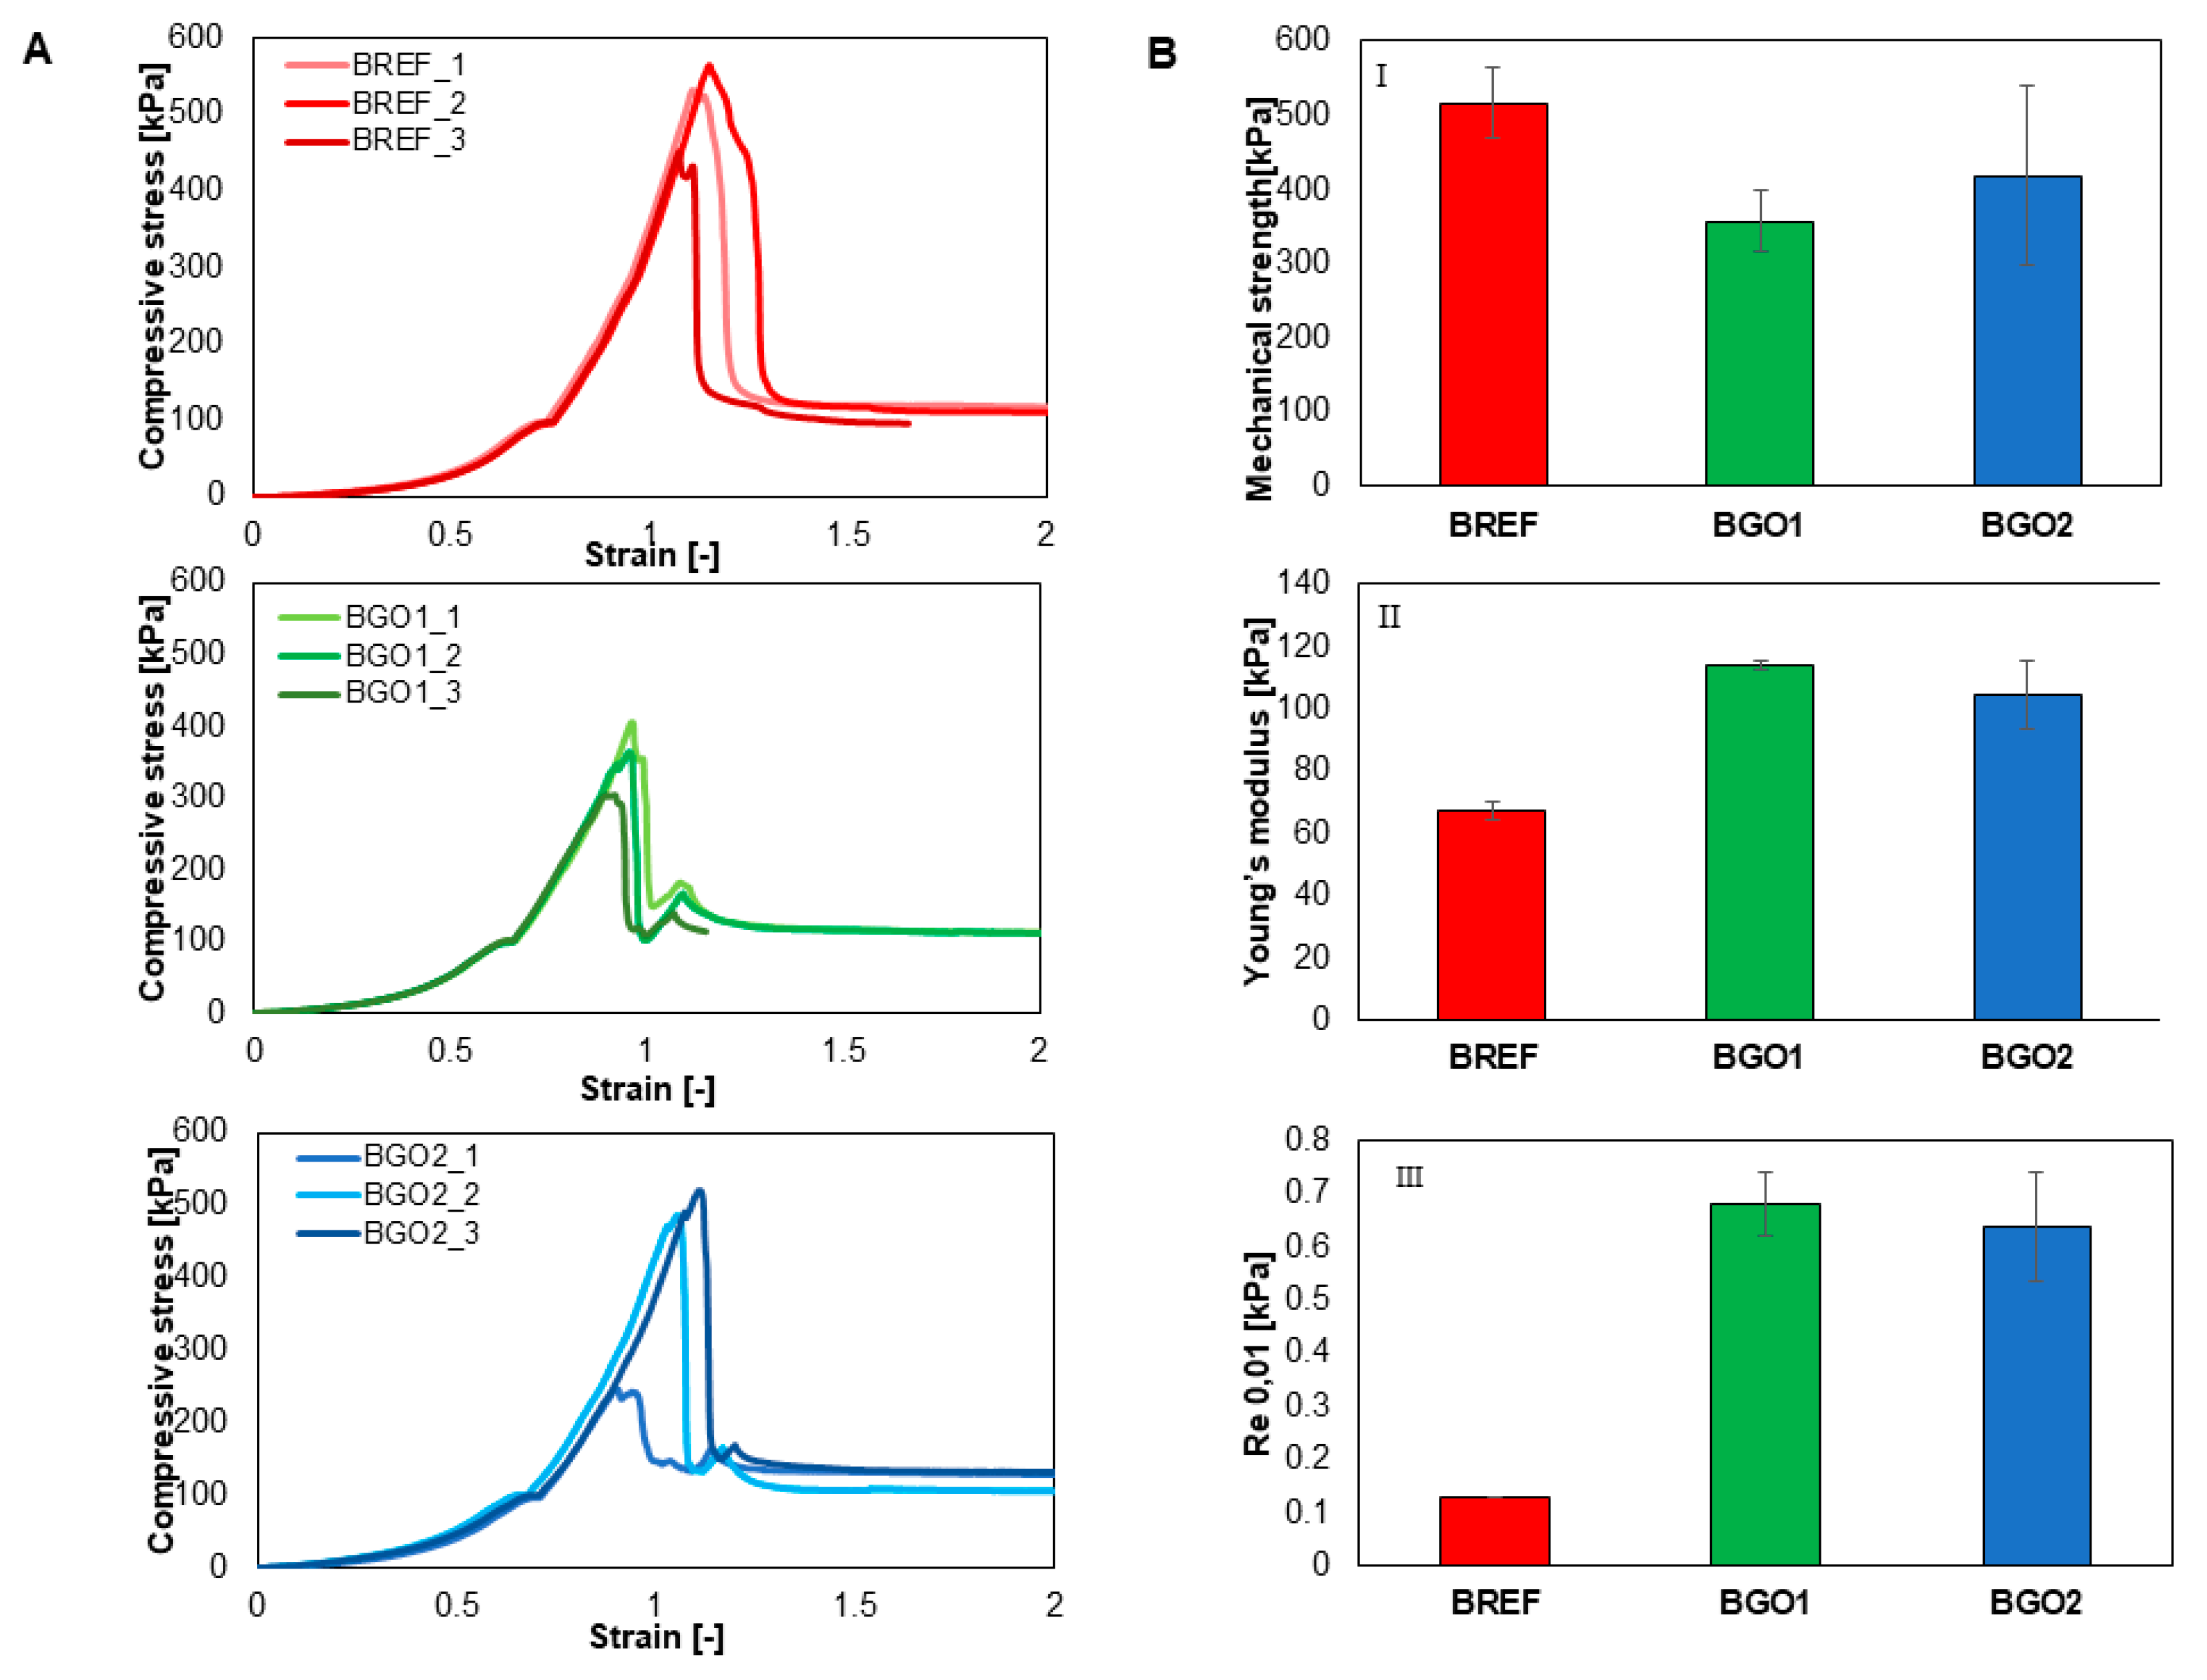
3.4. Mechanical Properties
3.5. The Assessment of GO-Based Biomaterial on Cell Viability of the L-929 Cell Line
3.6. The Assessment of the L-929 Cell Line after Exposure to the GO-Based Biomaterials
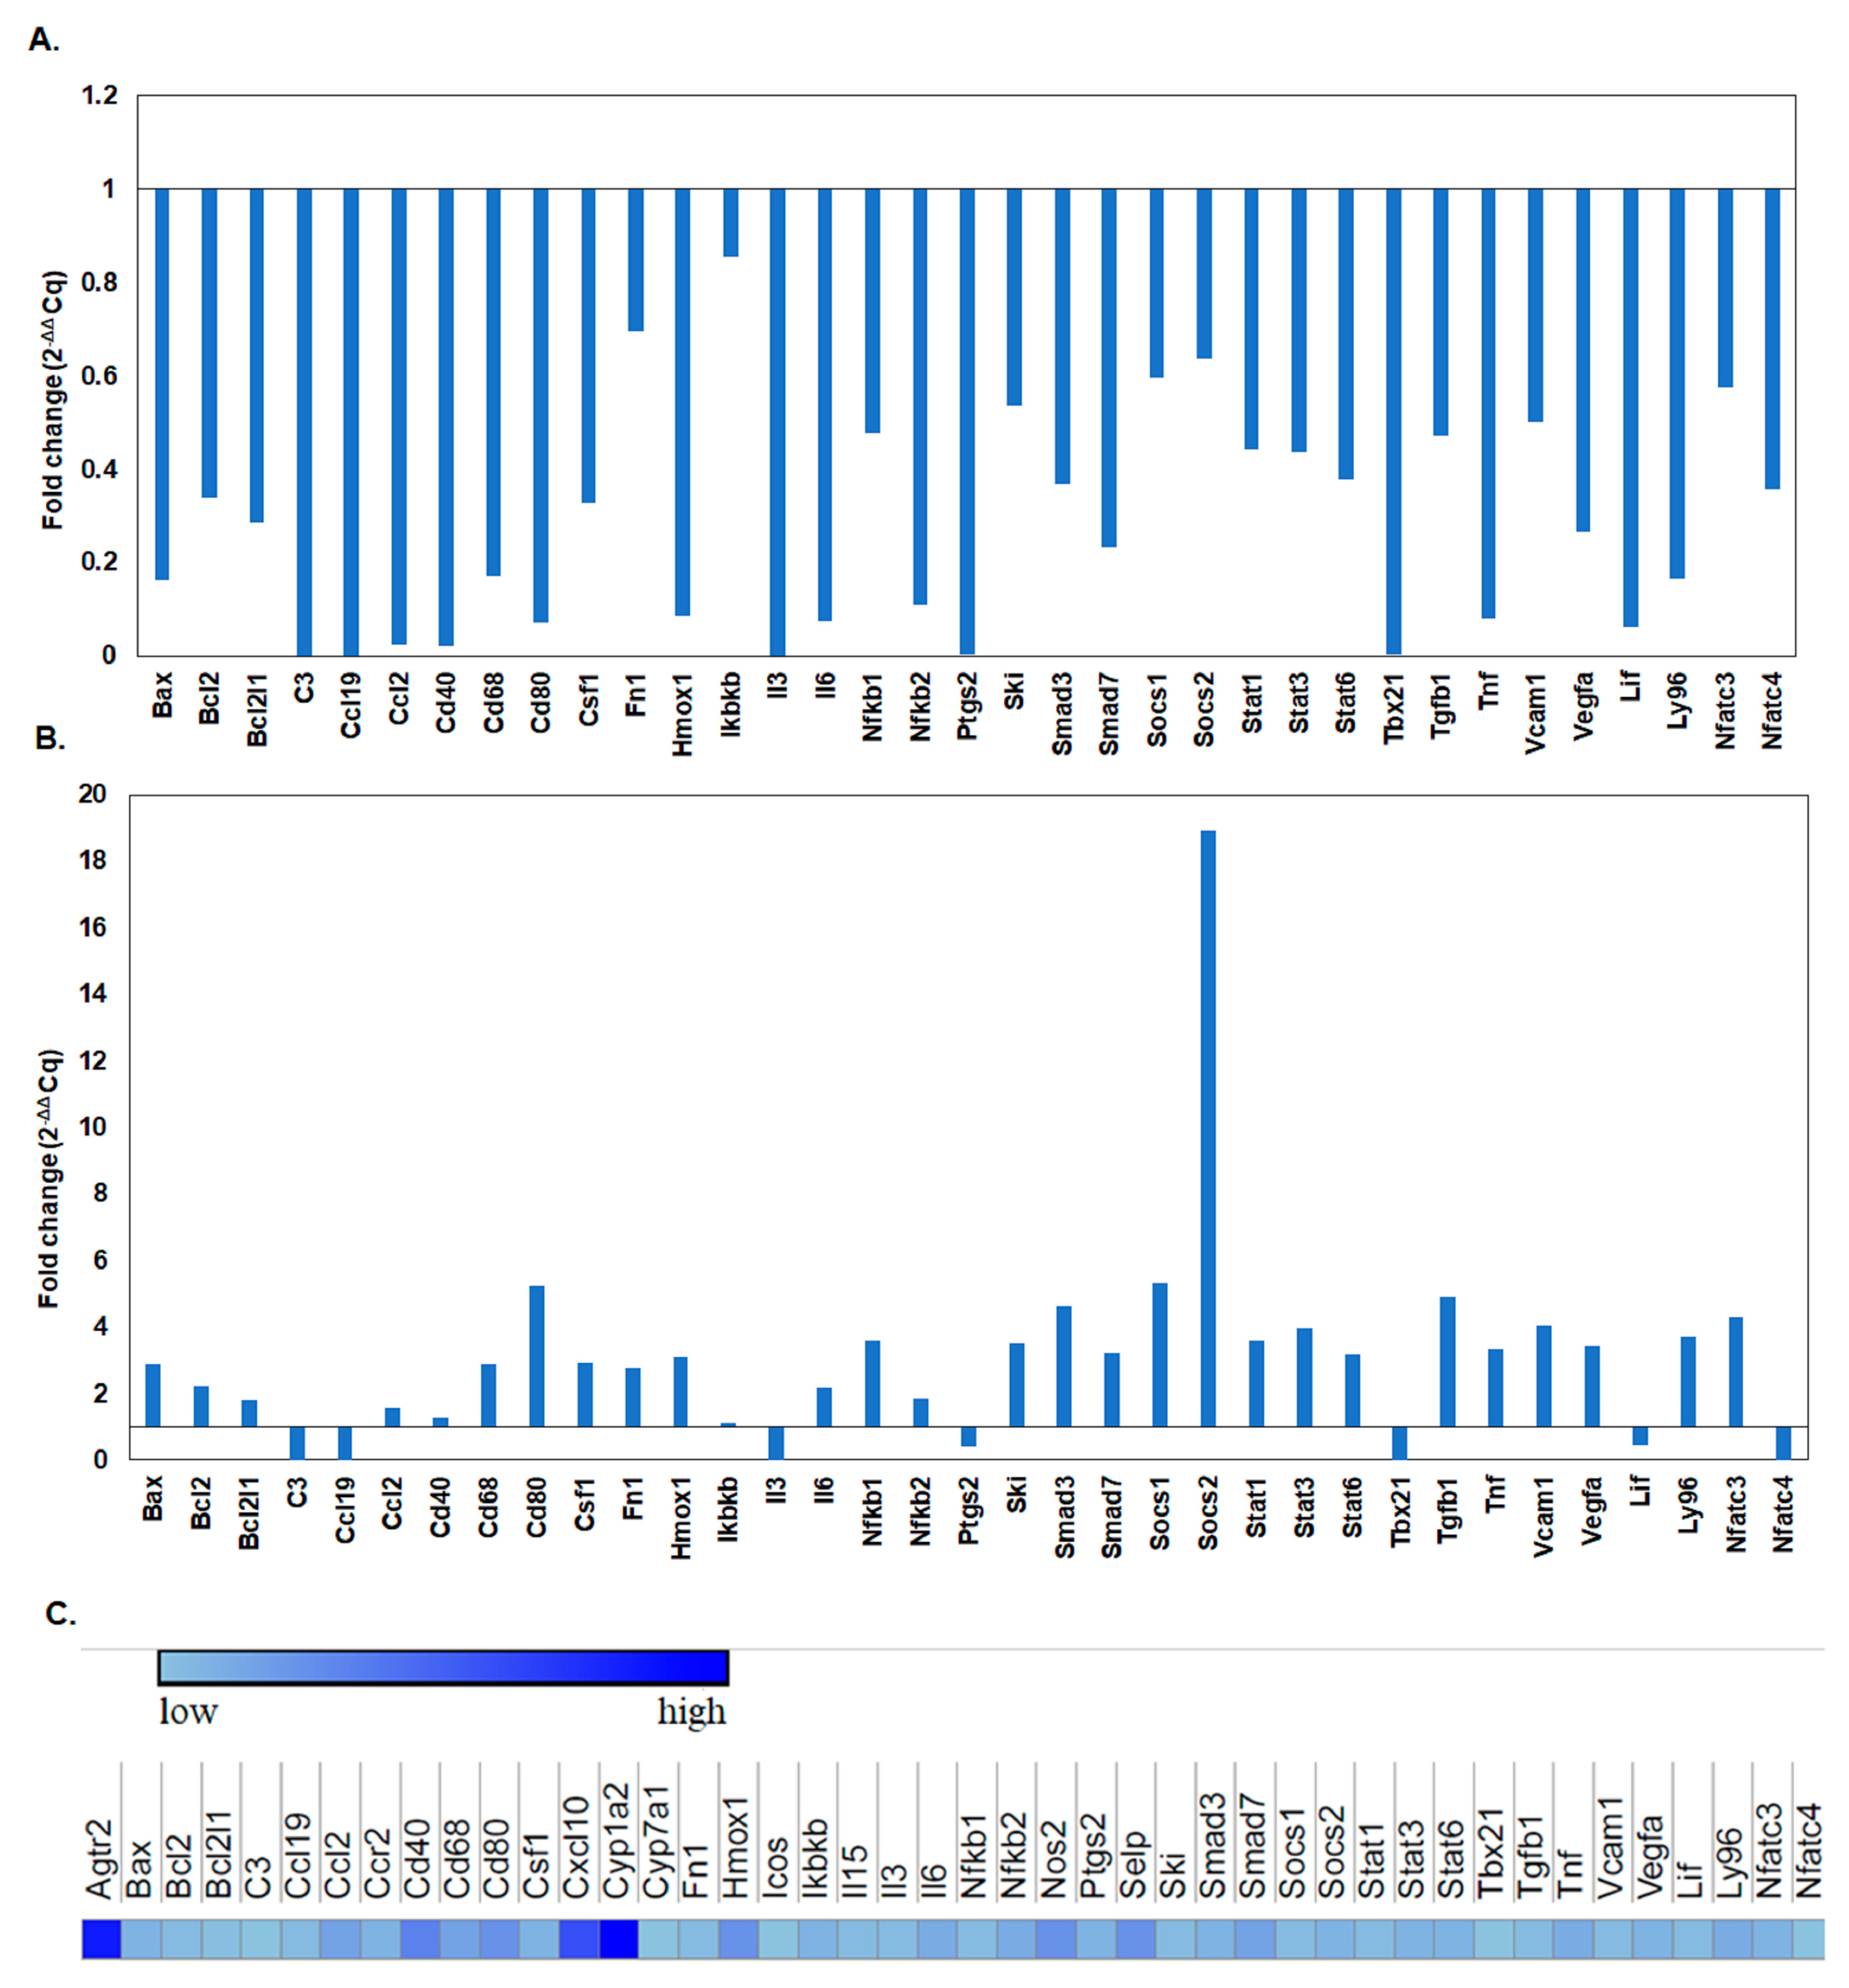
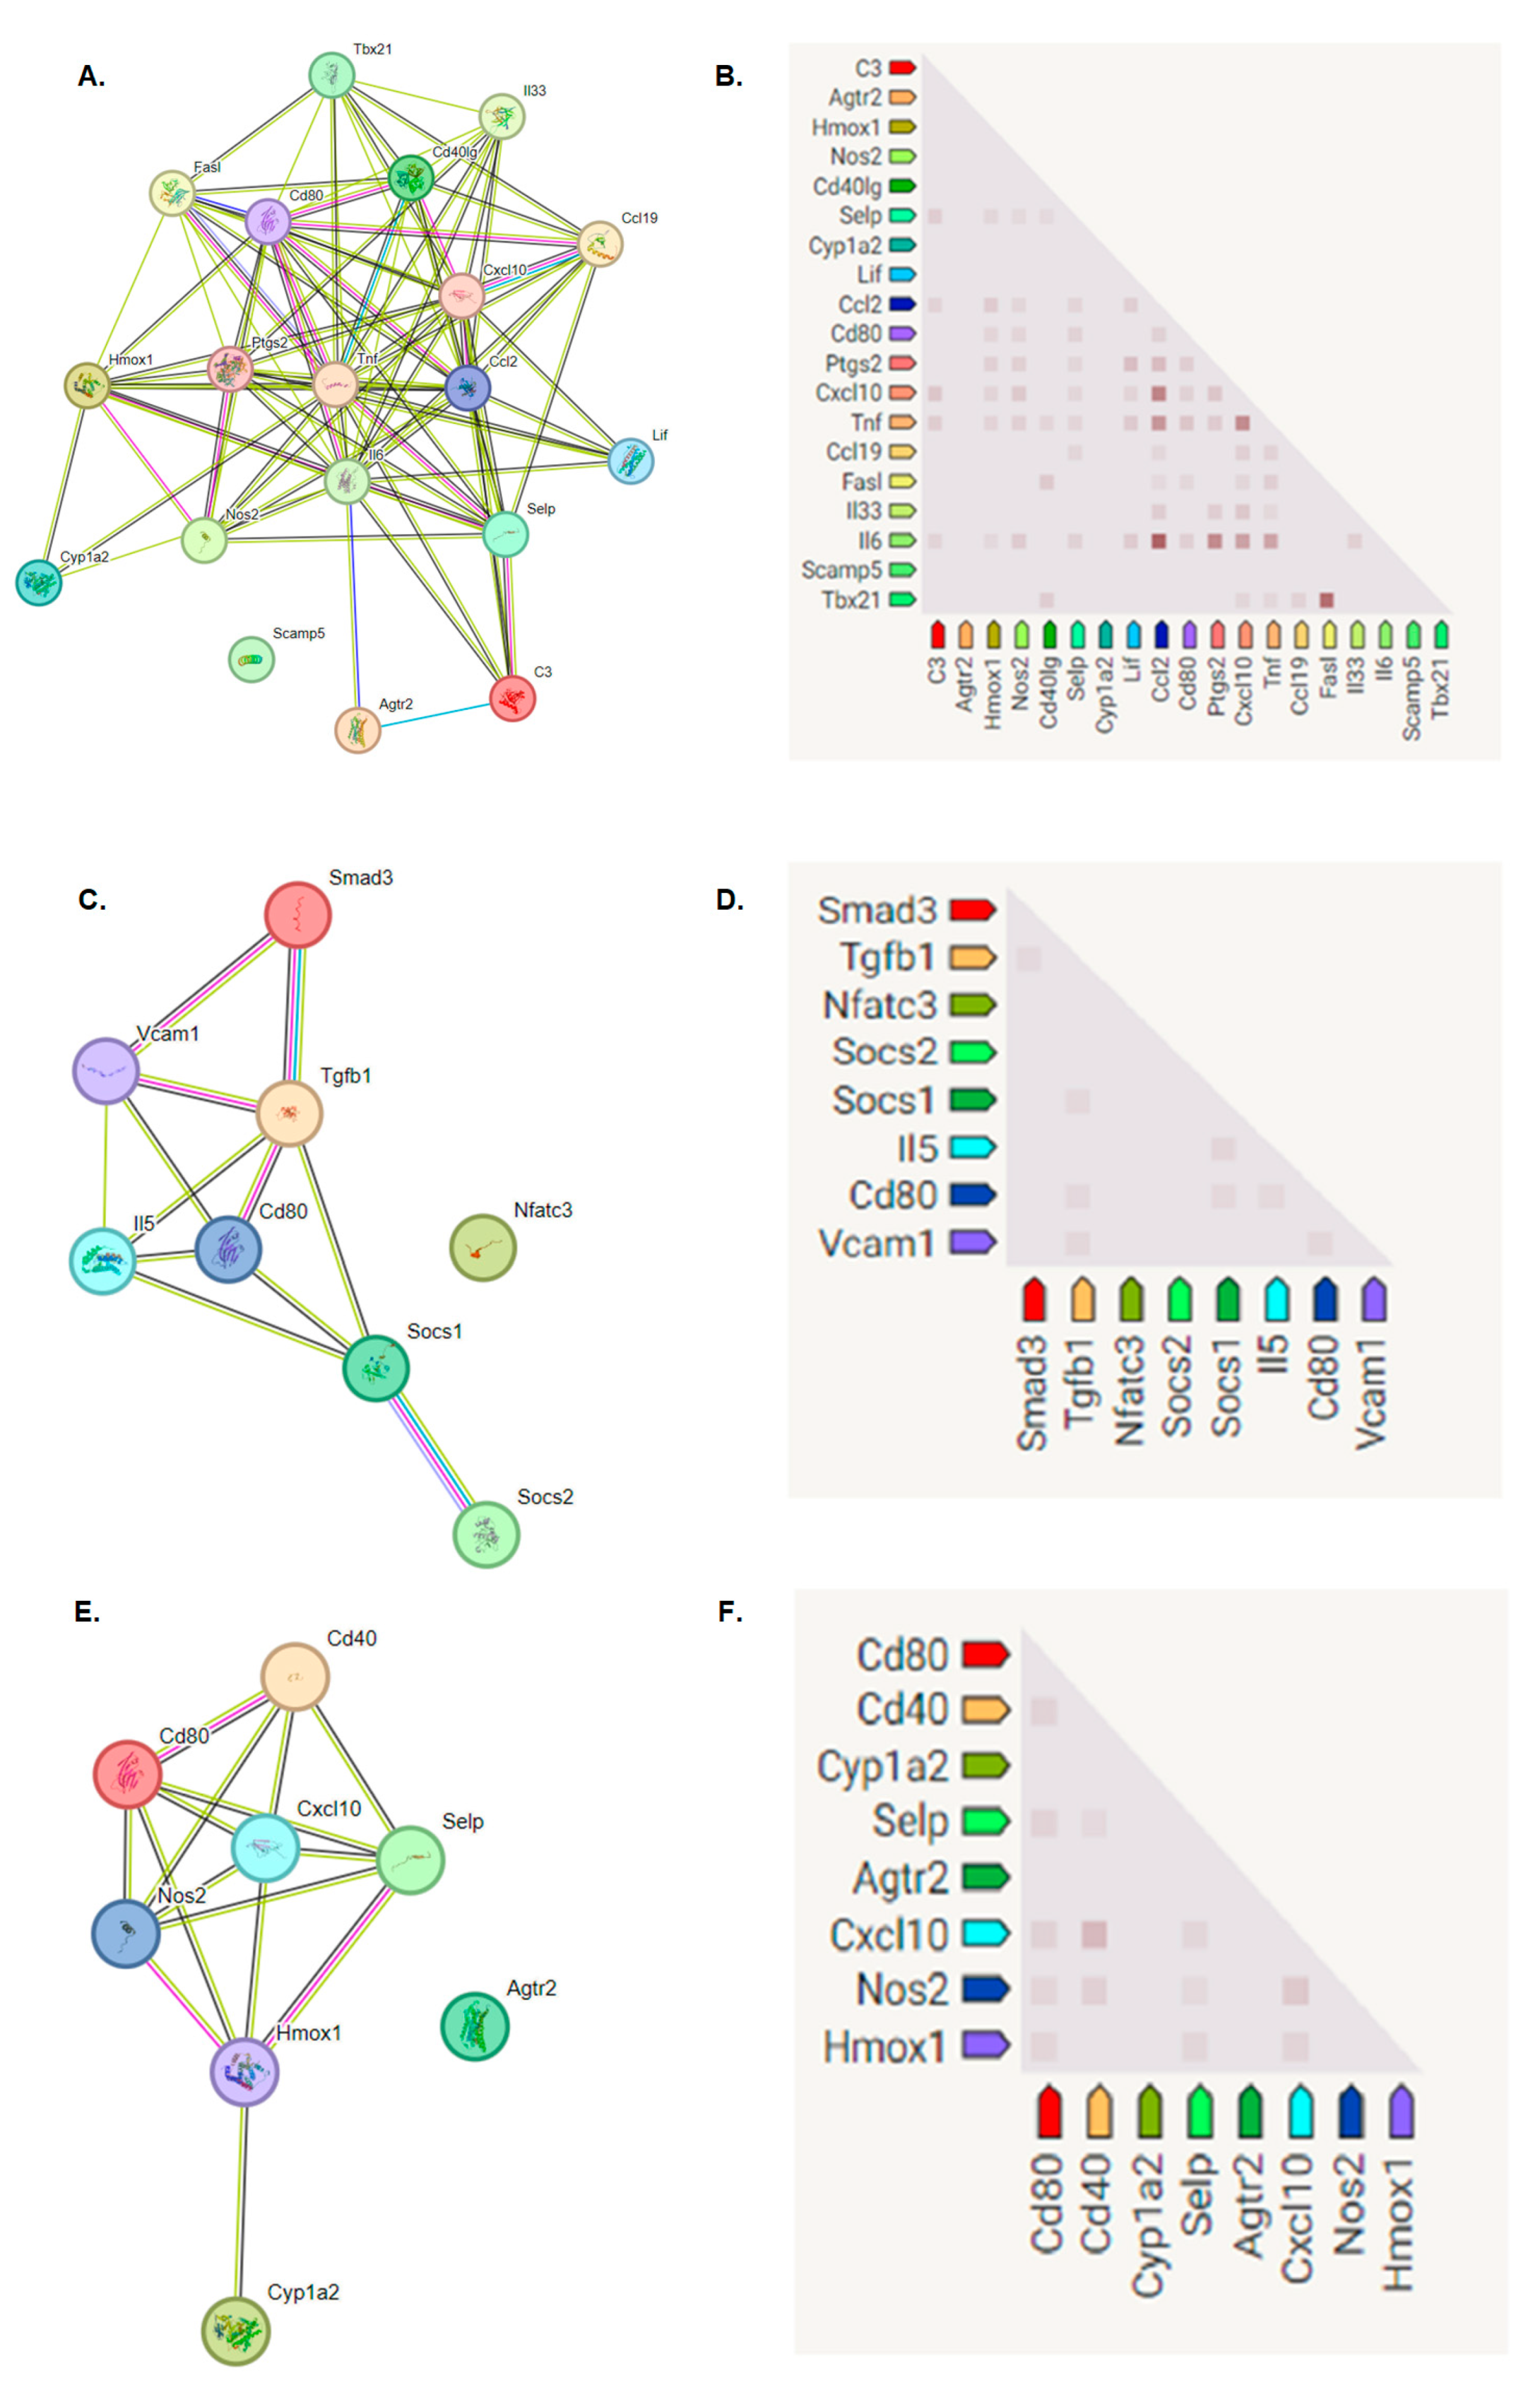
Immune Response Genes Expression Levels after L-929 Cell Line Exposure to the BGO1 Biomaterial
4. Conclusions
- GO-enriched bioinks are characterized by higher viscosity than the corresponding hydrogels. The storage modulus of the studied bioinks is greater than the loss modulus, indicating that these materials are highly useful in extrusion bioprinting technology.
- Hydrogels containing GO absorb significantly more water than the bioink, and the greatest water absorption takes place during the first 48 h. The tested materials have significant biodegradability for 21 days.
- The tested materials show better print resolution and fiber stability compared to the reference sample.
- The tested materials enriched with GO show significant elasticity of structure.
- Based on the bioassays, it was concluded that biomaterials with 1% graphene oxide additives do not exhibit cytotoxicity against L-929 cells.
- In addition, based on the analysis of LDH release and the Alamar Blue assay, it can be concluded that cells cultured on the graphene oxide biomaterial are not damaged; as a result; they do not produce lactate dehydrogenase and show an unimpaired degree of proliferation, except for the culture of cells on the BGO2 biomaterial on the seventh day of the experiment.
- When analyzing the fold changes in the expression of genes responsible for immune processes, it was found that on the first day of the experiment, there was a decrease in the multiplicity of expression of genes related to the immune system. During the experiment, the expression profile changed. The addition of bioinks with 1% graphene oxide caused an increase in some genes, especially those responsible for the processes of the proliferation and activation of T lymphocytes.
- The obtained characteristics of the tested materials prove their high utility in 3D bioprinting technology for applications in biotechnology and regenerative medicine.
Author Contributions
Funding
Data Availability Statement
Conflicts of Interest
References
- Nishimura, I.; Garrell, R.L.; Hedrick, M.; Iida, K.; Osher, S.; Wu, B. Precursor Tissue Analogs as a Tissue-Engineering Strategy. Tissue Eng. 2003, 9 (Suppl. S1), 77–89. [Google Scholar] [CrossRef] [PubMed]
- Nguyen, L.L.; D’amore, P.A. Cellular Interactions in Vascular Growth and Differentiation. Int. Rev. Cytol. 2001, 204, 1–48. [Google Scholar] [CrossRef] [PubMed]
- Shields, K.J.; Beckman, M.J.; Bowlin, G.L.; Wayne, J.S. Mechanical Properties and Cellular Proliferation of Electrospun Collagen Type II. Tissue Eng. 2004, 10, 1510–1517. [Google Scholar] [CrossRef] [PubMed]
- Heydarkhan-Hagvall, S.; Schenke-Layland, K.; Dhanasopon, A.P.; Rofail, F.; Smith, H.; Wu, B.M.; Shemin, R.; Beygui, R.E.; MacLellan, W.R. Three-Dimensional Electrospun ECM-Based Hybrid Scaffolds for Cardiovascular Tissue Engineering. Biomaterials 2008, 29, 2907–2914. [Google Scholar] [CrossRef] [PubMed]
- Vacanti, J.P.; Langer, R. Tissue Engineering: The Design and Fabrication of Living Replacement Devices for Surgical Reconstruction and Transplantation. Lancet 1999, 354 (Suppl. S1), 32–34. [Google Scholar] [CrossRef] [PubMed]
- Nerem, R.M. Tissue Engineering: Confronting the Transplantation Crisis. Proc. Inst. Mech. Eng. Part H J. Eng. Med. 2000, 214, 95–99. [Google Scholar] [CrossRef]
- Karageorgiou, V.; Kaplan, D. Porosity of 3D Biomaterial Scaffolds and Osteogenesis. Biomaterials 2005, 26, 5474–5491. [Google Scholar] [CrossRef] [PubMed]
- Holtorf, H.L.; Datta, N.; Jansen, J.A.; Mikos, A.G. Scaffold Mesh Size Affects the Osteoblastic Differentiation of Seeded Marrow Stromal Cells Cultured in a Flow Perfusion Bioreactor. J. Biomed. Mater. Res. Part A 2005, 74, 171–180. [Google Scholar] [CrossRef]
- Hutmacher, D.W. Scaffold Design and Fabrication Technologies for Engineering Tissues—State of the Art and Future Perspectives. J. Biomater. Sci. Polym. Ed. 2001, 12, 107–124. [Google Scholar] [CrossRef]
- Hutmacher, D.W.; Woodfield, T.B.F.; Dalton, P.D. Scaffold Design and Fabrication. In Tissue Engineering, 2nd ed.; Academic Press: Cambridge, MA, USA, 2014. [Google Scholar] [CrossRef]
- Guvendiren, M.; Molde, J.; Soares, R.M.D.; Kohn, J. Designing Biomaterials for 3D Printing. ACS Biomater. Sci. Eng. 2016, 2, 1679–1693. [Google Scholar] [CrossRef]
- Szymczyk-Ziółkowska, P.; Łabowska, M.B.; Detyna, J.; Michalak, I.; Gruber, P. A Review of Fabrication Polymer Scaffolds for Biomedical Applications Using Additive Manufacturing Techniques. Biocybern. Biomed. Eng. 2020, 40, 624–638. [Google Scholar] [CrossRef]
- Ashammakhi, N.; Ahadian, S.; Xu, C.; Montazerian, H.; Ko, H.; Nasiri, R.; Barros, N.; Khademhosseini, A. Bioinks and Bioprinting Technologies to Make Heterogeneous and Biomimetic Tissue Constructs. Mater. Today Bio. 2019, 1, 100008. [Google Scholar] [CrossRef] [PubMed]
- Li, J.; Wu, C.; Chu, P.K.; Gelinsky, M. 3D Printing of Hydrogels: Rational Design Strategies and Emerging Biomedical Applications. Mater. Sci. Eng. R Rep. 2020, 140, 100543. [Google Scholar] [CrossRef]
- Kim, B.S.; Cho, C.S. Injectable Hydrogels for Regenerative Medicine. Tissue Eng. Regen. Med. 2018, 15, 511–512. [Google Scholar] [CrossRef] [PubMed]
- Catoira, M.C.; Fusaro, L.; Di Francesco, D.; Ramella, M.; Boccafoschi, F. Overview of Natural Hydrogels for Regenerative Medicine Applications. J. Mater. Sci. Mater. Med. 2019, 30, 115. [Google Scholar] [CrossRef]
- Hoare, T.R.; Kohane, D.S. Hydrogels in Drug Delivery: Progress and Challenges. Polymer 2008, 49, 1993–2007. [Google Scholar] [CrossRef]
- Li, J.; Mooney, D.J. Designing Hydrogels for Controlled Drug Delivery. Nat. Rev. Mater. 2016, 1, 16071. [Google Scholar] [CrossRef] [PubMed]
- Siwal, S.S.; Mishra, K.; Saini, A.K.; Alsanie, W.F.; Kovalcik, A.; Thakur, V.K. Additive Manufacturing of Bio-Based Hydrogel Composites: Recent Advances. J. Polym. Environ. 2022, 30, 4501–4516. [Google Scholar] [CrossRef]
- Taneja, H.; Salodkar, S.M.; Singh Parmar, A.; Chaudhary, S. Hydrogel Based 3D Printing: Bio Ink for Tissue Engineering. J. Mol. Liq. 2022, 367, 120390. [Google Scholar] [CrossRef]
- Bahram, M.; Mohseni, N.; Moghtader, M. An Introduction to Hydrogels and Some Recent Applications. In Emerging Concepts in Analysis and Applications of Hydrogels; IntechOpen: London, UK, 2016. [Google Scholar] [CrossRef]
- Sheoran, A.J.; Kumar, H.; Arora, P.K.; Moona, G. Bio-Medical Applications of Additive Manufacturing: A Review. Procedia Manuf. 2020, 51, 663–670. [Google Scholar] [CrossRef]
- Kim, J.; Shim, I.K.; Hwang, D.G.; Lee, Y.N.; Kim, M.; Kim, H.; Kim, S.W.; Lee, S.; Kim, S.C.; Cho, D.W.; et al. 3D Cell Printing of Islet-Laden Pancreatic Tissue-Derived Extracellular Matrix Bioink Constructs for Enhancing Pancreatic Functions. J. Mater. Chem. B 2019, 7, 1773–1781. [Google Scholar] [CrossRef] [PubMed]
- Kabirian, F.; Mozafari, M. Decellularized ECM-Derived Bioinks: Prospects for the Future. Methods 2020, 171, 108–118. [Google Scholar] [CrossRef] [PubMed]
- Mao, H.; Yang, L.; Zhu, H.; Wu, L.; Ji, P.; Yang, J.; Gu, Z. Recent Advances and Challenges in Materials for 3D Bioprinting. Prog. Nat. Sci. Mater. Int. 2020, 30, 618–634. [Google Scholar] [CrossRef]
- Yilmaz, B.; Al Rashid, A.; Mou, Y.A.; Evis, Z.; Koç, M. Bioprinting: A Review of Processes, Materials and Applications. Bioprinting 2021, 23, e00148. [Google Scholar] [CrossRef]
- Vanaei, S.; Parizi, M.S.; Vanaei, S.; Salemizadehparizi, F.; Vanaei, H.R. An Overview on Materials and Techniques in 3D Bioprinting Toward Biomedical Application. Eng. Regen. 2021, 2, 1–18. [Google Scholar] [CrossRef]
- Kangarshahi, B.M.; Naghib, S.M.; Kangarshahi, G.M.; Mozafari, M.R. Bioprinting of Self-Healing Materials and Nanostructures for Biomedical Applications: Recent Advances and Progresses on Fabrication and Characterization Techniques. Bioprinting 2024, 38, e00335. [Google Scholar] [CrossRef]
- Klak, M.; Kowalska, P.; Dobrzanski, T.; Tymicki, G.; Cywoniuk, P.; Gomolka, M.; Kosowska, K.; Bryniarski, T.; Berman, A.; Dobrzyn, A.; et al. Bionic Organs: Shear Forces Reduce Pancreatic Islet and Mammalian Cell Viability during the Process of 3d Bioprinting. Micromachines 2021, 12, 304. [Google Scholar] [CrossRef] [PubMed]
- Klak, M.; Kosowska, K.; Bryniarski, T.; Łojszczyk, I.; Dobrzański, T.; Tymicki, G.; Filip, A.; Szczepankiewicz, A.A.; Olkowski, R.; Kosowska, A.; et al. Bioink Based on the DECM for 3D Bioprinting of Bionic Tissue, the First Results Obtained on Murine Model. Bioprinting 2022, 28, e00233. [Google Scholar] [CrossRef]
- Arif, Z.U.; Khalid, M.Y.; Tariq, A.; Hossain, M.; Umer, R. 3D Printing of Stimuli-Responsive Hydrogel Materials: Literature Review and Emerging Applications. Giant 2024, 17, 100209. [Google Scholar] [CrossRef]
- Choe, G.; Oh, S.; Seok, J.M.; Park, S.A.; Lee, J.Y. Graphene Oxide/Alginate Composites as Novel Bioinks for Three-Dimensional Mesenchymal Stem Cell Printing and Bone Regeneration Applications. Nanoscale 2019, 11, 23275–23285. [Google Scholar] [CrossRef]
- Lee, M.; Bae, K.; Guillon, P.; Chang, J.; Arlov, Ø.; Zenobi-Wong, M. Exploitation of Cationic Silica Nanoparticles for Bioprinting of Large-Scale Constructs with High Printing Fidelity. ACS Appl. Mater. Interfaces 2018, 10, 37820–37828. [Google Scholar] [CrossRef]
- Wüst, S.; Godla, M.E.; Müller, R.; Hofmann, S. Tunable Hydrogel Composite with Two-Step Processing in Combination with Innovative Hardware Upgrade for Cell-Based Three-Dimensional Bioprinting. Acta Biomater. 2014, 10, 630–640. [Google Scholar] [CrossRef] [PubMed]
- Yu, J.; Ha, W.; Sun, J.N.; Shi, Y.P. Supramolecular Hybrid Hydrogel Based on Host-Guest Interaction and Its Application in Drug Delivery. ACS Appl. Mater. Interfaces 2014, 6, 19544–19551. [Google Scholar] [CrossRef] [PubMed]
- Blaeser, A.; Duarte Campos, D.F.; Puster, U.; Richtering, W.; Stevens, M.M.; Fischer, H. Controlling Shear Stress in 3D Bioprinting Is a Key Factor to Balance Printing Resolution and Stem Cell Integrity. Adv. Healthc. Mater. 2016, 5, 326–333. [Google Scholar] [CrossRef] [PubMed]
- Mashhadi Keshtiban, M.; Taghvaei, H.; Noroozi, R.; Eskandari, V.; Arif, Z.U.; Bodaghi, M.; Bardania, H.; Hadi, A. Biological and Mechanical Response of Graphene Oxide Surface-Treated Polylactic Acid 3D-Printed Bone Scaffolds: Experimental and Numerical Approaches. Adv. Eng. Mater. 2024, 26, 202301260. [Google Scholar] [CrossRef]
- Chung, C.; Kim, Y.K.; Shin, D.; Ryoo, S.R.; Hong, B.H.; Min, D.H. Biomedical Applications of Graphene and Graphene Oxide. Acc. Chem. Res. 2013, 46, 2211–2224. [Google Scholar] [CrossRef] [PubMed]
- Li, W.; Liu, M.; Cheng, S.; Zhang, H.; Yang, W.; Yi, Z.; Zeng, Q.; Tang, B.; Ahmad, S.; Sun, T. Polarization Independent Tunable Bandwidth Absorber Based on Single-Layer Graphene. Diam. Relat. Mater. 2024, 142, 110793. [Google Scholar] [CrossRef]
- Khonina, S.N.; Kazanskiy, N.L.; Butt, M.A.; Karpeev, S.V. Optical Multiplexing Techniques and Their Marriage for On-Chip and Optical Fiber Communication: A Review. Opto-Electron. Adv. 2022, 5, 210127. [Google Scholar] [CrossRef]
- Zeng, C.; Lu, H.; Mao, D.; Du, Y.; Hua, H.; Zhao, W.; Zhao, J. Graphene-Empowered Dynamic Metasurfaces and Metadevices. Opto-Electron. Adv. 2022, 5, 200098. [Google Scholar] [CrossRef]
- Park, S.Y.; Park, J.; Sim, S.H.; Sung, M.G.; Kim, K.S.; Hong, B.H.; Hong, S. Enhanced Differentiation of Human Neural Stem Cells into Neurons on Graphene. Adv. Mater. 2011, 23, 263–267. [Google Scholar] [CrossRef]
- Chen, H.; Müller, M.B.; Gilmore, K.J.; Wallace, G.G.; Li, D. Mechanically Strong, Electrically Conductive, and Biocompatible Graphene Paper. Adv. Mater. 2008, 20, 3557–3561. [Google Scholar] [CrossRef]
- Lee, W.C.; Lim, C.H.Y.X.; Shi, H.; Tang, L.A.L.; Wang, Y.; Lim, C.T.; Loh, K.P. Origin of Enhanced Stem Cell Growth and Differentiation on Graphene and Graphene Oxide. ACS Nano 2011, 5, 7334–7341. [Google Scholar] [CrossRef] [PubMed]
- Nayak, T.R.; Andersen, H.; Makam, V.S.; Khaw, C.; Bae, S.; Xu, X.; Ee, P.L.R.; Ahn, J.H.; Hong, B.H.; Pastorin, G.; et al. Graphene for Controlled and Accelerated Osteogenic Differentiation of Human Mesenchymal Stem Cells. ACS Nano 2011, 5, 4670–4678. [Google Scholar] [CrossRef] [PubMed]
- Marrella, A.; Lagazzo, A.; Barberis, F.; Catelani, T.; Quarto, R.; Scaglione, S. Enhanced Mechanical Performances and Bioactivity of Cell Laden-Graphene Oxide/Alginate Hydrogels Open New Scenario for Articular Tissue Engineering Applications. Carbon N. Y. 2017, 115, 608–616. [Google Scholar] [CrossRef]
- Kang, S.; Park, J.B.; Lee, T.J.; Ryu, S.; Bhang, S.H.; La, W.G.; Noh, M.K.; Hong, B.H.; Kim, B.S. Covalent Conjugation of Mechanically Stiff Graphene Oxide Flakes to Three-Dimensional Collagen Scaffolds for Osteogenic Differentiation of Human Mesenchymal Stem Cells. Carbon N. Y. 2015, 83, 162–172. [Google Scholar] [CrossRef]
- Shin, S.R.; Aghaei-Ghareh-Bolagh, B.; Dang, T.T.; Topkaya, S.N.; Gao, X.; Yang, S.Y.; Jung, S.M.; Oh, J.H.; Dokmeci, M.R.; Tang, X.; et al. Cell-Laden Microengineered and Mechanically Tunable Hybrid Hydrogels of Gelatin and Graphene Oxide. Adv. Mater. 2013, 25, 6385–6391. [Google Scholar] [CrossRef] [PubMed]
- Mukherjee, S.P.; Bottini, M.; Fadeel, B. Graphene and the Immune System: A Romance of Many Dimensions. Front. Immunol. 2017, 8, 673. [Google Scholar] [CrossRef] [PubMed]
- Feito, M.J.; Cicuéndez, M.; Casarrubios, L.; Diez-Orejas, R.; Fateixa, S.; Silva, D.; Barroca, N.; Marques, P.A.A.P.; Portolés, M.T. Effects of Graphene Oxide and Reduced Graphene Oxide Nanostructures on CD4+ Th2 Lymphocytes. Int. J. Mol. Sci. 2022, 23, 10625. [Google Scholar] [CrossRef] [PubMed]
- Peng, G.; Sinkko, H.M.; Alenius, H.; Lozano, N.; Kostarelos, K.; Bräutigam, L.; Fadeel, B. Graphene Oxide Elicits Microbiome-Dependent Type 2 Immune Responses via the Aryl Hydrocarbon Receptor. Nat. Nanotechnol. 2023, 18, 42–48. [Google Scholar] [CrossRef] [PubMed]
- Zhi, X.; Fang, H.; Bao, C.; Shen, G.; Zhang, J.; Wang, K.; Guo, S.; Wan, T.; Cui, D. The Immunotoxicity of Graphene Oxides and the Effect of PVP-Coating. Biomaterials 2013, 34, 5254–5261. [Google Scholar] [CrossRef]
- Naghieh, S.; Chen, X. Printability–A Key Issue in Extrusion-Based Bioprinting. J. Pharm. Anal. 2021, 11, 564–579. [Google Scholar] [CrossRef] [PubMed]
- Habib, A.; Sathish, V.; Mallik, S.; Khoda, B. 3D Printability of Alginate-Carboxymethyl Cellulose Hydrogel. Materials 2018, 11, 454. [Google Scholar] [CrossRef] [PubMed]
- Sarker, M.; Izadifar, M.; Schreyer, D.; Chen, X. Influence of Ionic Crosslinkers (Ca2+/Ba2+/Zn2+) on the Mechanical and Biological Properties of 3D Bioplotted Hydrogel Scaffolds. J. Biomater. Sci. Polym. Ed. 2018, 29, 1126–1154. [Google Scholar] [CrossRef] [PubMed]
- ISO 10993-5; Biological Evaluation of Medical Devices—Part 5: Tests for In Vitro Cytotoxicity. ISO: Genève, Switzerlan, 2009.
- Livak, K.J.; Schmittgen, T.D. Analysis of Relative Gene Expression Data Using Real-Time Quantitative PCR and the 2−ΔΔCT Method. Methods 2001, 25, 402–408. [Google Scholar] [CrossRef] [PubMed]
- Szklarczyk, D.; Gable, A.L.; Lyon, D.; Junge, A.; Wyder, S.; Huerta-Cepas, J.; Simonovic, M.; Doncheva, N.T.; Morris, J.H.; Bork, P.; et al. STRING V11: Protein-Protein Association Networks with Increased Coverage, Supporting Functional Discovery in Genome-Wide Experimental Datasets. Nucleic Acids Res. 2019, 47, D607–D613. [Google Scholar] [CrossRef] [PubMed]
- Schwab, A.; Levato, R.; D’Este, M.; Piluso, S.; Eglin, D.; Malda, J. Printability and Shape Fidelity of Bioinks in 3D Bioprinting. Chem. Rev. 2020, 120, 11028–11055. [Google Scholar] [CrossRef] [PubMed]
- Li, J.; Liu, X.; Crook, J.M.; Wallace, G.G. Development of 3D Printable Graphene Oxide Based Bio-Ink for Cell Support and Tissue Engineering. Front. Bioeng. Biotechnol. 2022, 10, 994776. [Google Scholar] [CrossRef] [PubMed]
- Kimbell, G.; Azad, M.A. 3D Printing: Bioinspired Materials for Drug Delivery. In Bioinspired and Biomimetic Materials for Drug Delivery; Woodhead Publishing: Sawston, UK, 2021; pp. 295–318. [Google Scholar] [CrossRef]
- Chen, Y.; Cheng, W.; Teng, L.; Jin, M.; Lu, B.; Ren, L.; Wang, Y. Graphene Oxide Hybrid Supramolecular Hydrogels with Self-Healable, Bioadhesive and Stimuli-Responsive Properties and Drug Delivery Application. Macromol. Mater. Eng. 2018, 303, 201700660. [Google Scholar] [CrossRef]
- Ding, Y.W.; Zhang, X.W.; Mi, C.H.; Qi, X.Y.; Zhou, J.; Wei, D.X. Recent Advances in Hyaluronic Acid-Based Hydrogels for 3D Bioprinting in Tissue Engineering Applications. Smart Mater. Med. 2023, 4, 59–68. [Google Scholar] [CrossRef]
- Theus, A.S.; Ning, L.; Hwang, B.; Gil, C.; Chen, S.; Wombwell, A.; Mehta, R.; Serpooshan, V. Bioprintability: Physiomechanical and Biological Requirements of Materials for 3d Bioprinting Processes. Polymers 2020, 12, 2262. [Google Scholar] [CrossRef]
- Zhao, X.; Lang, Q.; Yildirimer, L.; Lin, Z.Y.; Cui, W.; Annabi, N.; Ng, K.W.; Dokmeci, M.R.; Ghaemmaghami, A.M.; Khademhosseini, A. Photocrosslinkable Gelatin Hydrogel for Epidermal Tissue Engineering. Adv. Healthc. Mater. 2016, 5, 108–118. [Google Scholar] [CrossRef]
- Pepelanova, I.; Kruppa, K.; Scheper, T.; Lavrentieva, A. Gelatin-Methacryloyl (GelMA) Hydrogels with Defined Degree of Functionalization as a Versatile Toolkit for 3D Cell Culture and Extrusion Bioprinting. Bioengineering 2018, 5, 55. [Google Scholar] [CrossRef] [PubMed]
- Hao, L.; Tao, X.; Feng, M.; Zhou, K.; He, Y.; Yang, J.; Mao, H.; Gu, Z. Stepwise Multi-Cross-Linking Bioink for 3D Embedded Bioprinting to Promote Full-Thickness Wound Healing. ACS Appl. Mater. Interfaces 2023, 15, 24034–24046. [Google Scholar] [CrossRef]
- Ali, M.; Anil Kumar, P.R.; Yoo, J.J.; Zahran, F.; Atala, A.; Lee, S.J. A Photo-Crosslinkable Kidney ECM-Derived Bioink Accelerates Renal Tissue Formation. Adv. Healthc. Mater. 2019, 8, 201800992. [Google Scholar] [CrossRef] [PubMed]
- Loi, G.; Stucchi, G.; Scocozza, F.; Cansolino, L.; Cadamuro, F.; Delgrosso, E.; Riva, F.; Ferrari, C.; Russo, L.; Conti, M. Characterization of a Bioink Combining Extracellular Matrix-like Hydrogel with Osteosarcoma Cells: Preliminary Results. Gels 2023, 9, 129. [Google Scholar] [CrossRef] [PubMed]
- Dubey, N.; Ferreira, J.A.; Malda, J.; Bhaduri, S.B.; Bottino, M.C. Extracellular Matrix/Amorphous Magnesium Phosphate Bioink for 3D Bioprinting of Craniomaxillofacial Bone Tissue. ACS Appl. Mater. Interfaces 2020, 12, 23752–23763. [Google Scholar] [CrossRef] [PubMed]
- Espina, J.A.; Cordeiro, M.H.; Milivojevic, M.; Pajić-Lijaković, I.; Barriga, E.H. Response of Cells and Tissues to Shear Stress. J. Cell Sci. 2023, 136, jcs260985. [Google Scholar] [CrossRef] [PubMed]
- Magalhães, I.P.; de Oliveira, P.M.; Dernowsek, J.; Casas, E.B.L.; Casas, M.S. Las. Investigation of the Effect of Nozzle Design on Rheological Bioprinting Properties Using Computational Fluid Dynamics. Rev. Mater. 2019, 24, e12401. [Google Scholar] [CrossRef]
- Murphy, S.V.; Atala, A. 3D Bioprinting of Tissues and Organs. Nat. Biotechnol. 2014, 32, 773–785. [Google Scholar] [CrossRef]
- Derakhshanfar, S.; Mbeleck, R.; Xu, K.; Zhang, X.; Zhong, W.; Xing, M. 3D Bioprinting for Biomedical Devices and Tissue Engineering: A Review of Recent Trends and Advances. Bioact. Mater. 2018, 3, 144–156. [Google Scholar] [CrossRef]
- Zhu, H.; Monavari, M.; Zheng, K.; Distler, T.; Ouyang, L.; Heid, S.; Jin, Z.; He, J.; Li, D.; Boccaccini, A.R. 3D Bioprinting of Multifunctional Dynamic Nanocomposite Bioinks Incorporating Cu-Doped Mesoporous Bioactive Glass Nanoparticles for Bone Tissue Engineering. Small 2022, 18, 202104996. [Google Scholar] [CrossRef]
- Kang, M.S.; Kang, J.I.; Le Thi, P.; Park, K.M.; Hong, S.W.; Choi, Y.S.; Han, D.W.; Park, K.D. Three-Dimensional Printable Gelatin Hydrogels Incorporating Graphene Oxide to Enable Spontaneous Myogenic Differentiation. ACS Macro Lett. 2021, 10, 426–432. [Google Scholar] [CrossRef] [PubMed]
- Im, S.; Choe, G.; Seok, J.M.; Yeo, S.J.; Lee, J.H.; Kim, W.D.; Lee, J.Y.; Park, S.A. An Osteogenic Bioink Composed of Alginate, Cellulose Nanofibrils, and Polydopamine Nanoparticles for 3D Bioprinting and Bone Tissue Engineering. Int. J. Biol. Macromol. 2022, 205, 520–529. [Google Scholar] [CrossRef]
- Chakraborty, A.; Roy, A.; Ravi, S.P.; Paul, A. Exploiting the Role of Nanoparticles for Use in Hydrogel-Based Bioprinting Applications: Concept, Design, and Recent Advances. Biomater. Sci. 2021, 9, 6337–6354. [Google Scholar] [CrossRef]
- Zhang, J.; Eyisoylu, H.; Qin, X.H.; Rubert, M.; Müller, R. 3D Bioprinting of Graphene Oxide-Incorporated Cell-Laden Bone Mimicking Scaffolds for Promoting Scaffold Fidelity, Osteogenic Differentiation and Mineralization. Acta Biomater. 2021, 121, 637–652. [Google Scholar] [CrossRef]
- Wei, L.; Li, Z.; Li, J.; Zhang, Y.; Yao, B.; Liu, Y.; Song, W.; Fu, X.; Wu, X.; Huang, S. An Approach for Mechanical Property Optimization of Cell-Laden Alginate–Gelatin Composite Bioink with Bioactive Glass Nanoparticles. J. Mater. Sci. Mater. Med. 2020, 31, 103. [Google Scholar] [CrossRef]
- Zhu, S.; Yao, L.; Pan, C.; Tian, J.; Li, L.; Luo, B.; Zhou, C.; Lu, L. 3D Printed Gellan Gum/Graphene Oxide Scaffold for Tumor Therapy and Bone Reconstruction. Compos. Sci. Technol. 2021, 208, 108763. [Google Scholar] [CrossRef]
- Megha, K.B.; Joseph, X.; Akhil, V.; Mohanan, P.V. Cascade of Immune Mechanism and Consequences of Inflammatory Disorders. Phytomedicine 2021, 91, 153712. [Google Scholar] [CrossRef]
- Wick, P.; Louw-Gaume, A.E.; Kucki, M.; Krug, H.F.; Kostarelos, K.; Fadeel, B.; Dawson, K.A.; Salvati, A.; Vázquez, E.; Ballerini, L.; et al. Classification Framework for Graphene-Based Materials. Angew. Chem. Int. Ed. 2014, 53, 7714–7718. [Google Scholar] [CrossRef]
- Lategan, K.; Alghadi, H.; Bayati, M.; de Cortalezzi, M.F.; Pool, E. Effects of Graphene Oxide Nanoparticles on the Immune System Biomarkers Produced by RAW 264.7 and Human Whole Blood Cell Cultures. Nanomaterials 2018, 8, 125. [Google Scholar] [CrossRef]
- Yang, Z.; Pan, Y.; Chen, T.; Li, L.; Zou, W.; Liu, D.; Xue, D.; Wang, X.; Lin, G. Cytotoxicity and Immune Dysfunction of Dendritic Cells Caused by Graphene Oxide. Front. Pharmacol. 2020, 11, 1206. [Google Scholar] [CrossRef] [PubMed]
- Cebadero-Dominguez, Ó.; Casas-Rodríguez, A.; Puerto, M.; Cameán, A.M.; Jos, A. In Vitro Safety Assessment of Reduced Graphene Oxide in Human Monocytes and T Cells. Environ. Res. 2023, 232, 116356. [Google Scholar] [CrossRef] [PubMed]
- Zhao, H.; Wu, L.; Yan, G.; Chen, Y.; Zhou, M.; Wu, Y.; Li, Y. Inflammation and Tumor Progression: Signaling Pathways and Targeted Intervention. Signal Transduct. Target. Ther. 2021, 6, 263. [Google Scholar] [CrossRef] [PubMed]
- Schilz, J.R.; Dashner-Titus, E.J.; Luo, L.; Simmons, K.A.; MacKenzie, D.A.; Hudson, L.G. Co-Exposure of Sodium Arsenite and Uranyl Acetate Differentially Alters Gene Expression in CD3/CD28 Activated CD4+ T-Cells. Toxicol. Rep. 2021, 8, 1917–1929. [Google Scholar] [CrossRef] [PubMed]
- Kohli, K.; Pillarisetty, V.G.; Kim, T.S. Key Chemokines Direct Migration of Immune Cells in Solid Tumors. Cancer Gene Ther. 2022, 29, 10–21. [Google Scholar] [CrossRef] [PubMed]
- Farani, P.S.G.; Begum, K.; Vilar-Pereira, G.; Pereira, I.R.; Almeida, I.C.; Roy, S.; Lannes-Vieira, J.; Moreira, O.C. Treatment with Suboptimal Dose of Benznidazole Mitigates Immune Response Molecular Pathways in Mice with Chronic Chagas Cardiomyopathy. Front. Cell. Infect. Microbiol. 2021, 11, 692655. [Google Scholar] [CrossRef] [PubMed]
- Sobah, M.L.; Liongue, C.; Ward, A.C. SOCS Proteins in Immunity, Inflammatory Diseases, and Immune-Related Cancer. Front. Med. 2021, 8, 727987. [Google Scholar] [CrossRef] [PubMed]
- Trzupek, D.; Dunstan, M.; Cutler, A.J.; Lee, M.; Godfrey, L.; Jarvis, L.; Rainbow, D.B.; Aschenbrenner, D.; Jones, J.L.; Uhlig, H.H.; et al. Discovery of CD80 and CD86 as Recent Activation Markers on Regulatory T Cells by Protein-RNA Single-Cell Analysis. Genome Med. 2020, 12, 55. [Google Scholar] [CrossRef]
- Takatsu, K. Interleukin-5 and IL-5 Receptor in Health and Diseases. Proc. Jpn. Acad. Ser. B Phys. Biol. Sci. 2011, 87, 463–485. [Google Scholar] [CrossRef]
- Sheng, J.; Wang, L.; Tang, P.M.K.; Wang, H.L.; Li, J.C.; Xu, B.H.; Xue, V.W.; Tan, R.Z.; Jin, N.; Chan, T.F.; et al. Smad3 Deficiency Promotes Beta Cell Proliferation and Function in Db/Db Mice via Restoring Pax6 Expression. Theranostics 2021, 11, 2845–2859. [Google Scholar] [CrossRef]
- Shim, N.Y.; Heo, J.S. Performance of the Polydopamine–Graphene Oxide Composite Substrate in the Osteogenic Differentiation of Mouse Embryonic Stem Cells. Int. J. Mol. Sci. 2021, 22, 7323. [Google Scholar] [CrossRef] [PubMed]
- Yang, Y.; Li, M.; Zhou, B.; Jiang, X.; Zhang, D.; Luo, H. Graphene Oxide/Gallium Nanoderivative as a Multifunctional Modulator of Osteoblastogenesis and Osteoclastogenesis for the Synergistic Therapy of Implant-Related Bone Infection. Bioact. Mater. 2023, 25, 594–614. [Google Scholar] [CrossRef] [PubMed]
- Park, S.; Kim, Y.J.; Sharma, H.; Kim, D.; Gwon, Y.; Kim, W.; Park, S.; Ha, C.W.; Choung, Y.-H.; Kim, J. Graphene Hybrid Inner Ear Organoid with Enhanced Maturity. Nano Lett. 2023, 23, 5573–5580. [Google Scholar] [CrossRef] [PubMed]


| Variant | Concentration [mg/mL] | |||||
|---|---|---|---|---|---|---|
| dECM | GO | GelMa | HaMa | LAP | Glycerol | |
| HGO1 | - | 1 | 78.3 | 1.7 | 1.85 | - |
| HGO2 | - | 1 | 130 | 6.5 | 1.85 | - |
| BREF | 76.6 | 0 | 37.5 | 0.56 | 1.85 | 89.8 |
| BGO1 | 76.6 | 0.5 | 37.5 | 0.56 | 1.85 | 89.8 |
| BGO2 | 76.6 | 0.5 | 62 | 3.1 | 1.85 | 89.8 |
| Variant | Swelling Ratio [%] | Degree of Degradation [%] | |
|---|---|---|---|
| Non-Enzymatic | Enzymatic | ||
| HGO1 | 5168 | 65.97 | 81.82 |
| HGO2 | 3329 | 88.11 | 92.07 |
| BGO1 | 607 | 53.59 | 78.75 |
| BGO2 | 513 | 75.17 | 90.94 |
Disclaimer/Publisher’s Note: The statements, opinions and data contained in all publications are solely those of the individual author(s) and contributor(s) and not of MDPI and/or the editor(s). MDPI and/or the editor(s) disclaim responsibility for any injury to people or property resulting from any ideas, methods, instructions or products referred to in the content. |
© 2024 by the authors. Licensee MDPI, Basel, Switzerland. This article is an open access article distributed under the terms and conditions of the Creative Commons Attribution (CC BY) license (https://creativecommons.org/licenses/by/4.0/).
Share and Cite
Kosowska, K.; Korycka, P.; Jankowska-Snopkiewicz, K.; Gierałtowska, J.; Czajka, M.; Florys-Jankowska, K.; Dec, M.; Romanik-Chruścielewska, A.; Małecki, M.; Westphal, K.; et al. Graphene Oxide (GO)-Based Bioink with Enhanced 3D Printability and Mechanical Properties for Tissue Engineering Applications. Nanomaterials 2024, 14, 760. https://doi.org/10.3390/nano14090760
Kosowska K, Korycka P, Jankowska-Snopkiewicz K, Gierałtowska J, Czajka M, Florys-Jankowska K, Dec M, Romanik-Chruścielewska A, Małecki M, Westphal K, et al. Graphene Oxide (GO)-Based Bioink with Enhanced 3D Printability and Mechanical Properties for Tissue Engineering Applications. Nanomaterials. 2024; 14(9):760. https://doi.org/10.3390/nano14090760
Chicago/Turabian StyleKosowska, Katarzyna, Paulina Korycka, Kamila Jankowska-Snopkiewicz, Joanna Gierałtowska, Milena Czajka, Katarzyna Florys-Jankowska, Magdalena Dec, Agnieszka Romanik-Chruścielewska, Maciej Małecki, Kinga Westphal, and et al. 2024. "Graphene Oxide (GO)-Based Bioink with Enhanced 3D Printability and Mechanical Properties for Tissue Engineering Applications" Nanomaterials 14, no. 9: 760. https://doi.org/10.3390/nano14090760