Electronic and Molecular Adsorption Properties of Pt-Doped BC6N: An Ab-Initio Investigation


1
Department of Physics, College of Science, Imam Abdulrahman Bin Faisal University, Dammam 31441, Saudi Arabia
2
Physics Department, Faculty of Science, Benha University, Benha 13518, Egypt
3
Department of Physics, College of Science and Humanities, Imam Abdulrahman Bin Faisal University, Jubail 35811, Saudi Arabia
4
Department of Physics, Faculty of Basic Sciences, German University in Cairo, New Cairo City 11835, Egypt
*
Authors to whom correspondence should be addressed.
Nanomaterials 2024, 14(9), 762; https://doi.org/10.3390/nano14090762
Submission received: 10 March 2024
/
Revised: 16 April 2024
/
Accepted: 20 April 2024
/
Published: 26 April 2024
(This article belongs to the Section 2D and Carbon Nanomaterials)
Abstract
:In the last two decades, significant efforts have been particularly invested in two-dimensional (2D) hexagonal boron carbon nitride h-BxCyNz because of its unique physical and chemical characteristics. The presence of the carbon atoms lowers the large gap of its cousin structure, boron nitride (BN), making it more suitable for various applications. Here, we use density functional theory to study the structural, electronic, and magnetic properties of Pt-doped BC6N (Pt-BC6N, as well as its adsorption potential of small molecular gases (NO, NO2, CO2, NH3). We consider all distinct locations of the Pt atom in the supercell (B, N, and two C sites). Different adsorption locations are also considered for the pristine and Pt-doped systems. The formation energies of all Pt-doped structures are close to those of the pristine system, reflecting their stability. The pristine BC6N is semiconducting, so doping with Pt at the B and N sites gives a diluted magnetic semiconductor while doping at the C1 and C2 sites results in a smaller gap semiconductor. We find that all doped structures exhibit direct band gaps. The studied molecules are very weakly physisorbed on the pristine structure. Pt doping leads to much stronger interactions, where NO, NO2, and NH3 chemisorb on the doped systems, and CO2 physiorb, illustrating the doped systems’ potential for gas purification applications. We also find that the adsorption changes the electronic and magnetic properties of the doped systems, inviting their consideration for spintronics and gas sensing.
1. Introduction
Since graphene’s fabrication in 2004 [1], two-dimensional (2D) materials have gained considerable experimental and theoretical interest. The reduced dimensionality of these materials and the wide variety of their structural and compositional properties have promised great technological utilization. This interest is boosted by the progress in experimental and characterization methods, which reflects on the potential of fabricating complex structures with specific physical or chemical properties.
Perhaps the most commonly known 2D material is graphene, which possesses unique electronic, mechanical, and optical properties that nominate it for many technological applications [2]. However, some shortcomings in graphene, like its lack of an electronic band gap, led researchers to look for other graphene-like materials [3,4]. Silicene [5], germanene [6], hexagonal boron nitride (h-BN) [7], transition metal dichalcogenides (TMDs) [3,8], MXenes [9,10], and Mo(W)Si2N4 [11] are examples of 2D materials that mostly have a honeycomb structure, associated with some great features not existing in 3D materials, such as large surface area, high optical transparency, and active sites. The special physical and chemical properties exhibited by 2D materials make them excellent candidates for many potential applications, such as photocatalysis [12], field-effect transistors [13], hydrogen storage [14,15], and gas sensing [16,17,18].
Boron, nitrogen, and carbon are contemporaries on the periodic table. Carbon forms strong covalent bonds with boron and nitrogen, while boron and nitrogen form covalent-polarized bonds. This leads to a variety of (h-BxCyNz) compounds [19,20] that recently gained much interest [21]. The replacement of B or N by C may offer a way to tune the properties of those systems without causing any significant lattice distortion. Introducing BN patches into the graphene lattice has been shown to change it from a semimetal to a semiconductor. The Dirac point disappears, and a direct band gap opens at the K points [22,23,24]. It is thus expected that changing the relative compositions of B, C, and N in h-BxCyNz structures may lead to a rich spectrum of physical properties.
Several ternary B-C-N molecule compositions (for example, BCN, BC2N, BC4N, BC6N, and B2CN) have been fabricated utilizing a variety of methodologies such as chemical vapor coating, a solvothermal approach, and a chemical reaction approach [25]. BC2N also captured the attention of researchers since it is expected to be more thermally stable and chemically inert than diamond and harder than c-BN [22,26]. BCN has a wide range of applications, such as oxidation of contaminants and colorants, hydrogen production from water, clear photovoltaic cell fabrication, UV absorption, optoelectronics, fire-resistant materials, and catalysis for a wide range of chemical interactions [27,28].
Recently, BC6N 2D quantum dots have been successfully synthesized by doping graphene quantum dots with boron and nitrogen atoms [29]. The material is found to be a semiconductor with a band gap of 1.2–1.3 eV [30,31]. Because of the graphene-like structure of BC6N, it shares some of graphene’s physical and mechanical properties, such as high stiffness and high thermal conductivity [19,31]. Numerous studies have been conducted on BC6N to tailor its properties for various applications. It is possible to induce metallic, half-metallic, or dilute magnetic semiconductor behavior by substitutional and adsorption doping in BC6N [30,31]. Furthermore, defects such as vacancies alter the electrostatic landscape of BC6N, making it sensitive to specific gases [30,31].
With their high intrinsic activity, noble metals can modify the electronic structure of 2D materials and enhance the interaction between gases and nanomaterials. Thus, researchers are becoming more and more interested in noble metal dopings. For example, Pt-doped 2D MoSe2 [32,33] can be an efficient electrocatalyst for both hydrogen evolution and oxygen reduction reactions. Pt dopant improves the absorption of 2D Ti3C2T2 Mxene for SF6 [34]. CO, NO, NO2, O2, and NH3 molecules can chemisorb on a Pt-doped arsenene sheet [35].
Although pristine BC6N has been studied, structures doped with various elements must be investigated. Here, we use spin-polarized density functional theory to analyze the electronic and molecular adsorption properties of Pt-doped BC6N. We consider a 3 × 3 supercell of BC6N (72 atoms) and study the substitutional Pt-doping of these systems. This supercell allows for a reasonable and experimentally common doping percentage of Pt (∼1%) and minimizes the interaction between adsorbed molecules in neighboring cells, thereby giving a more accurate estimate of the adsorption energies. The supercell has four symmetrically inequivalent sites: B, N, and two C atoms (C1 and C2). We perform the structural relaxation and calculate the densities of states of each system. We then study the adsorption of four gases (NO, CO2, NO2, and NH3) on each system, determining their adsorption energies, as well as their effect on the electronic properties of the doped-BC6N nanosheets.
2. Computational Methods
We used first-principle calculations based on spin-polarized density functional theory (DFT) as implemented in the Quantum Espresso (QE) plane waves package [36] V6.5 widely used to study the physical properties of periodic systems. The exchange–correlation interaction is described by the generalized gradient approximation (GGA) via the Perdew–Burke–Ernzerhof (PBE) functional [37], and with ultrasoft pseudopotentials (rrkjus-psl version of the QE pseudopotential PS library). An energy cut-off of 55 Ry for the wavefunction, and 550 Ry for the charge density are utilized for all SCF calculations. Our base system is a 3 × 3 supercell of BC6N, with a total of n = 72 atoms. Doped systems are constructed by substituting a dopant atom for B, N, or C (2 positions). A vacuum spacing of 20 Å avoids any interaction between neighboring images. All systems are fully relaxed (volume and ionic positions) until the forces on the atoms become less than 0.001 Ry/Bohr. Van der Waals interactions (vdW-DF) [38] are included in our study. Brillouin zone integrations are performed using the tetrahedron method and a 12 × 12 × 1 k-point grid to calculate the density of states (DOS). Band structures are calculated with 80 k-points along the path ΓMKΓ. Charge transfer from/to the BC6N systems is determined by calculating the Löwdin charges. The formation energy per atom is calculated to check the structural stability of different Pt-BC6N systems
where , , , and are the energies of the doped sheet, isolated native atom (B, N, C1 or C2), pristine sheet, and isolated Pt atom in the same supercell, respectively. The adsorption energy is evaluated by
where , , and are the energies of the sheet or doped sheet with the adsorbed molecule, sheet or doped sheet without the adsorbed molecule, and the isolated molecule in the same supercell volume, respectively.
3. Results
BC6N has a unit cell composed of 6 C atoms, 1 B, and 1 N atoms. The 6 C positions include two distinct sites: a C atom with a B or an N nearest neighbors. In order to study doping with regular experimental percentages, we construct a 3 × 3 supercell of BC6N with a total of 72 atoms. To establish a reference, we begin by calculating the electronic properties of this pristine system. The optimized atomic structure of a hexagonal BC6N is shown in Figure 1a. Our calculated bond lengths are: C-C = 1.41 Å, C-B = 1.47 Å, and C-N = 1.46 Å, which is in agreement with previous work [30,31,39,40].
Figure 1b shows the projected density of states of the pristine system. The system is semiconducting with a bandgap of 1.3 eV, which matches previous work [30,31,39,40]. The main contributions to the valence and conduction bands are due to the C states, with a small contribution from the N(B) states—the second dominant species in the valence (conduction) band. The bandgap of BC6N means that it can be a promising material for optoelectronic applications. The Löwdin charge analysis shows that C1 and N gain electronic charge, while C2 and B lose some charge, consistent with the electronegativities of those atoms and their neighbors.
We now begin to dope our systems. A look at the BC6N original unit cell (black parallelogram, Figure 1a shows that there are four distinct locations. Two locations are at the B and N atoms, and the other two are the sites of the C atoms in black circles. The two carbon sites are inequivalent. One site (C1) is connected to two carbon atoms and one boron atom, while the other (C2) is connected to two carbon atoms and one nitrogen site.
3.1. Pt-Doping
The relaxed structures of the Pt-doped systems are shown in Figure 2a–d. Minimum deformation in the vicinity of the Pt atom occurs with the Pt at the B site (PtB), the C1 site (PtC1), and the C2 site (PtC2), (Figure 2a–c), and the Pt atom is the out-of-plane bulge of about 1.80 Å with bond lengths (with the nearby atoms) of 1.97 Å, 2.08 Å, 1.96 Å, respectively. The bond length of PtC2 is large due to the atomic size of the B atom as compared to the C and N atoms. The other case is Pt instead of N (PtN, which exhibits an out-of-plane bulge of about 1.6 Å and bond length of 1.97 Å (Figure 2d). The vertical deformation can be understood with the help of the system’s Löwdin charge analysis. For the PtN doped system, the charge difference on the Pt atom and its three nearest neighbors is +0.39e, −0.17e, −0.167e and −0.168e. The corresponding distribution of the PtC2 doped system is +0.43e, −0.15e, −0.042e, and −0.005e. The bulge around the Pt atom is caused by the difference between the Pt charge. and the charges of the neighboring atoms cause the bulge. A much smaller out-of-plane deformation is seen for the PtB-doped system, with +0.08e, +0.05e, +0.06e and +0.07e, and for the PtC1-doped system, with +0.1e, −0.08e, −0.1e and −0.16e. The formation energy calculations (Equation (1)) indicate the PtN-BC6N has a slightly lower energy (0.05 eV) as compared to the other doped structures, which have the same formation energy per atom (0.09 eV), Table 1.
The DOS spectrum of the PtB-BC6N is spin asymmetric (Figure 2e), especially in the conduction band, which sees significant contributions from the Pt states (such as at 0.2 eV and 0.4 eV) and the C states. The valence band continues to be dominated by the C states. The band gap of the spin-down spectrum is similar to that of the pristine system (1.3 eV), while the spin-up gap becomes 0.2 eV due to the occupation of states localized on the Pt atom and its three nearest carbon neighbors. The asymmetric behavior of the two spin components indicates the structure is magnetic with 0.9 , and hence, the structure is a diluted magnetic semiconductor (DMSC). For PtC1- and PtC2-BC6N, the DOS of the two spin channels is symmetric, so the structure is non-magnetic. Due to the contribution of Pt states, as in the valence band, the band gaps decrease to 1.1 eV and 0.5 eV, compared to pristine BC6N. The last substitutional doping is PtN. The Fermi energy is shifted to the conduction band, and the structure is a diluted semiconductor with a spin-up and spin-down band gap of 0.2 eV and 1.4 eV, respectively. The asymmetric behavior of the DOS for two spin components in the conduction band gives the structure a magnetization of 1 . All band gaps are direct ones, as is clear from the band structures of the Pt-doped systems (Figure 2i–l).
3.2. Molecules Adsorption on Pristine and Pt-Doped BC6N Systems
We now discuss the molecular adsorption properties of our systems. We consider four gas molecules, NO, NO2, CO2, and NH3. Each molecule is initially placed above each of the distinct sites (TB (@TB), TN (@TN), H1 (@H1), and H2 (@H2)) for pristine BC6N, and (PtB, PtC1, PtC2, and PtN) for the doped Pt-BC6N sheet, and then the system is structurally relaxed. The relaxation starts from a high symmetry orientation of the molecule so that we allow it to choose the atom it faces the sheet with. We then calculate the system’s various electronic parameters. We will include the adsorption results on pristine structures to form a reference for comparison.
3.2.1. Adsorption of NO
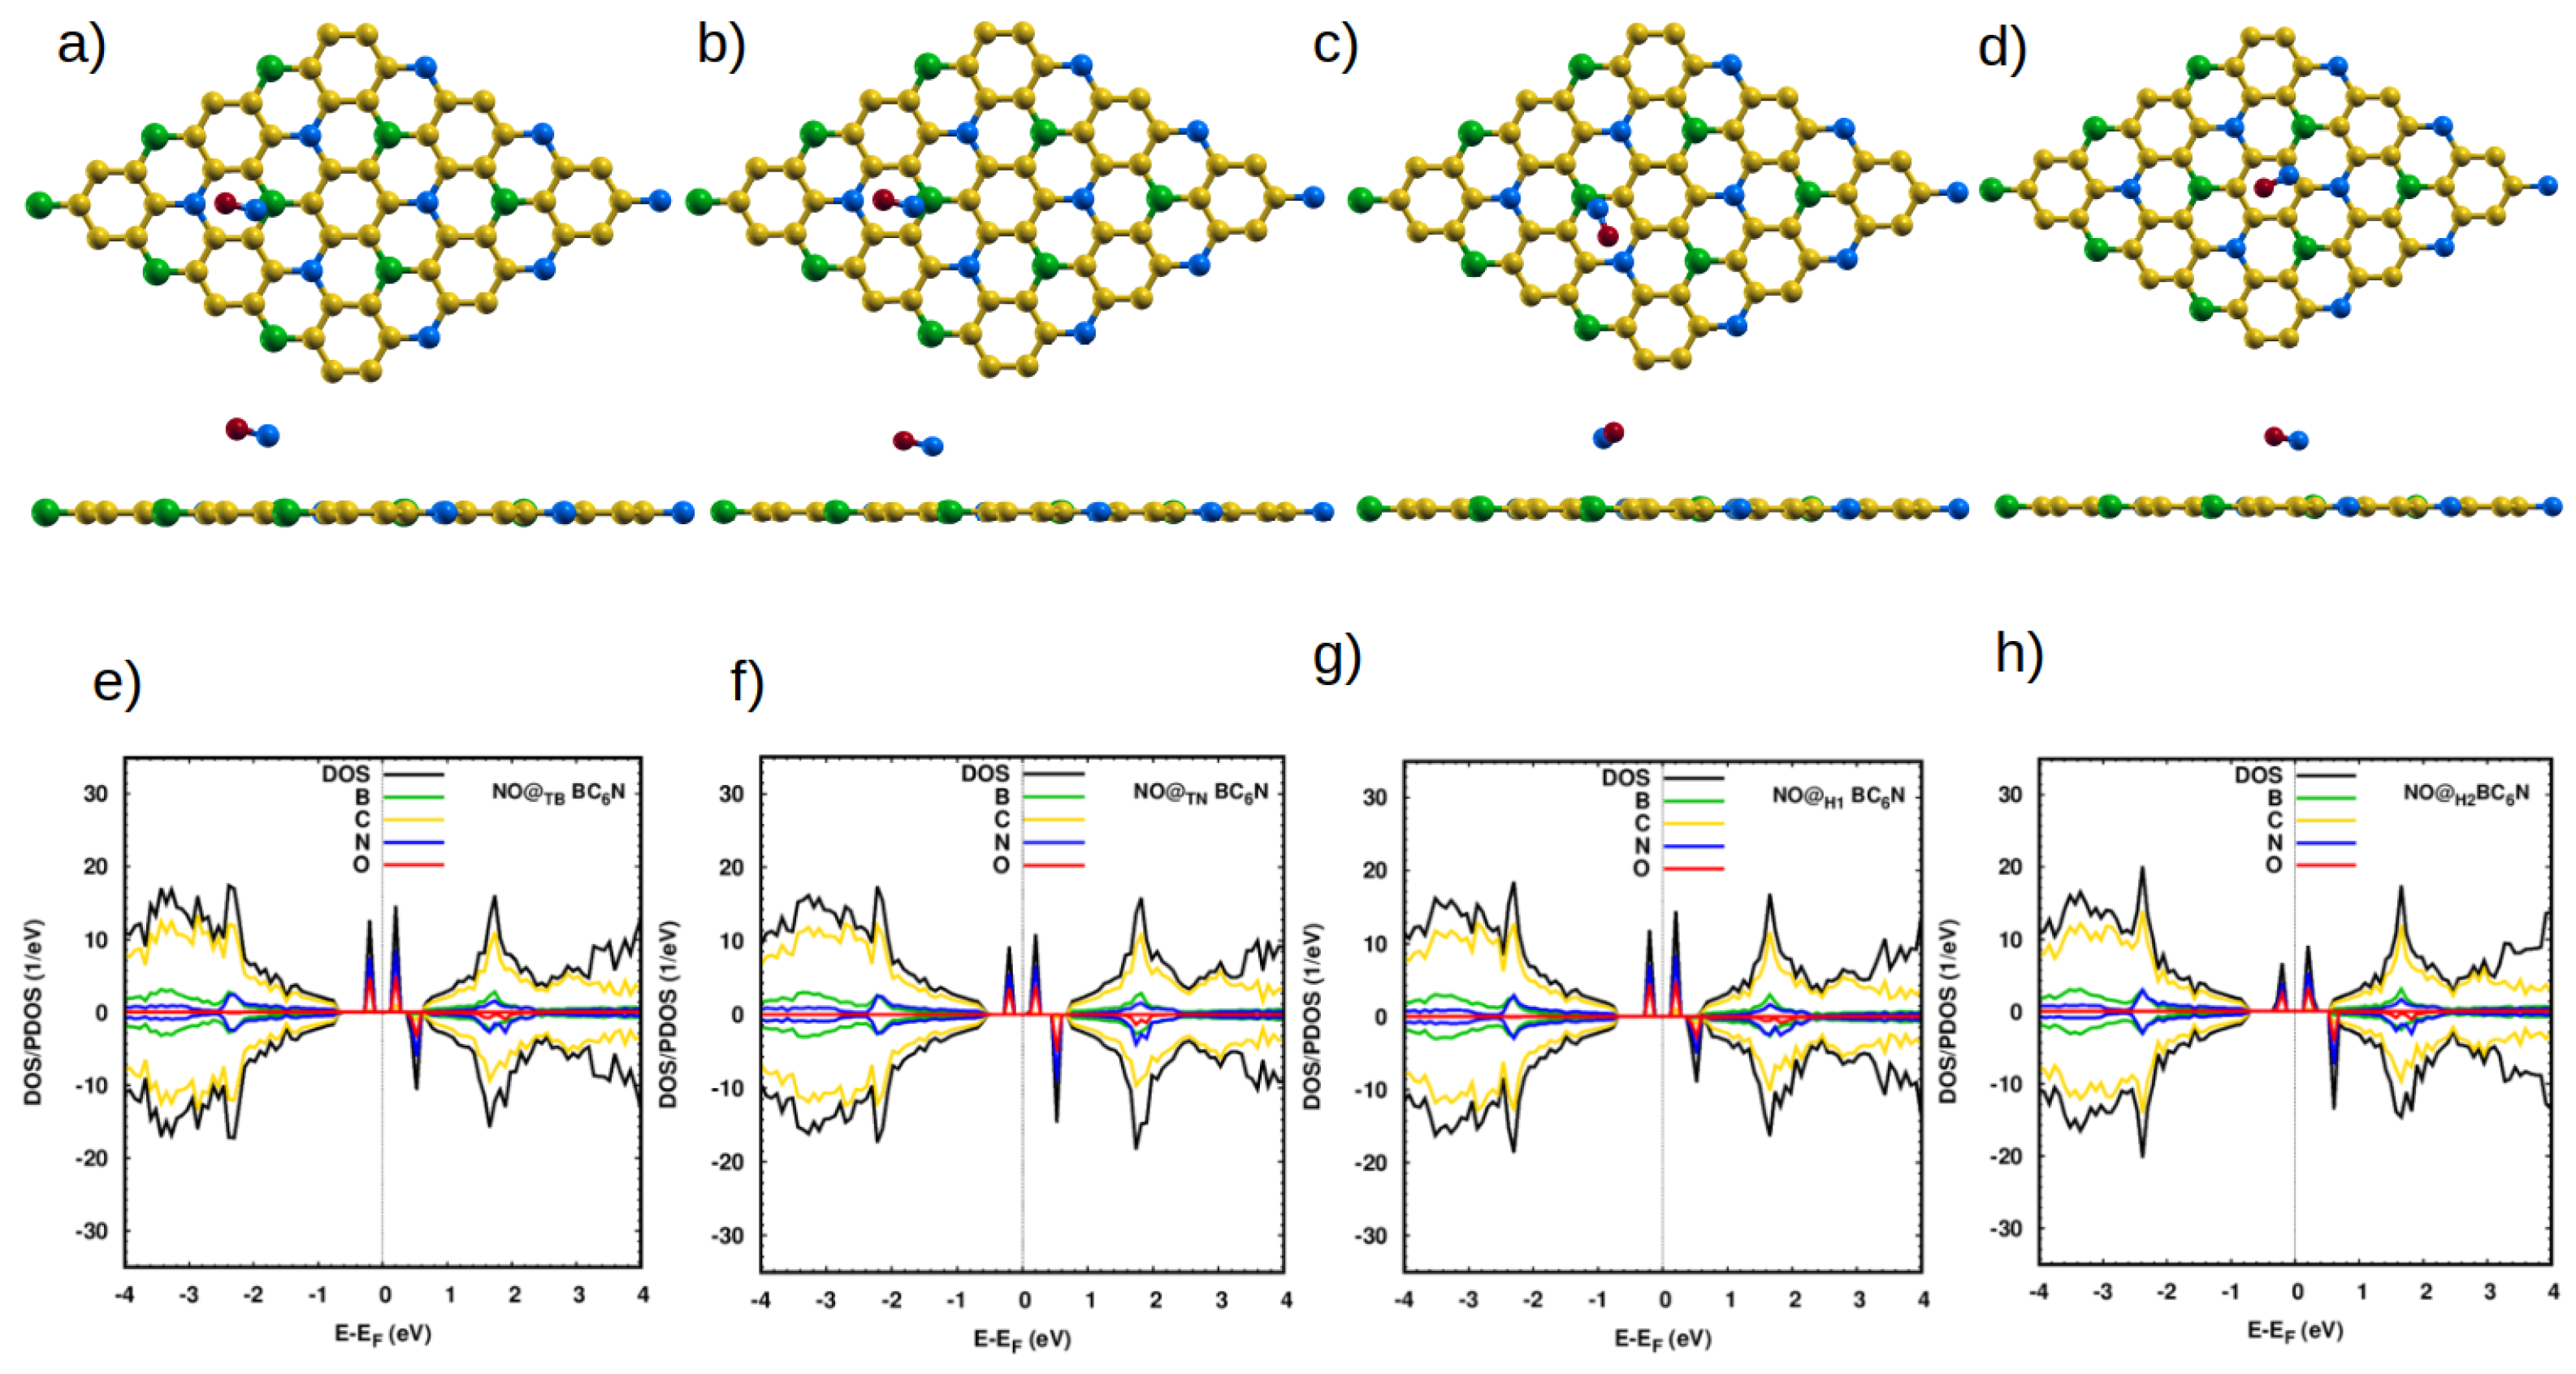
The molecular N-O bond length is 1.16 Å, which agrees well with previous calculations [9]. When NO is placed on the pristine sheet above any position, there is no significant change in its bond length. We find the distances between the N atom and the nearest atoms of our 4 sheets are 2.83 Å, 3.10 Å, 3.10 Å, and 2.88 Å, and with adsorption energies of 0.15 eV, 0.14 eV, 0.12 eV, and 0.17 eV, for the TB, TN, H1, and H2 positions, respectively (Table 2). The NO molecules adsorb very weakly (Ead < 0.2 eV) on the pristine structure at all adsorption sites (Table 2), leading to negligible effects on the DOS of the pristine system (Figure 3). As expected, no significant charge transfer occurs (Table 2).
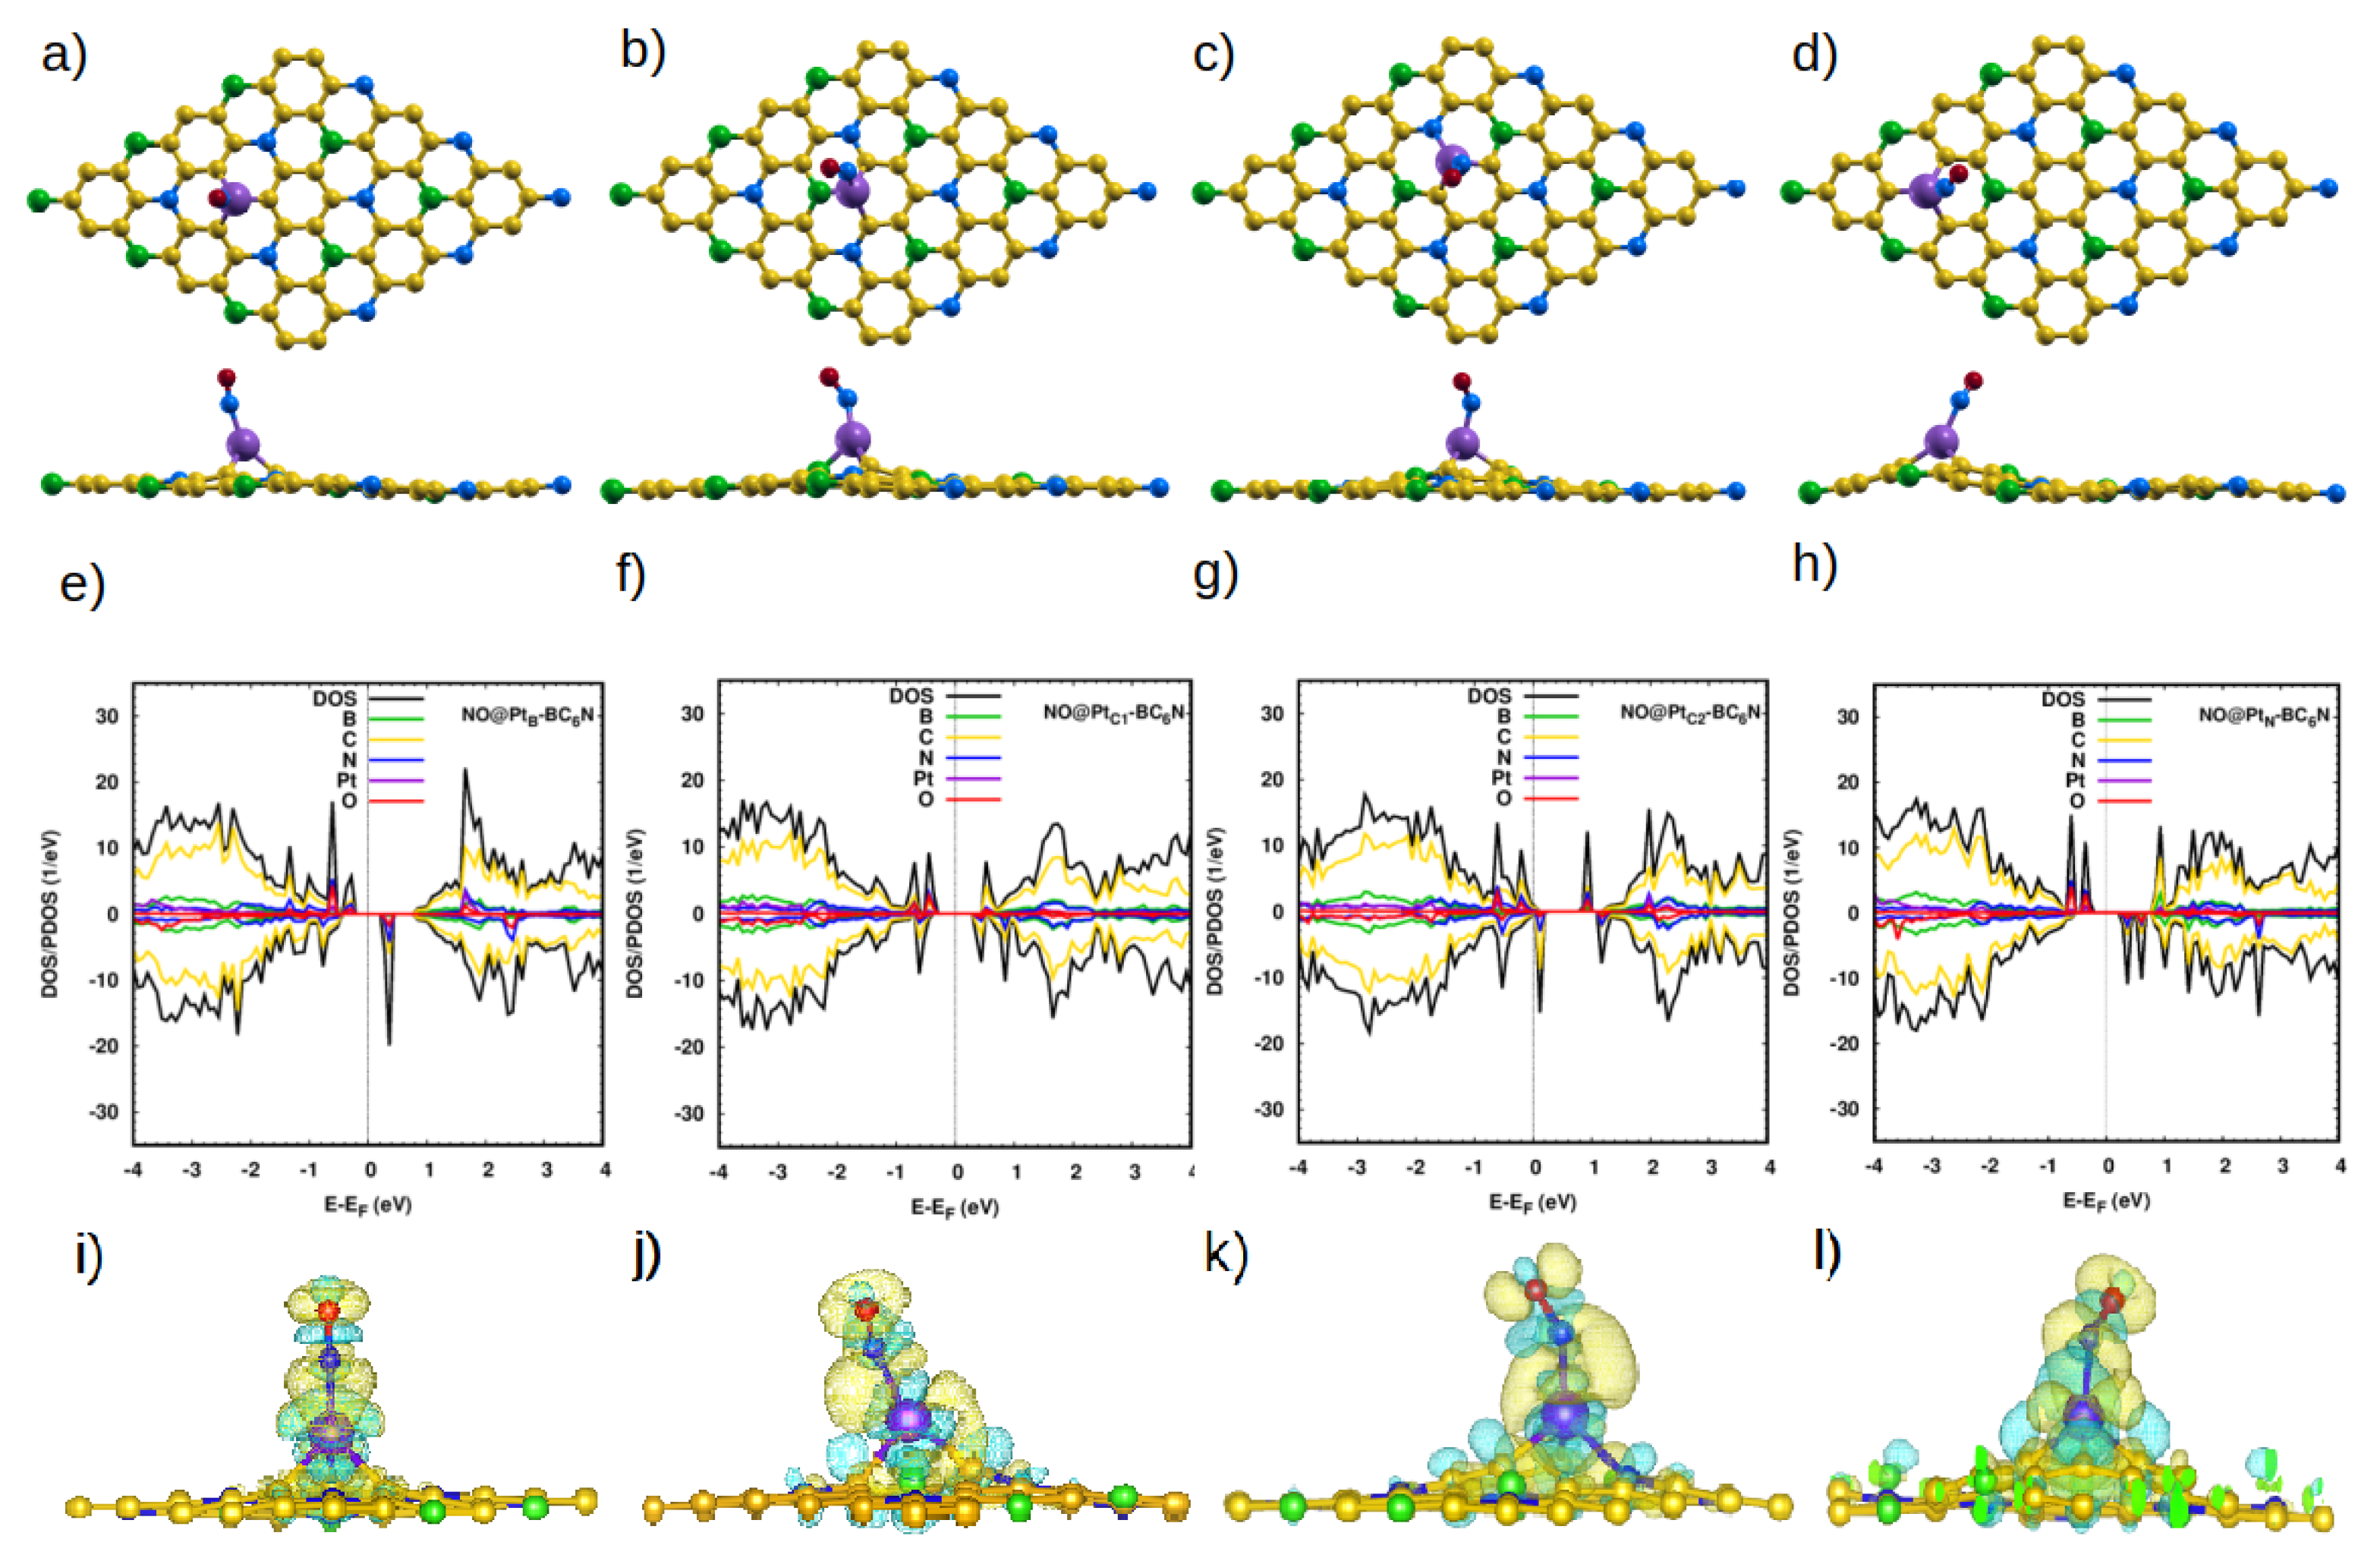
The situation is very different with the Pt-doped system. The closest distances between the N atom of the molecule and the Pt dopant atom are 1.93 Å, 1.90 Å, 1.87 Å, and 1.98 Å for NO@PtTB-, NO@PtTN-, NO@PtC1-, and NO@PtC2-BC6N, respectively. These are much smaller than the corresponding distances for the pristine system, indicating the much stronger interaction between the NO molecule and the doped sheet. Furthermore, the bond length of N-O increases to 1.198 Å for NO@PtB, NO@PtN and 1.2 Å for NO@PtC1, NO@PtC2. The adsorption energies are significantly higher: 2.65 eV, 2.27 eV, 2.27 eV, and 2.06 eV for PtB-, PtC1-, PtC2-, and PtN-BC6N sheets.
Figure 4e shows the DOS/PDOS of NO@PtB-BC6N. The top of the valence band is disturbed by the N and O states, such as for the spin-up component. Also, the mid-gap states are created at 0.4 eV by the N, O, and C states. The band gap becomes 1.1 eV (0.8 eV) for the spin-up (spin-down) component. The structure is a DMSC as PtB-BC6N, with a magnetic moment of 2 .
For adsorption atop the Pt at the C1 site, the valence and conduction bands of the structure are disturbed asymmetrically for the two spin components, leading to a DMSC with a magnetic moment of 1 (Figure 4f). The band gap of the spin-up/down component is 0.9 eV. The PC2-BC6N structure (Figure 4g) is a half metal, with a spin-down band gap of 0.2 eV and magnetic moment of 1 , which can be utilized for spintronic applications. Finally, adsorption on the PtN-BC6N system exhibits the highest structural deformation at the PtN site (Figure 4h), leading to a higher effect on the DOS compared to adsorption at other locations. The system has a magnetization of 2 and spin-up/down gaps of 1.2 eV/0.9 eV. Charge analysis and charge density maps (Figure 4i–l) indicate that charge is transferred from the sheet to the NO molecule, causing the polarization of the N atom of the gas to decrease, and that of the O atom to increase.
3.2.2. Adsorption of NO2
We now discuss our NO2 adsorption results (Figure 5). For the isolated molecule, the N-O bond length and the O-N-O angle are 1.21 Å and 134° [9]. Adsorption on the pristine sheet slightly changes the structure of the molecule; the bond length and the angle slightly change to 1.23 Å and 127° for adsorption on TB, TN, and H1, while the bond angle is about 128.6° for the H2 position. The molecule is very weakly adsorbed at all sites (0.1 eV), and it faces the sheet with an O atom at a distance of ∼2.92 Å for the TB, TN, and H1 sites (Table 3). At the H2 site, it is a bit closer (2.8 Å), with its N atom facing the sheet. A small amount of charge is transferred from the sheet to the molecule. Because of the weak adsorption of NO2 on the pristine system, its effect on the electronic properties of the sheet is minimal, but for the sake of completion, those results are reported in the Supplementary Information (Figure S1).
We now discuss our results for the adsorption of NO2 on the Pt-doped nanosheets. The N-O bond length is ∼1.21 Å for all systems. However, the O-N-O angle decreases to 112.3°, 123.3°, 124.8° and 111.8° for PtB-, PtC1-, PtC2- and PtN-BC6N, respectively. The change in the angle, such as for the cases of NO2@PtB- and NO2@PtN-BC6N reflects the strong interaction between the nitrogen dioxide molecule and the doped sheet. This is further confirmed by the shorter distance between the molecule and the Pt atom, as well as the charge transfer between the molecule and the sheets (∼0.35e, Table 3). The charge density maps (Figure 5i–l) show the distribution of the transferred charge around the NO2 molecule Therefore, the adsorption of NO2 is improved by Pt doping. As expected, the NO2@PtB- and NO2@PtN-BC6N have higher adsorption energy as compared to the other positions in the doped monolayer because of the maximal charge localization occurring at the B and N sites.
In Figure 5e–h, we show the effect of NO2 on the electronic properties of the sheets. Adsorption changes the state and the magnetic moment of Pt-BC6N, from DMSC to SC, for NO2@PtN with a band gap of 1.3 eV, from SC to metal for NO2@PtC1 and NO2@PtC2-BC6N, and from DMSC to SC with a band gap of 1.23 eV for NO2@PtB-BC6N. All the NO2@Pt-BC6N monolayers are nonmagnetic, except NO2@PtC1-BC6N, which shows a small magnetization (0.2 ).
3.2.3. Adsorption of CO2
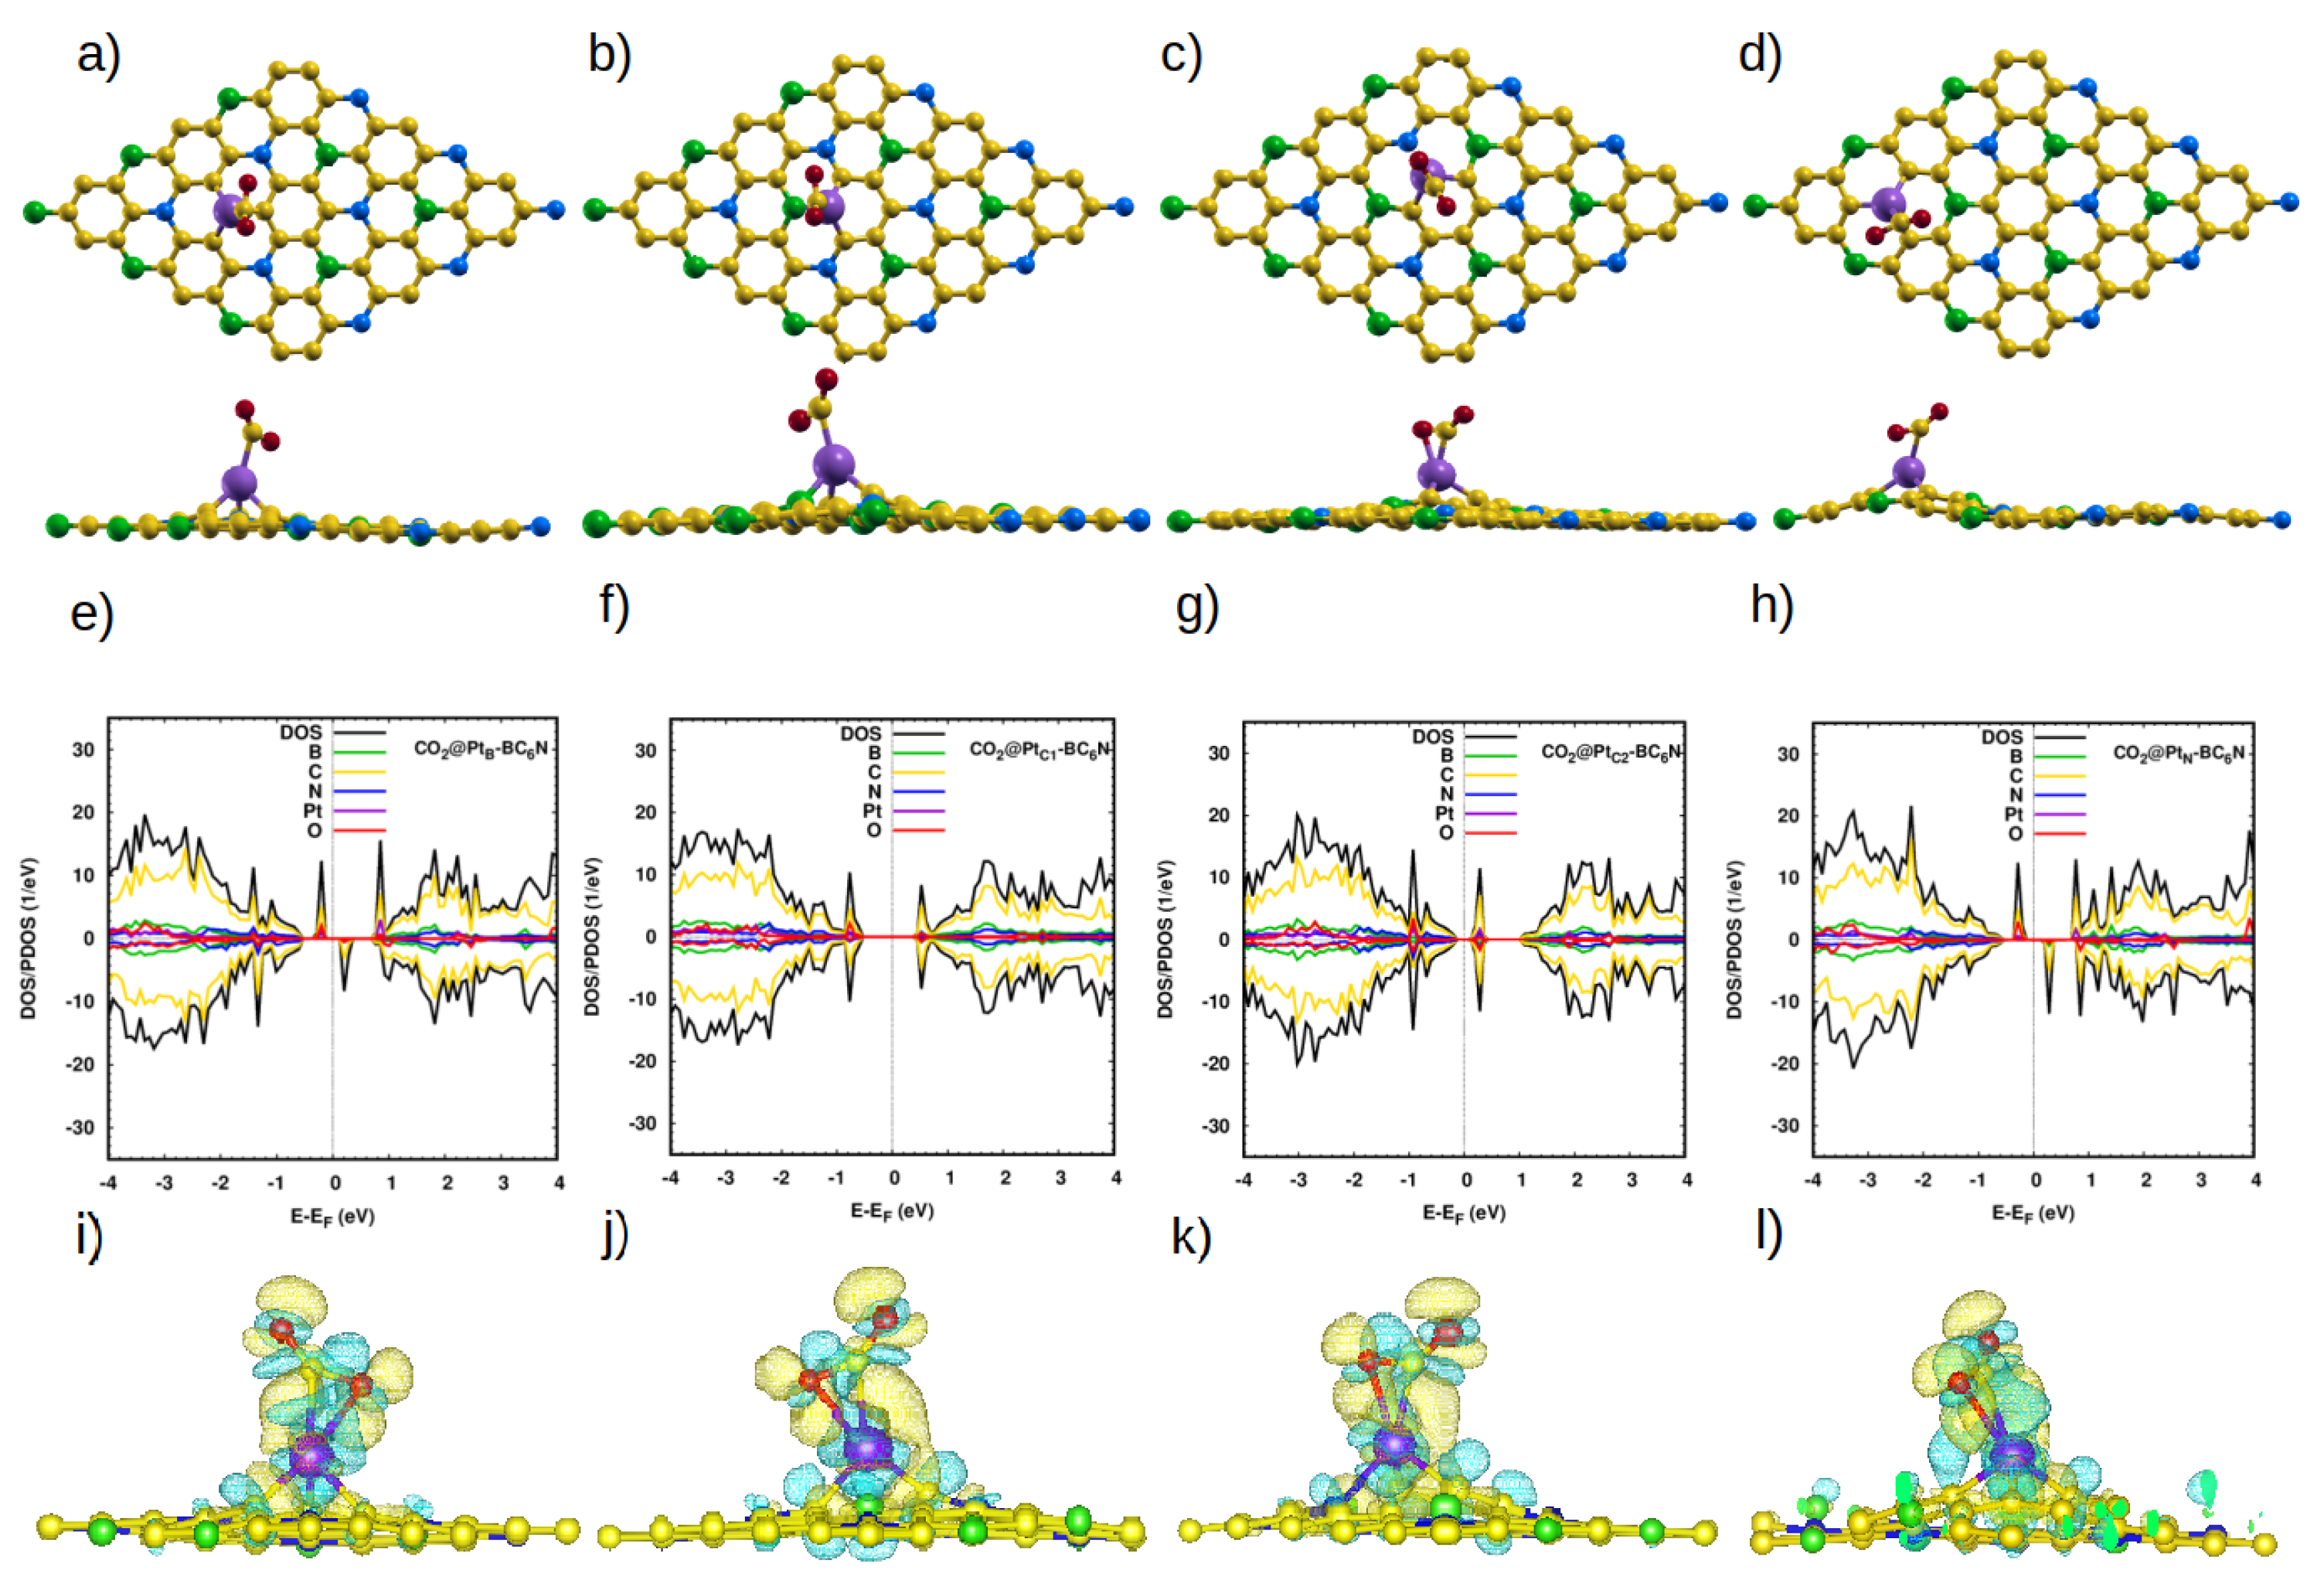
CO2 is the second triatomic molecule that we studied. At all considered locations, the average bond length and the O-C-O angle are nearly unchanged (1.17 Å, 179.3° [9]). The interaction with the sheet is weak (0.2 eV, see Table 4 and Figure S2, SI), which is reflected in the equilibrium distance from the sheet (∼3.2 Å), and the negligible charge transfer with the sheet (Table 4).
The picture with the Pt-doped system is quite different. The doped sheet adsorbs the CO2 molecule at a distance of ∼2.2 Å, and the O-C-O angle decreases significantly. The electronic structures of CO2@PtB- and CO2@PtN-BC6N are very similar. They are DMSCs with a magnetic moment of 1.0 ((Figure 6e,h), and with spin-up (down) band gaps of 1.0 eV (0.8 eV), and 1.0 eV (0.9 eV), for CO2@PtB- and CO2@PtN-BC6N, respectively. On the other hand, CO2@PtC1- and PtC2-BC6N are non-magnetic semiconductors, with a band gap of 1.1 eV and 0.4 eV, respectively, for both spin directions (Figure 6f,g). The charge transfer from the sheet to the molecule is higher than with the pristine system, and its distribution is shown in Figure 6i–l.
3.2.4. Adsorption of NH3
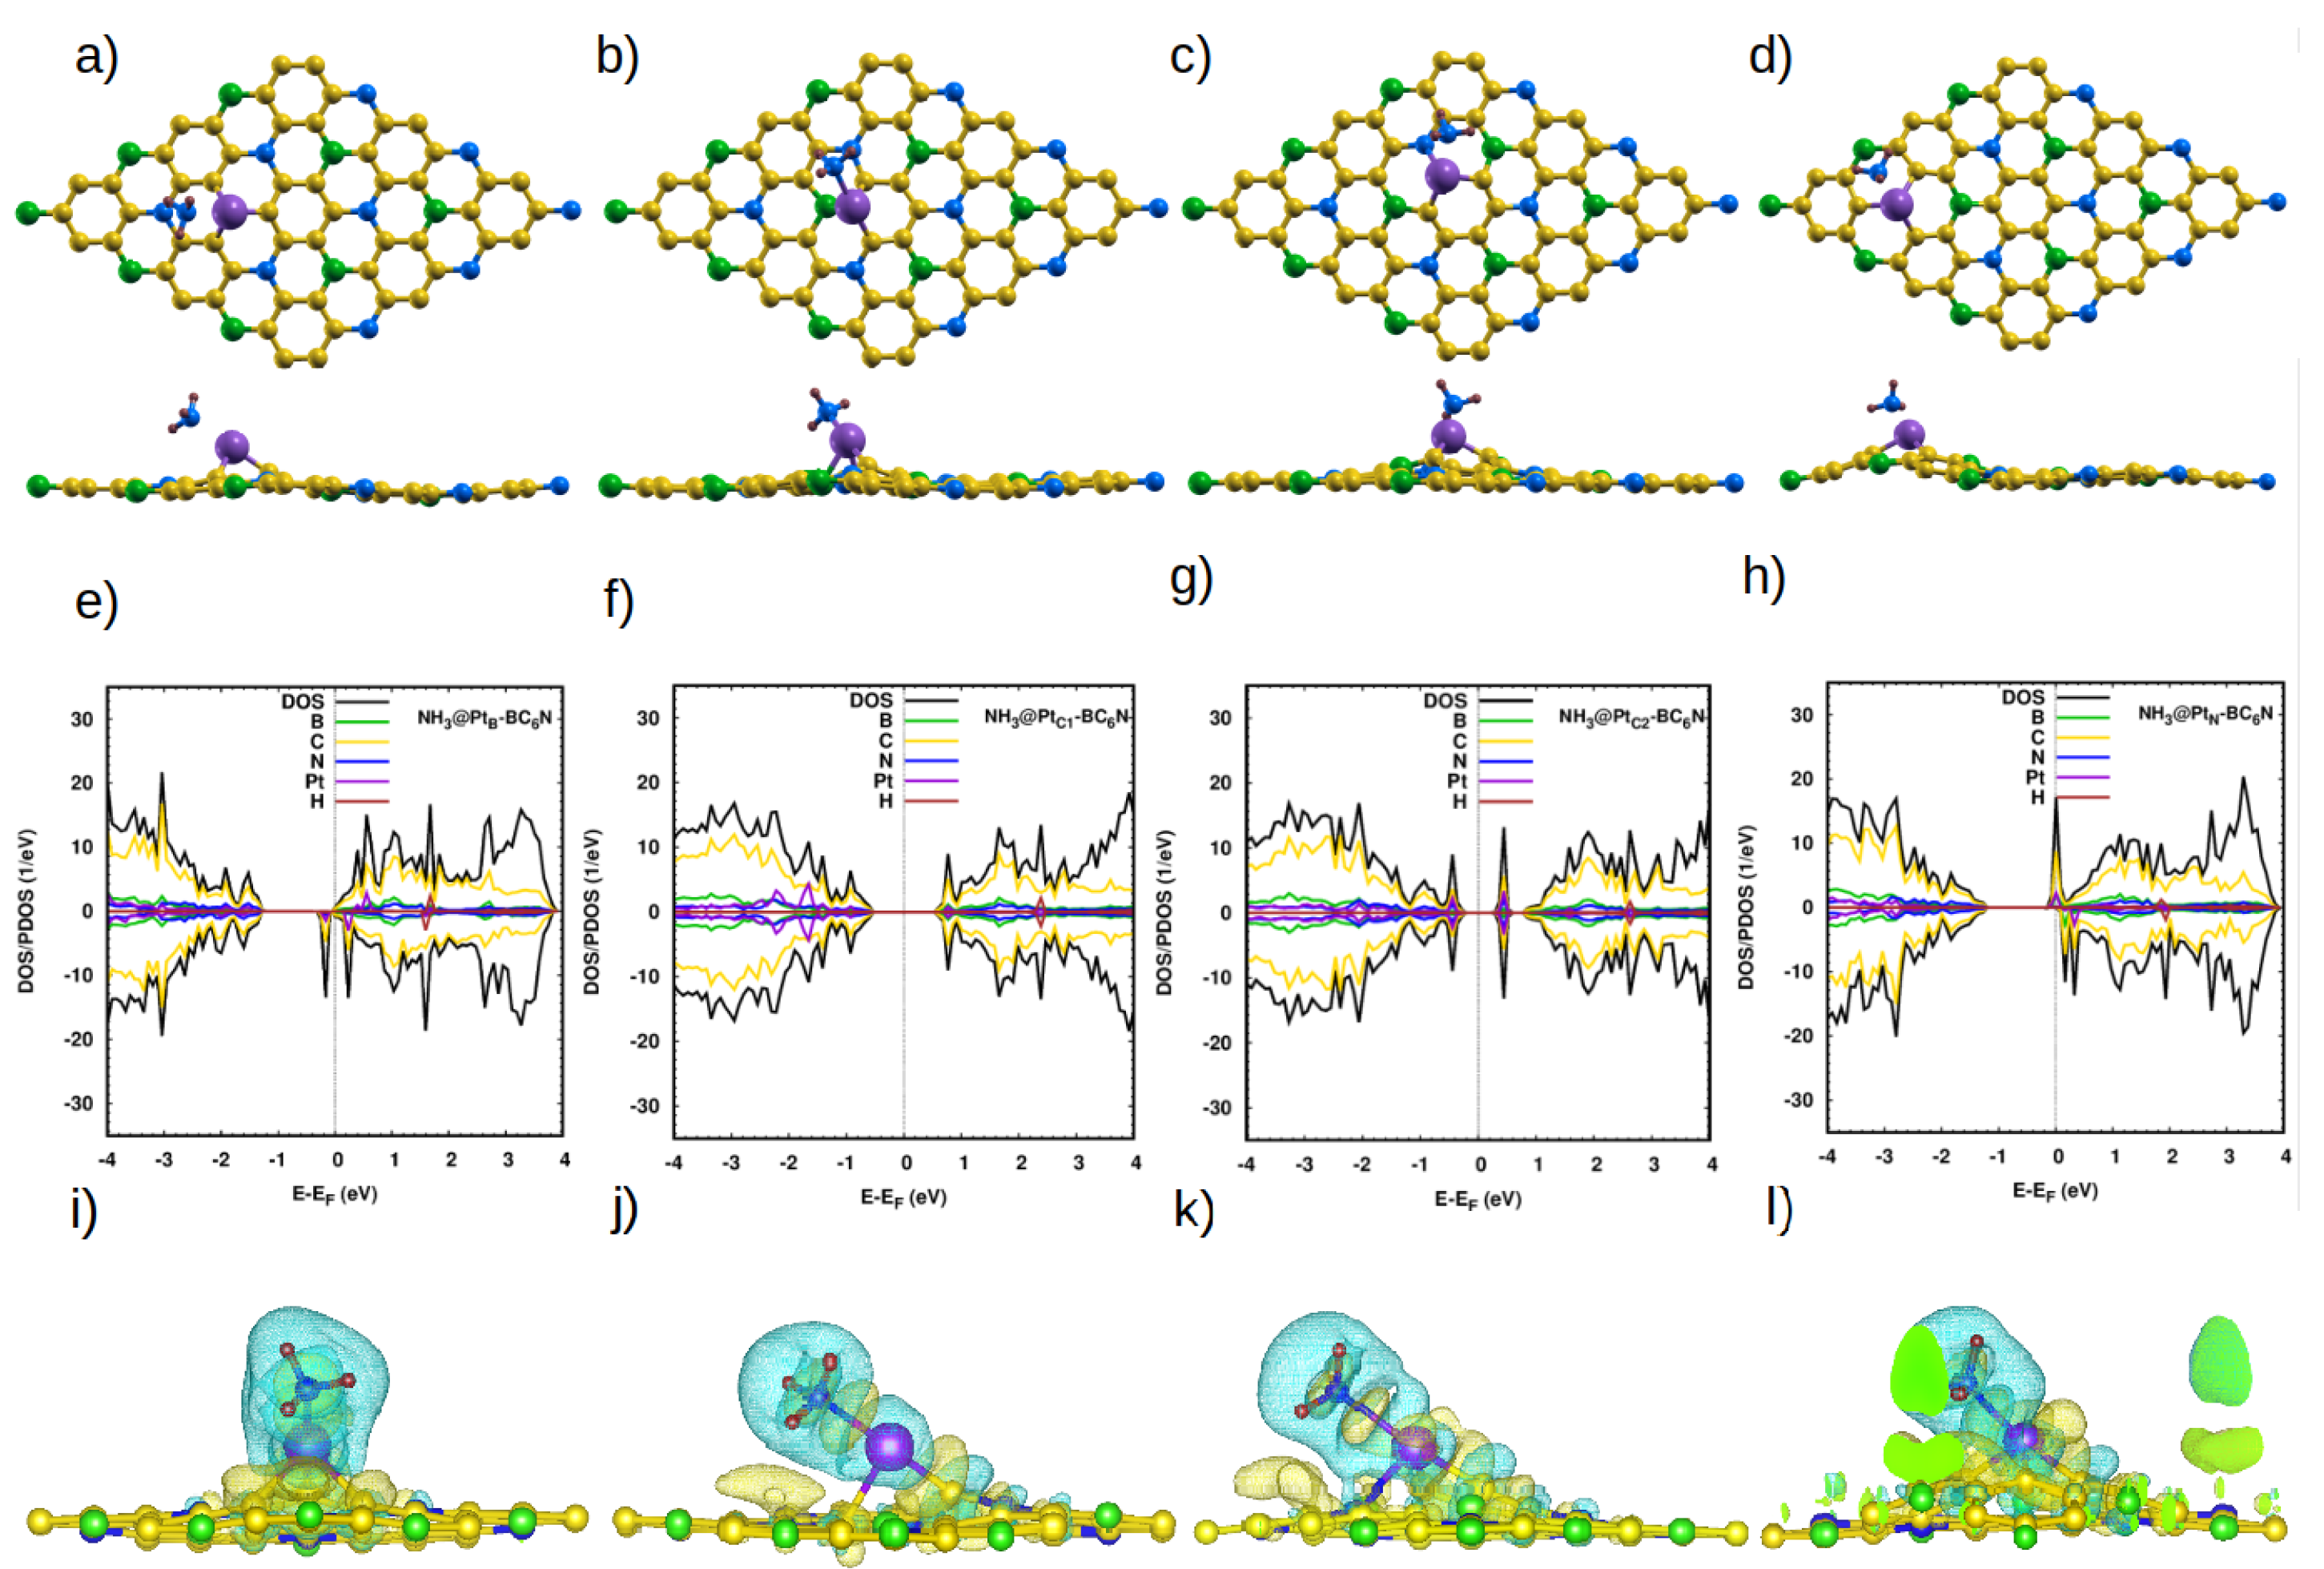
The last molecule in our study is NH3. On the pristine system, the bond length and H-N-H angle of the molecule (1.02 Å and 106.67° [9]) do not change, except for NH3@TBBC6N, where the angle is 102.2° (Figure S3). The optimized distance between the closest H atom of the molecule and the sheet is 2.7 Å (Table 5). There is very little charge transfer (<0.1e). Those values reflect the weakness of the interaction between the molecule and the pristine sheet. Indeed, we calculate an adsorption energy of ∼0.2 eV.
As with the other studied molecules, the Pt-doped system greatly enhances the adsorption of NH3 (Table 5). Also, the electronic properties become those of a DMSC with a spin-up (down) band gap of 1.3 eV (0.2 eV) for NH3@PtB-BC6N (Figure 7e–h). NH3@PtC1-BC6N and NH3@PtC2-BC6N are semiconductors with spin-up (down) band gaps of 1.1 eV and 0.7 eV. Finally, NH3@PtN-BC6N is a half-metal. Our charge analysis indicates that, contrary to three previous molecules, NH3 loses charge to the sheet in the four configurations. This is also illustrated in the charge density maps of Figure 7i–l.
Previous research has demonstrated that Pt-doped 2D materials indeed enhance molecular adsorption and sensing [41]. For example, CO and NO are found to chemisorb on Pt-doped MoS2 monolayers with adsorption energies of 1.38 eV and 1.21 eV, respectively [42]. Pt-doped monolayer WSe2 is shown to be suitable for the adsorption of CO2, NO2, and SO2 [43]. A monolayer of Pt-doped HfSe2 exhibits desirable adsorption behavior for SO2 and SOF2 [44]. Our results discussed are in line with previous findings. Computing the average adsorption energy of each gas on the different adsorption sites, one can assess the potential of the Pt-doped BC6N for gas filtration. As shown in Table 6, NO2, NO, and NH3 are chemisorbed on the Pt-doped systems, while CO2 is physisorbed. This suggests that our Pt-doped systems are suitable for the filtration of NO2, NO, and NH3, and to a lesser degree for CO2. We have also seen that the adsorption of NO2, NO, NH3, and CO2 leads to some changes in the band gaps of our Pt-doped systems, which may be utilized to develop sensors for those gases. Therefore, the Pt-doped BC6N systems studied in this work are good candidate materials for the filtration/sensing of NO2, NO, NH3, and CO2.
4. Conclusions
In this work, we use first principle calculations to investigate the structural, electronic, and magnetic properties of Pt-doped BC6N (Pt-BC6N). We also study the adsorption of four common gas molecules (NO, NO2, CO2, and NH3) on the pristine and doped structures. We consider the substitutional doping occurring at the four distinct sites in the BC6N lattice: the B, the N, and two distinct C sites. The formation energies of the doped structures indicate that they are stable. Upon Pt-doping, the BC6N acquires a magnetization of ∼1 for doping at the B and N sites, whereas systems doped at the two distinct C sites remain non-magnetic. The gaps of all doped systems change due to the Pt-doped states that are now located in the pristine gap. We also study the molecular adsorption properties of the doped structures using four gases: NO, NO2, CO2, and NH3, where the gas molecule is placed close to the Pt atom. Adsorption of NO, NO2, CO2, and NH3 is significantly enhanced on the doped structures. NO, NO2, and NH3 chemisorb with energies of ∼1.3–3 eV, while CO2 physisorb with 0.7 eV. The interaction between the gas molecules and the doped sheets results in some charge transfer. This turns the doped systems non-magnetic for NO2, CO2, and NH3, while it increases the magnetic moment for NO. The results of our study are important for applications of BC6N, which include spintronics, gas filtration, and molecular sensing.
Supplementary Materials
The following supporting information can be downloaded at: https://www.mdpi.com/article/10.3390/nano14090762/s1, Figure S1: PDOS of NO2 on the pristine system at different locations. Figure S2: PDOS of CO2 on the pristine system at different locations. Figure S3: PDOS of NH3 on the pristine system at different locations.
Author Contributions
Conceptualization, A.A.M.; data curation, N.M.A.; formal analysis, N.M.A. and H.M.A.-q.; investigation, N.M.A., M.M.F. and A.A.M.; methodology, A.A.M.; project administration, A.A.M.; resources, N.M.A., H.M.A.-q. and A.A.M.; software, N.M.A. and H.M.A.-q.; supervision, A.A.M.; validation, M.M.F.; visualization, N.M.A., M.M.F. and H.M.A.-q.; writing—original draft, N.M.A.; writing—review and editing, M.M.F., H.M.A.-q. and A.A.M. All authors have read and agreed to the published version of the manuscript.
Funding
This research received no external funding.
Data Availability Statement
The data presented in this study are available in article.
Acknowledgments
The authors would like to acknowledge the use of the resources of the Super-computing Laboratory at KAUST and the resources and technical services provided by the Scientific and High-Performance Computing Center at Imam Abdulrahman Bin Faisal University, Dammam, Saudi Arabia.
Conflicts of Interest
The authors declare no conflicts of interest.
References
- Bhimanapati, G.R.; Lin, Z.; Meunier, V.; Jung, Y.; Cha, J.; Das, S.; Xiao, D.; Son, Y.; Strano, M.S.; Cooper, V.R.; et al. Recent advances in two-dimensional materials beyond graphene. ACS Nano 2015, 9, 11509–11539. [Google Scholar] [CrossRef] [PubMed]
- Choi, W.; Lahiri, I.; Seelaboyina, R.; Kang, Y.S. Synthesis of graphene and its applications: A review. Crit. Rev. Solid State Mater. Sci. 2010, 35, 52–71. [Google Scholar] [CrossRef]
- Li, X.; Zhu, H. Two-dimensional MoS2: Properties, preparation, and applications. J. Mater. 2015, 1, 33–44. [Google Scholar] [CrossRef]
- Manzeli, S.; Ovchinnikov, D.; Pasquier, D.; Yazyev, O.V.; Kis, A. 2D transition metal dichalcogenides. Nat. Rev. Mater. 2017, 2, 17033. [Google Scholar] [CrossRef]
- Feng, J.W.; Liu, Y.J.; Wang, H.X.; Zhao, J.X.; Cai, Q.H.; Wang, X.Z. Gas adsorption on silicene: A theoretical study. Comput. Mater. Sci. 2014, 87, 218–226. [Google Scholar] [CrossRef]
- Liu, Y.; Liu, W.; Hou, J.; Dai, Y.; Yang, J. Coronoid nanographene C216 as hydrogen purification membrane: A density functional theory study. Carbon 2018, 135, 112–117. [Google Scholar] [CrossRef]
- Kumar, R.; Sahoo, S.; Joanni, E.; Singh, R.K.; Yadav, R.M.; Verma, R.K.; Singh, D.P.; Tan, W.K.; Perez del Pino, A.; Moshkalev, S.A.; et al. A review on synthesis of graphene, h-BN and MoS 2 for energy storage applications: Recent progress and perspectives. Nano Res. 2019, 12, 2655–2694. [Google Scholar] [CrossRef]
- Susarla, S.; Kutana, A.; Hachtel, J.A.; Kochat, V.; Apte, A.; Vajtai, R.; Idrobo, J.C.; Yakobson, B.I.; Tiwary, C.S.; Ajayan, P.M. Quaternary 2D transition metal dichalcogenides (TMDs) with tunable bandgap. Adv. Mater. 2017, 29, 1702457. [Google Scholar] [CrossRef] [PubMed]
- Yang, Q.; Wang, Y.; Li, X.; Li, H.; Wang, Z.; Tang, Z.; Ma, L.; Mo, F.; Zhi, C. Recent Progress of MX ene-Based Nanomaterials in Flexible Energy Storage and Electronic Devices. Energy Environ. Mater. 2018, 1, 183–195. [Google Scholar] [CrossRef]
- Salim, O.; Mahmoud, K.; Pant, K.; Joshi, R. Introduction to MXenes: Synthesis and characteristics. Mater. Today Chem. 2019, 14, 100191. [Google Scholar] [CrossRef]
- Hong, Y.L.; Liu, Z.; Wang, L.; Zhou, T.; Ma, W.; Xu, C.; Feng, S.; Chen, L.; Chen, M.L.; Sun, D.M.; et al. Chemical vapor deposition of layered two-dimensional MoSi2N4 materials. Science 2020, 369, 670. [Google Scholar] [CrossRef] [PubMed]
- Abbasi, A.; Sardroodi, J.J. The adsorption of sulfur trioxide and ozone molecules on stanene nanosheets investigated by DFT: Applications to gas sensor devices. Phys. E Low-Dimens. Syst. Nanostruct. 2019, 108, 382–390. [Google Scholar] [CrossRef]
- Zhu, J.; Zhang, H.; Tong, Y.; Zhao, L.; Zhang, Y.; Qiu, Y.; Lin, X. First-principles investigations of metal (V, Nb, Ta)-doped monolayer MoS2: Structural stability, electronic properties and adsorption of gas molecules. Appl. Surf. Sci. 2017, 419, 522–530. [Google Scholar] [CrossRef]
- Yadav, S.; Tam, J.; Singh, C.V. A first principles study of hydrogen storage on lithium decorated two dimensional carbon allotropes. Int. J. Hydrogen Energy 2015, 40, 6128–6136. [Google Scholar] [CrossRef]
- Fadlallah, M.M.; Abdelrahman, A.G.; Schwingenschlögl, U.; Maarouf, A.A. Graphene and graphene nanomesh supported nickel clusters: Electronic, magnetic, and hydrogen storage properties. Nanotechnology 2019, 30, 085709. [Google Scholar] [CrossRef]
- Donarelli, M.; Ottaviano, L. 2D materials for gas sensing applications: A review on graphene oxide, MoS2, WS2 and phosphorene. Sensors 2018, 18, 3638. [Google Scholar] [CrossRef]
- Wang, B.; Gu, Y.; Chen, L.; Ji, L.; Zhu, H.; Sun, Q. Gas sensing devices based on two-dimensional materials: A review. Nanotechnology 2022, 33, 252001. [Google Scholar] [CrossRef]
- Zhang, L.; Khan, K.; Zou, J.; Zhang, H.; Li, Y. Recent advances in emerging 2D material-based gas sensors: Potential in disease diagnosis. Adv. Mater. Interfaces 2019, 6, 1901329. [Google Scholar] [CrossRef]
- Rahimi, R.; Solimannejad, M. Hydrogen storage on pristine and Li-decorated BC6N monolayer from first-principles insights. Mol. Phys. 2021, 119, e1827177. [Google Scholar] [CrossRef]
- Bafekry, A.; Naseri, M.; Fadlallah, M.M.; Abdolhosseini Sarsari, I.; Faraji, M.; Bagheri Khatibani, A.; Ghergherehchi, M.; Gogova, D. A novel two-dimensional boron–carbon–nitride (BCN) monolayer: A first-principles insight. J. Appl. Phys. 2021, 130, 114301. [Google Scholar] [CrossRef]
- Lu, Y.; Yu, Y.; Zhu, X.; Wang, M. Two predicted two-dimensional BCN structures: A first-principles study. Phys. E Low-Dimens. Syst. Nanostruct. 2021, 125, 114413. [Google Scholar] [CrossRef]
- Bafekry, A.; Stampfl, C. Band-gap control of graphenelike borocarbonitride g-BC6N bilayers by electrical gating. Phys. Rev. B 2020, 102, 195411. [Google Scholar] [CrossRef]
- Rani, P.; Jindal, V. Designing band gap of graphene by B and N dopant atoms. RSC Adv. 2013, 3, 802–812. [Google Scholar] [CrossRef]
- Deng, X.; Wu, Y.; Dai, J.; Kang, D.; Zhang, D. Electronic structure tuning and band gap opening of graphene by hole/electron codoping. Phys. Lett. A 2011, 375, 3890–3894. [Google Scholar] [CrossRef]
- Kouvetakis, J.; Sasaki, T.; Shen, C.; Hagiwara, R.; Lerner, M.; Krishnan, K.; Bartlett, N. Novel aspects of graphite intercalation by fluorine and fluorides and new B/C, C/N and B/C/N materials based on the graphite network. Synth. Met. 1989, 34, 1–7. [Google Scholar] [CrossRef]
- Sadeghi, S.N.; Allaei, S.M.V.; Zebarjadi, M.; Esfarjani, K. Ultra-high lattice thermal conductivity and the effect of pressure in superhard hexagonal BC 2 N. J. Mater. Chem. C 2020, 8, 15705–15716. [Google Scholar] [CrossRef]
- Nehate, S.; Saikumar, A.; Prakash, A.; Sundaram, K. A review of boron carbon nitride thin films and progress in nanomaterials. Mater. Today Adv. 2020, 8, 100106. [Google Scholar] [CrossRef]
- Wang, J.; Chen, C.; Yang, C.; Fan, Y.; Liu, D.; Lei, W. Boron carbon nitride (BCN) nanomaterials: Structures, synthesis and energy applications. Curr. Graphene Sci. 2018, 2, 3–14. [Google Scholar] [CrossRef]
- Matsui, K.; Oda, S.; Yoshiura, K.; Nakajima, K.; Yasuda, N.; Hatakeyama, T. One-shot multiple borylation toward BN-doped nanographenes. J. Am. Chem. Soc. 2018, 140, 1195–1198. [Google Scholar] [CrossRef]
- Aghaei, S.; Aasi, A.; Farhangdoust, S.; Panchapakesan, B. Graphene-like BC6N nanosheets are potential candidates for detection of volatile organic compounds (VOCs) in human breath: A DFT study. Appl. Surf. Sci. 2021, 536, 147756. [Google Scholar] [CrossRef]
- Bafekry, A. Graphene-like BC6N single-layer: Tunable electronic and magnetic properties via thickness, gating, topological defects, and adatom/molecule. Phys. E Low-Dimens. Syst. Nanostruct. 2020, 118, 113850. [Google Scholar] [CrossRef]
- Li, Y.; Gu, Q.; Johannessen, B.; Zheng, Z.; Li, C.; Luo, Y.; Zhang, Z.; Zhang, Q.; Fan, H.; Luo, W.; et al. Synergistic Pt doping and phase conversion engineering in two-dimensional MoS2 for efficient hydrogen evolution. Nano Energy 2021, 84, 105898. [Google Scholar] [CrossRef]
- Deng, J.; Li, H.; Xiao, J.; Tu, Y.; Deng, D.; Yang, H.; Tian, H.; Li, J.; Ren, P.; Bao, X. Triggering the electrocatalytic hydrogen evolution activity of the inert two-dimensional MoS2 surface via single-atom metal doping. Energy Environ. Sci. 2015, 8, 1594–1601. [Google Scholar] [CrossRef]
- Wang, X.; Zeng, F.; Qiu, H.; Guo, X.; Yao, Q.; Li, L.; Tang, J. Adsorption study of SF6 molecules on Pt-doped two-dimensional material Ti3C2Tx Mxene. AIP Adv. 2023, 13, 085217. [Google Scholar] [CrossRef]
- Wu, P.; Huang, M. Investigation of adsorption behaviors, and electronic and magnetic properties for small gas molecules adsorbed on Pt-doped arsenene by density functional calculations. RSC Adv. 2023, 13, 3807–3817. [Google Scholar] [CrossRef]
- Giannozzi, P.; Baroni, S.; Bonini, N.; Calandra, M.; Car, R.; Cavazzoni, C.; Ceresoli, D.; Chiarotti, G.L.; Cococcioni, M.; Dabo, I.; et al. QUANTUM ESPRESSO: A modular and open-source software project for quantum simulations of materials. J. Phys. Condens. Matter 2009, 21, 395502. [Google Scholar] [CrossRef]
- Perdew, J.P.; Burke, K.; Ernzerhof, M. Generalized gradient approximation made simple. Phys. Rev. Lett. 1996, 77, 3865. [Google Scholar] [CrossRef]
- Dion, M.; Rydberg, H.; Schröder, E.; Langreth, D.C.; Lundqvist, B.I. Van der Waals density functional for general geometries. Phys. Rev. Lett. 2004, 92, 246401. [Google Scholar] [CrossRef]
- Aasi, A.; Mehdi Aghaei, S.; Panchapakesan, B. Outstanding performance of transition-metal-decorated single-layer graphene-like BC6N nanosheets for disease biomarker detection in human breath. ACS Omega 2021, 6, 4696–4707. [Google Scholar] [CrossRef] [PubMed]
- Babar, V.; Sharma, S.; Schwingenschlögl, U. Gas sensing performance of pristine and monovacant C6BN monolayers evaluated by density functional theory and the nonequilibrium green’s function formalism. J. Phys. Chem. C 2020, 124, 5853–5860. [Google Scholar] [CrossRef]
- Degler, D.; Pereira de Carvalho, H.W.; Kvashnina, K.; Grunwaldt, J.D.; Weimar, U.; Barsan, N. Structure and chemistry of surface-doped Pt:SnO2 gas sensing materials. RSC Adv. 2016, 6, 28149–28155. [Google Scholar] [CrossRef]
- Ma, D.; Ju, W.; Li, T.; Zhang, X.; He, C.; Ma, B.; Lu, Z.; Yang, Z. The adsorption of CO and NO on the MoS2 monolayer doped with Au, Pt, Pd, or Ni: A first-principles study. Appl. Surf. Sci. 2016, 383, 98–105. [Google Scholar] [CrossRef]
- Ni, J.; Wang, W.; Quintana, M.; Jia, F.; Song, S. Adsorption of small gas molecules on strained monolayer WSe2 doped with Pd, Ag, Au, and Pt: A computational investigation. Appl. Surf. Sci. 2020, 514, 145911. [Google Scholar] [CrossRef]
- Cui, H.; Zhu, H.; Jia, P. Adsorption and sensing of SO2 and SOF2 molecule by Pt-doped HfSe2 monolayer: A first-principles study. Appl. Surf. Sci. 2020, 530, 147242. [Google Scholar] [CrossRef]
Figure 1.
(a) Top and side view of the optimized atomic structure of a pristine hexagonal 3 × 3 supercell of a BC6N sheet. The black parallelogram marks the original unit cell of BC6N. Yellow, green, and blue spheres represent C, B, and N atoms, respectively. Bond lengths are given in Å. The numbers “1” (top on N (TN)), “2” (top on B (TB)), “3” (top on BNC hexagonal (H1)), and “4” (top on C hexagonal (H2)) indicate the adsorption sites of gases on the BC6N, whereas the circles refer to the doping sites where the systems are doped with a Pt atom. (b) Projected DOS (PDOS) of the pristine BC6N system showing the most significant contributions.

Figure 2.
(a–d) Top and side view of the optimized atomic structure of Pt-BC6N sheet with different doping sites, PtB, PtC1, PtC2, and PtN, respectively. The purple sphere represents the Pt atom. (e–h) The corresponding DOS/projected DOS (PDOS) of the Pt-BC6N system shows the most significant contributions. (i–l) The corresponding band structure, from −2 eV to 2 eV. Spin-up (down) is in blue (red).

Figure 3.
Top and side view of the optimized atomic structure of NO@BC6N sheet with different doping sites: (a) NO@BBC6N, (b) NO@NBC6N, (c) NO@H1BC6N and (d) NO@H2BC6N. (e–h) The corresponding DOS/projected DOS (PDOS) of the NO@BC6N systems. The red spheres represent O atoms.
Figure 3.
Top and side view of the optimized atomic structure of NO@BC6N sheet with different doping sites: (a) NO@BBC6N, (b) NO@NBC6N, (c) NO@H1BC6N and (d) NO@H2BC6N. (e–h) The corresponding DOS/projected DOS (PDOS) of the NO@BC6N systems. The red spheres represent O atoms.

Figure 4.
(a–d) Top and side view of the optimized atomic structure of NO@Pt-BC6N sheet with different doping sites: (a) NO@PtB-BC6N, (b) NO@PtC1-BC6N, (c) NO@PtC2-BC6N, and (d) NO@PtN-BC6N. (e–h) The corresponding DOS/projected DOS (PDOS) and (i–l) the corresponding charge densities of the NO@Pt-BC6N systems. Isosurface yellow (blue) color represents higher (lower) charge density.

Figure 5.
(a–d) Top and side view of the optimized atomic structure of NO2@Pt-BC6N sheet with different doping sites: (a) NO2@PtB-BC6N, (b) NO2@PtC1-BC6N, (c) NO2@PtC2-BC6N, and (d) NO2@PtN-BC6N. (e–h) The corresponding DOS/projected DOS (PDOS) and (i–l) the corresponding charge densities of the NO2@Pt-BC6N systems. Isosurface yellow (blue) color represents higher (lower) charge density.

Figure 6.
(a–d) Top and side view of the optimized atomic structure of CO2@Pt-BC6N sheet with different doping sites: (a) CO2@PtB-BC6N, (b) CO2@PtC1-BC6N, (c) CO2@PtC2-BC6N, and (d) CO2@PtN-BC6N. (e–h) The corresponding DOS/projected DOS (PDOS) of the CO2@Pt-BC6N systems. (i–l) The corresponding charge density. Isosurface yellow (blue) color represents higher (lower) charge density.

Figure 7.
(a–d) Top and side view of the optimized atomic structure of NH3@Pt-BC6N sheet with different doping sites: (a) NH3@PtB-BC6N, (b) NH3@PtC1-BC6N, (c) NH3@PtC2-BC6N, and (d) NH3@PtN-BC6N. (e–h) The corresponding DOS/projected DOS (PDOS) and (i–l) the corresponding charge densities of the NH3@Pt-BC6N systems. Isosurface yellow (blue) color represents higher (lower) charge density. In (l), the isosurface extends to the supercell border, and the green color indicates the interior of the isosurface.


Table 1.
Pt-BC6N: the charge transfer ( (e)), formation energy ( (meV)), magnetization (Mag ()), band gap (Eg (eV)).
Table 1.
Pt-BC6N: the charge transfer ( (e)), formation energy ( (meV)), magnetization (Mag ()), band gap (Eg (eV)).
| Systems | Mag | (up) | (dn) | ||
|---|---|---|---|---|---|
| BC6N | - | - | 0.0 | 1.3 | 1.3 |
| PtB-BC6N | 0.08 | 87 | 0.9 | 0.2 | 1.3 |
| PtC1-BC6N | 0.10 | 88 | 0.0 | 1.1 | 1.1 |
| PtC2-BC6N | 0.43 | 94 | 0.0 | 0.5 | 0.5 |
| PtN-BC6N | 0.39 | 51 | 1.0 | 0.2 | 1.4 |
Table 2.
NO adsorption NO pristine and Pt-BC6N: the closest distance (d (Å)), nearest atom (X), charge transfer ( (e)), adsorption energy ( (eV)), magnetization (Mag ()), band gap ( (eV)).
Table 2.
NO adsorption NO pristine and Pt-BC6N: the closest distance (d (Å)), nearest atom (X), charge transfer ( (e)), adsorption energy ( (eV)), magnetization (Mag ()), band gap ( (eV)).
| Systems | d | X | Mag | (up) | (dn) | ||
|---|---|---|---|---|---|---|---|
| @TBBC6N | 2.8 | N | −0.04 | 0.2 | 1.0 | 0.4 | 1.1 |
| @TNBC6N | 3.1 | N | 0.00 | 0.1 | 1.0 | 1.1 | 0.4 |
| @H1BC6N | 3.1 | N | −0.04 | 0.1 | 1.0 | 0.3 | 1.2 |
| @H2BC6N | 2.9 | N | −0.05 | 0.2 | 1.0 | 0.5 | 1.3 |
| @PtB-BC6N | 1.9 | N | −0.20 | 2.7 | 2.1 | 1.1 | 0.8 |
| @PtC1-BC6N | 1.9 | N | −0.21 | 2.3 | 1.0 | 0.9 | 0.9 |
| @PtC2-BC6N | 1.9 | N | −0.15 | 2.3 | 0.7 | 0.2 | - |
| @PtN-BC6N | 2.0 | N | −0.20 | 2.1 | 2.1 | 1.2 | 0.9 |
Table 3.
NO2 adsorption on pristine and PtBC6N: the closest distance (d (Å)), O-N-O angle (), nearest atom (X), charge transfer ( (e)), adsorption energy ( (eV)), magnetization (Mag ()), and band gap ( (up) and down (dn) (eV)).
Table 3.
NO2 adsorption on pristine and PtBC6N: the closest distance (d (Å)), O-N-O angle (), nearest atom (X), charge transfer ( (e)), adsorption energy ( (eV)), magnetization (Mag ()), and band gap ( (up) and down (dn) (eV)).
| Systems | d | X | Mag | (up) | (dn) | |||
|---|---|---|---|---|---|---|---|---|
| @TBBC6N | 2.9 | 126.7 | O | −0.07 | 0.1 | 0.9 | 1.4 | - |
| @TNBC6N | 3.0 | 126.9 | O | −0.16 | 0.1 | 0.9 | 1.4 | - |
| @H1BC6N | 3.0 | 126.9 | O | −0.08 | 0.1 | −0.9 | - | 1.3 |
| @H2BC6N | 2.8 | 128.6 | N | −0.11 | 0.1 | 0.9 | 0.3 | 1.3 |
| @PtB-BC6N | 2.0 | 112.3 | O | −0.43 | 3.0 | 0.0 | 1.3 | 1.3 |
| @PtC1-BC6N | 2.1 | 123.3 | N | −0.34 | 2.5 | 0.2 | - | - |
| @PtC2-BC6N | 2.0 | 124.8 | N | −0.30 | 2.5 | 0.0 | - | - |
| @PtN-BC6N | 2.3 | 111.8 | O | −0.41 | 3.3 | 0.0 | 1.2 | 1.2 |
Table 4.
CO2 adsorption on pristine and Pt-BC6N: The closest distance (d (Å)), O-C-O angle (), nearest atom (X), charge transfer ( (e)), adsorption energy ( (eV)), magnetization (Mag ()), and band gap ( (up) and down (dn) (eV)).
Table 4.
CO2 adsorption on pristine and Pt-BC6N: The closest distance (d (Å)), O-C-O angle (), nearest atom (X), charge transfer ( (e)), adsorption energy ( (eV)), magnetization (Mag ()), and band gap ( (up) and down (dn) (eV)).
| Systems | d | X | Mag | (up) | (dn) | |||
|---|---|---|---|---|---|---|---|---|
| @TBBC6N | 3.3 | 179.3 | C | −0.02 | 0.2 | 0.0 | 1.3 | 1.3 |
| @TNBC6N | 3.2 | 179.8 | C | −0.01 | 0.2 | 0.0 | 1.3 | 1.3 |
| @H1BC6N | 3.2 | 179.3 | C | −0.02 | 0.2 | 0.0 | 1.3 | 1.3 |
| @H2BC6N | 3.2 | 179.3 | C | −0.02 | 0.2 | 0.0 | 1.3 | 1.3 |
| @PtB-BC6N | 2.2 | 144.0 | C | −0.38 | 0.7 | 1.0 | 1.0 | 0.8 |
| @PtC1-BC6N | 2.1 | 141.5 | C | −0.42 | 0.8 | 0.0 | 1.1 | 1.1 |
| @PtC2-BC6N | 2.1 | 141.0 | C | −0.42 | 0.6 | 0.0 | 0.4 | 0.4 |
| @PtN-BC6N | 2.2 | 146.4 | C | −0.33 | 0.4 | 1.0 | 1.0 | 0.9 |
Table 5.
NH3 adsorption on pristine and Pt-BC6N: the closest distance (d (Å)), H-N-H angle (), nearest atom (X), charge transfer ( (e)), adsorption energy ( (eV)), magnetization (Mag ()), and band gap ( (up) and down (dn) (eV)).
Table 5.
NH3 adsorption on pristine and Pt-BC6N: the closest distance (d (Å)), H-N-H angle (), nearest atom (X), charge transfer ( (e)), adsorption energy ( (eV)), magnetization (Mag ()), and band gap ( (up) and down (dn) (eV)).
| Systems | d | X | Mag | (up) | (dn) | |||
|---|---|---|---|---|---|---|---|---|
| @TBBC6N | 2.7 | 102.2 | H | −0.01 | 0.2 | 0.0 | 1.3 | 1.3 |
| @TNBC6N | 2.7 | 106.4 | H | −0.01 | 0.2 | 0.0 | 1.3 | 1.3 |
| @H1BC6N | 2.7 | 106.2 | H | −0.01 | 0.2 | 0.0 | 1.3 | 1.3 |
| @H2BC6N | 2.8 | 106.2 | H | −0.01 | 0.2 | 0.0 | 1.3 | 1.3 |
| @PtB-BC6N | 2.2 | 107.3 | N | 0.22 | 1.5 | −0.9 | 1.3 | 0.2 |
| @PtC1-BC6N | 2.2 | 107.1 | N | 0.23 | 1.6 | 0.0 | 1.1 | 1.1 |
| @PtC2-BC6N | 2.3 | 107.3 | N | 0.21 | 1.3 | 0.0 | 0.7 | 0.7 |
| @PtN-BC6N | 2.3 | 106.9 | N | 0.22 | 1.2 | 0.9 | - | 1.4 |
Table 6.
Average adsorption energies ( (eV)) on the Pt-doped systems. The average is taken over the 4 different adsorption sites in each system.
Table 6.
Average adsorption energies ( (eV)) on the Pt-doped systems. The average is taken over the 4 different adsorption sites in each system.
| Gas | |
|---|---|
| NO2 | 2.8 |
| NO | 2.4 |
| NH3 | 1.4 |
| CO2 | 0.6 |
Disclaimer/Publisher’s Note: The statements, opinions and data contained in all publications are solely those of the individual author(s) and contributor(s) and not of MDPI and/or the editor(s). MDPI and/or the editor(s) disclaim responsibility for any injury to people or property resulting from any ideas, methods, instructions or products referred to in the content. |
© 2024 by the authors. Licensee MDPI, Basel, Switzerland. This article is an open access article distributed under the terms and conditions of the Creative Commons Attribution (CC BY) license (https://creativecommons.org/licenses/by/4.0/).
Share and Cite
MDPI and ACS Style
Alghamdi, N.M.; Fadlallah, M.M.; Al-qahtani, H.M.; Maarouf, A.A. Electronic and Molecular Adsorption Properties of Pt-Doped BC6N: An Ab-Initio Investigation. Nanomaterials 2024, 14, 762. https://doi.org/10.3390/nano14090762
AMA Style
Alghamdi NM, Fadlallah MM, Al-qahtani HM, Maarouf AA. Electronic and Molecular Adsorption Properties of Pt-Doped BC6N: An Ab-Initio Investigation. Nanomaterials. 2024; 14(9):762. https://doi.org/10.3390/nano14090762
Chicago/Turabian StyleAlghamdi, Nada M., Mohamed M. Fadlallah, Hind M. Al-qahtani, and Ahmed A. Maarouf. 2024. "Electronic and Molecular Adsorption Properties of Pt-Doped BC6N: An Ab-Initio Investigation" Nanomaterials 14, no. 9: 762. https://doi.org/10.3390/nano14090762
Note that from the first issue of 2016, this journal uses article numbers instead of page numbers. See further details here.