
Modeling In Vivo Interactions of Engineered Nanoparticles in the Pulmonary Alveolar Lining Fluid

Abstract
:
1. Introduction
1.1. ENM Interactions in Alveolar Lining Fluid

| Lipid Species | Percentage composition * | Molecular weight (kDa) ** |
|---|---|---|
| Phosphatidylcholine (PC) | 78 | 760.076 |
| Phosphatidylethanolamine (PE) | 3 | 471.609 |
| Phosphatidylserine (PS) | 5 | 547.17 |
| Phosphatidylglycerol (PG) | 7 | 787.383 |
| Sphingomyelin (SM) | 2 | 646.505 |
| Cholesterol (CL) | 5 | 400.637 |
1.2. Multiscale Toxicodynamics
2. Methods
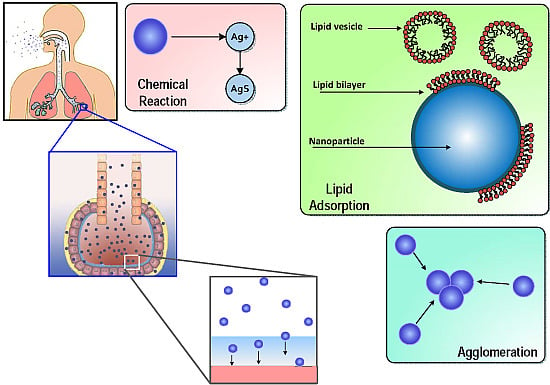
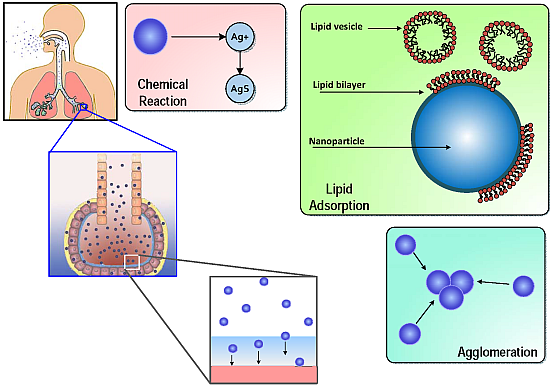
- A concentrated layer of pulmonary surfactant, comprising mainly large aggregates of phospholipids (PL) responsible for reducing surface tension at the air-liquid interface;
- A layer of alveolar fluid, which is essentially a mixture of PL (both large and small aggregates), surfactant proteins (SP) and other lipids in an aqueous solution;
- A cellular layer comprising alveolar Type I and Type II cells along with alveolar macrophages with tight junctions between them;
- A basement membrane followed by capillary endothelial cells marking the entrance to the systemic circulation.
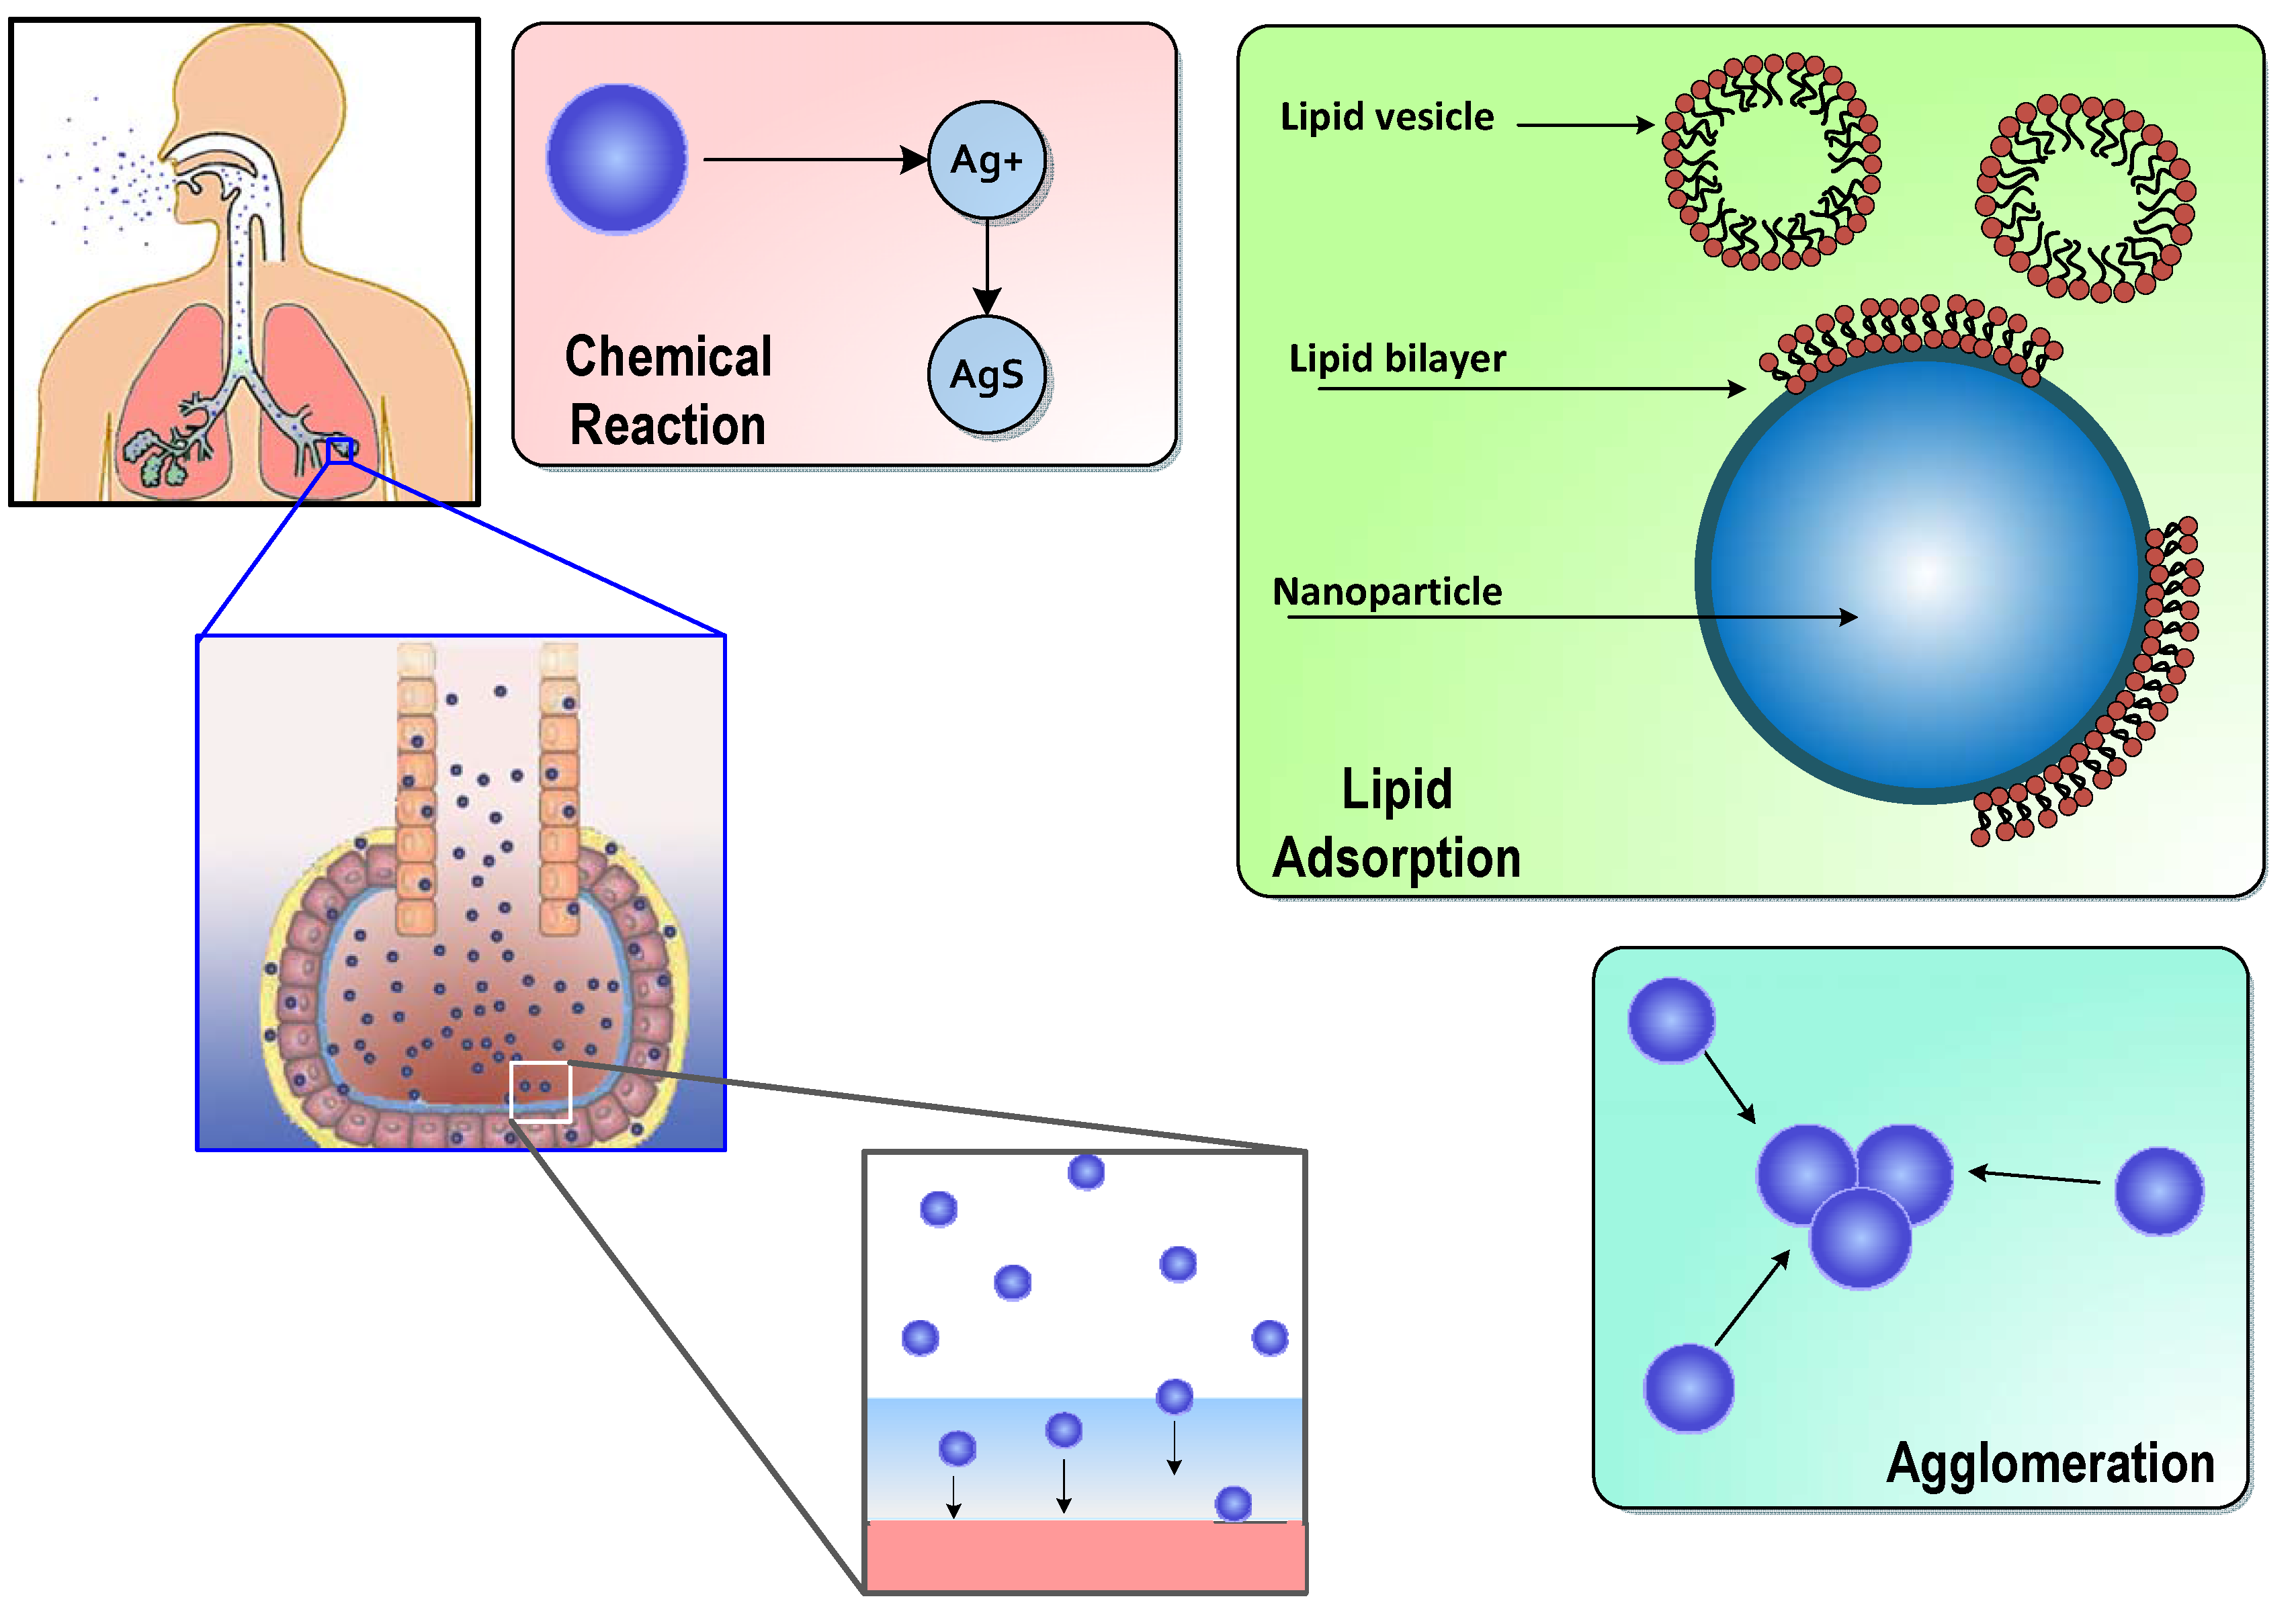
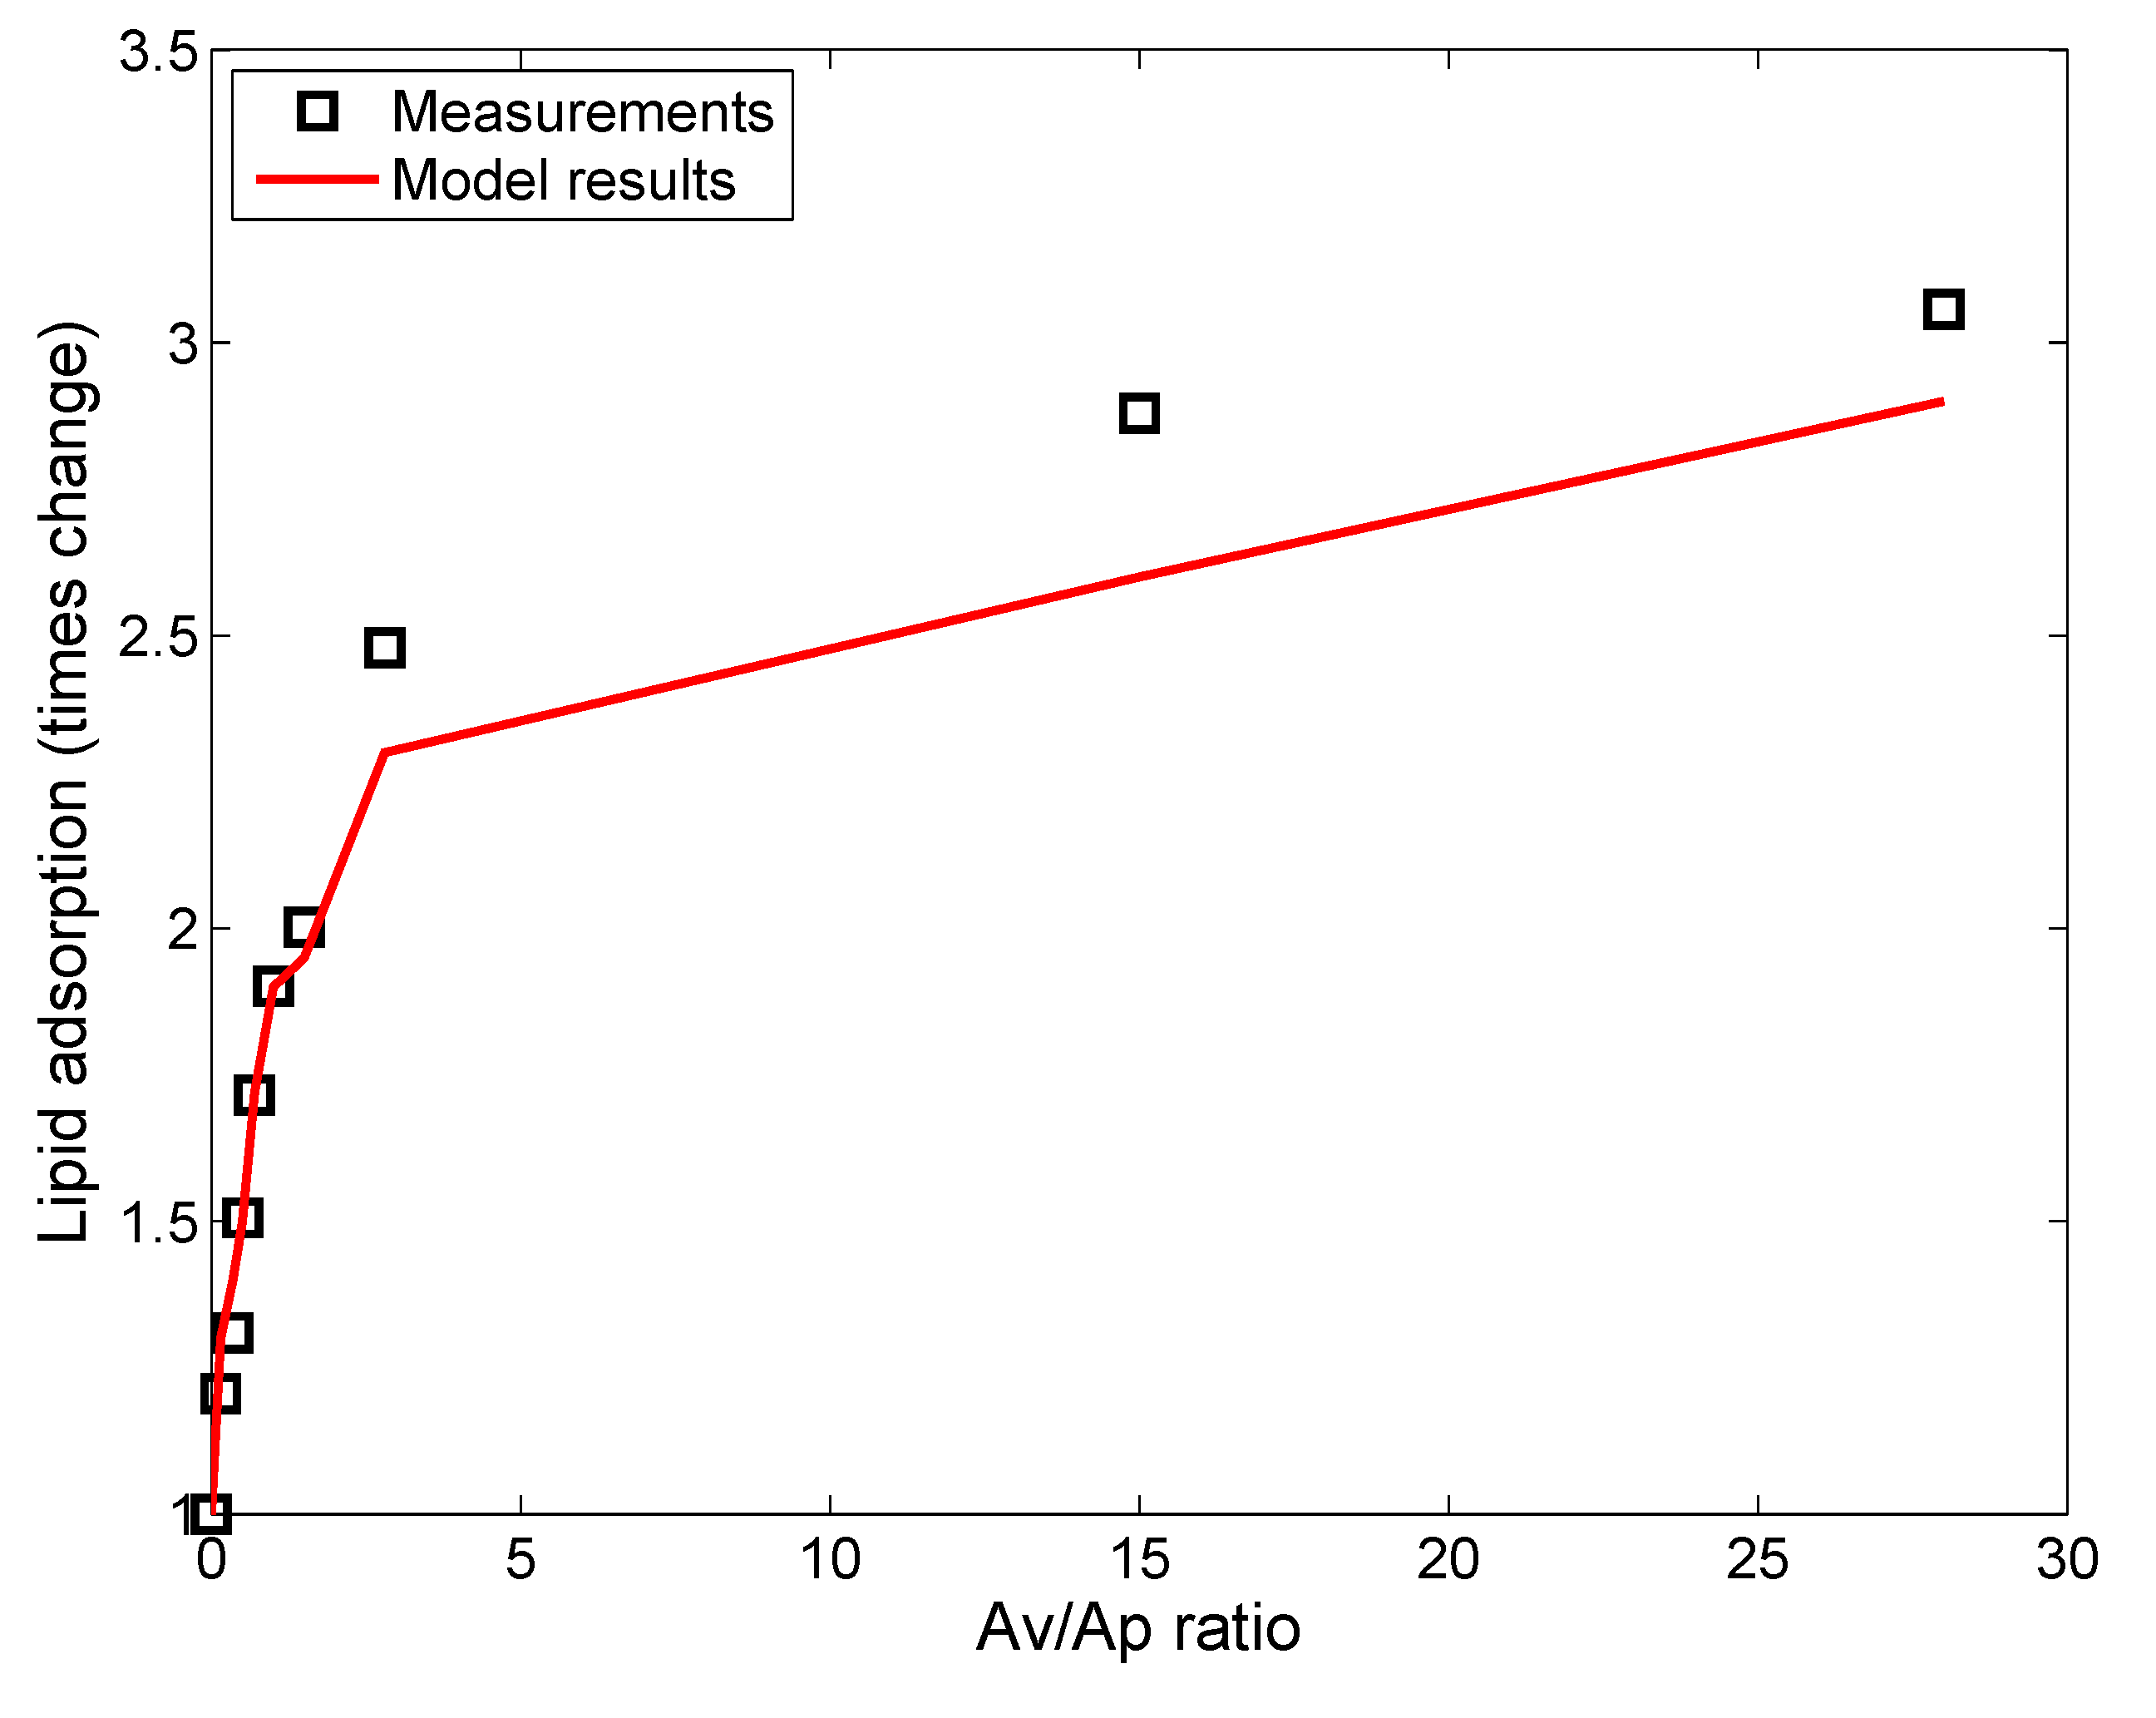
2.1. Surfactant Lipid Adsorption on ENMs
Monte Carlo Simulation of Lipid Vesicle Adsorption
- A random ENM is selected from the population in the control volume (CV);
- A random lipid vesicle is selected based on the size distribution of vesicles;
- is calculated, such that if the selected ENM has zero exposed surface area, then ; else is given by Equation (1);
- A random number p is generated between 0 and 1;
- Adsorption is considered successful if ;
- If adsorption is successful, the relevant properties of the particular ENM are updated with the changed and mass;
- If the maximum number of adsorption steps has not been reached, then the steps are repeated from Step (1).
| Property | Value | Reference |
|---|---|---|
| BALF density | 1.04 g/mL | Shelley, 1975 [40] (study based on male New Zealand rabbits) |
| Lipid conc. | 328 μg/mL | Shelley, 1975 [40] (study based on male New Zealand rabbits) |
| Protein conc. | 212 μg/mL | Shelley, 1975 [40] (study based on male New Zealand rabbits) |
| BALF vol. | 10 mL/kg | Meyer et al. [41] (study based on young humans) |
| PL density | 1.108 g/mL | Woodka et al. [42] (based on DPPC) |
| Ionic strength | 245 mM | Song et al. [43] (study based on 6–8 week CD1 mice) |
| pH | 7.28 | Song et al. [43] (study based on 6–8 week CD1 mice) |
| Viscosity | 8.79 × 10 kg/(m·s) | Stroumpoulis et al. [37] (based on DMPC solution) |
| Thickness | 0.2 μm | Bastacky et al. [44] (based on DMPC solution) |
2.2. Surfactant Protein Adsorption on ENMs
| Protein | MW (kDa) * | Length (nm) * | Dia. (nm) * | Density (g/cm) | Conc. (μg/mL) ** | D (10 m/s) |
|---|---|---|---|---|---|---|
| SP-A | 32 | 20 | 20 | 1.41 | 132.5 | 0.093 |
| SP-B | 9 | 7.9 | 3 | 1.48 | 19.93 | 0.5474 |
| SP-C | 3.8 | 3.4 | 2 | 1.5 | 19.93 | 0.796 |
| SP-D | 42 | 92 | 92 | 1.4 | 39.64 | 0.0206 |
2.3. ENM Transport in Alveolar Lining Fluid
2.4. ENM Agglomeration
3. Results and Discussion
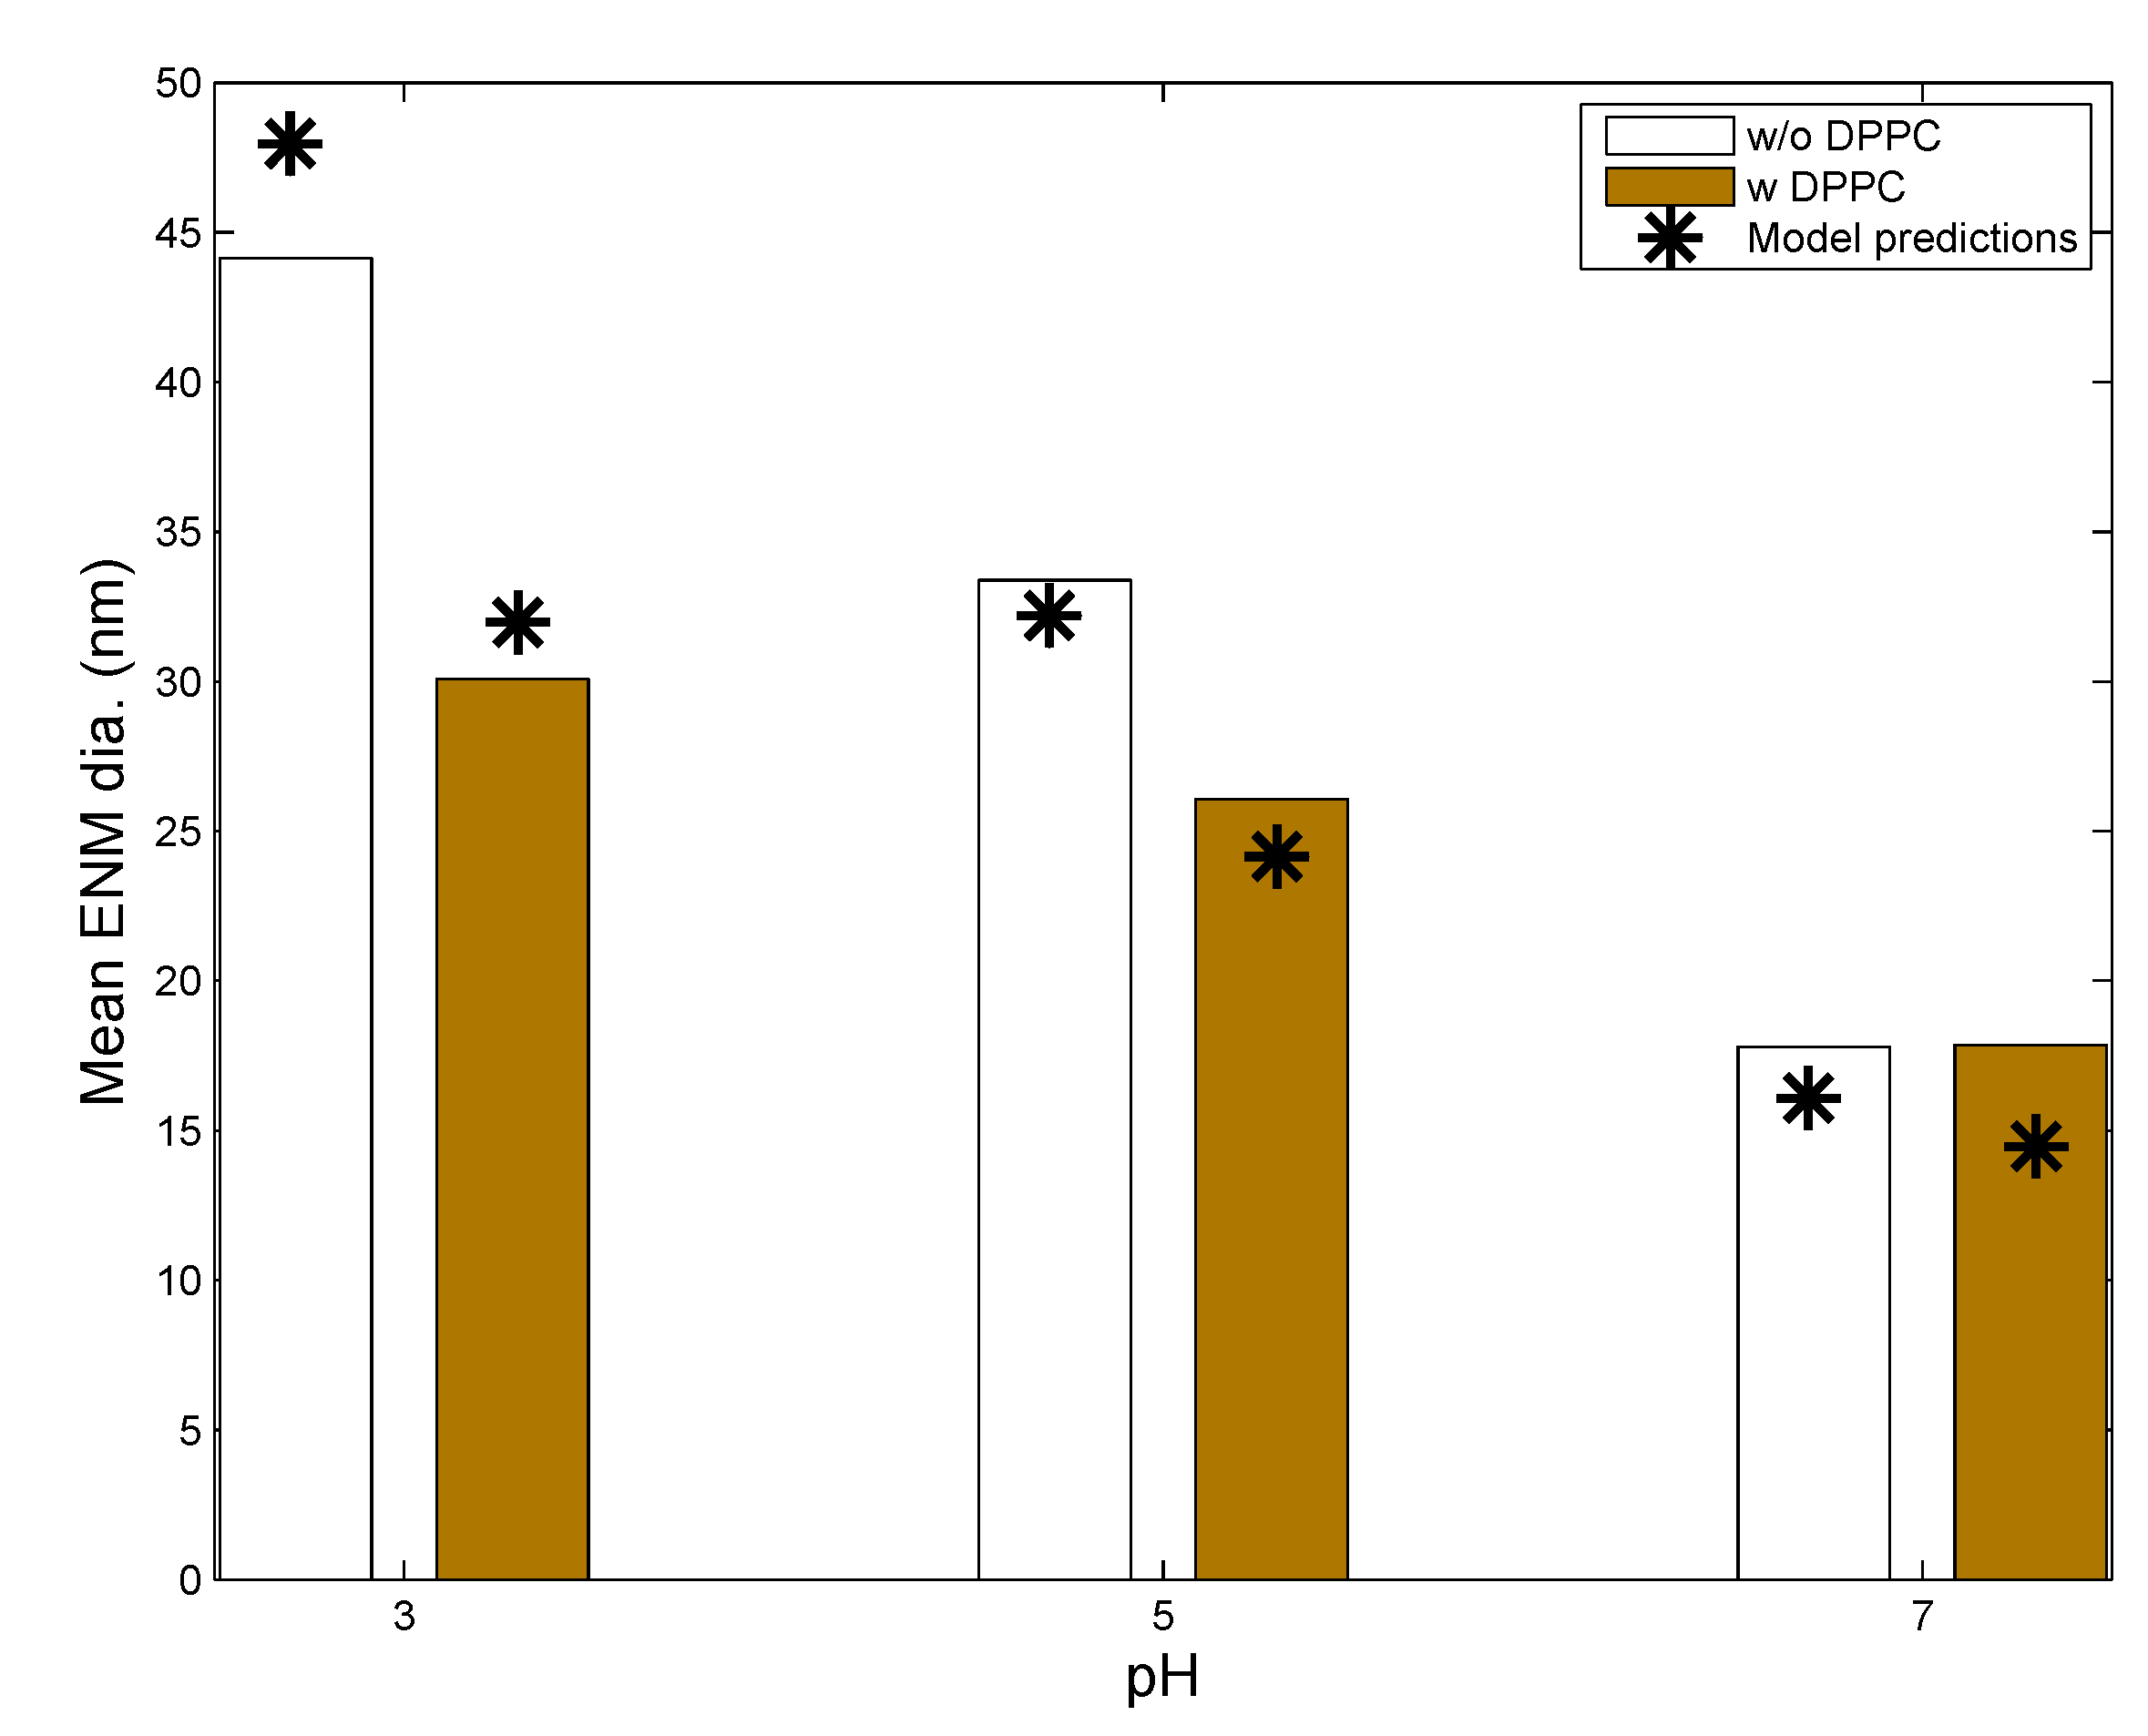
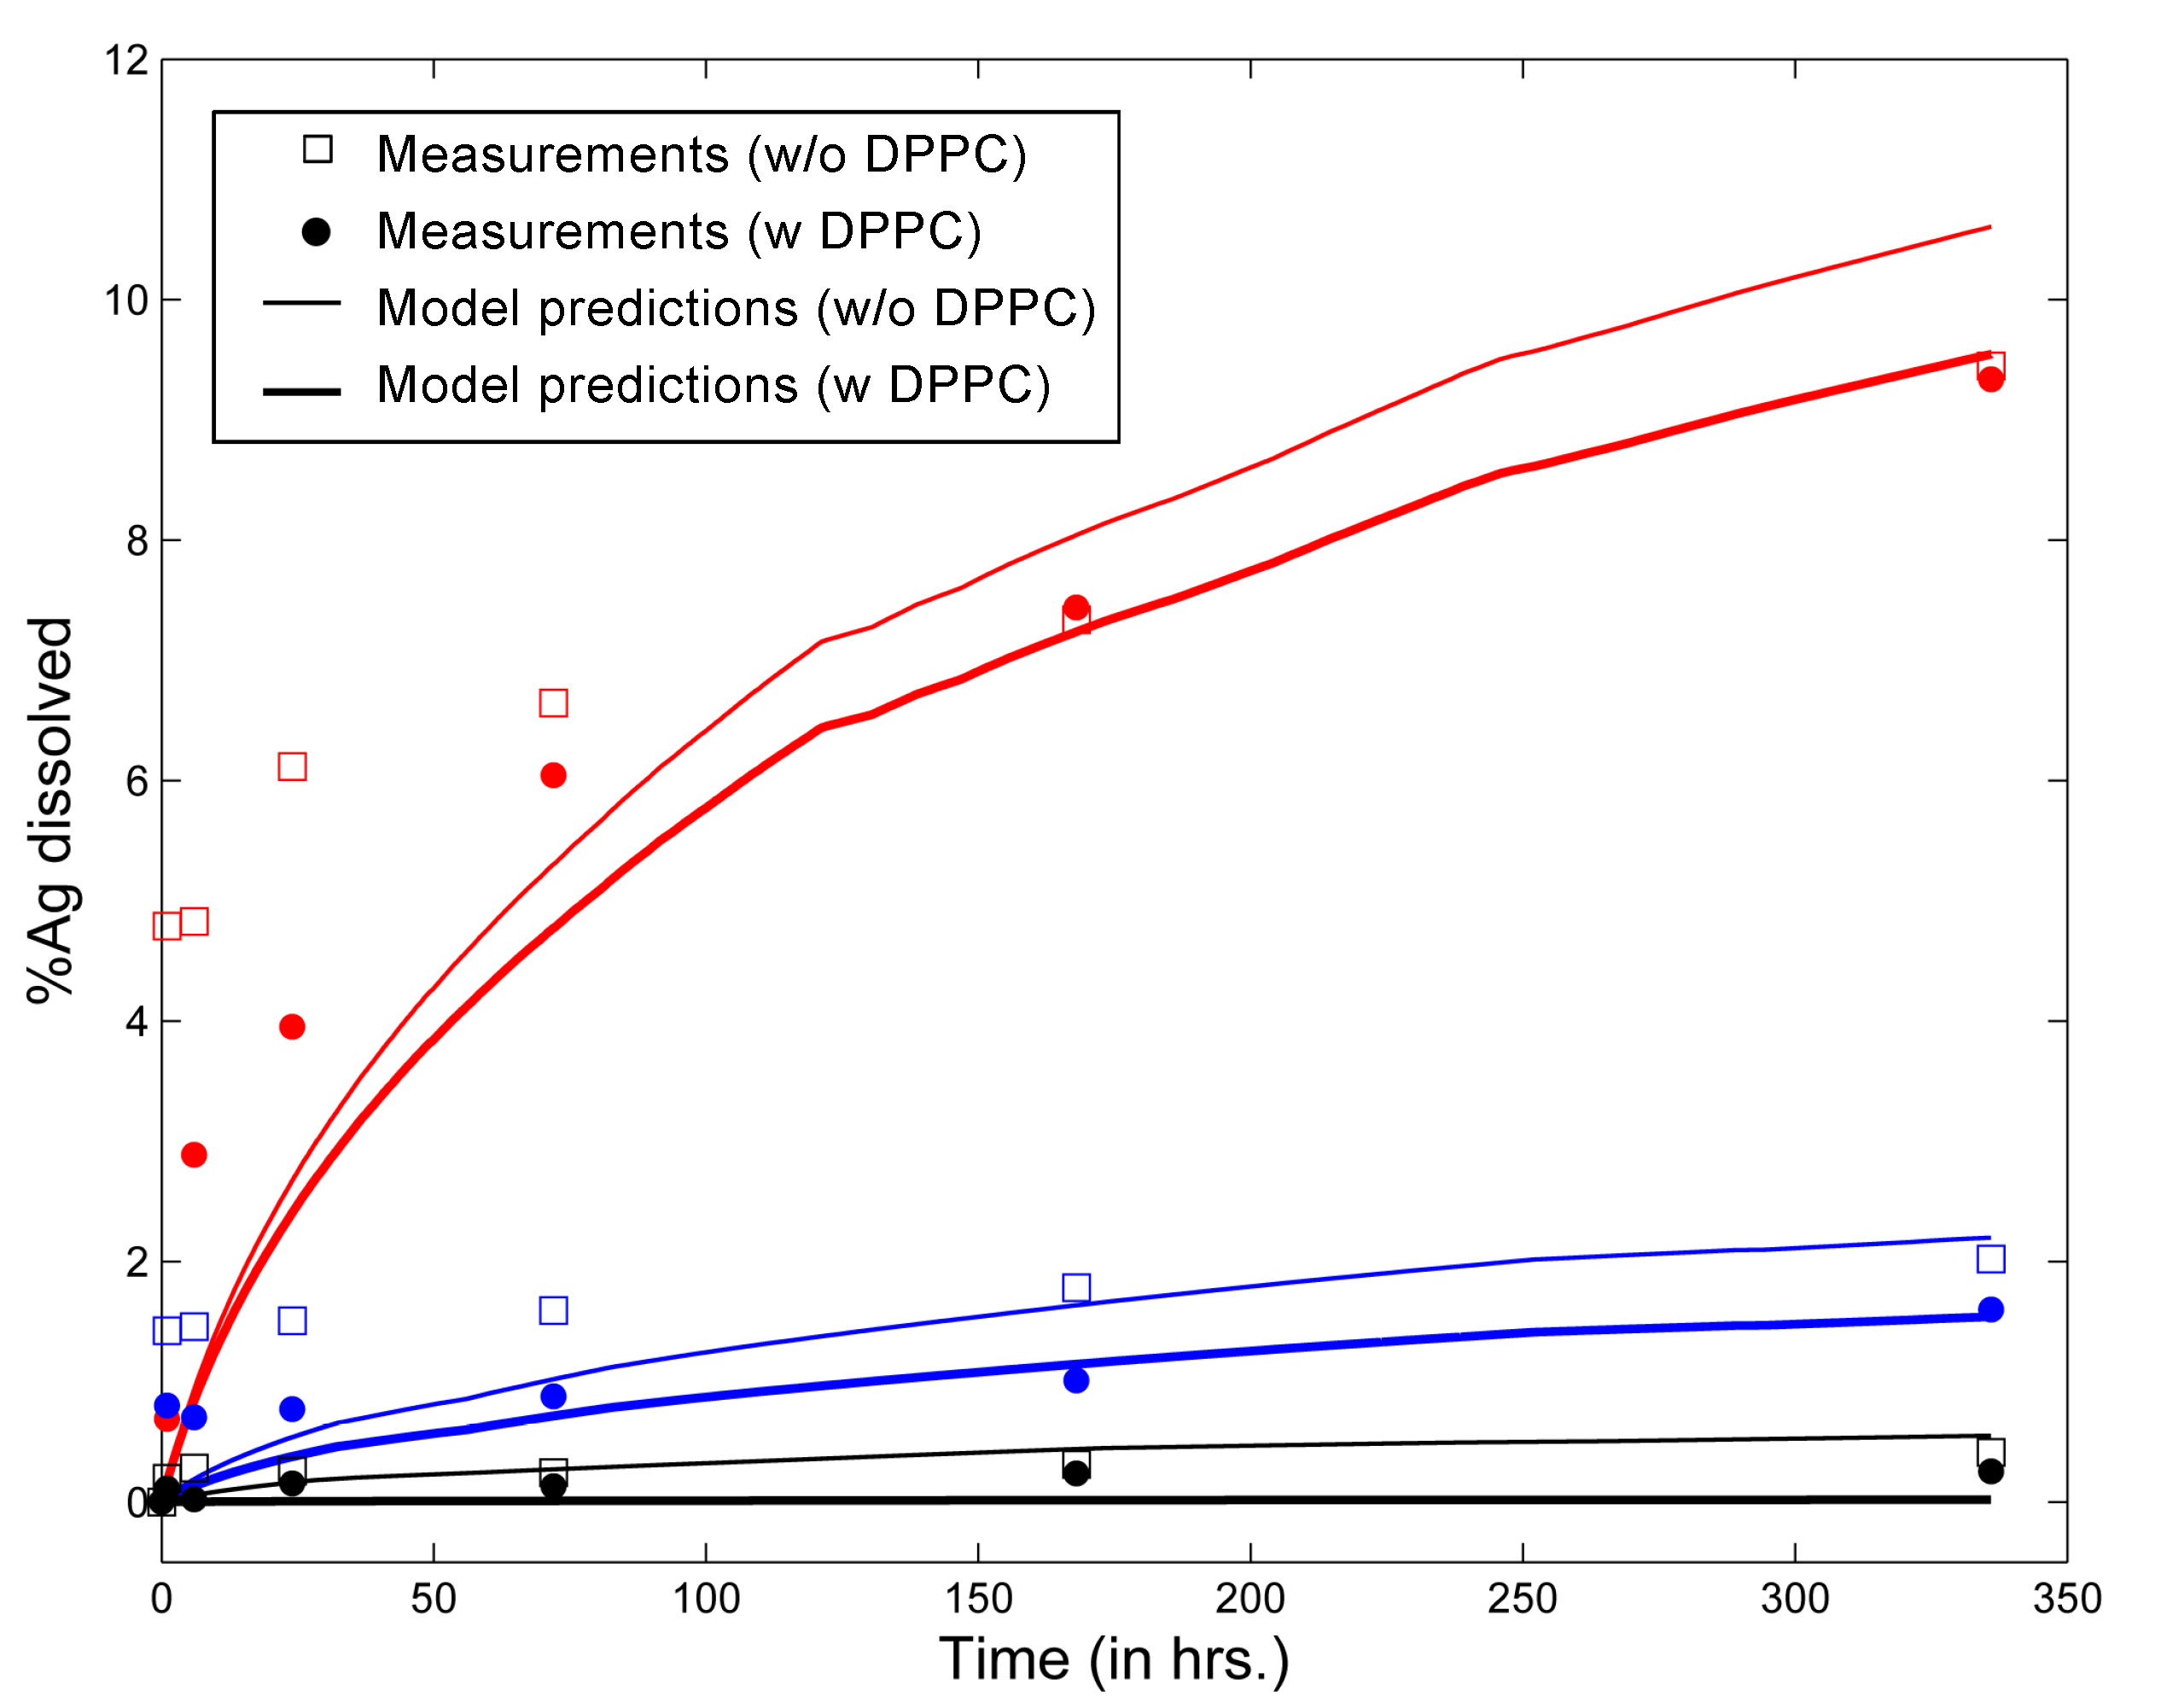
3.1. In Vitro Implementations
- Lipid concentration is considered to vary dynamically from the initial values in solution. Vesicle diffusivity was appropriately modified. For in vivo systems, the levels of lipid in alveolar lining are maintained relatively constant by alveolar cells via constant secretion and removal.
- DPPC vesicle size distribution and concentration have been considered based on the commercially available formulations used in the relevant studies, rather than on the properties of actual biological surfactant.
- Gravitational settling has been considered, rather than surface-active transport, unlike the situation in the actual alveolar lining, where surface tension-aided transport far outweighs gravitational transport (discussed in the Methods).
| Parameters | Leo et al., 2013 [26] | Nordlund et al., 2009 [39] | In Vivo Implementation |
|---|---|---|---|
| System | Eppendorf tube | NR | Alveolar lining |
| System volume | 4 mL | NR | 10 mL/kg BW [41] |
| ENM type | Ag NP | Silica NP | Ag NP |
| ENM coating type | Citrate (C) | None | Citrate (C), PVP |
| Coating molecular weight (mol. wt.) | 258 | None | 258 (C), 10,000 (PVP) |
| Initial ENM diameter (nm) | 20 | 600 | 20, 110 |
| ENM density (g/mL) | 10.49 | 2 | 10.49 |
| ENM concentration (mg/L) | 25 | 3000 | NA * |
| Ionic strength (mM) | 0.1 | 100 | 245 [43] |
| pH | 3, 5, 7 | 7.4 | 7.28 [43] |
| Initial ENM zeta potential (mV) | −18.2, −22.5, −32.5 | −25 [54] | −32.5 |
| Dissolved O (mg/L) ** | 8.96 | 8.96 | 8.96 |
| Temperature | 37 C | 22 C | 37 C |
| Adsorption probability, α | 0.004 | 0.001 | 0.004 |
| Steric factor, | 2.35 | 1 | 2.35 (C), 10.6 (PVP) |

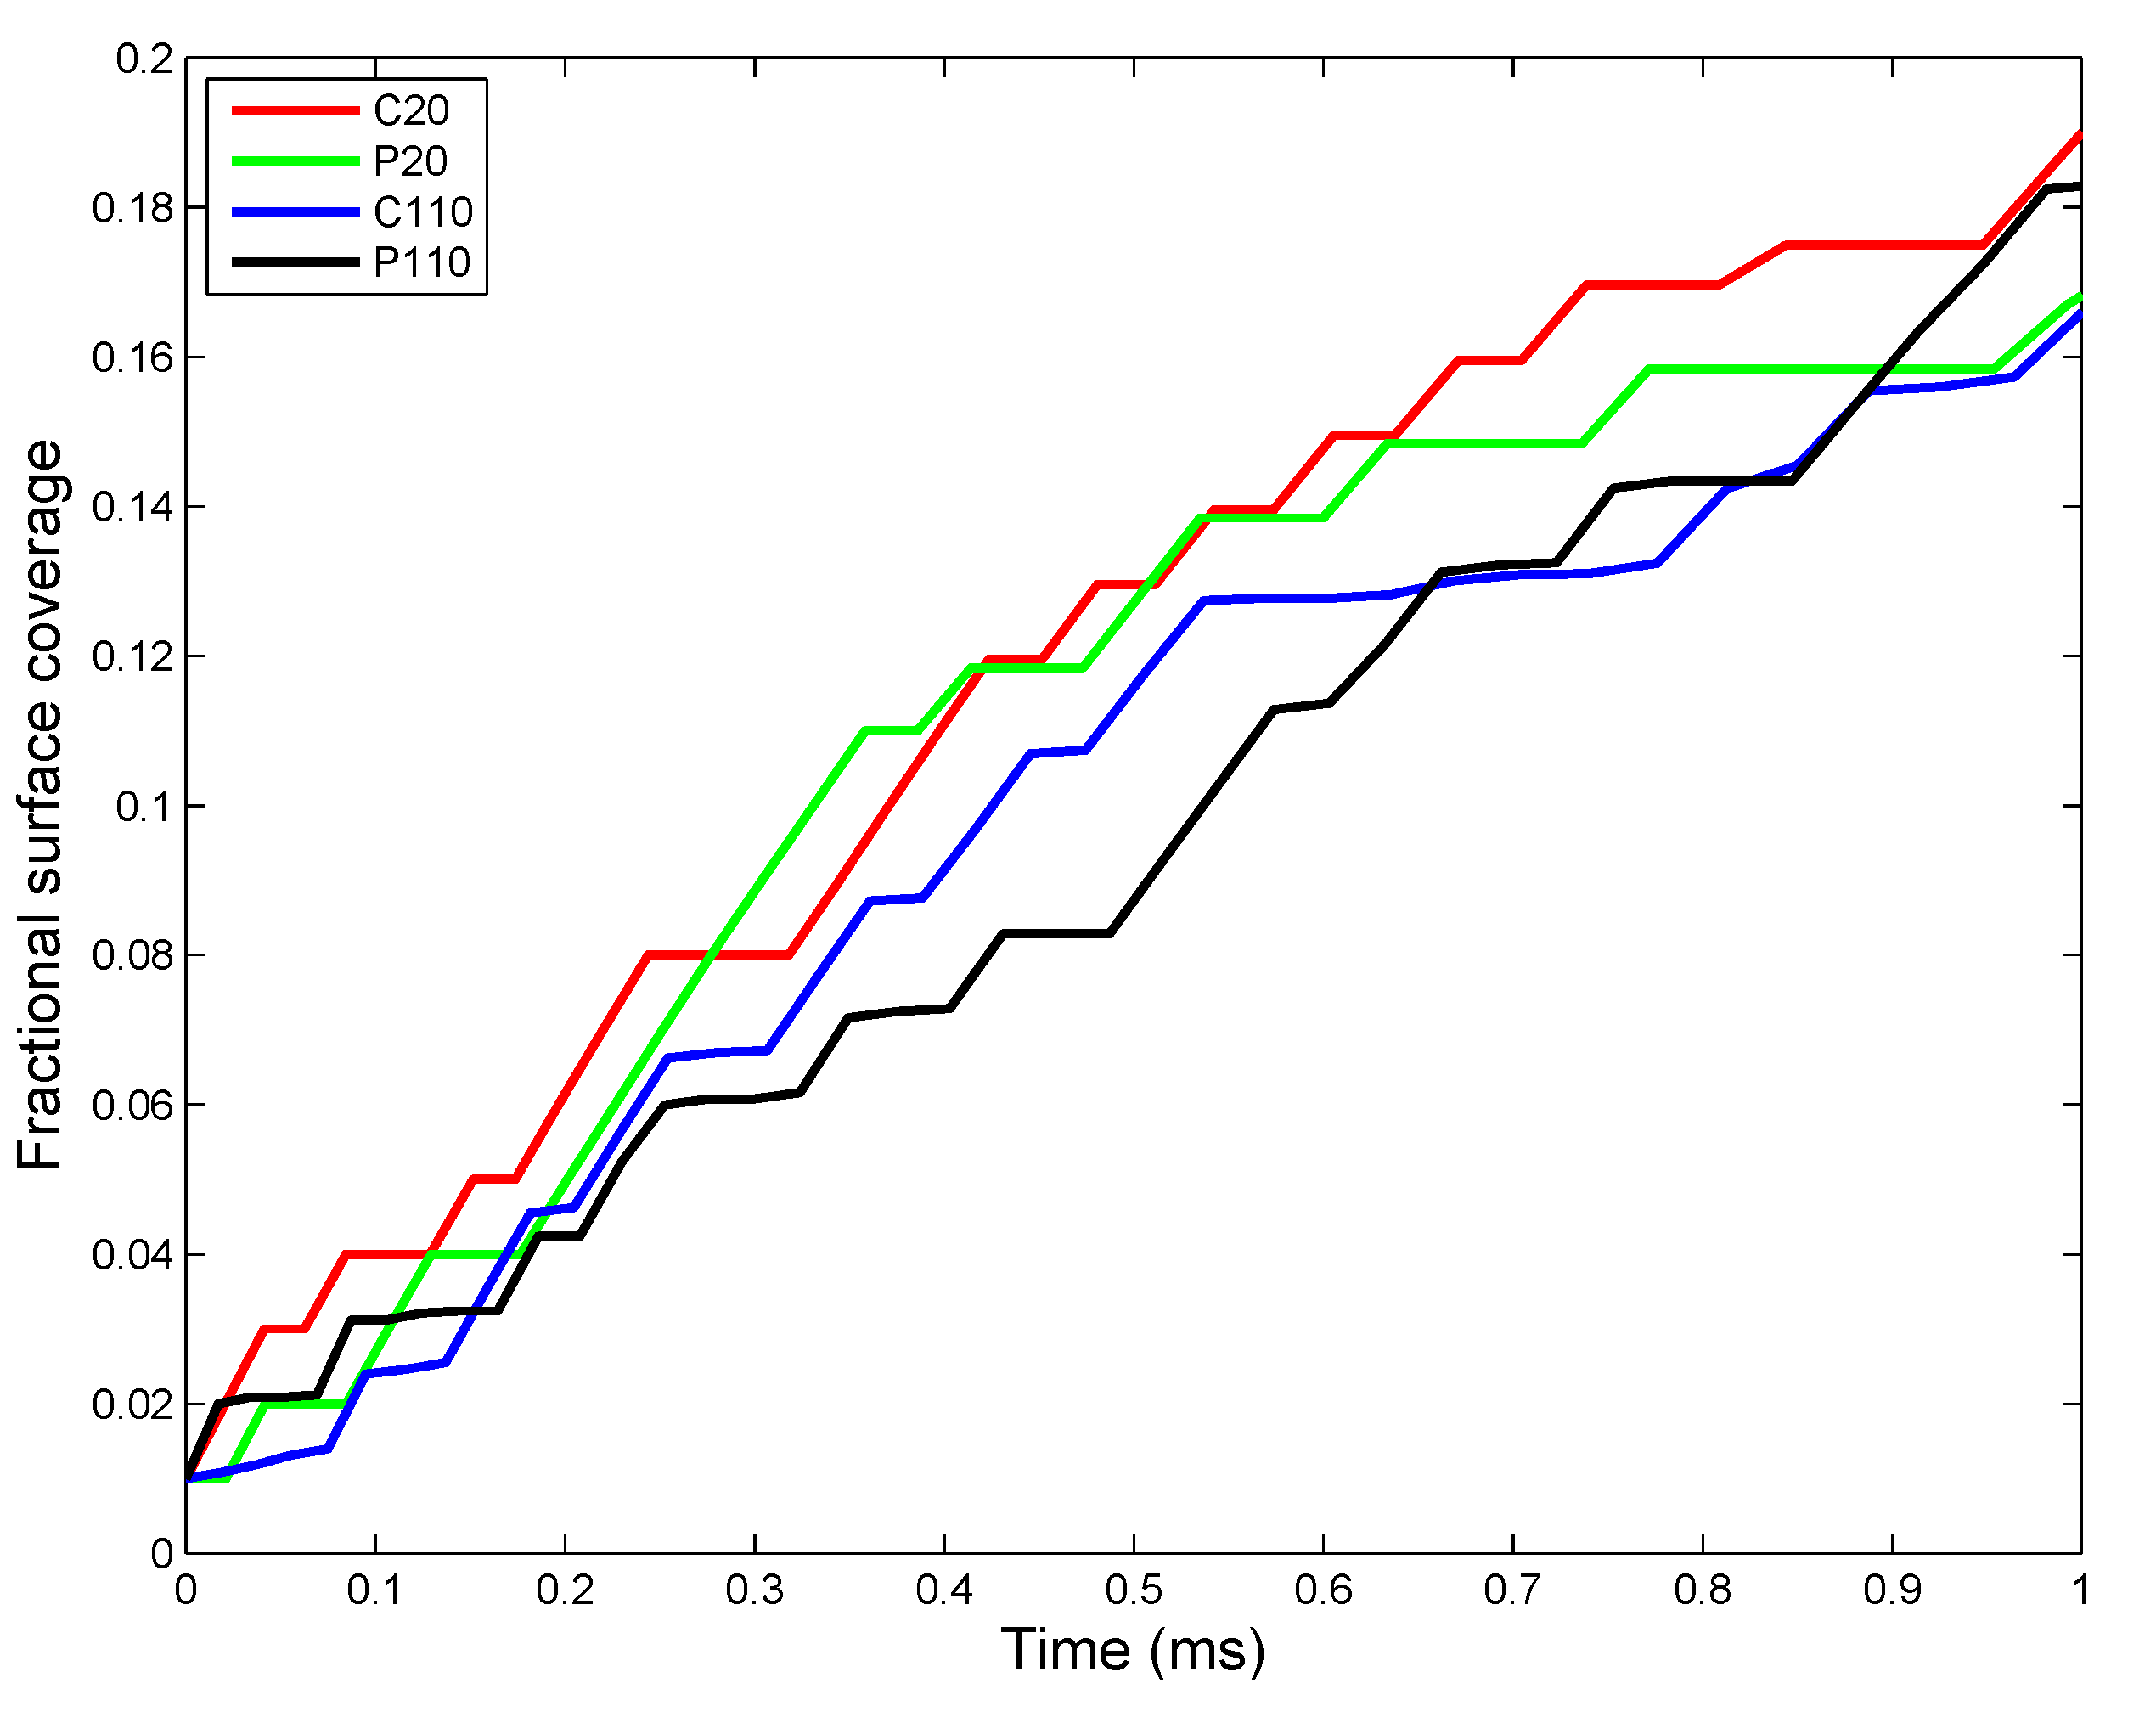
| NP | Coating | Core Material | Density (g/cm) | Mol. Wt. | Coating Mol. Wt. | Zeta Potential (mV) | Ref. |
|---|---|---|---|---|---|---|---|
| L20 | Citrate | Ag | 10.49 | 108 | 258 | −39.2 | [26] |
| N600 | None | SiO | 10.49 | 108 | 258 | −39.2 | [39] |
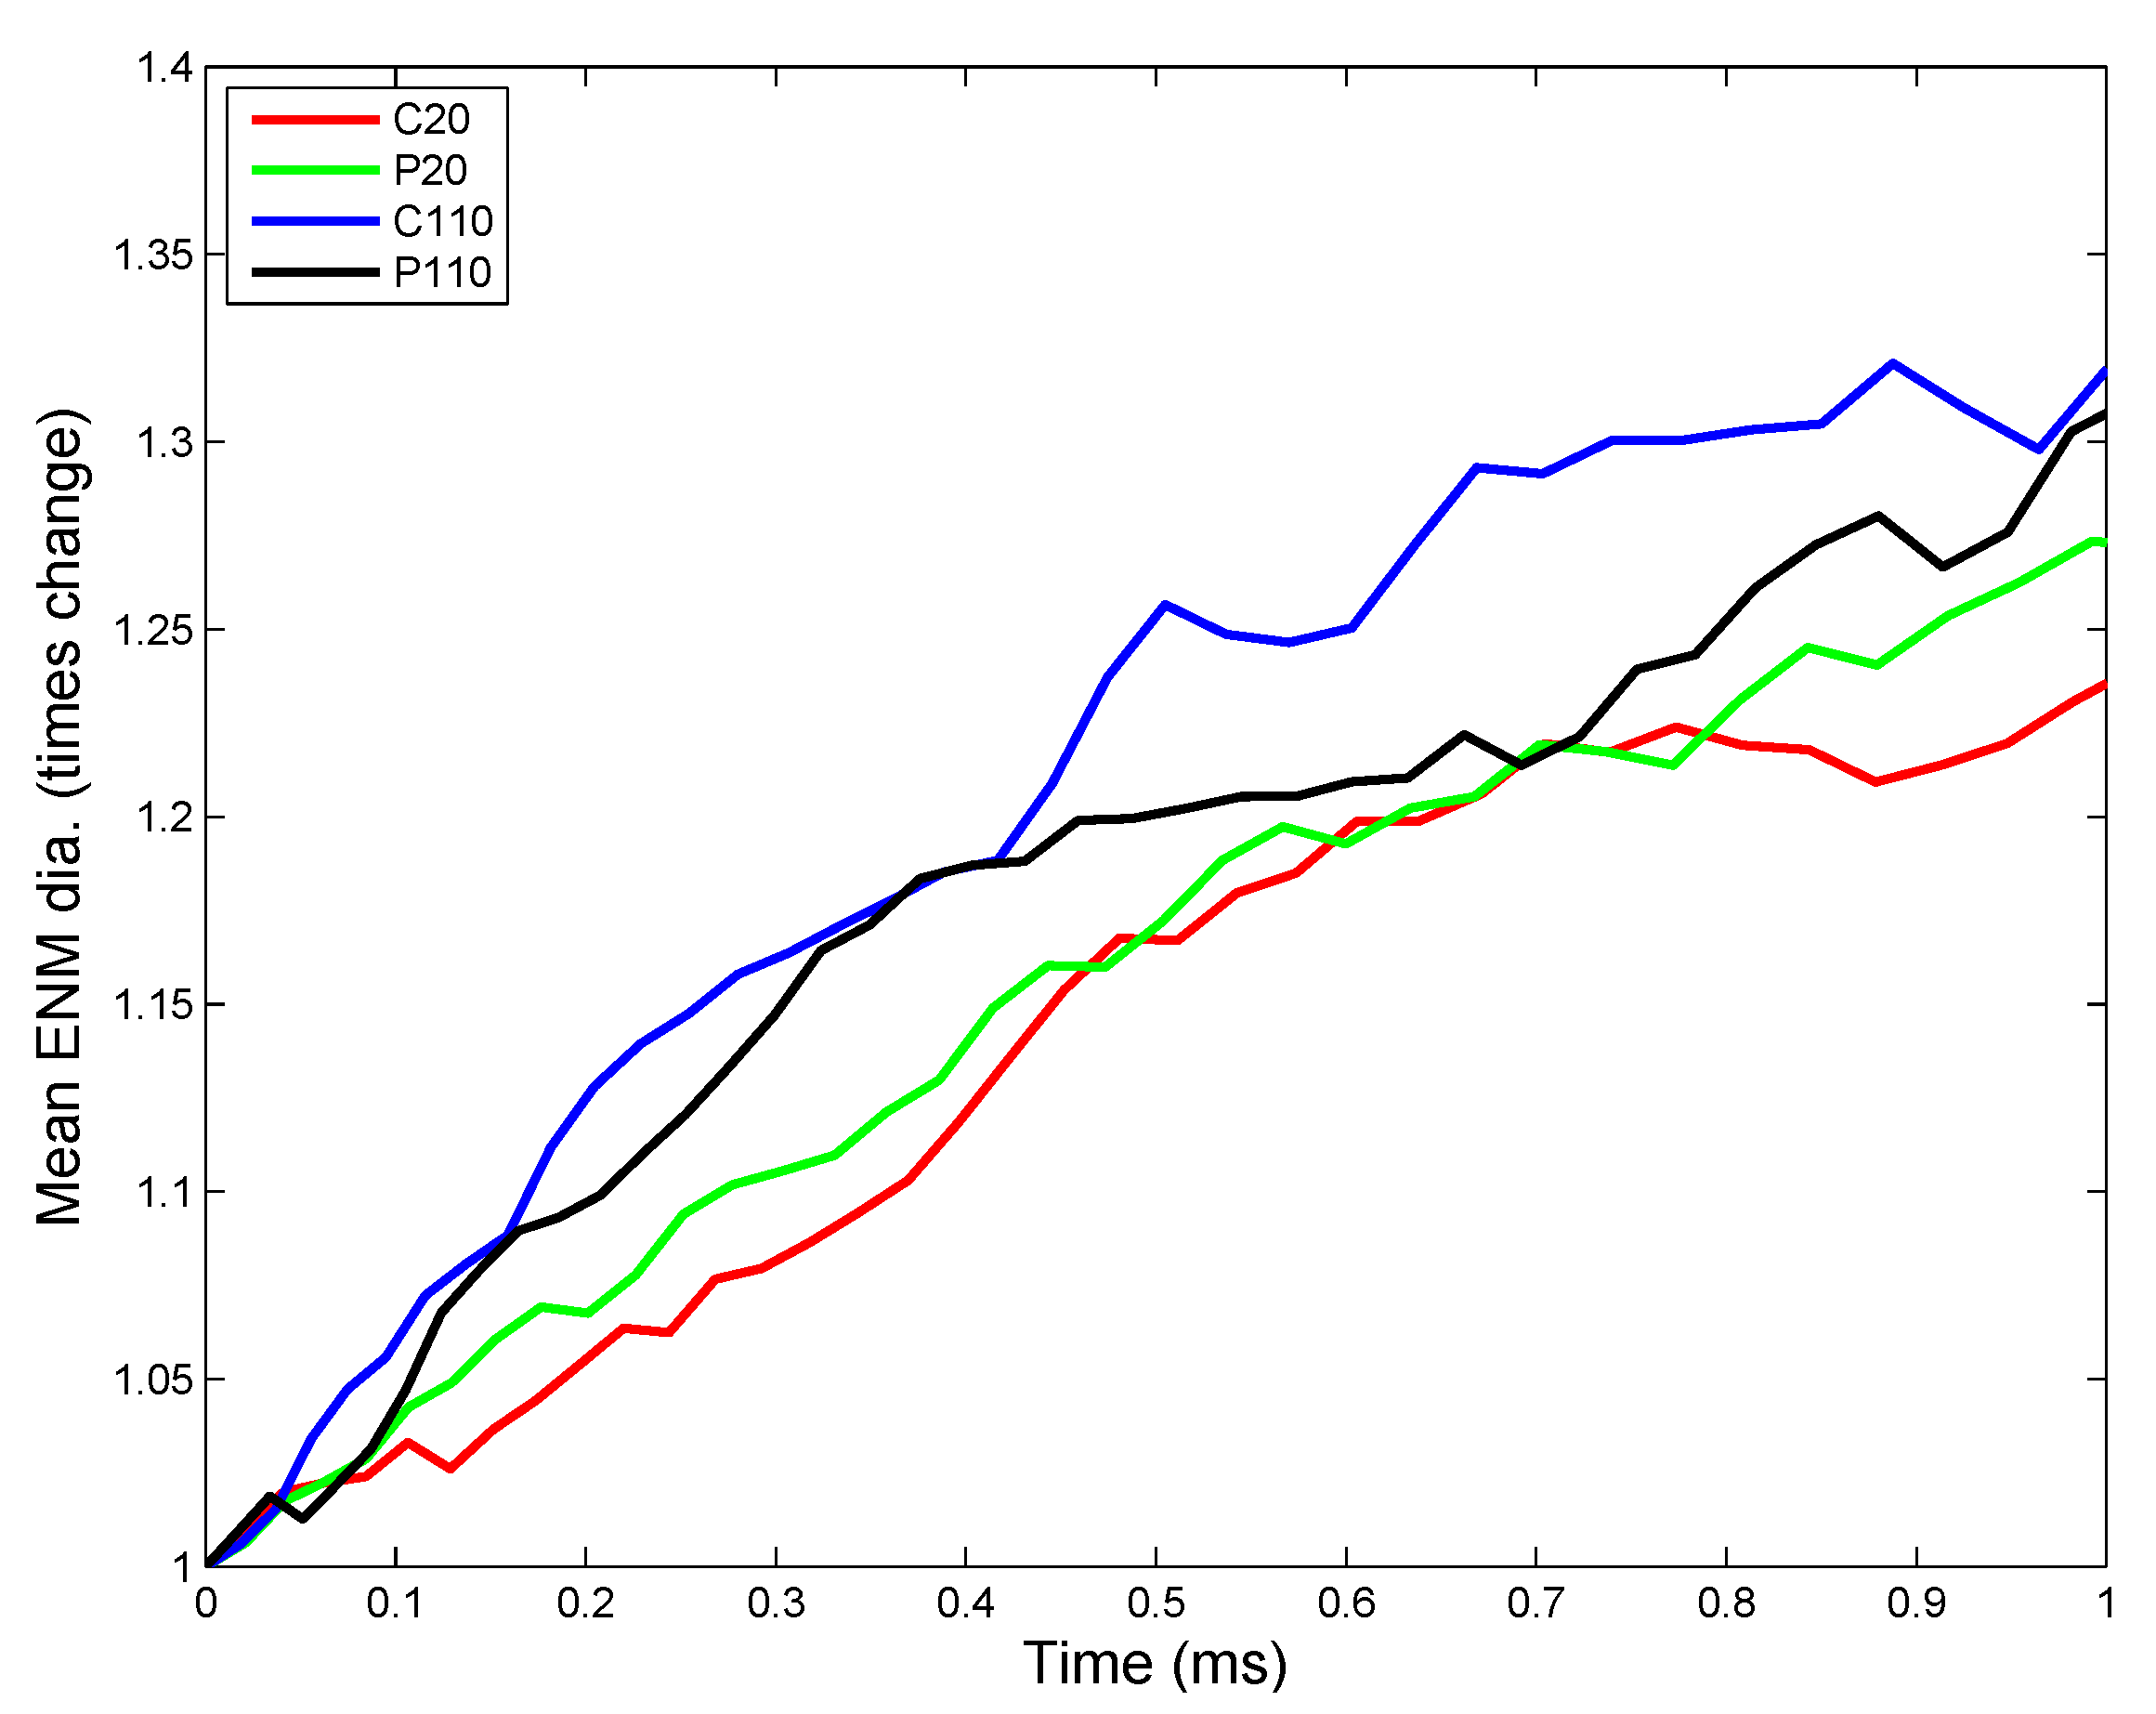
| C20 | Citrate | Au | 10.87 | 115.3 | 258 | −44.3 | [7,55] |
| P20 | PVP | Au | 10.87 | 115.3 | 10,000 | −38.2 | [7,55] |
| C110 | Citrate | Au | 10.49 | 108.04 | 258 | −45.2 | [7,55] |
| P110 | PVP | Au | 10.49 | 108.04 | 40,000 | −31.6 | [7,55] |
3.2. In Vivo Implementation
- The ENM dose to the alveolar region is based on an inhalation dose for an adult human.
- Airway dosimetry of ENMs based on alveolar deposition is estimated by the software MPPD [56].
- Gravitational settling is replaced by surface-tension-assisted transport of particles towards the cellular layer.
- The concentration of lipids and proteins is considered constant due to homeostasis maintained by constant secretion from alveolar cells.
- A constant number (N = 100) of ENMs is selected, and the associated alveolar area is calculated.
- The volume of the starting control volume (CV) is calculated based on a uniform average thickness of the alveolar lining layer.
- The ENMs are initially all considered to be deposited at the top of the CV.
- ENMs are considered to be monomers, as there is negligible chance for agglomeration in the airway before coming in contact with a surface.
- Diameters and all other internal coordinates of the ENMs in the CV are estimated.
- Various modules of the model—agglomeration, transport, adsorption, desorption and reaction—are successively implemented as described in detail in the Methods Section.
- Time is advanced by based on the slowest step among all processes.
- New CV is established based on the constant number N.
- ENM and media property values are saved, and the steps are run again from Step 5 as described above.
3.2.1. Estimation of Kinetic Parameters
| Parameter | C20 | C110 | P20 | P110 |
|---|---|---|---|---|
| Agglomeration rate (nm/s) | 5.423 × 10 | 3.483 × 10 | 5.82 × 10 | 3.986 × 10 |
| Transport rate (m/s) | 7.481 × 10 | 7.481 × 10 | 7.481 × 10 | 7.481 × 10 |
| Dissolution rate (per s) | 4.25 × 10 | 6.375 × 10 | 5.525 × 10 | 9.52 × 10 |
| Phospholipid (PL) adsorption rate (ng/nm/s) | 1.053 × 10 | 1.304 × 10 | 9.06 × 10 | 1.166 × 10 |
| Surface active (SA) protein adsorption rate (nmol/nm/s) | 3.36 × 10 | 1.61 × 10 | 3.233 × 10 | 1.29 × 10 |
| Collectin (C) adsorption rate (nmol/nm/s) | 2.66 × 10 | 1.55 × 10 | 3.737 × 10 | 8.472 × 10 |


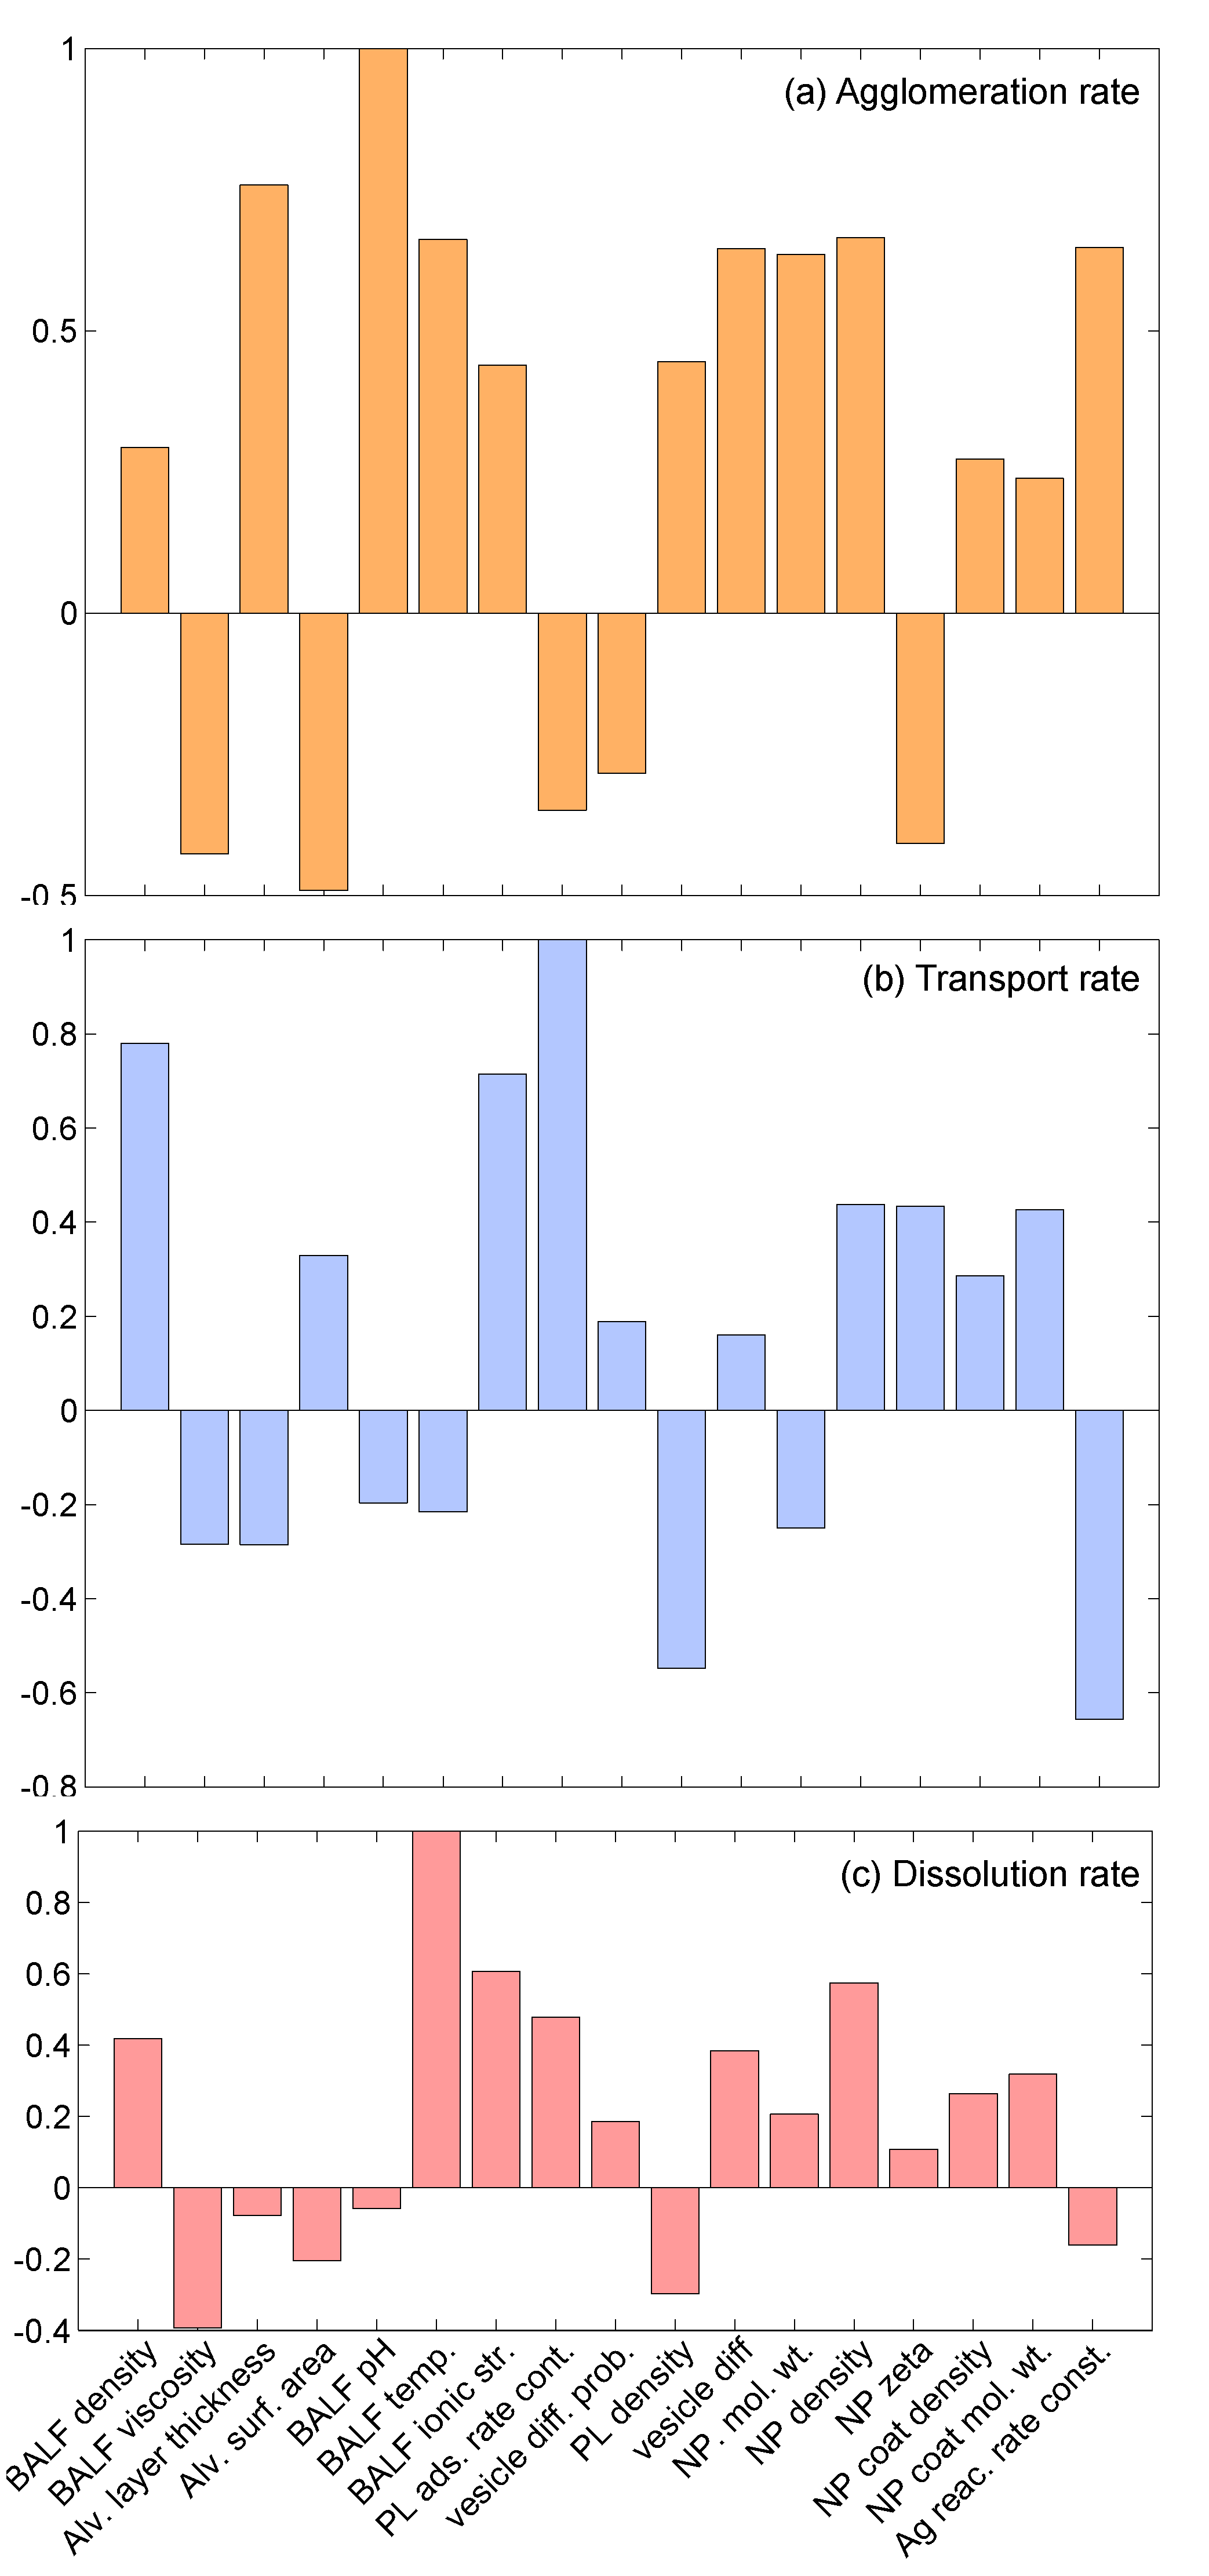
3.2.2. Sensitivity Analysis

4. Conclusions
Supplementary Materials
Acknowledgments
Author Contributions
Conflicts of Interest
References
- The Project on Emerging Nanotechnologies. Available online: http://www.nanotechproject.org (accessed on 31 March 2015).
- National Institute for Public Health and the Environment. Available online: http://www.rivm.nl/en (accessed on 20 July 2014).
- Royce, S.; Mukherjee, D.; Cai, T.; Xu, S.; Alexander, J.; Mi, Z.; Calderon, L.; Mainelis, G.; Lee, K.; Lioy, P.; et al. Modeling population exposures to silver nanoparticles present in consumer products. J. Nanopart. Res. 2014, 16, 1–25. [Google Scholar] [CrossRef] [PubMed]
- Oberdorster, G. Pulmonary effects of inhaled ultrafine particles. Int. Arch. Occup. Environ. Health 2001, 74, 1–8. [Google Scholar] [CrossRef] [PubMed]
- Notter, R.H. Lung Biology in Health and Disease. In Lung Surfactants: Basic Science and Clinical Applications; Marcel Dekker: New York, NY, USA, 2000; Volume 149. [Google Scholar]
- Hinderliter, P.M.; Minard, K.R.; Orr, G.; Chrisler, W.B.; Thrall, B.D.; Pounds, J.G.; Teeguarden, J.G. ISDD: A computational model of particle sedimentation, diffusion and target cell dosimetry for in vitro toxicity studies. Part Fibre Toxicol. 2010, 7, 36. [Google Scholar] [CrossRef] [PubMed]
- Mukherjee, D.; Leo, B.; Royce, S.; Porter, A.; Ryan, M.; Schwander, S.; Chung, K.; Tetley, T.; Zhang, J.; Georgopoulos, P. Modeling physicochemical interactions affecting in vitro cellular dosimetry of engineered nanomaterials: Application to nanosilver. J. Nanopart. Res. 2014, 16, 1–16. [Google Scholar] [CrossRef] [PubMed]
- Goerke, J. Pulmonary surfactant: Functions and molecular composition. Biochim. Biophys. Acta 1998, 1408, 79–89. [Google Scholar] [CrossRef]
- Creuwels, L.A.J.M.; van Golde, L.M.G.; Haagsman, H.P. The pulmonary surfactant system: Biochemical and clinical aspects. Lung 1997, 175, 1–39. [Google Scholar] [CrossRef] [PubMed]
- Avanti Polar Lipids, Inc. Available online: http://www.avantilipids.com (accessed on 15 December 2014).
- Federal institute for Occupational Safety and Health (FIOSH). Dispersion and Retention of Dusts Consisting of Ultrafine Primary Particles in Lungs; FIOSH: Dortmund, Germany, 2011. [Google Scholar]
- Limbach, L.K.; Li, Y.; Grass, R.N.; Brunner, T.J.; Hintermann, M.A.; Muller, M.; Gunther, D.; Stark, W.J. Oxide nanoparticle uptake in human lung fibroblasts: Effects of particle size, agglomeration, and diffusion at low concentrations. Environ. Sci. Technol. 2005, 39, 9370–9376. [Google Scholar] [CrossRef] [PubMed]
- Kendall, M.; Brown, L.; Trought, K. Molecular adsorption at particle surfaces: A PM toxicity mediation mechanism. Inhal. Toxicol. 2004, 16, 99–105. [Google Scholar] [CrossRef] [PubMed]
- Mukherjee, D.; Royce, S.G.; Sarkar, S.; Thorley, A.; Schwander, S.; Ryan, M.P.; Porter, A.E.; Chung, K.F.; Tetley, T.D.; Zhang, J.; et al. Modeling in vitro cellular responses to silver nanoparticles. J. Toxicol. 2014, 2014, 852890. [Google Scholar] [CrossRef] [PubMed]
- MacCalman, L.; Tran, C.; Kuempel, E. Development of a bio-mathematical model in rats to describe clearance, retention and translocation of inhaled nano particles throughout the body. J. Phys. Conf. Ser. 2009, 151, 1–10. [Google Scholar] [CrossRef]
- Oberdorster, G.; Oberdorster, E.; Oberdorster, J. Nanotoxicology: An emerging discipline evolving from studies of ultrafine particles. Environ. Health Perspect. 2005, 113, 823–839. [Google Scholar] [CrossRef] [PubMed]
- Mukherjee, D.; Botelho, D.; Gow, A.J.; Zhang, J.; Georgopoulos, P.G. Computational multiscale toxicodynamic modeling of silver and carbon nanoparticle effects on mouse lung function. PLoS ONE 2013, 8, e80917. [Google Scholar] [CrossRef] [PubMed]
- Mudunkotuwa, I.A.; Grassian, V.H. Citric acid adsorption on TiO2 nanoparticles in aqueous suspensions at acidic and circumneutral pH: Surface coverage, surface speciation, and its impact on nanoparticle interactions. J. Am. Chem. Soc. 2010, 132, 14986–14994. [Google Scholar] [CrossRef] [PubMed]
- Kendall, M.; Tetley, T.D.; Wigzell, E.; Hutton, B.; Nieuwenhuijsen, M.; Luckham, P. Lung lining liquid modifies PM2.5 in favor of particle aggregation: A protective mechanism. Lung Cell. Mol. Physiol. 2002, 282, L109–L114. [Google Scholar]
- Wang, F.; Yu, L.; Monopoli, M.P.; Sandin, P.; Mahon, E.; Salvati, A.; Dawson, K.A. The biomolecular corona is retained during nanoparticle uptake and protects the cells from the damage induced by cationic nanoparticles until degraded in the lysosomes. Nanomedicine 2013, 9, 1159–1168. [Google Scholar] [CrossRef] [PubMed]
- Monopoli, M.P.; Aberg, C.; Salvati, A.; Dawson, K.A. Biomolecular coronas provide the biological identity of nanosized materials. Nat. Nano 2012, 7, 779–786. [Google Scholar] [CrossRef] [PubMed]
- Blank, F.; Rothen-Rutishauser, B.M.; Schurch, S.; Gehr, P. An optimized in vitro model of the respiratory tract wall to study particle cell interactions. J. Aerosol. Med. 2006, 19, 392–405. [Google Scholar] [CrossRef] [PubMed]
- Tsuda, A.; Gehr, P. Nanoparticles in the Lung—Environmental Exposure and Drug Delivery; CRC Press: Boca Raton, FL, USA, 2015. [Google Scholar]
- Schwander, S.; Dheda, K. Human lung immunity against Mycobacterium tuberculosis: Insights into pathogenesis and protection. Am. J. Respir. Crit. Care Med. 2011, 183, 696–707. [Google Scholar] [CrossRef] [PubMed]
- Zhang, W.; Yao, Y.; Sullivan, N.; Chen, Y. Modeling the primary size effects of citrate-coated silver nanoparticles on their ion release kinetics. Environ. Sci. Technol. 2011, 45, 4422–4428. [Google Scholar] [CrossRef] [PubMed]
- Leo, B.F.; Chen, S.; Kyo, Y.; Herpoldt, K.L.; Terrill, N.J.; Dunlop, I.E.; McPhail, D.S.; Shaffer, M.S.; Schwander, S.; Gow, A.; et al. The stability of silver nanoparticles in a model of pulmonary surfactant. Environ. Sci. Technol. 2013, 47, 11232–11240. [Google Scholar] [CrossRef] [PubMed]
- Zhang, W.; Yao, Y.; Li, K.; Huang, Y.; Chen, Y. Influence of dissolved oxygen on aggregation kinetics of citrate-coated silver nanoparticles. Environ. Pollut. 2011, 159, 3757–3762. [Google Scholar] [CrossRef] [PubMed]
- Levard, C.; Reinsch, B.C.; Michel, F.M.; Oumahi, C.; Lowry, G.V.; Brown, G.E. Sulfidation processes of PVP-coated silver nanoparticles in aqueous solution: Impact on dissolution rate. Environ. Sci. Technol. 2011, 45, 5260–5266. [Google Scholar] [CrossRef] [PubMed]
- Liu, J.; Pennell, K.G.; Hurt, R.H. Kinetics and mechanisms of nanosilver oxysulfidation. Environ. Sci. Technol. 2011, 45, 7345–7353. [Google Scholar] [CrossRef] [PubMed]
- Chen, S.; Goode, A.E.; Sweeney, S.; Theodorou, I.G.; Thorley, A.J.; Ruenraroengsak, P.; Chang, Y.; Gow, A.; Schwander, S.; Skepper, J.; et al. Sulfidation of silver nanowires inside human alveolar epithelial cells: A potential detoxification mechanism. Nanoscale 2013, 5, 9839–9847. [Google Scholar] [CrossRef] [PubMed]
- Bakshi, M.S.; Zhao, L.; Smith, R.; Possmayer, F.; Petersen, N.O. Metal nanoparticle pollutants interfere with pulmonary surfactant function in vitro. Biophys. J. 2008, 94, 855–868. [Google Scholar] [CrossRef] [PubMed]
- Schleh, C.; Hohlfeld, J.M. Interaction of nanoparticles with the pulmonary surfactant system. Inhal. Toxicol. 2009, 21, 97–103. [Google Scholar] [CrossRef] [PubMed]
- Hunter, R.J. Foundations of Colloid Science; Oxford University Press: New York, NY, USA, 2001. [Google Scholar]
- Mornet, S.; Lambert, O.; Duguet, E.; Brisson, A. The formation of supported lipid bilayers on silica nanoparticles revealed by cryoelectron microscopy. Nano Lett. 2005, 5, 281–285. [Google Scholar] [CrossRef] [PubMed]
- Zhdanov, V.P.; Keller, C.A.; Glasmastar, K.; Kasemo, B. Simulation of adsorption kinetics of lipid vesicles. J. Chem. Phys. 2000, 112, 900–909. [Google Scholar] [CrossRef]
- Zhdanov, V.P.; Kasemo, B. Protein adsorption and desorption on lipid bilayers. Biophys. Chem. 2009, 146, 60–64. [Google Scholar] [CrossRef] [PubMed]
- Stroumpoulis, D.; Parra, A.; Tirrell, M. A kinetic study of vesicle fusion on silicon dioxide surfaces by ellipsometry. AIChE J. 2006, 52, 2931–2937. [Google Scholar] [CrossRef]
- Gross, N.J.; Narine, K.R. Surfactant subtypes of mice: Metabolic relationships and conversion in vitro. J. Appl. Physiol. 1989, 67, 414–421. [Google Scholar] [PubMed]
- Nordlund, G.; Lönneborg, R.; Brzezinski, P. Formation of supported lipid bilayers on silica particles studied using flow cytometry. Langmuir 2009, 25, 4601–4606. [Google Scholar] [CrossRef] [PubMed]
- Shelley, S.A.; L'Heureux, M.V.; Balis, J.U. Characterization of lung surfactant: Factors promoting formation of artifactual lipid-protein complexes. J. Lipid. Res. 1975, 16, 224–234. [Google Scholar] [PubMed]
- Meyer, K.C.; Sharma, A.; Brown, R.; Weatherly, M.; Moya, F.R.; Lewandoski, J.; Zimmerman, J.J. Function and composition of pulmonary surfactant and surfactant-derived fatty acid profiles are altered in young adults with cystic fibrosis. Chest 2000, 118, 164–174. [Google Scholar] [CrossRef] [PubMed]
- Woodka, A.C.; Butler, P.D.; Porcar, L.; Farago, B.; Nagao, M. Lipid bilayers and membrane dynamics: Insight into thickness fluctuations. Phys. Rev. Lett. 2012, 109, 058102. [Google Scholar] [CrossRef]
- Song, Y.; Thiagarajah, J.; Verkman, A.S. Sodium and chloride concentrations, pH, and depth of airway surface liquid in distal airways. J. Gen. Physiol. 2003, 122, 511–519. [Google Scholar] [CrossRef] [PubMed]
- Bastacky, J.; Lee, C.Y.; Goerke, J.; Koushafar, H.; Yager, D.; Kenaga, L.; Speed, T.P.; Chen, Y.; Clements, J.A. Alveolar lining layer is thin and continuous: Low-temperature scanning electron microscopy of rat lung. J. Appl. Physiol. 1995, 79, 1615–1628. [Google Scholar] [PubMed]
- Shannahan, J.H.; Podila, R.; Aldossari, A.A.; Emerson, H.; Powell, B.A.; Ke, P.C.; Rao, A.M.; Brown, J.M. Formation of a protein corona on silver nanoparticles mediates cellular toxicity via scavenger receptors. Toxicol. Sci. 2014, 143, 136–146. [Google Scholar] [CrossRef] [PubMed]
- Pino, P.D.; Pelaz, B.; Zhang, Q.; Maffre, P.; Nienhaus, G.U.; Parak, W.J. Protein corona formation around nanoparticles—From the past to the future. Mater. Horiz. 2014, 1, 301–313. [Google Scholar] [CrossRef]
- Lundstrom, I. Models of Protein Adsorption on Solid Surfaces. In Surfactants, Adsorption, Surface Spectroscopy and Disperse Systems; Lindman, B., Olofsson, G., Stenius, P., Eds.; Springer: Berlin, Germany, 1985; Volume 70, pp. 76–82. [Google Scholar]
- Zhdanov, V.P.; Kasemo, B. Monte Carlo Simulation of the Kinetics of Protein Adsorption. Proteins 1998, 30, 177–182. [Google Scholar] [CrossRef]
- Heimburg, T. Monte Carlo simulations of lipid bilayers and lipid protein interactions in the light of recent experiments. Curr. Opin. Colloid Interface Sci. 2000, 5, 224–231. [Google Scholar] [CrossRef]
- Fischer, H.; Polikarpov, I.; Craievich, A. Average protein density is a molecular-weight-dependent function. Protein Sci. 2004, 13, 2825–2828. [Google Scholar] [CrossRef] [PubMed]
- Young, M.E.; Carroad, P.A.; Bell, R.L. Estimation of diffusion coefficients of proteins. Biotechnol. Bioeng. 1980, 22, 947–955. [Google Scholar] [CrossRef]
- Schurch, S.; Gehr, P.; Im Hof, V.; Geiser, M.; Green, F. Surfactant displaces particles toward the epithelium in airways and alveoli. Respir. Physiol. 1990, 80, 17–32. [Google Scholar] [CrossRef]
- Damodaran, S. Food Proteins and Their Applications. In Food Science and Technology; CRC Press: Boca Raton, FL, USA, 1997. [Google Scholar]
- Wilhelm, P.; Stephan, D. On-line tracking of the coating of nanoscaled silica with titania nanoparticles via zeta-potential measurements. J. Colloid Interface Sci. 2006, 293, 88–92. [Google Scholar] [CrossRef] [PubMed]
- Wang, X.; Ji, Z.; Chang, C.H.; Zhang, H.; Wang, M.; Liao, Y.P.; Lin, S.; Meng, H.; Li, R.; Sun, B.; et al. Use of coated silver nanoparticles to understand the relationship of particle dissolution and bioavailability to cell and lung toxicological potential. Small 2014, 10, 385–398. [Google Scholar] [CrossRef] [PubMed]
- Applied Research Associates. Multiple-Path Particle Dosimetry Model (MPPD v 2.11): A model for human and rat airway particle dosimetry. Available online: http://www.ara.com/products/mppd.htm (accessed on 20 July 2015).
- Kuempel, E.D.; Tran, C.L.; Smith, R.J.; Bailer, A.J. A biomathematical model of particle clearance and retention in the lungs of coal miners: II. Evaluation of variability and uncertainty. Regul. Toxicol. Pharmacol. 2001, 34, 88–101. [Google Scholar] [CrossRef] [PubMed]
- Elzey, S.; Grassian, V. Agglomeration, isolation and dissolution of commercially manufactured silver nanoparticles in aqueous environments. J. Nanoparticle Res. 2010, 12, 1945–1958. [Google Scholar] [CrossRef]
- Treuel, L.; Brandholt, S.; Maffre, P.; Wiegele, S.; Shang, L.; Nienhaus, G.U. Impact of protein modification on the protein corona on nanoparticles and nanoparticle as cell interactions. ACS Nano 2014, 8, 503–513. [Google Scholar] [CrossRef] [PubMed]
© 2015 by the authors; licensee MDPI, Basel, Switzerland. This article is an open access article distributed under the terms and conditions of the Creative Commons Attribution license (http://creativecommons.org/licenses/by/4.0/).
Share and Cite
Mukherjee, D.; Porter, A.; Ryan, M.; Schwander, S.; Chung, K.F.; Tetley, T.; Zhang, J.; Georgopoulos, P. Modeling In Vivo Interactions of Engineered Nanoparticles in the Pulmonary Alveolar Lining Fluid. Nanomaterials 2015, 5, 1223-1249. https://doi.org/10.3390/nano5031223
Mukherjee D, Porter A, Ryan M, Schwander S, Chung KF, Tetley T, Zhang J, Georgopoulos P. Modeling In Vivo Interactions of Engineered Nanoparticles in the Pulmonary Alveolar Lining Fluid. Nanomaterials. 2015; 5(3):1223-1249. https://doi.org/10.3390/nano5031223
Chicago/Turabian StyleMukherjee, Dwaipayan, Alexandra Porter, Mary Ryan, Stephan Schwander, Kian Fan Chung, Teresa Tetley, Junfeng Zhang, and Panos Georgopoulos. 2015. "Modeling In Vivo Interactions of Engineered Nanoparticles in the Pulmonary Alveolar Lining Fluid" Nanomaterials 5, no. 3: 1223-1249. https://doi.org/10.3390/nano5031223