Article

Aggregation and Colloidal Stability of Commercially Available Al2O3 Nanoparticles in Aqueous Environments

Department of Earth and Environmental Science, College of Science and Technology, Temple University, Philadelphia, PA 19122, USA
*
Author to whom correspondence should be addressed.
Nanomaterials 2016, 6(5), 90; https://doi.org/10.3390/nano6050090
Submission received: 2 February 2016 / Revised: 28 April 2016 / Accepted: 3 May 2016 / Published: 13 May 2016
(This article belongs to the Special Issue Engineered Nanomaterials in the Environment)

Abstract

:
The aggregation and colloidal stability of three, commercially-available, gamma-aluminum oxide nanoparticles (γ-Al2O3 NPs) (nominally 5, 10, and 20–30 nm) were systematically examined as a function of pH, ionic strength, humic acid (HA) or clay minerals (e.g., montmorillonite) concentration using dynamic light scattering and transmission electron microscopy techniques. NPs possess pH-dependent surface charges, with a point of zero charge (PZC) of pH 7.5 to 8. When pH < PZC, γ-Al2O3 NPs are colloidally stable up to 100 mM NaCl and 30 mM CaCl2. However, significant aggregation of NPs is pronounced in both electrolytes at high ionic strength. In mixed systems, both HA and montmorillonite enhance NP colloidal stability through electrostatic interactions and steric hindrance when pH ≤ PZC, whereas their surface interactions are quite limited when pH > PZC. Even when pH approximates PZC, NPs became stable at a HA concentration of 1 mg·L−1. The magnitude of interactions and dominant sites of interaction (basal planes versus edge sites) are significantly dependent on pH because both NPs and montmorillonite have pH-dependent (conditional) surface charges. Thus, solution pH, ionic strength, and the presence of natural colloids greatly modify the surface conditions of commercial γ-Al2O3 NPs, affecting aggregation and colloidal stability significantly in the aqueous environment.

1. Introduction

Nanoparticles (NPs), one of the major classes of nanomaterials, define the particle size class in the range of 1 to 100 nm. Due to their small size, NPs often possess novel physical and chemical properties in comparison to their bulk counterparts, such as higher sorption capacity, greater chemical reactivity, and useful optical signatures. Successful commercialization of their unique properties can be found in various fields, including electronics, cosmetics, biomedical and pharmaceutical sciences, energy technologies, catalytic and material applications, as well as environmental remediation [1,2,3,4,5,6]. Among the manufactured NPs, metal oxides NPs are in highest demand with one conservative estimate predicting growth in production up to 1.7 million metric tons by 2020 [7].
Aluminum oxide (Al2O3) NPs are ranked second in the total market production, accounting for approximately 20% of all nanomaterials manufactured and produced in 2012 [7,8,9]. They are extensively used for commercial products such as high performance ceramics, cosmetic fillers, packing materials, polishing materials, semiconductor materials, paints, composite materials and resins, wear-resistant reinforcement and advanced waterproof materials, catalyst, and catalyst carriers [10,11,12,13,14,15,16,17]. Especially, γ-Al2O3 NPs, one of the Al2O3 NP forms, are very important in high-technology products such as catalysts or catalyst support materials because of their small particle size, high surface area, and, therefore, enhanced catalytic activities. Currently, Al2O3 and titanium dioxide (TiO2) NPs are the only metal oxide NPs that can be fabricated in bulk through both bottom-up and top-down approaches; therefore, they are more economically favorable to use [18].
However, the extensive existing and continually growing uses of Al2O3 NPs in commercial applications has raised environmental concerns over potential adverse ecological effects. For instance, recent studies have reported the toxicity of Al2O3 NPs on various aquatic organisms including (micro) algae species [19,20,21], aquatic invertebrates [22,23], as well as zebra fish [24]. Furthermore, the toxic effects of Al2O3 NPs are also reported on the model organisms for ecotoxicity tests, such as Bacillus subtillis, Escherichia coli, Pseudomonas fluorescens [25,26], and Caenorhabditis elegans [27], as well as on mammalian cell lines [28,29].
Despite growing number of ecotoxicity studies, very few studies have investigated the environmental behavior of Al2O3 NPs in the natural aquatic settings [30]. Understanding the aggregation and colloidal stability of manufactured Al2O3 NPs in natural waters is essential to accurately evaluate their toxicity on aquatic organisms. Most likely, abiotic factors such as pH, ionic strength, and the presence of natural colloids (natural organic matter (NOM) and clay minerals) will have a significant impact on the aggregation phenomena, and therefore, influence the ability of Al2O3 NPs to form stable dispersions in natural waters.
In particular, the roles of humic acid (HA) and clay minerals on the aggregation chemistry of Al2O3 NPs are of importance in natural water systems because these natural colloids are ubiquitous and present in much higher concentration than manufactured NPs in the environment [31]. Studies with NPs of TiO2 [32,33,34], zinc oxide [35], and magnetite [36,37] have shown that HA can significantly enhance NP stability and mobility through sorption on the mineral oxide surfaces. Upon coating the surfaces, aliphaticity and polarity of HA further affect the colloidal stability of Al2O3 NPs [38]. Smectite clays, such as montmorillonite, are 2:1 layered aluminosilicates, and have permanent negative (−) structural charges [39,40]. In addition, unique properties of clay minerals, such as swelling, intercalation, and ion-exchange, add complexity and heterogeneity in surface interactions with manufactured NPs, further affecting their fate and behavior in the environment [41]. Ultimately, all these surface interactions will impact the entry or uptake mode of Al2O3 NPs by aquatic organisms in the environment, and therefore, need to be systematically investigated.
The primary objective of this study was therefore to investigate the aggregation and stability phenomenon of commercially available γ-Al2O3 NPs as a function of the solution pH, ionic strength (with common monovalent and divalent salts, NaCl and CaCl2), as well as the presence of natural organic matter and clay minerals for better understanding of the colloidal behavior of Al2O3 NPs in aqueous environments. In this study, we characterized and tested three nominally different sizes of commercially available γ-Al2O3 NPs, including 5 nm, 10 nm, and 20–30 nm. Montmorillonite (a natural, swelling-smectite clay) and HA were used as model clay and model natural organic acid, respectively. In mixed systems with montmorillonite or HA, we chose to study three pH regions aligned with the point of zero charge (PZC) of Al2O3 NPs: pH = 5 (pH < PZC); pH = 7.5–8 (pH = PZC); and pH 10 (pH > PZC) to further investigate the pH-dependence on the NPs aggregation and stability in the presence of clay minerals or HA. The observed NPs aggregation in those mixed systems was then compared to aggregation in the systems without HA (or clay). We employed X-ray diffraction (XRD), transmission electron microscopy (TEM), dynamic light scattering (DLS) and inductively-coupled plasma optical emission spectrometry (ICP-OES) for the detailed material characterization and measurements. Our investigation suggests γ-Al2O3 NPs remain stable as small aggregates in most natural water conditions, except when solution pH is close to PZC or has high ionic strength. Even when pH approximates PZC, NPs became stable in the presence of HA or montmorillonite through surface modification. TEM images illustrate the dynamic natures of surface interactions between γ-Al2O3 NPs and natural colloids in aqueous environments.

2. Results and Discussion

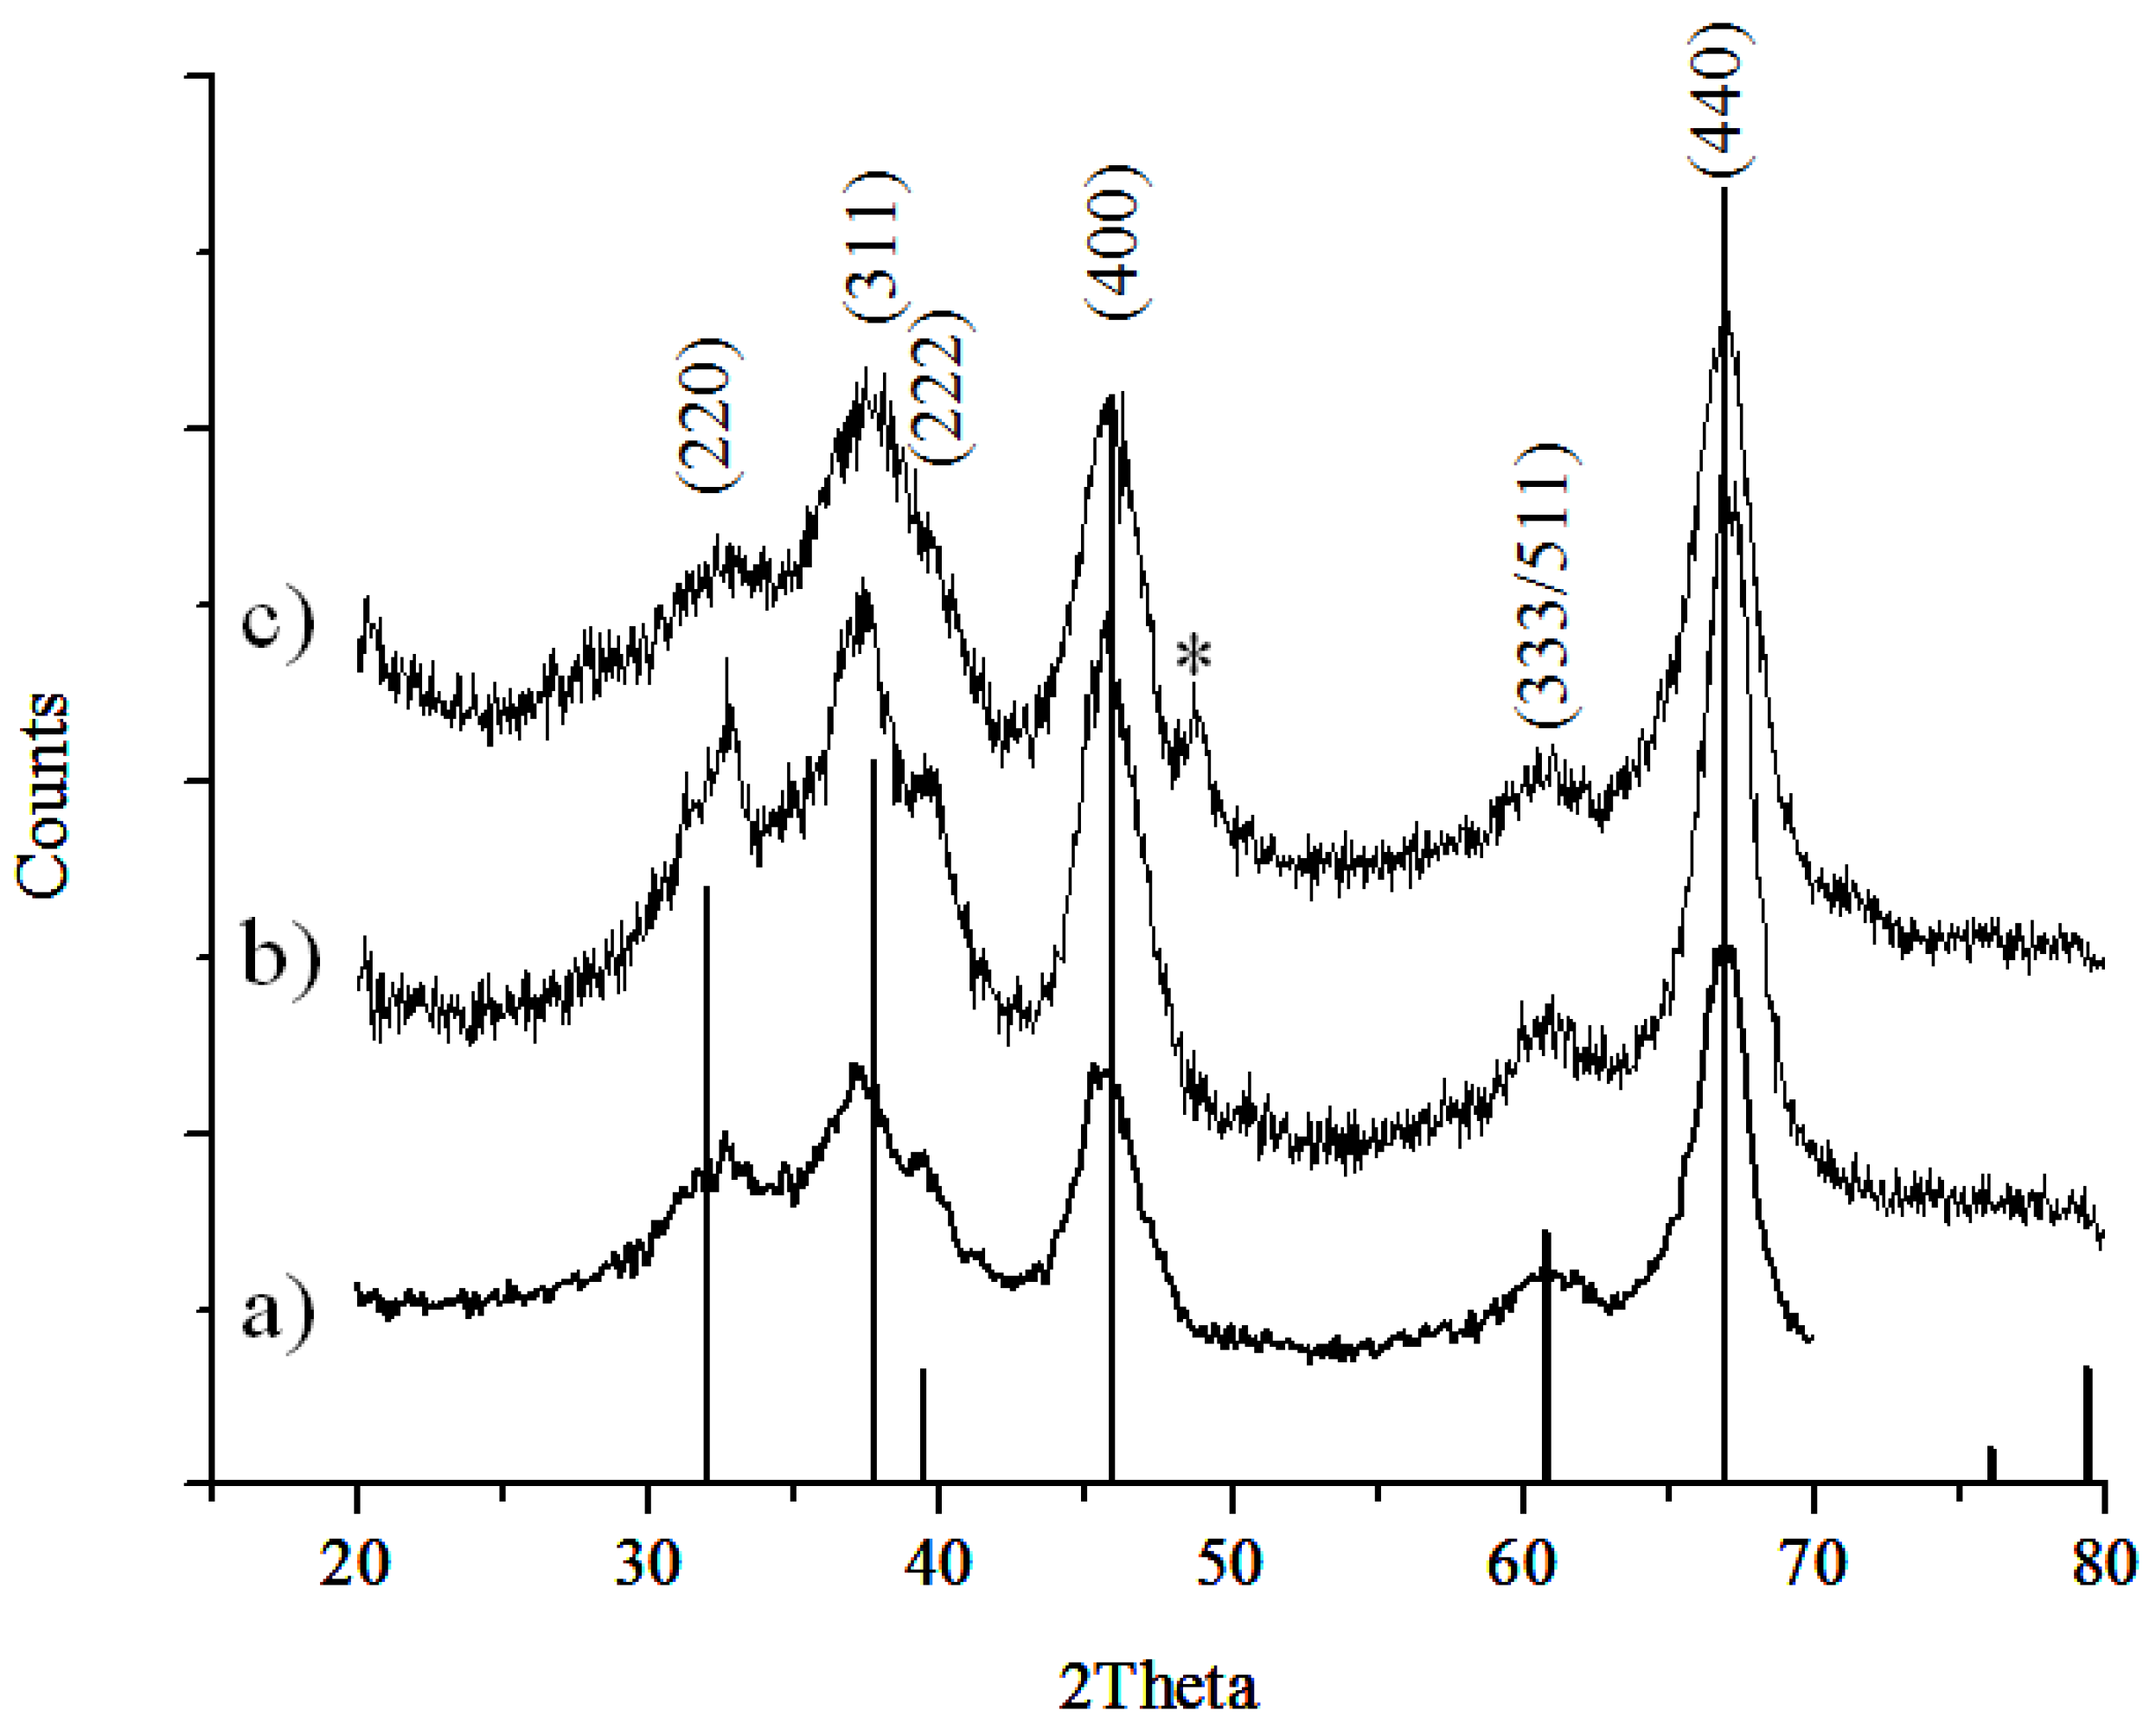
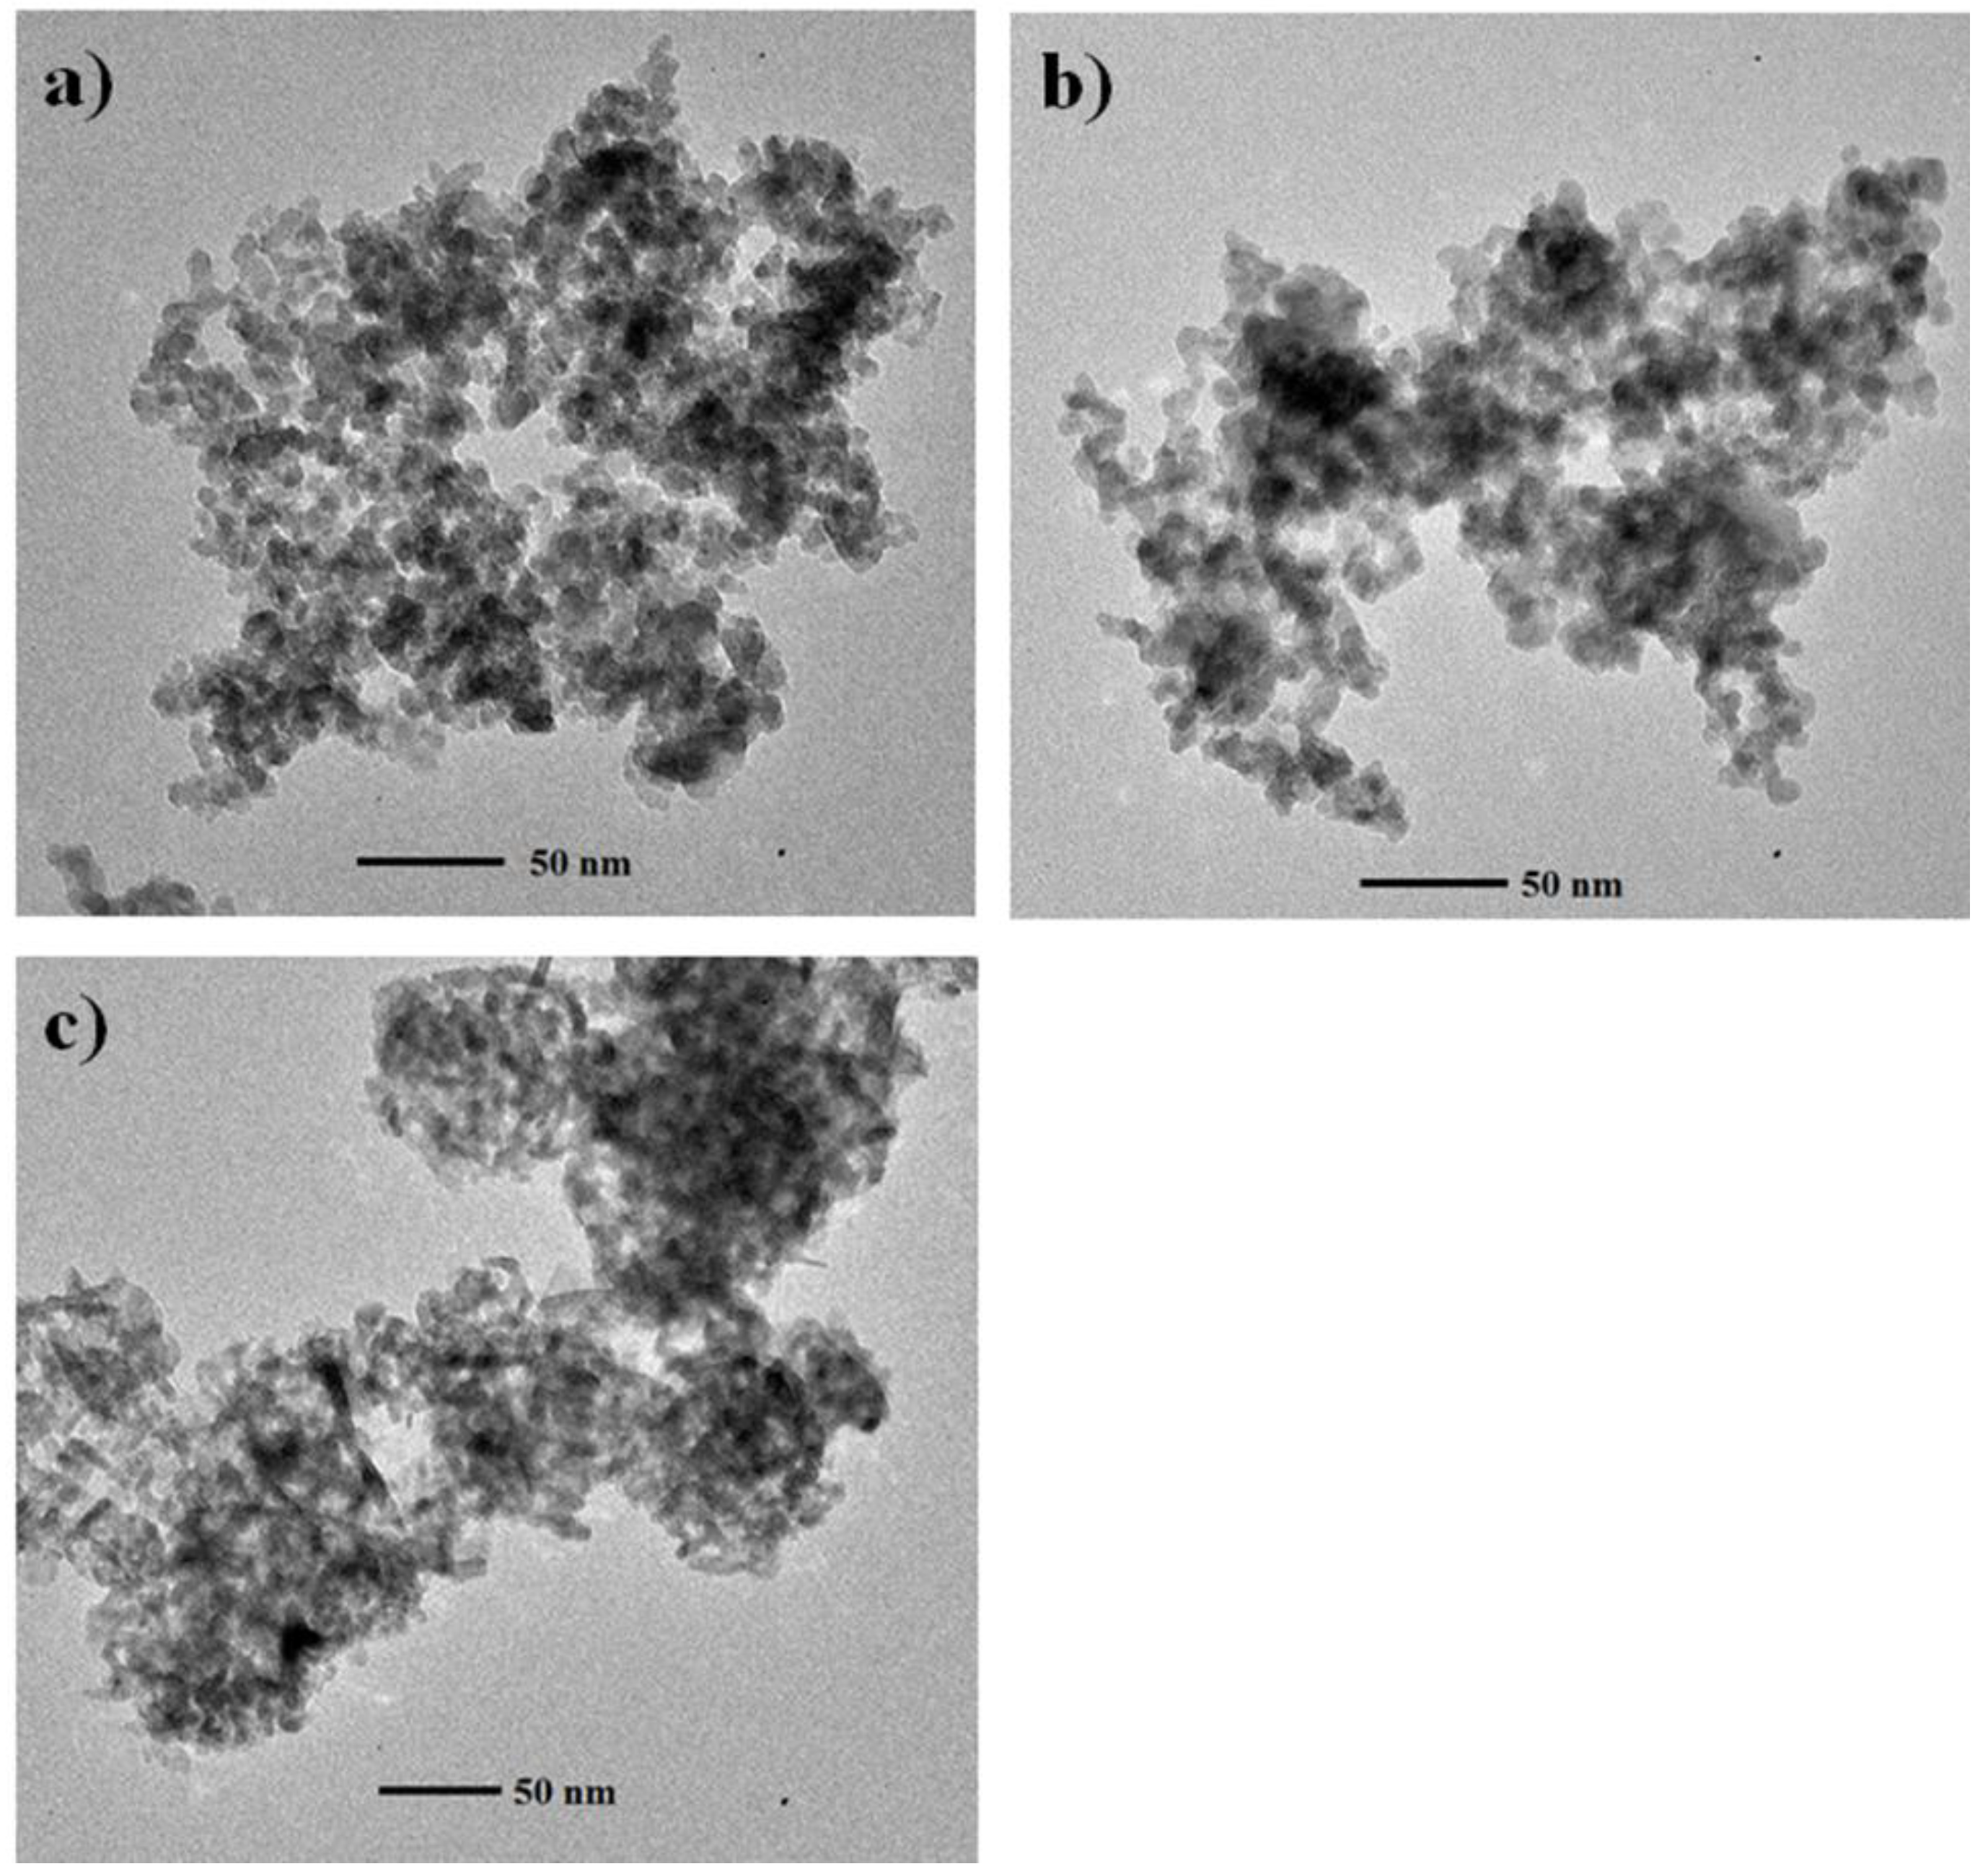
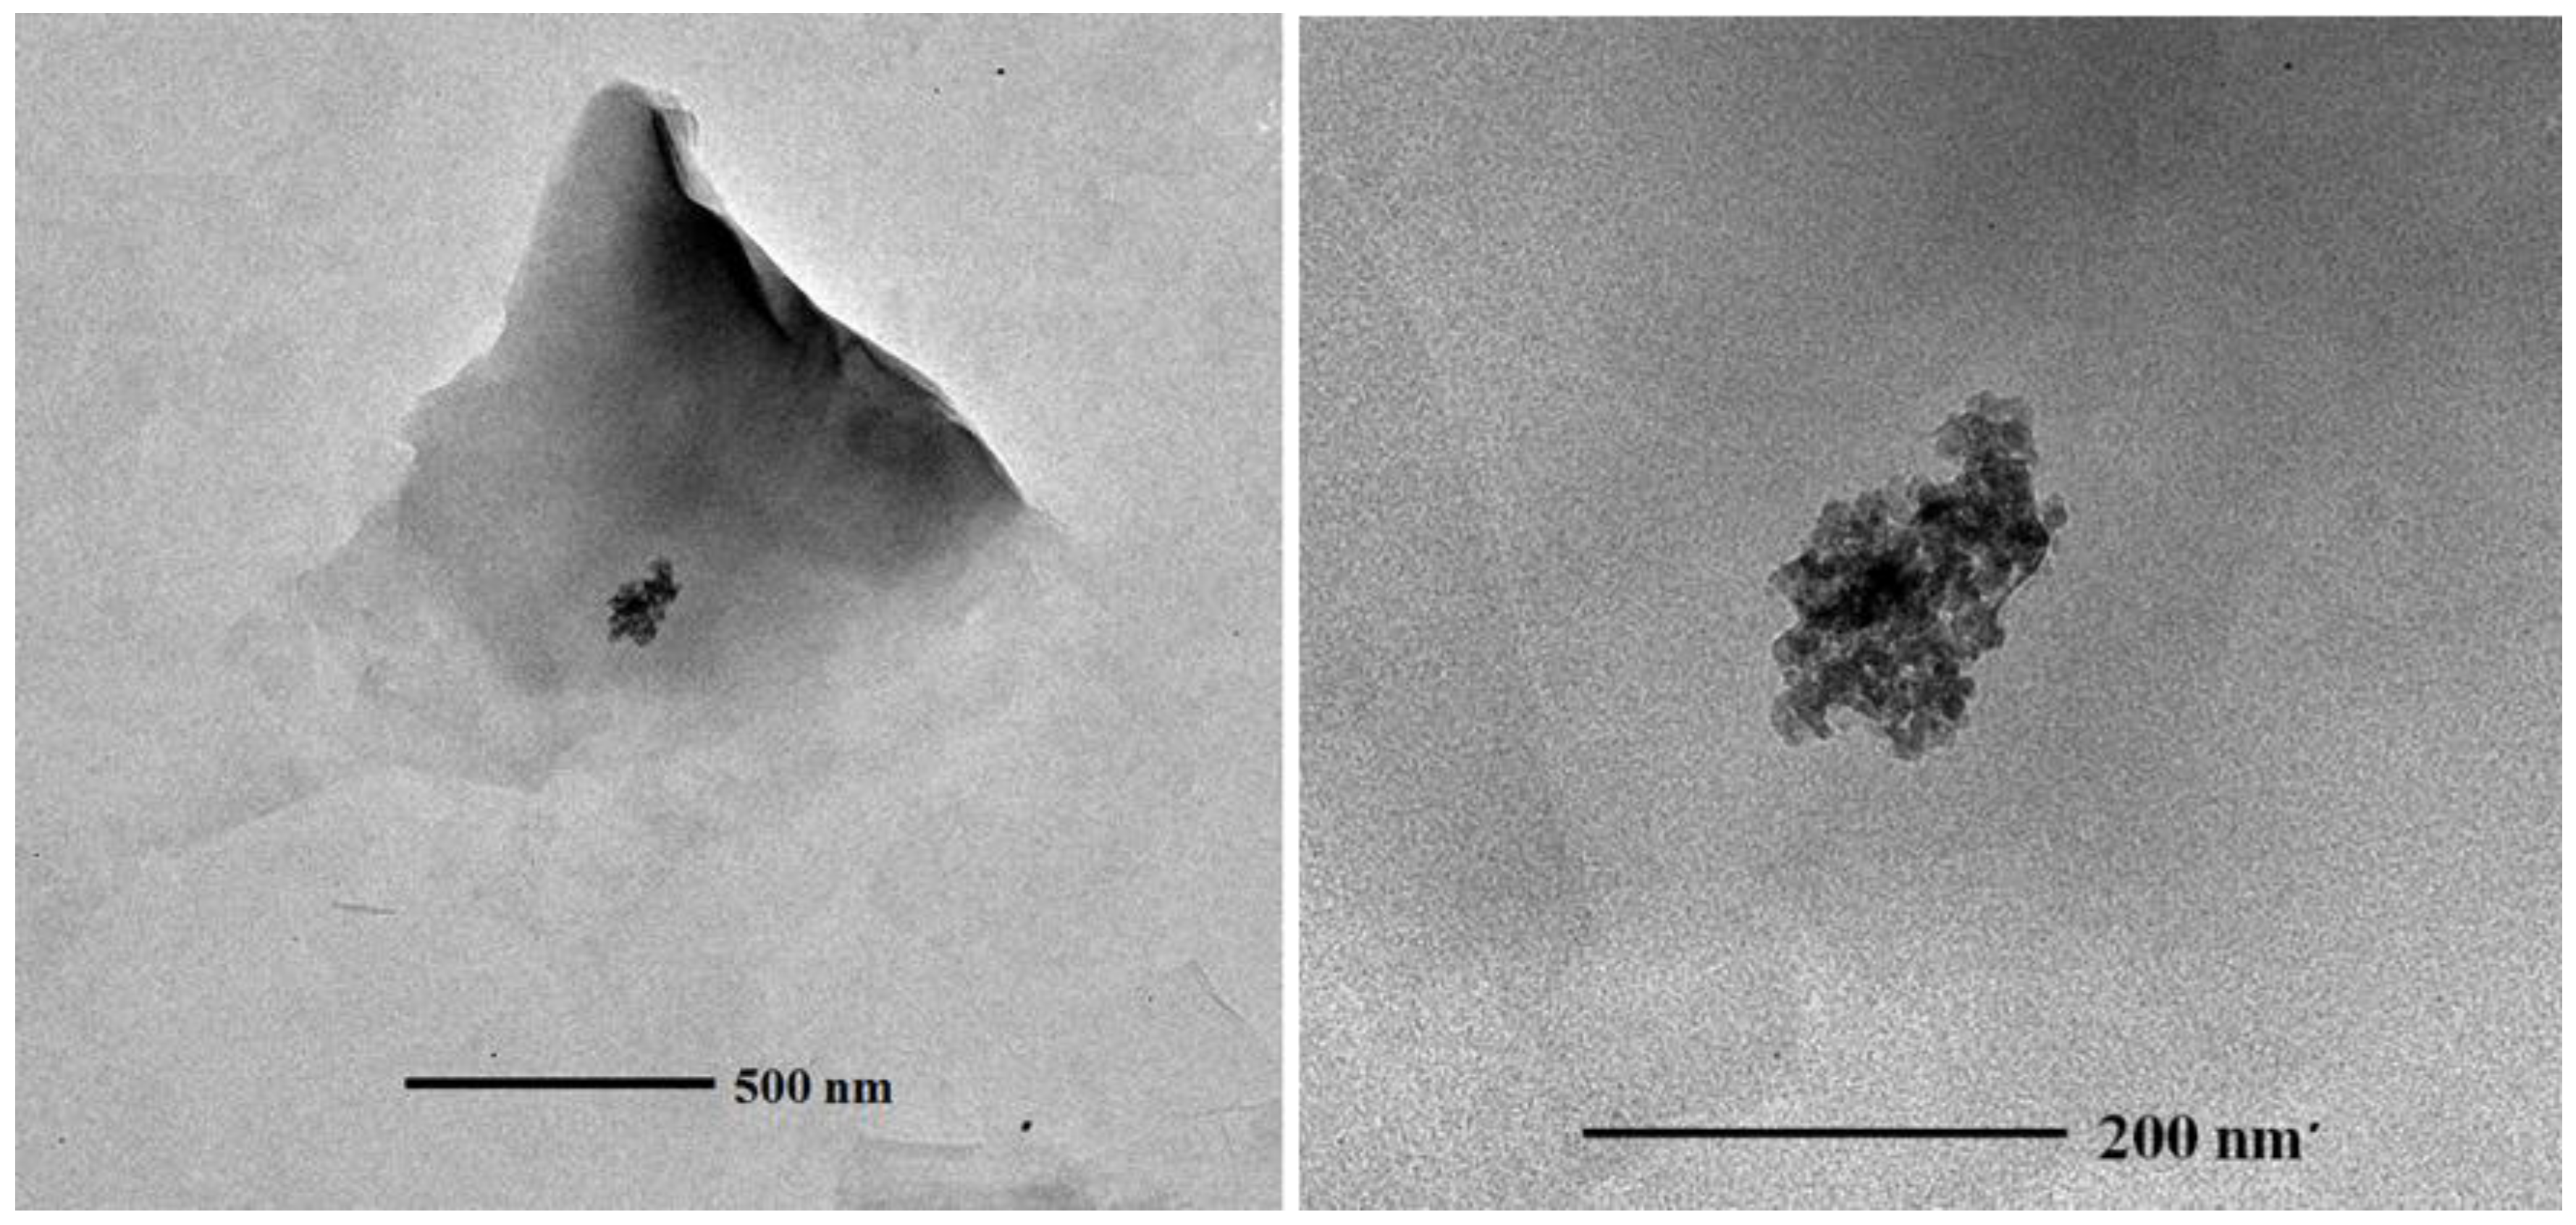
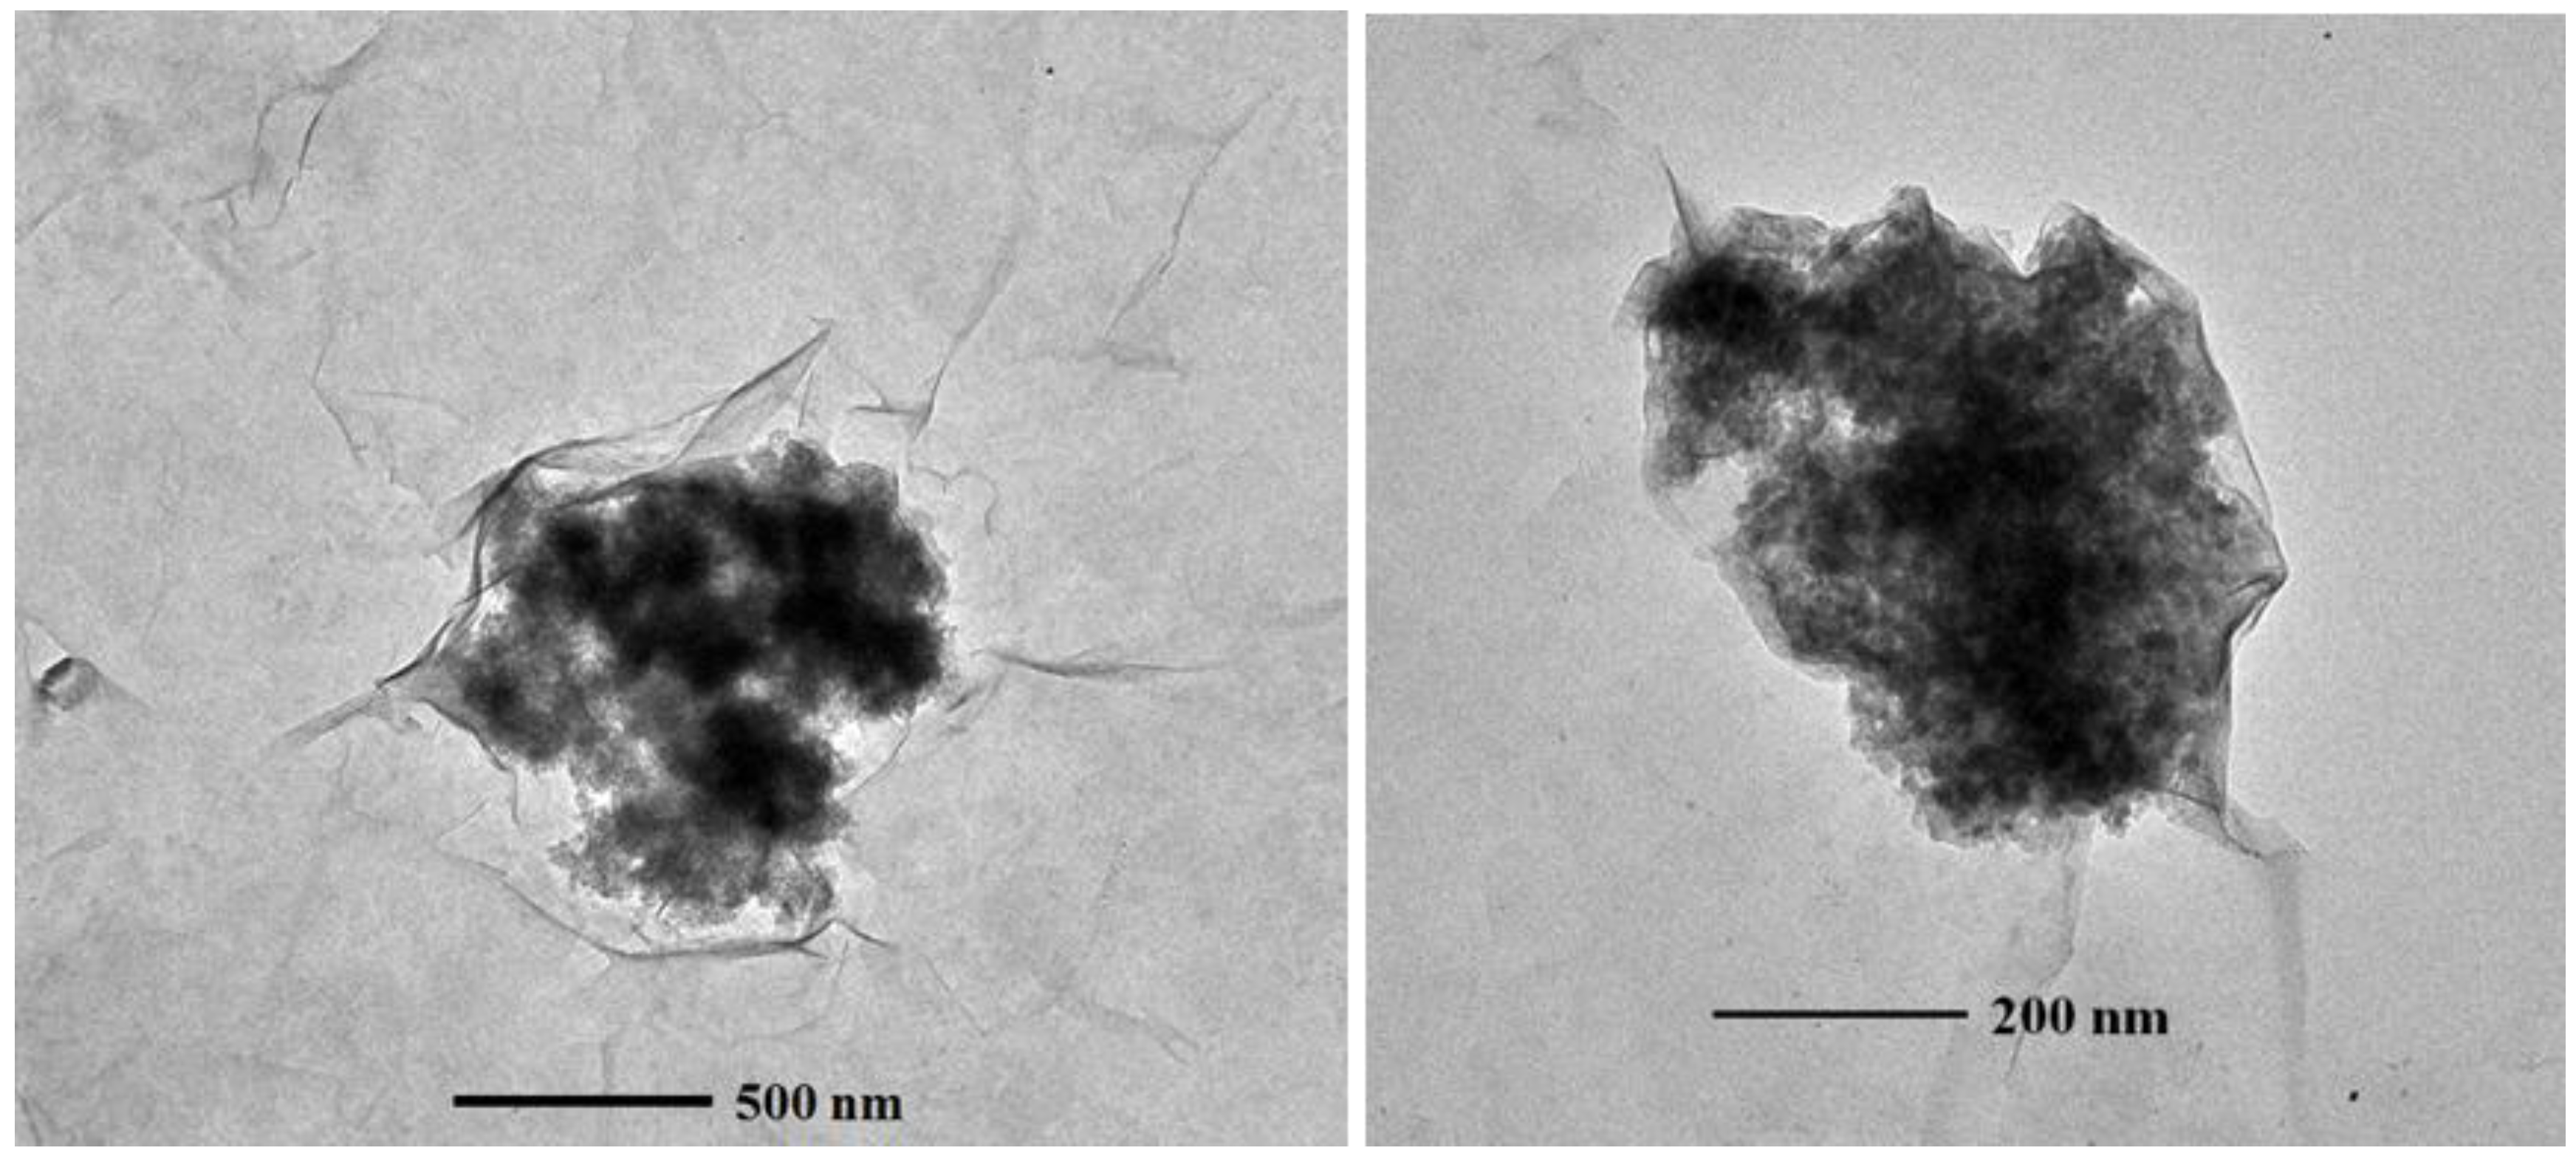
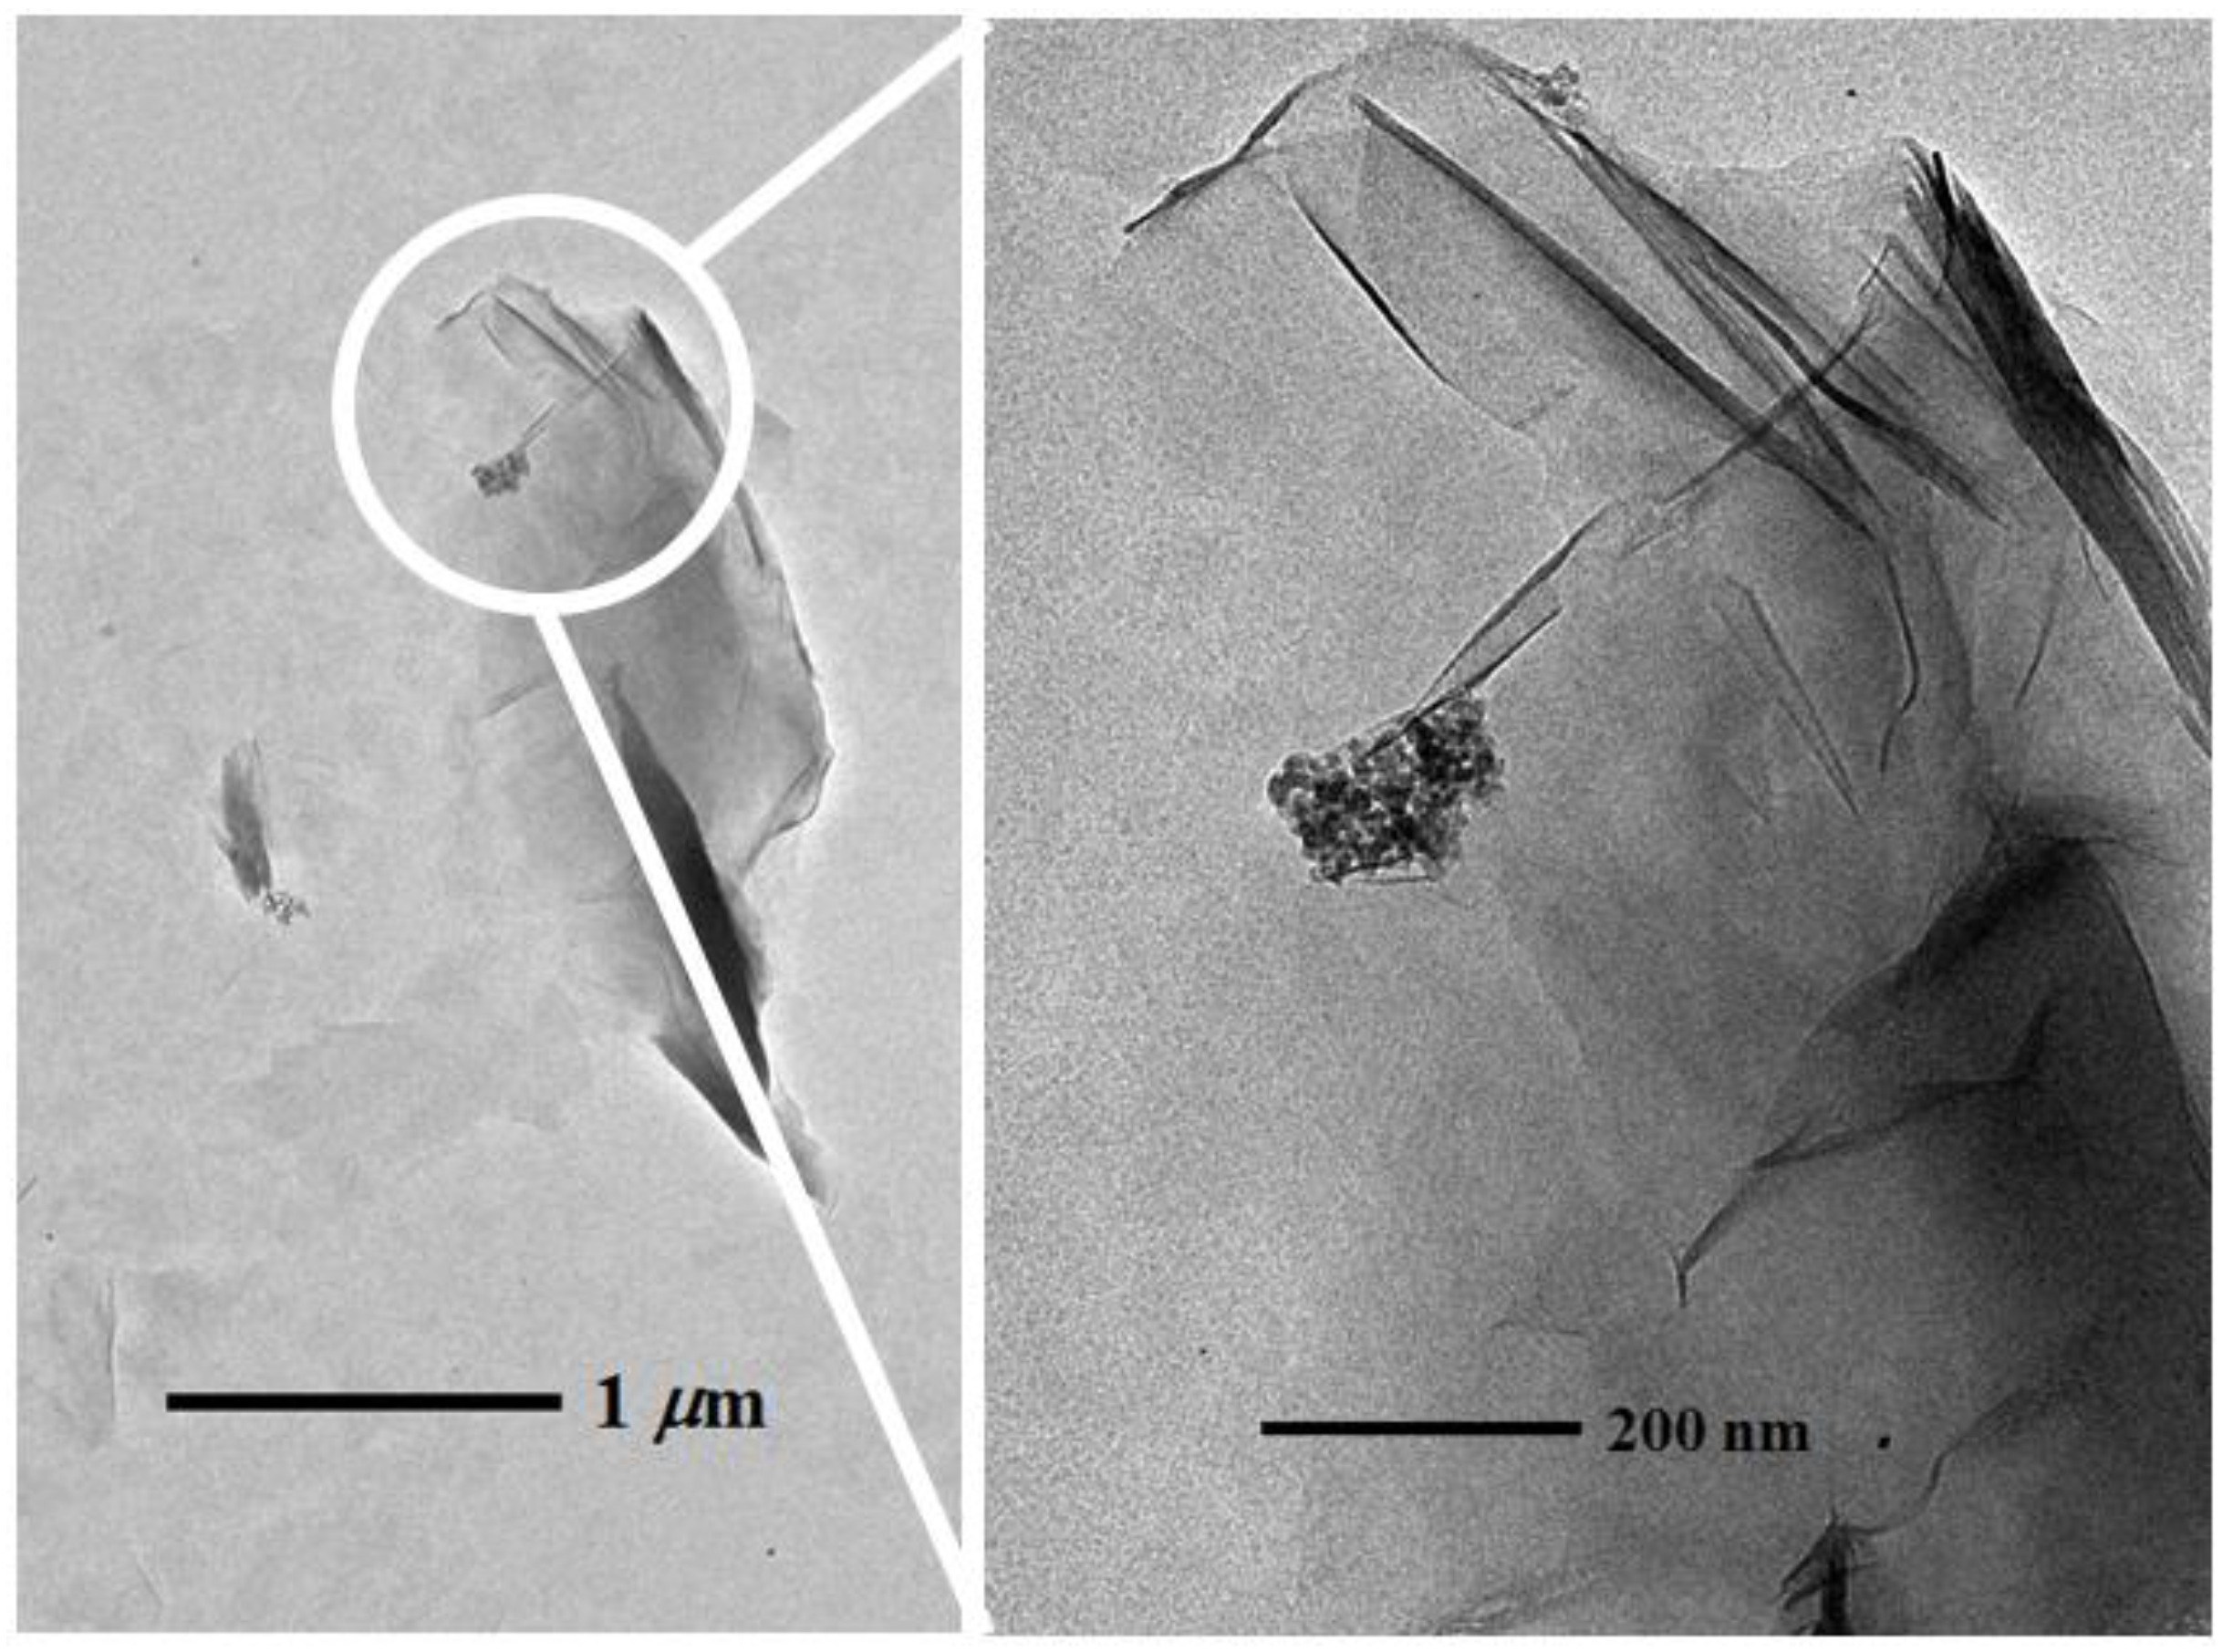
2.1. Material Characterization

Bulk crystal structure of the 5 nm, 10 nm, and 20–30 nm γ-Al2O3 NPs was determined using powder XRD analysis. The diffractograms of all γ-Al2O3 NPs samples display distinct diffraction peaks for γ-Al2O3 (ICDD JCPDS No. 98-000-0059; a spinel-type structure; space group Fd3m) [42,43,44], with all γ-Al2O3 NPs showing similarity in relative peak intensities (Figure 1). A trace amount of boehmite (AlOOH) (ICDD PDF 04-010-5683) was also detected for the 20–30 nm γ-Al2O3 (marked with asterisk in Figure 1c), indicating this particular sample of Al2O3 possesses mixtures of both minerals.
TEM was used to study the primary particle size and morphology of the γ-Al2O3 NPs. Bright field (BF) TEM images of the 5 nm, 10 nm, and 20–30 nm γ-Al2O3 NPs are given in Figure 2a–c. Average primary particle sizes for the 5 nm and 10 nm γ-Al2O3 NPs are 10.1 nm (±2.51) (total number of 762 NPs on three different TEM grids individually analyzed) and 10.8 nm (±2.38) (total number of 367 NPs on two different TEM grids), respectively. Both 5 and 10 nm γ-Al2O3 NPs have a (pseudo)spherical shape. In contrast, the 20–30 nm γ-Al2O3 NPs have a mixture of spherical and rod shapes, where spherical and rod NPs have an average primary particle size of 7.18 (±2.43) (total number of 200 NPs on two different TEM grids) and 13.5 nm (±5.52) (rod shapes count 24.5% of the total NPs identified), respectively. The 20–30 nm γ-Al2O3 NPs are heterogeneous in size, morphology, and structure when compared to the 5 and 10 nm γ-Al2O3 NPs.
Particle size, morphology and structure are often the most influential factors to control the environmental fate and behavior of NPs [45,46,47]. As shown, 5 and 10 nm γ-Al2O3 NPs possess quite similar physicochemical characteristics in size, morphology, and structure, although the manufacturers claim that the particles are different in size. The primary particle size of the 20–30 nm γ-Al2O3 NPs was measured to be much smaller than the 20–30 nm. Further, both XRD and TEM analyses agreed that the 20–30 nm γ-Al2O3 NPs were heterogeneous in terms of structure and particle morphology. Manufactured γ-Al2O3 NPs are produced by incinerating amorphous or boehmite precursors at temperatures between 350 and 400 °C [42]. However, incomplete incineration during the manufacturing process may result in incomplete transformation and yield mixtures of precursors and NPs in the final product. Thus, caution is strongly advised when using commercially available NPs for ecotoxicity studies without detailed size, morphology, and structure analysis. Although the results of the material characterization disagree with the manufacturer’s information about the average size of the commercial NPs, we named the 5, 10, and 20–30 nm γ-Al2O3 NPs in the present work based upon the size ranges claimed by manufacturers.

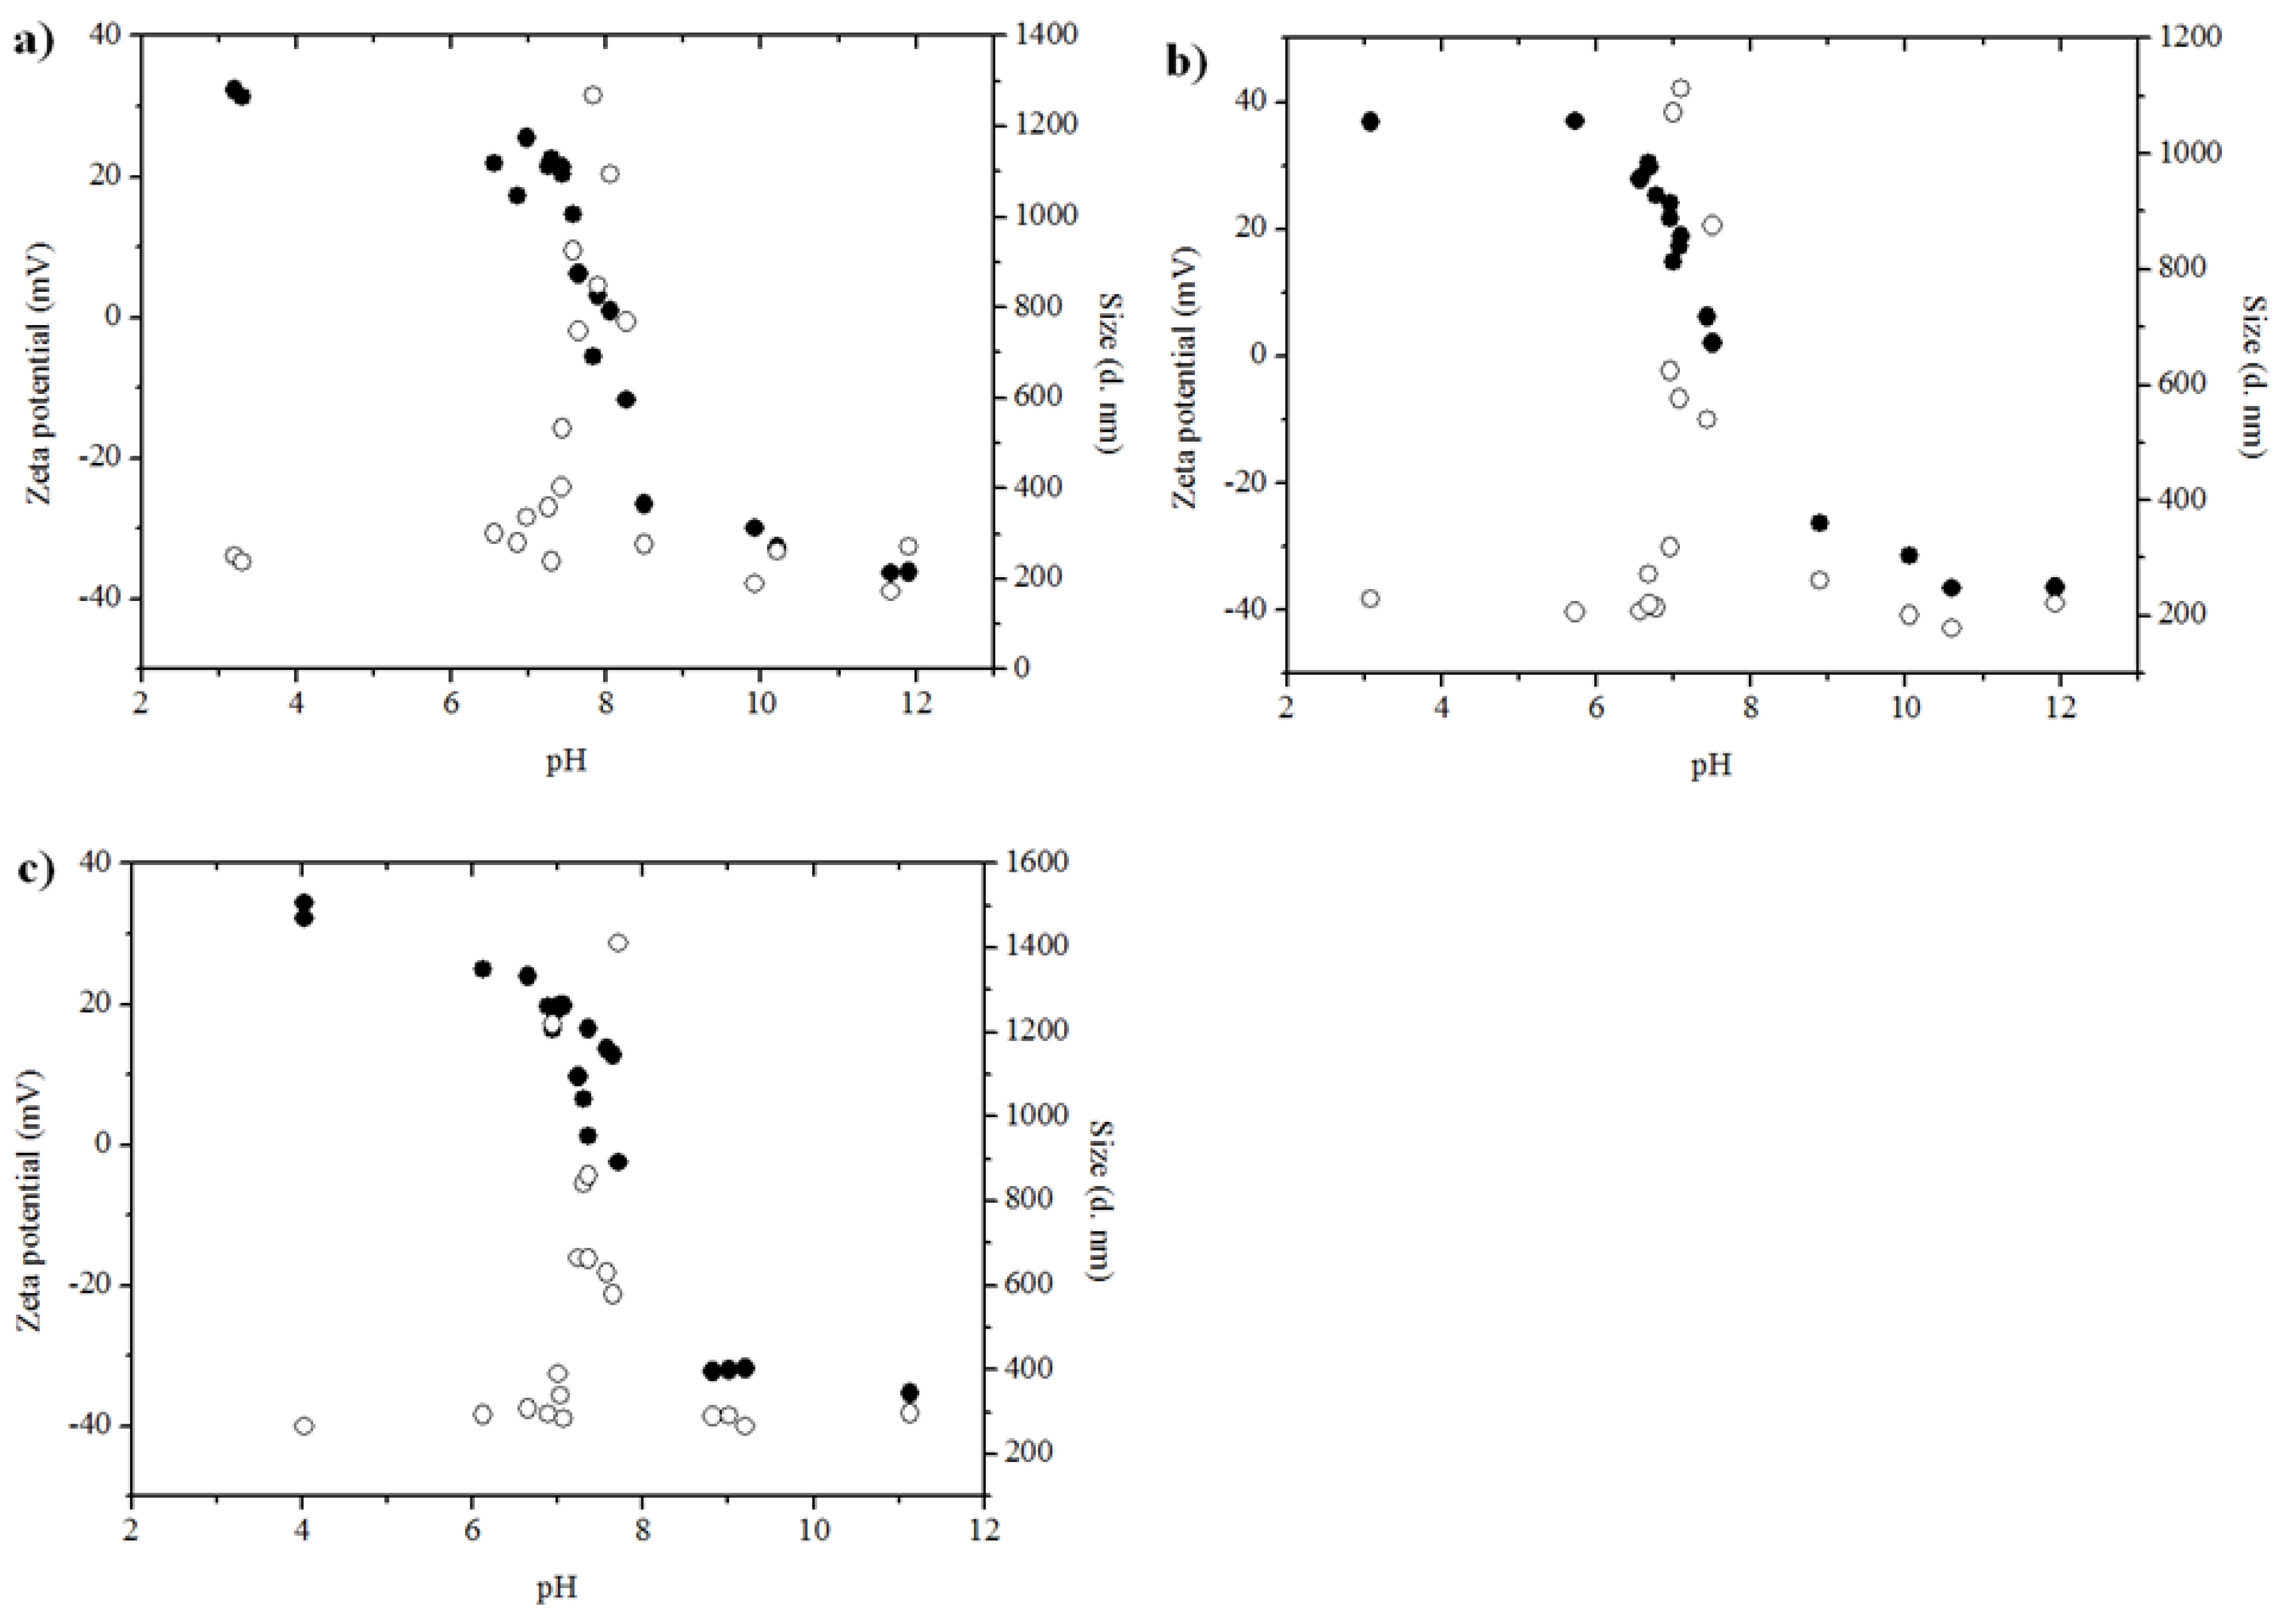
2.2. Influence of Solution pH on Aggregation of Al2O3 NPs

The surface charge (ζ potential) and z-average (Zave) hydrodynamic diameter of γ-Al2O3 NP aggregates were measured as a function of solution pH (ranging from pH 3 to pH 12) in a dilute NaCl solution (1 mM NaCl). The relationship between ζ potential and Zave of γ-Al2O3 NP aggregates in solution was explored by plotting the measurements (without standard deviation) collected over the range of tested pHs (Figure 3).
All the γ-Al2O3 NPs show positive ζ potential values of 31.3–37.0 mV in acidic solution pH. The ζ potential decreased with increasing pH of the solution and reached the point of zero charge (PZC) at pH 7.5 to pH 8, which is in a good agreement with the literature [30]. By increasing the pH further, ζ potential becomes negative and remains negative at −35.3 to −36.5 mV through pH 12.
The Zave diameter of γ-Al2O3 NP aggregates was in the size range of 202 to 266 nm (polydispersity index (PDI), 0.199–0.210) in acidic solutions (pH < PZC). Then, a rapid increase in Zave diameter of γ-Al2O3 NP aggregates was observed near the PZC, reaching a maximum value of 1113 to 1412 nm (PDI, 0.171–0.232). This reflects the enhanced aggregation of γ-Al2O3 NPs as a result of surface charge neutralization near the PZC. BF TEM images of 10 nm γ-Al2O3 NPs at PZC are provided in Figure S1, as a representative aggregate of all three γ-Al2O3 NPs studied in this work. The images show large aggregates of Al2O3 NPs (1020 to 1180 nm) with a very dense aggregate structure at PZC. Then, in basic solutions (pH > PZC), the Zave diameter of γ-Al2O3 NP aggregates ranged from 172 to 297 nm (PDI, 0.134–0.395), displaying similar size ranges as for acidic solutions.
All γ-Al2O3 NPs present very similar trends of ζ potential and Zave diameter as a function of pH, i.e., there was no apparent size-dependent aggregation behavior of γ-Al2O3 NPs in pH titration curves. This is not surprising because XRD and TEM characterization indicated that the 5 nm and 10 nm γ-Al2O3 NPs do not have significantly different particle size and morphologies. Therefore, γ-Al2O3 NPs are either positively or negatively charged, and remain stable as small aggregates in solution except for a narrow pH region near the PZC (pH 7.5–8).

2.3. Influence of Ionic Strength on Aggregation of Al2O3 NPs

Two electrolyte solutions, NaCl and CaCl2, were used to examine the effect of ionic strength on γ-Al2O3 NP aggregation through DLS measurements. The same γ-Al2O3 NP concentration (614 mg·L−1) was used in all tests with NaCl or CaCl2 concentration ranges of 1 to 1000 mM. Typical Na+ concentrations in natural waters range from 43 μM (e.g., rain and river water) to 485 mM (e.g., seawater) and typical Ca2+ concentrations range from 25 μM to 11 mM, respectively. Therefore, the concentration ranges tested in this study suitably cover natural water conditions [48]. The pH of the electrolyte solutions was checked regularly to make sure the pH was consistent and much lower (5.7–6.2) than the PZC of the γ-Al2O3 NPs.
Figure 4 presents Zave measurements of γ-Al2O3 NPs as a function of solution ionic strength. The concentration ranges are equivalent to solution ionic strength of NaCl from 1 to 1000 mM, and of CaCl2 from 3 to 3000 mM. As shown, Zave measurements of γ-Al2O3 NPs do not show significant aggregation at low and medium ionic strength conditions. However, a significant increase in the Zave diameter was evident at 1000 mM for NaCl (the highest NaCl treatment in this study) (Figure 4a) and beginning at 300 mM with an increasing aggregation size through 3000 mM for CaCl2 (Figure 4b). The size distribution increased (i.e., increasing standard deviation) as a function of increasing ionic strength for all the γ-Al2O3 NPs. The 5 nm γ-Al2O3 NPs had the largest Zave among all γ-Al2O3 NPs at 1000 mM of NaCl or 3000 mM of CaCl2.
Positive ζ potential values were measured for all the γ-Al2O3 NPs regardless of the solution type and ionic strength, but ζ potential values were significantly lower at the highest ionic strength (Figure 4c,d). The decrease in ζ potential is congruent with an increase in Zave diameter of γ-Al2O3 NP aggregates at higher ionic strength. All the γ-Al2O3 NPs present very similar trends in both ζ potential and size measurements. In general, increasing the ionic strength of the electrolyte solution compresses the diffused layer associated with the NPs, resulting in lowered ζ potential on the surfaces and diminished repulsions between NPs, and therefore, promoting particle aggregation. Similar observation was also made for several metal oxide NPs, including γ-Al2O3 [49], magnetite (Fe3O4) [36], TiO2 [50,51], and cerium oxide (CeO2) [52]. Thus, the presence of Na+ and Ca2+ will have a significant impact on the particle surface charges and thereby, particle aggregation, in natural waters where pH is lower than PZC.

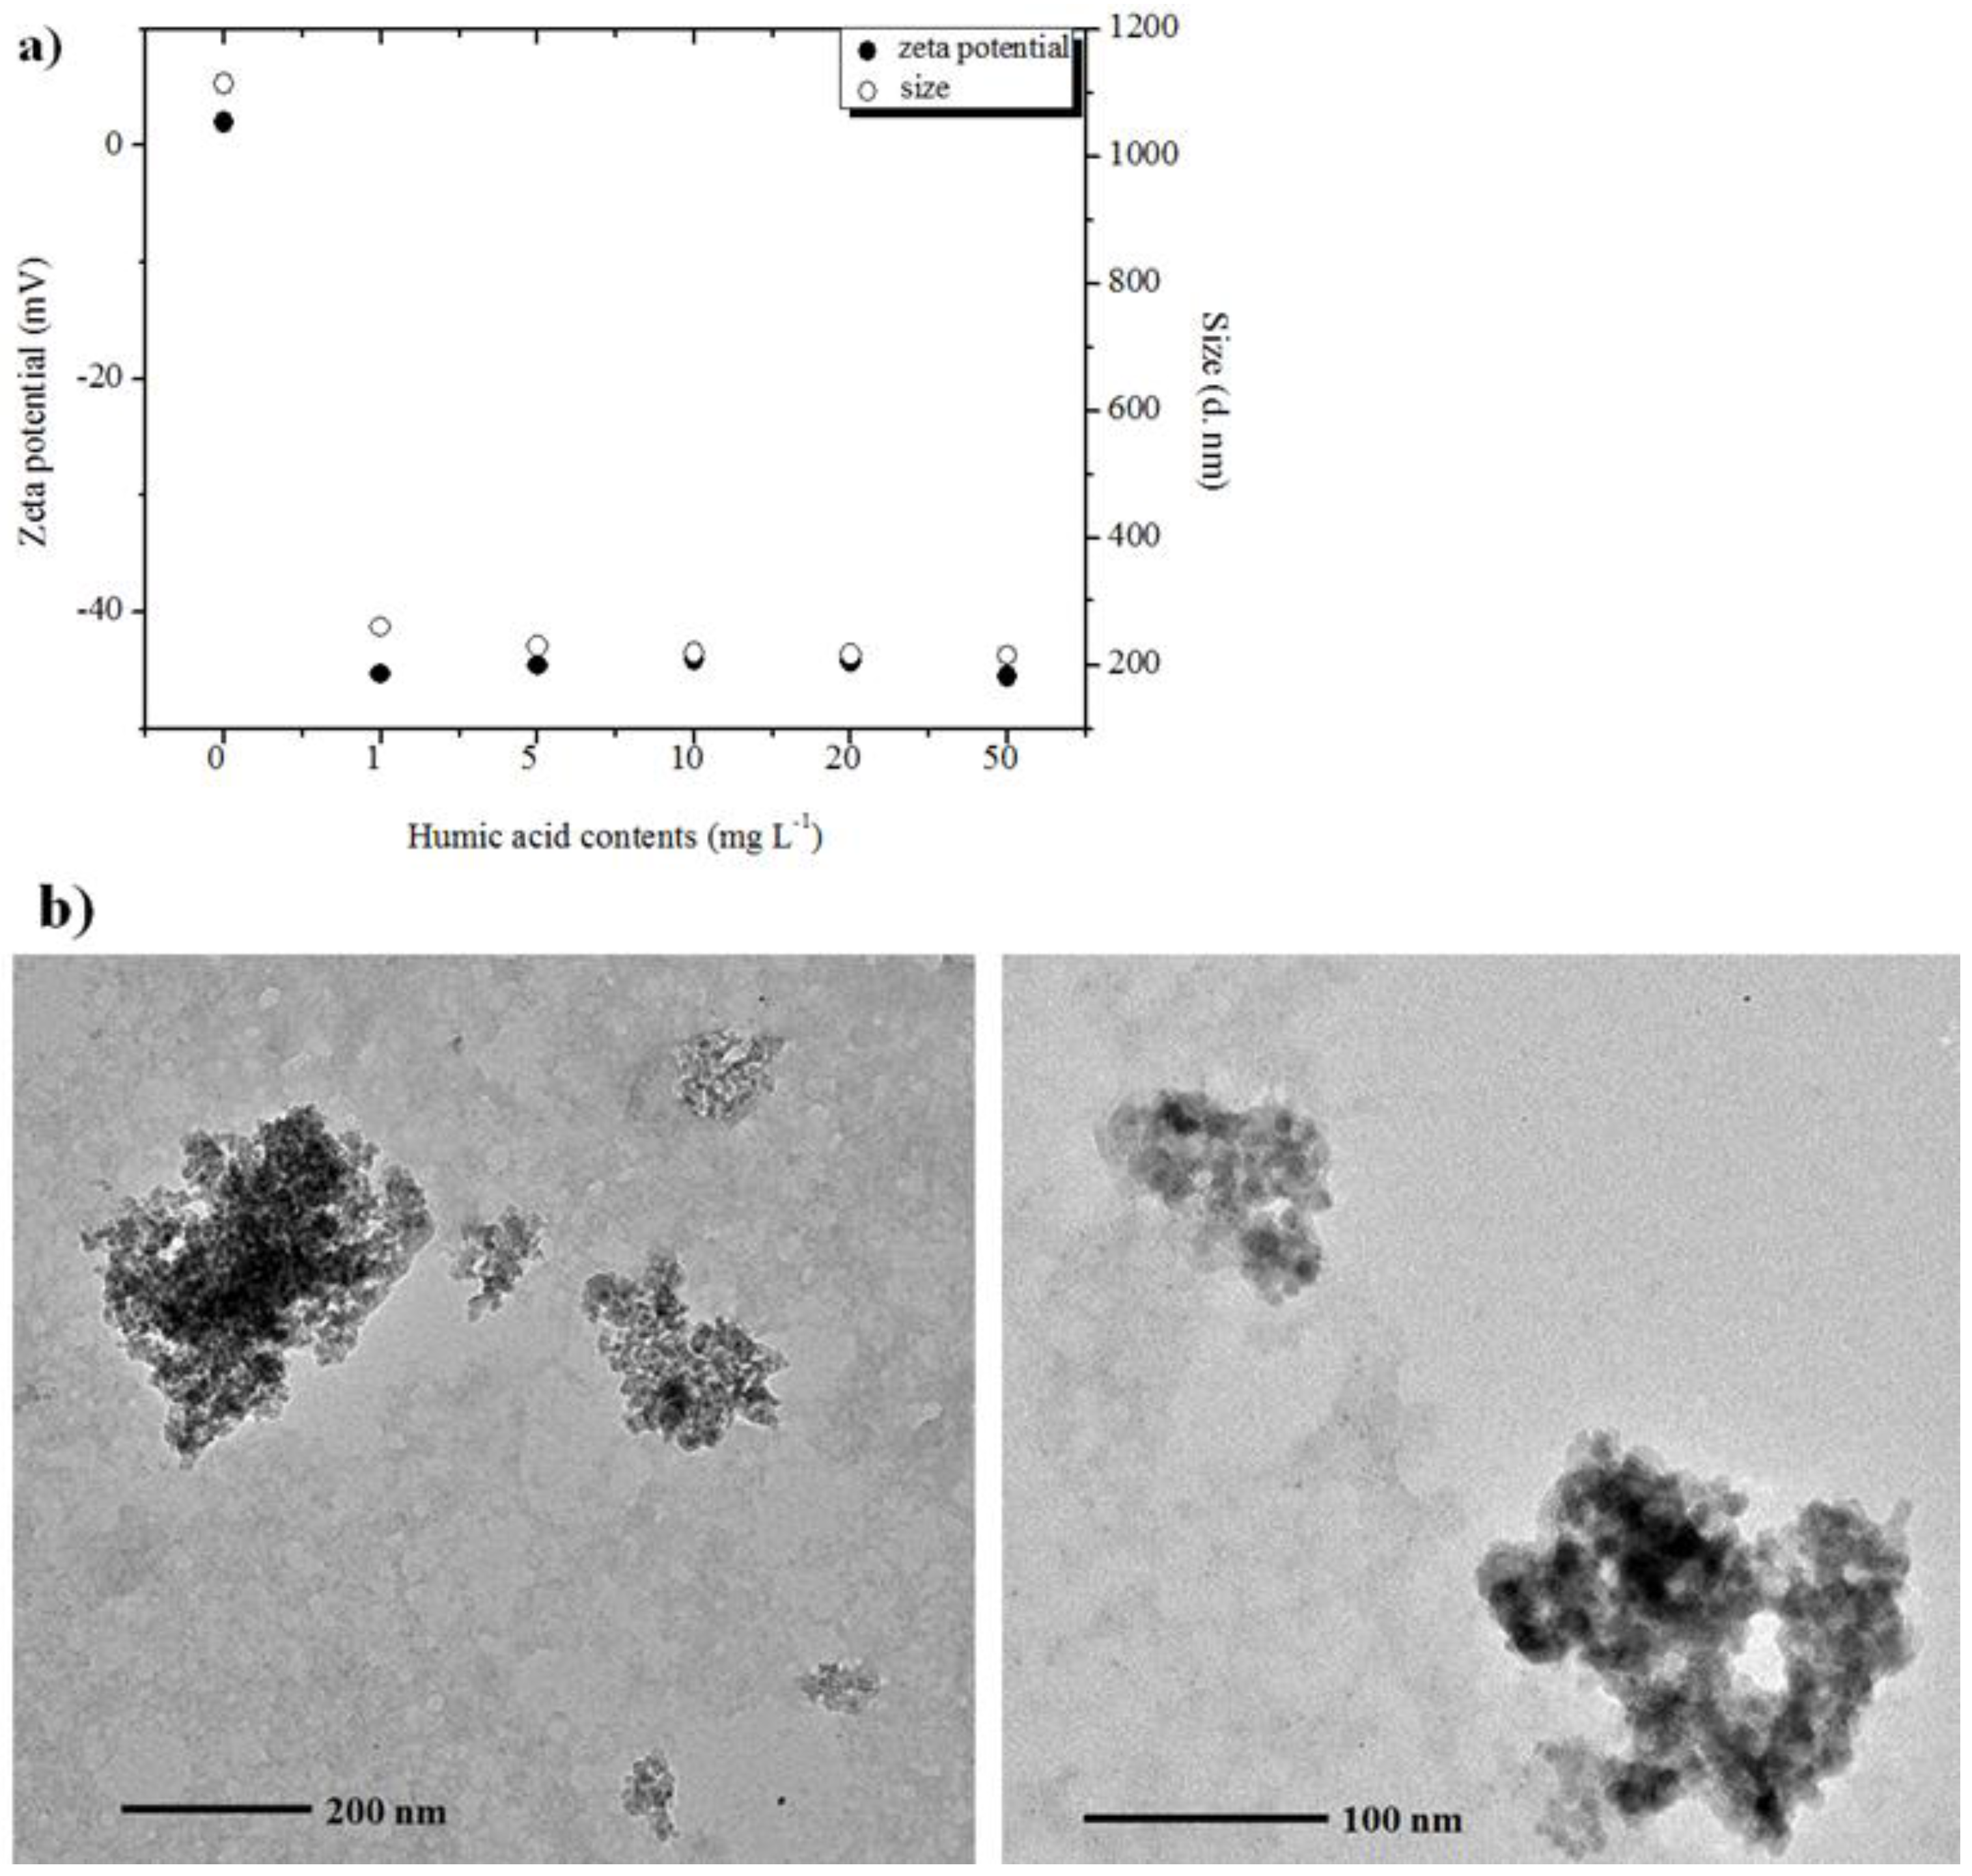
2.4. Influence of Humic Acid on Aggregation of Al2O3 NPs

The effect of humic acid (HA) concentration (1, 5, 10, 20, and 50 mg·L−1) on the aggregation and stabilization of 10 nm γ-Al2O3 NPs was studied under three different pHs: pH < PZC; pH = PZC; and pH > PZC. 10 nm γ-Al2O3 NPs were chosen because their size, morphology, and structure were well defined and uniform such that the treatment effects could be attributed to solution pH and HA concentration but not variation in NP properties. In the absence of HA, 10 nm γ-Al2O3 NPs form large aggregates up to 1113 nm at PZC (Figure S1).
HA possesses a negative surface charge (−28.0 to −49.0 mV) from pH 4 to 12, with a Zave diameter ranging from 198 to 283 nm (PDI = 0.369–0.474). In solution with pH at or below PZC, γ-Al2O3 NPs are positively charged or nearly neutral (~2 mV), whereas HA is negatively charged. All HA treatments resulted in a significant decrease in both the size and ζ potential of γ-Al2O3 NP aggregates, indicating dramatic changes in surface properties of the Al2O3 NPs in the presence of HA through electrostatic interaction. Figure 5a presents both the ζ potential and the size of γ-Al2O3 NP aggregates in the mixed system with HA at pH = PZC. HA likely increases NP stability through surface modification by electrostatic interactions as evidenced by a significant decreasing trend in both size and ζ measurements. This trend continues with increasing HA in the mixed system, although the trend appears to reach a plateau around 10 mg·L−1 of HA. Therefore, 10 nm, γ-Al2O3 NPs with 10 mg·L−1 of HA were chosen for imaging of the aggregate structures by TEM. A kinetic study with HA and Al2O3 reported different adsorption rates of HA on Al2O3 by solution pH [53]. For example, the adsorption of HA on Al2O3 surfaces readily occurs in low pH (~5) through electrostatic interactions. However, when solution pH increases, an electrostatic barrier develops between the negative surfaces of HA and Al2O3 and the sorption process is strongly inhibited, thereby significantly lowering the adsorption rate.
Representative BF TEM images are given in Figure 5b. In these images, small aggregates of γ-Al2O3 NPs show with dark contrast, while organic-rich HA matrix provides a lighter, patchy background. In the presence of HA, the sizes of γ-Al2O3 NP aggregates ranged from 75 to 358 nm at pH = PZC, which are much smaller than the sizes of NP aggregates at PZC in the absence of HA. In addition, γ-Al2O3 NP aggregates appeared to be isolated or compartmentalized by HA, which may prevent them from forming larger aggregates at that particular pH. Excess HA therefore enhances stability of Al2O3 NPs at PZC through combined effects of electrostatic interactions and steric hindrance. However, when pH is higher than PZC, both γ-Al2O3 NPs and HA are negatively charged and little interaction between them is expected. TEM images show the NPs and HA acting as separate identities in the suspension, suggesting very little interaction when pH is higher than PZC (Figure S2).

2.5. Influence of Montmorillonite on Aggregation of Al2O3 NPs

Montmorillonite, a swelling-smectite clay, possesses permanent negative charges on the basal planes due to isomorphic substitution of the Si and Al ions in the structure, as well as conditional charges at the amphoteric edge sites (mainly, Si-OH and Al-OH) [54,55]. The ζ potential measurements on montmorillonite in this study are also in line, presenting all negative values of −27.3 to −40.3 mV in solutions of pH 3.2 to 11, with a decreasing trend as pH increases (Figure S3). The PZC of the edge groups on montmorillonite is estimated at pH ~6.5 [40,56]. Therefore, dissociation of surface hydroxyl groups at edge sites is expected to occur when pH is higher than 6.5, contributing more net negative surface charges to the ζ potential measurement. BF TEM images of montmorillonite alone at pH 7.5 to 8 (i.e., PZC of Al2O3 NPs) were provided in Figure S4. As shown, individual montmorillonite clay platelets have an irregular polygonal shape and display a combination of parallel stacked platelets and randomly oriented platelet patches. Individual clay platelets are only a few nanometers thick. However, once they form stacks and patches, clay platelets produce thicker sample regions for TEM analysis, which result in relatively dark contrast on those images [57]. It is also worth mentioning that dehydration of hydrated structures of clay minerals in the TEM vacuum or electron beam damage may occur during the TEM analysis, producing artifacts in the results [57].
The influence of montmorillonite (at 0.05 Al2O3 NPs to clay ratio (w/w)) on the aggregation and stability of the 10 nm γ-Al2O3 NPs was studied in the mixed system under three different pHs: pH = 5.6 (pH < PZC of Al2O3 NPs); pH = 7.5 to 8 (pH = PZC of Al2O3 NPs); and pH = 9.0 (pH > PZC of Al2O3 NPs). The ratio of Al2O3 NPs to clay was chosen to simulate the clay minerals being dominated in aqueous environments (i.e., clay minerals are present at much larger concentrations than the manufactured Al2O3 NPs in environmental settings) [31]. At low pH (<PZC of Al2O3 NPs), 10 nm γ-Al2O3 NPs are positively charged, the montmorillonite are negatively charged, and most of the negative surface charges are from their basal planes. The ζ potential measurement in the mixed system at low pH is negative (−35.2 ± 1.98 mV), indicating that montmorillonite has a significant interaction with positively-charged γ-Al2O3 NPs. Representative BF TEM images of montmorillonite with γ-Al2O3 NPs are given in Figure 6, where the interaction of the basal planes of montmorillonite with γ-Al2O3 NPs is evident. At PZC of Al2O3 NPs, both the basal planes and edges of montmorillonite are expected to be negatively charged. The ζ potential measurement in the mixed system is −34.7 (±0.07 mV). At PZC, γ-Al2O3 NPs is neutral or slightly positive (~2 mV). Figure 7 shows BF TEM images of montmorillonite with γ-Al2O3 NPs where the edge sites of montmorillonite are the dominant places of interaction with γ-Al2O3 NPs. At higher pHs (>PZC of Al2O3 NPs), both γ-Al2O3 NPs and montmorillonite are negatively charged, and therefore, the ζ potential measurement of the mixed system is also negative (−34.9 ± 0.57 mV). Similar to the HA system, very limited interaction of γ-Al2O3 NPs with montmorillonite was found in higher pH regions. Representative BF TEM images of montmorillonite with γ-Al2O3 NPs at/above PZC of Al2O3 NPs are given in Figure 8.
The role of basal planes and edge sites of montmorillonite clays seems important in the mixed system, especially at low pH (<6) or at PZC of Al2O3 NPs (pH 7.5 to 8), as Al2O3 NP aggregates appeared to be placed on the basal planes or surrounded by sheet edges or pockets of clay platelets on the TEM images. However, at high pH, their interaction is quite limited, where Al2O3 NP aggregates are found dangling at the clay edge sites on the TEM images.

3. Experimental Section

3.1. Materials

5 nm γ-Al2O3 NPs (99.99%) were purchased from US Research Nanomaterials, Inc. (Houston, TX, USA) in powder form. 10 nm (99.99%) and 20 to 30 nm (99.97%) were purchased from Nanostructured & Amorphous Materials, Inc. (Houston, TX, USA). All γ-Al2O3 NP stock solutions were made to achieve the target concentration of 614 mg·L−1 in 1 mM NaCl solution by using a probe sonicator (Sonic Dismembrator Model 100, Fisher Scientific Inc., Pittsburgh, PA, USA) for 30 min. 1 mM of NaCl served as a background, except for the experiments with the electrolyte solutions having varying ionic strength. For the ionic strength experiments, the γ-Al2O3 NPs stock solution was made in 1, 10, 100, and 1000 mM of NaCl or CaCl2 by sonication. A fresh stock NP suspension was made and used for each set of the experiments.
The HA stock solution was prepared by using 10 g·L−1 of HA, sodium salt (technical grade, CAS# 68131-04-4, Sigma-Aldrich Corp., Saint Louis, MO, USA) in 1 mM NaCl solution with stirring for 24 h before the day of the experiment. The HA stock solution was then filtered through a Whatman® ashless filter paper (Grade 42) (Fisher Scientific Inc., Nazareth, PA, USA), and stored in the dark prior to its use. Without pH adjustment, the HA stock solution was approximately pH 10.0. For the mixed system with Al2O3 NPs, the HA stock solution was diluted in a systematic manner to reach the total organic carbon (TOC) concentrations of 1, 5, 10, 20 and 50 mg·L−1 at target pHs of 4, 8, and 10.
A clay suspension was prepared by allowing several grams of montmorillonite powder (Bentonite clay, 200-mesh, #460438, Ward’s Science, Rochester, NY, USA) to settle in a 1000 mL graduate cylinder for 8 h. After 8 h, the top 10 cm of supernatant that contains only the clay-sized (<2 μm) fraction of the original material was siphoned from the cylinder. For the mixed system with Al2O3 NPs, 0.05 weight to weight ratio (w/w) of Al2O3 to montmorillonite was chosen for the present study to closely simulate the most of natural settings (i.e., clays being dominant by mass). Dilute hydrochloric acid and sodium hydroxide solutions were used to adjust the pH of the solutions. All the solutions were made with NANOpure® water (18.2 MΩ·cm water with 1–5 ppb TOC) (Thermo Fisher Scientific Inc., Pittsburgh, PA, USA).

3.2. Powder XRD Measurements

The dry, powder samples of γ-Al2O3 NPs were analyzed using Rigaku D/max-B powder X-ray Diffractometer with Cu radiation (35 kV, 15 mA) (Rigaku Americas Corp., Allison Park, PA, USA). The diffractometer was set up to measure in step-scan mode over the 2θ range from 19° to 80° at 0.6° 2θ/min with a step size of 0.05°. A pitted glass sample holder was used without glue. A standard quartz and silicon sample were analyzed prior to experiment samples to ensure proper instrument calibration. Data processing and analysis were performed using the JADE 9.0 software package (Jade software Corp., Jacksonville, FL, USA).
XRD analysis on montmorillonite powder samples was done by a D2 PHASER diffractometer equipped with Cu radiation (30 kV, 10 mA) and a high speed linear detector (LYNXEYE) (Bruker AXS Inc, Madison, WI, USA). The diffractometer was set up to measure in step-scan mode over the 2θ range from 5° to 65° at 1.0 s/step with a step size of 0.02°. Phase identification was performed using the DIFFRAC.EVA software package (Bruker AXS Inc, Madison, WI, USA) in combination with the ICDD PDF database. The result showed the very broad reflection at low angles, which is indicative of montmorillonite (main phase, shown in blue on Figure S5), with its composition of Al0.86Fe0.1H Li0.08Mg0.14O10Si3.9. It also showed the presence of trace amounts of other minerals, including quartz, gypsum, calcite, rutile, and aragonite.

3.3. Zeta Potential and Size Distribution Measurements

A zetasizer Nano ZSP (Malvern Instruments, Worcestershire, UK) was used to determine the ζ potential values as well as the Zave diameters of the γ-Al2O3 NP aggregates, HA, montmorillonite, and mixtures. The ζ potential measurement has 20 sub-runs with a delay of 5 seconds between them, whereas the size distribution (Zave) has 12 sub-runs. Each sample ran three times to obtain the average values of the ζ potential and the Zave measurements. Each experiment had duplicated samples.
For the single-component system (i.e., Al2O3 NP suspension), the ζ potential and Zave measurements of the Al2O3 NP aggregates were recorded as a function of solution pH or ionic strength. For the mixed system with HA, the ζ potential and Zave diameters were measured as a function of TOC concentration at pH close to PZC of Al2O3 NPs. All the experiments were carried out at room temperature. Preliminary data suggested the mixed system (with HA or clay) reached an equilibrium state after a few hours of reaction time (with stirring) and maintained it over the next few days. For consistency, a 24-h equilibration time was allotted for both the single-component and mixed systems for the ζ potential and Zave measurements.

3.4. Ultrafiltration

The presence of ionic Al species (not a form of NPs) in γ-Al2O3 NP suspensions by different treatments was also examined. Specifically, a portion of the Al2O3 NP suspension was taken and centrifuged with 10 k MWCO Amicon filters (EMD Millipore Corp., Billerica, MA, USA) at 3000 rpm for 15 min at 20 °C. The collected filtrates were then acidified with 1% nitric acid for inductively coupled plasma-optical emission spectrometry (ICP-OES, the Spectro Arcos ICP-OES) analysis. The results show that measured ionic Al concentrations in the filtrates ranged from 18 to 33 ppb for the three γ-Al2O3 NPs, indicating that none of the experimental conditions used for the present study produced a significant concentration of dissolved Al in the solutions. Thus, both current sonication and acidic pH solution conditions did not cause the dissolution of γ-Al2O3 NPs.

3.5. TEM Analysis

A drop of the sample solution was placed onto a 400-mesh, carbon-film coated Cu grid (Electron Microscopy Sciences, Hatfield, PA, USA) and allowed to evaporate. The JEOL JEM-1400 TEM (JEOL USA, Inc., Peabody, MA, USA) was used in bright field (BF) mode at 120 kV for imaging of γ-Al2O3 NPs and their aggregates.

4. Conclusions

The behavior of three commercial γ-Al2O3 NPs in aqueous environments was studied in a systematic manner, covering a wide range of natural water conditions. First, γ-Al2O3 NPs possess pH-dependent surface charges, with the PZC around 7.5 to 8. If pH < PZC, then γ-Al2O3 NPs are positively charged, whereas if pH > PZC then γ-Al2O3 NPs are negatively charged. Dissolution of these three γ-Al2O3 NPs did not occur under the pH conditions tested in this study (pH 3 to pH 12). Second, at pH < PZC, significant γ-Al2O3 NPs aggregation occurs only when the electrolyte solutions have high ionic strength (e.g., 1 M NaCl, and 300 mM–3 M CaCl2). Third, both HA and montmorillonite enhance the stability of γ-Al2O3 NPs at and below PZC through combined effects of electrostatic interactions and steric hindrance. However, very little interaction of γ-Al2O3 NPs with HA or montmorillonite is observed when pH > PZC, where the compounds act as two separate, negatively charged species in suspensions. Both γ-Al2O3 NPs and montmorillonite have conditional charges, and therefore, the solution pH determines the degree of their surface interactions as well as the sorption site(s) of such interactions. In general, if pH < PZC, then basal planes of clay platelets are dominant sites for the surface interactions with NPs. If pH approximates PZC, then edge sites are the dominant surface interaction sites. Thus, solution pH, ionic strength, and the presence of natural organic and inorganic colloids greatly modify the surface conditions of commercial γ-Al2O3 NPs, affecting aggregation and colloidal stability significantly in the aqueous environment.

Supplementary Materials

The following are available online at https://www.mdpi.com/2079-4991/6/5/90/s1.

Acknowledgments

Bojeong Kim acknowledges financial support from start-up funds from Temple University. Jennifer Ngo was supported through the Undergraduate Research Program at Temple University. The authors also thank Stephanie Wunder, Ann Valentine (Department of Chemistry, Temple University), and David Grandstaff (Department of Earth and Environmental Science, Temple University) for the use of their laboratories and instruments. We are also appreciative of important assistance from Chris Oest (Department of Earth and Environmental Science, Temple University) on the XRD analysis, from Kristin Wilking (Department of Chemistry, Temple University) on the TEM analysis, and from David R. Vann (Department of Earth and Environmental Science, the University of Pennsylvania) for his help on the Spectro ICP-OES analysis.

Author Contributions

Julie Mui and Jennifer Ngo conducted the experiments, performed the measurements (DLS, XRD, and ICP-OES) and analyzed the data. Bojeong Kim conceived and designed the experiments, performed TEM analysis, analyzed the data and authored the manuscript.

Conflicts of Interest

The authors declare no conflict of interest.

Abbreviations

The following abbreviations are used in this manuscript.
BFBright Field
DLSDynamic Light Scattering
HAHumic Acid
ICP-OESInductively-Coupled Plasma Optical Emission Spectrometry
NPsNanoparticles
PZCPoint of Zero Charge
TEMTransmission Electron Microscopy
XRDX-ray diffraction

References

  1. The Royal Society & the Royal Academy of Engineering. Nanoscience and Nanotechnologies: Opportunities and Uncertainties; Royal Society Publications: London, UK, 2004. [Google Scholar]
  2. U.S. Environmental Protection Agency. Nanotechnology White Paper, February 2007. Available online: https://www.epa.gov/sites/production/files/2015-01/documents/nanotechnology_whitepaper.pdf (accessed on 3 April 2016).
  3. Lu, W.; Lieber, C.M. Nanoelectronics from the bottom up. Nat. Mater. 2007, 6, 841–850. [Google Scholar] [CrossRef] [PubMed]
  4. Piccinno, F.; Gottschalk, F.; Seeger, S.; Nowack, B. Industrial production quantities and uses of ten engineered nanomaterials in Europe and the world. J. Nanopart. Res. 2012, 14. [Google Scholar] [CrossRef]
  5. Fu, F.; Dionysiou, D.D.; Liu, H. The use of zero-valent iron for groundwater remediation and wastewater treatment: A review. J. Hazard. Mater. 2014, 267, 194–205. [Google Scholar] [CrossRef] [PubMed]
  6. Vance, M.E.; Kuiken, T.; Vejerano, E.P.; McGinnis, S.P.; Hochella, M.F., Jr.; Rejeski, D.; Hull, M.S. Nanotechnology in the real world: Redeveloping the nanomaterial consumer products inventory. Beilstein J. Nanotechnol. 2015, 6, 1769–1780. [Google Scholar] [CrossRef] [PubMed]
  7. Future Markets Inc. The Global Market for Metal Oxide Nanoparticles to 2020 (2013): 322. Available online: http://www.researchandmarkets.com/research/jkjd5k/the_global_market (accessed on 28 January 2016).
  8. Rittner, M.N.; Abraham, T. Nanostructured materials: An overview and commercial analysis. JOM 1998, 50, 37–38. [Google Scholar] [CrossRef]
  9. Abraham, T. Healthy Prospects for Nanoceramic Powders; Ceramic Industry: Norwalk, CT, USA, 2000. [Google Scholar]
  10. Frey, A.; Neutra, M.R.; Robey, F.A. Peptomer aluminum oxide nanoparticle conjugates as systemic and mucosal vaccine candidates: Synthesis and characterization of a conjugate derived from the C4 domain of HIV-1MN Gp120. Bioconjugate Chem. 1997, 8, 424–433. [Google Scholar] [CrossRef] [PubMed]
  11. DeFriend, K.A.; Wiesner, M.R.; Barron, A.R. Alumina and aluminate ultrafiltration membranes derived from alumina nanoparticles. J. Membr. Sci. 2003, 224, 11–28. [Google Scholar] [CrossRef]
  12. Sawyer, W.G.; Freudenberg, K.D.; Bhimaraj, P.; Schadler, L.S. A study on the friction and wear behavior of PTFE filled with alumina nanoparticles. Wear 2003, 254, 573–580. [Google Scholar] [CrossRef]
  13. De Luca, L.T.; Galfetti, L.; Severini, F.; Meda, L.; Marra, G.; Vorozhtsov, A.B.; Sedoi, V.S.; Babuk, V.A. Burning of Nano-Aluminized Composite Rocket Propellants. Combust. Explos. Shock Waves 2005, 41, 680–692. [Google Scholar] [CrossRef]
  14. Khanna, A.S. Nanotechnology in High Performance Paint Coatings. Asian J. Exp. Sci. 2008, 21, 25–32. [Google Scholar]
  15. Landry, V.; Riedl, B.; Blanchet, P. Alumina and zirconia acrylate nanocomposites coatings for wood flooring: Photocalorimetric characterization. Prog. Org. Coat. 2008, 61, 76–82. [Google Scholar] [CrossRef]
  16. Wong, K.F.; Kurma, T. Transport properties of alumina nanofluids. Nanotechnology 2008, 19. [Google Scholar] [CrossRef] [PubMed]
  17. Lewis, W.K.; Harruff, B.A.; Gord, J.R.; Rosenberger, A.T.; Sexton, T.M.; Guliants, E.A.; Bunker, C.E. Chemical Dynamics of Aluminum Nanoparticles in Ammonium Nitrate and Ammonium Perchlorate Matrices: Enhanced Reactivity of Organically Capped Aluminum. J. Phys. Chem. C 2011, 115, 70–77. [Google Scholar] [CrossRef]
  18. Jolivet, J.-P.; Barron, A.R. Nanomaterials Fabrication. In Environmental Nanotechnology: Applications and Impacts of Nanomaterials; Wiesner, M.R., Bottero, J.-Y., Eds.; McGraw-Hill: New York, NY, USA, 2007; Chapter 3; pp. 29–103. [Google Scholar]
  19. Griffitt, R.J.; Luo, J.; Gao, J.; Bonzongo, J.-C.; Barber, D.S. Effects of particle composition and species on toxicity of metallic nanomaterials in aquatic organisms. Environ. Toxicol. Chem. 2008, 27, 1972–1978. [Google Scholar] [CrossRef] [PubMed]
  20. Sadiq, I.M.; Pakrashi, S.; Chandrasekaran, N.; Mukherjee, A. Studies on toxicity of aluminum oxide (Al2O3) nanoparticles to microalgae species: Scenedesmus sp. and Chlorella sp. J. Nanopart. Res. 2011, 13, 3287–3299. [Google Scholar] [CrossRef]
  21. Pakrashi, S.; Dalai, S.; Prathna, T.C.; Trivedi, S.; Myneni, R.; Raichur, A.M.; Chandrasekaran, N.; Mukherjee, A. Cytotoxicity of aluminum oxide nanoparticles towards fresh water algal isolate at low exposure concentrations. Aquat. Toxicol. 2013, 132–133, 34–45. [Google Scholar] [CrossRef] [PubMed]
  22. Li, M.; Czymmek, K.J.; Huang, C.P. Responses of Ceriodaphnia dubia to TiO2 and Al2O3 nanoparticles: A dynamic nano-toxicity assessment of energy budget distribution. J. Hazard. Mater. 2011, 187, 502–508. [Google Scholar] [CrossRef] [PubMed]
  23. Pakrashi, S.; Dalai, S.; Humayun, A.; Chakravarty, S.; Chandrasekaran, N.; Mukherjee, A. Ceriodaphnia dubia as a potential bio-indicator for assessing acute aluminum oxide nanoparticle toxicity in fresh water environment. PLoS ONE 2013, 8. [Google Scholar] [CrossRef]
  24. Zhu, X.; Zhu, L.; Duan, Z.; Qi, R.; Li, Y. Comparative toxicity of several metal oxide nanoparticle aqueous suspensions to Zebrafish (Danio rerio) early development stage. J. Environ. Sci. Health A 2008, 43, 278–284. [Google Scholar] [CrossRef] [PubMed]
  25. Jiang, W.; Mashayekhi, H.; Xing, B. Bacterial toxicity comparison between nano- and micro-scaled oxide particles. Environ. Pollut. 2009, 157, 1619–1625. [Google Scholar] [CrossRef] [PubMed]
  26. Sadiq, I.M.; Chowdhury, B.; Chandrasekaran, N.; Mukherjee, A. Antimicrobial sensitivity of Escherichia coli to alumina nanoparticles. Nanomed. Nanotechnol. Biol. Med. 2009, 5, 282–286. [Google Scholar] [CrossRef] [PubMed]
  27. Li, Y.; Yu, S.; Wu, Q.; Tang, M.; Pu, Y.; Wang, D. Chronic Al2O3-nanoparticle exposure causes neurotoxic effects on locomotion behaviors by inducing severe ROS production and disruption of ROS defense mechanisms in nematode Caenorhabditis elegans. J. Hazard. Mater. 2012, 219–220, 221–230. [Google Scholar] [CrossRef] [PubMed]
  28. Lin, W.; Stayton, I.; Huang, Y.-W.; Zhou, X.-D.; Ma, Y. Cytotoxicity and cell membrane depolarization induced by aluminum oxide nanoparticles in human lung epithelial cells A549. Toxicol. Environ. Chem. 2008, 90, 983–996. [Google Scholar] [CrossRef]
  29. Di Virgilio, A.L.; Reigosa, M.; Arnal, P.M.; De Mele, M.F.L. Comparative study of the cytotoxic and genotoxic effects of titanium oxide and aluminum oxide nanoparticles in Chinese hamster ovary (CHO-K1) cells. J. Hazard. Mater. 2010, 177, 711–718. [Google Scholar] [CrossRef] [PubMed]
  30. Ghosh, S.; Mashayekhi, H.; Pan, B.; Bhowmik, P.; Xing, B. Colloidal behavior of aluminum oxide nanoparticles as affected by pH and natural organic matter. Langmuir 2008, 24, 12385–12391. [Google Scholar] [CrossRef] [PubMed]
  31. Hochella, M.F., Jr.; Aruguete, D.; Kim, B.; Madden, A.S. Naturally occurring inorganic nanoparticles: General assessment and a global budget for one of earth’s last unexplored geochemical components. In Nature’s Nanostructures; Barnard, A.S., Guo, H., Eds.; Pan Stanford Publishing: Singapore, Singapore, 2012; pp. 1–42. [Google Scholar]
  32. Chen, G.; Liu, X.; Su, C. Distinct effects of humic acid on transport and retention of TiO2 rutile nanoparticles in saturated sand columns. Environ. Sci. Technol. 2012, 46, 7142–7150. [Google Scholar] [CrossRef] [PubMed]
  33. Loosli, F.; Le Coustumer, P.; Stoll, S. TiO2 nanoparticles aggregation and disaggregation in presence of alginate and Suwannee River humic acids. pH and concentration effects on nanoparticle stability. Water Res. 2013, 47, 6052–6063. [Google Scholar] [CrossRef] [PubMed]
  34. Loosli, F.; Vitorazi, L.; Berret, F.-F.; Stoll, S. Towards a better understanding on agglomeration mechanisms and thermodynamic properties of TiO2 nanoparticles interacting with natural organic matter. Water Res. 2015, 80, 139–148. [Google Scholar] [CrossRef] [PubMed]
  35. Jiang, X.J.; Tong, M.P.; Li, H.Y.; Yang, K. Deposition kinetics of zinc oxide nanoparticles on natural organic matter coated silica surfaces. J. Colloid Interface Sci. 2011, 350, 427–434. [Google Scholar] [CrossRef] [PubMed]
  36. Illés, E.; Tombácz, E. The effect of humic acid adsorption on pH-dependent surface charging and aggregation of magnetite nanoparticles. J. Colloid Interface Sci. 2006, 295, 115–123. [Google Scholar] [CrossRef] [PubMed]
  37. Liu, J.-F.; Zhao, Z.-S.; Jiang, G.-B. Coating Fe3O4 magnetic nanoparticles with humic acid for high efficient removal of heavy metals in water. Environ. Sci. Technol. 2008, 42, 6949–6954. [Google Scholar] [CrossRef] [PubMed]
  38. Ghosh, S.; Mashayekhi, H.; Bhowmik, P.; Xing, B. Colloidal stability of Al2O3 nanoparticles as affected by coating of structurally different humic acids. Langmuir 2010, 26, 873–879. [Google Scholar] [CrossRef] [PubMed]
  39. Lagaly, G.; Ziesmer, S. Colloid chemistry of clay minerals: The coagulation of montmorillonite dispersions. Adv. Colloid Interface Sci. 2003, 100, 105–128. [Google Scholar] [CrossRef]
  40. Tombácz, E. Colloidal behavior of aqueous montmorillonite suspensions: The specific role of pH in the presence of indifferent electrolytes. Appl. Clay Sci. 2004, 27, 75–94. [Google Scholar] [CrossRef]
  41. Zhou, D.; Abdel-Fattah, A.I.; Keller, A.A. Clay minerals destabilize engineered nanoparticles in aqueous environments. Environ. Sci. Technol. 2012, 46, 7520–7526. [Google Scholar] [CrossRef] [PubMed]
  42. Lippens, B.C.; De Boer, J.H. Study of phase transformations during calcination of aluminum hydroxides by selected area electron diffraction. Acta Crystallogr. 1964, 17. [Google Scholar] [CrossRef]
  43. Zhou, R.-S.; Snyder, R.L. Structures and transformation mechanisms of the η, γ, and θ transition aluminas. Acta Crystallogr. 1991, 47, 617–630. [Google Scholar] [CrossRef]
  44. Digne, M.; Sautet, P.; Raybaud, P.; Euzen, P.; Toulhoat, H. Use of DFT to achieve a rational understanding of acid-basic properties of γ-alumina surfaces. J. Catal. 2004, 226, 54–68. [Google Scholar] [CrossRef]
  45. Handy, R.D.; von der Kammer, F.; Lead, J.R.; Hassellöv, M.; Owen, R.; Crane, M. The ecotoxicology and chemistry of manufactured nanoparticles. Ecotoxicology 2008, 17, 287–314. [Google Scholar] [CrossRef] [PubMed]
  46. Lowry, G.V.; Hotze, E.M.; Bernhardt, E.S.; Dionysiou, D.D.; Pedersen, J.A.; Wiesner, M.R.; Xing, B. Environmental occurrences, behavior, fate and ecological effects of nanomaterials. J. Environ. Qual. 2010, 39, 1867–1874. [Google Scholar] [CrossRef] [PubMed]
  47. Hotze, E.M.; Phenrat, T.; Lowry, G.V. Nanoparticle aggregation: challenges to understanding transport and reactivity in the environment. J. Environ. Qual. 2010, 39, 1909–1924. [Google Scholar] [CrossRef] [PubMed]
  48. Ottofuelling, S.; von der Kammer, F.; Hofmann, T. Commercial titanium dioxide nanoparticles in both natural and synthetic water: Comprehensive multidimensional testing and prediction of aggregation behavior. Environ. Sci. Technol. 2011, 45, 10045–10052. [Google Scholar] [CrossRef] [PubMed]
  49. Godymchuk, A.; Karepina, E.; Yunda, E.; Bozhko, I.; Lyamina, G.; Kuznetsov, D.; Gusev, A.; Kosova, N. Aggregation of manufactured nanoparticles in aqueous solutions of mono- and bivalent electrolytes. J. Nanopart. Res. 2015, 17. [Google Scholar] [CrossRef]
  50. French, R.A.; Jacobson, A.R.; Kim, B.; Isley, S.L.; Penn, R.L.; Baveye, P.C. Influence of ionic strength, pH, and cation valence on aggregation kinetics of titanium dioxide nanoparticles. Environ. Sci. Technol. 2009, 43, 1354–1359. [Google Scholar] [CrossRef] [PubMed]
  51. Thio, B.J.R.; Zhou, D.; Keller, A.A. Influence of natural organic matter on the aggregation and deposition of titanium dioxide nanoparticles. J. Hazard. Mater. 2011, 189, 556–563. [Google Scholar] [CrossRef] [PubMed]
  52. Buettner, K.M.; Rinciog, C.I.; Mylon, S.E. Aggregation kinetics of cerium oxide nanoparticles in monovalent and divalent electrolyte. Colloids Surf. A 2010, 366, 74–79. [Google Scholar] [CrossRef]
  53. Avena, M.J.; Koopal, L.K. Kinetics of humic acid adsorption at solid-water interfaces. Environ. Sci. Technol. 1999, 33, 2739–2744. [Google Scholar] [CrossRef]
  54. Van Olphen, H. An Introduction to Clay Colloid Chemistry; Interscience: New York, NY, USA, 1963. [Google Scholar]
  55. Johnston, C.T.; Tombácz, E. Soil Mineralogy with Environmental Applications; Dixon, J.B., Schulze, D.G., Eds.; Soil Science Society of America: Madison, WI, USA, 2002; pp. 37–67. [Google Scholar]
  56. Delhorme, M.; Labbez, C.; Caillet, C.; Thomas, F. Acid-Base Properties of 2:1 Clays. I. Modeling the Role of Electrostatics. Langmuir 2010, 26, 9240–9249. [Google Scholar] [CrossRef] [PubMed]
  57. Kim, B.; Hochella, M.F., Jr. Analytical Transmission Electron Microscopy and Scanning Transmission Electron Microscopy Techniques for the Characterization of Nanomaterial Composition, Phase, and Crystallinit. In Characterization of Nanomaterials in Complex Environmental and Biological Media; Baalousha, M., Saleh, N., Lead, J., Eds.; Elsevier Ltd.: Waltham, MA, USA, 2015; pp. 123–152. [Google Scholar]
Figure 1. X-ray diffraction (XRD) patterns of commercial γ-Al2O3 nanoparticles (NPs) in size of: (a) 5 nm; (b) 10 nm; and (c) 20–30 nm. Note that 20–30 nm γ-Al2O3 NPs have a trace amount of boehmite (γ-AlOOH) (PDF 04-010-5683) marked with *, as an impurity.
Nanomaterials 06 00090 g001
Figure 2. Bright field transmission electron microscopy (TEM) images of γ-Al2O3 NPs in size of: (a) 5 nm; (b) 10 nm; and (c) 20–30 nm.
Nanomaterials 06 00090 g002
Figure 3. Z-average (Zave) hydrodynamic diameter (○) and ζ potential (●) of: (a) 5 nm; (b) 10 nm; and (c) 20–30 nm γ-Al2O3 NP aggregates, as a function of pH.
Nanomaterials 06 00090 g003
Figure 4. (a) Zave hydrodynamic diameter of 5 nm (□), 10 nm (○), and 20–30 nm (△) γ-Al2O3 NP aggregates, as a function of ionic strength (NaCl); (b) Zave hydrodynamic diameter of 5 nm (□), 10 nm (○), and 20–30 nm (△) γ-Al2O3 NP aggregates, as a function of ionic strength (CaCl2); (c) ζ potential of 5 nm (■), 10 nm (●), and 20–30 nm (▲) γ-Al2O3 NP aggregates, as a function of ionic strength (NaCl); and (d) ζ potential of 5 nm (■), 10 nm (●), and 20–30 nm (▲) γ-Al2O3 NP aggregates, as a function of ionic strength (CaCl2).
Nanomaterials 06 00090 g004
Figure 5. (a) Zave hydrodynamic diameter (○) and ζ potential (●) of 10 nm of γ-Al2O3 NPs as a function of HA concentration at pH close to the point of zero charge (PZC) of Al2O3; and (b) bright field TEM images of 10 nm γ-Al2O3 NPs with 10 mg·L−1 of HA at pH close to PZC of Al2O3.
Nanomaterials 06 00090 g005
Figure 6. Bright field TEM images of 10 nm γ-Al2O3 NPs with montmorillonite at pH < PZC of Al2O3 NPs.
Nanomaterials 06 00090 g006
Figure 7. Bright field TEM images of 10 nm γ-Al2O3 NPs with montmorillonite at PZC of Al2O3 NPs.
Nanomaterials 06 00090 g007
Figure 8. Bright field TEM images of 10 nm γ-Al2O3 NPs with montmorillonite at pH > PZC of Al2O3 NPs.
Nanomaterials 06 00090 g008

