Article

Fe3+-Doped TiO2 Nanotube Arrays on Ti-Fe Alloys for Enhanced Photoelectrocatalytic Activity

State Key Laboratory of Physical Chemistry of Solid Surfaces, Department of Chemistry, College of Chemistry and Chemical Engineering, Xiamen University, Xiamen 361005, China
*
Author to whom correspondence should be addressed.
Nanomaterials 2016, 6(6), 107; https://doi.org/10.3390/nano6060107
Submission received: 10 May 2016 / Revised: 30 May 2016 / Accepted: 1 June 2016 / Published: 6 June 2016
(This article belongs to the Special Issue Nanomaterials for Electrocatalysis)

Abstract

:
Highly ordered, vertically oriented Fe3+-doped TiO2 nanotube arrays (Fe-TNTs) were prepared on Ti-Fe alloy substrates with different Fe contents by the electrochemical anodization method. The as-prepared Fe-TNTs were characterized by scanning electron microscope (SEM), transmission electron microscopy (TEM), X-ray diffraction (XRD), X-ray photoelectron spectroscopy (XPS) and related electrochemical techniques. XPS results demonstrated that Fe3+ ions were successfully doped into TiO2 nanotubes. The photoelectrochemical activity of Fe-TNTs was compared with that of pure TiO2 nanotube arrays (TNTs). The results showed that Fe-TNTs grown on low concentration (0.5 wt %–1 wt % Fe) Ti-Fe alloys possessed higher photocurrent density than TNTs. The Fe-TNTs grown on Ti-Fe alloy containing 0.8 wt % Fe exhibited the highest photoelectrochemical activity and the photoelectrocatalytic degradation rate of methylene blue (MB) aqueous solution was significantly higher than that of TNTs.

1. Introduction

Since the discovery of photocatalytic water splitting on the TiO2 surface, TiO2 has been shown as an admirable photocatalyst to decompose organic contaminant, and it has attracted extensive interest. It is well known that the one-dimensional (1D) materials, including nanotubes, nanofibers, nanowires, and carbon nanotubes, have shown many desirable advantages in photoresponsive properties, and have been reported to improve charge transport in a number of ways [1,2,3,4,5]. Among them, the TiO2 nanotube arrays (TNTs), since they were first synthesized by Grimes et al. in 2001 [6], have drawn much attention due to their unique properties, such as a highly ordered array structure, a highly specific surface area, outstanding mechanical and chemical stability as well as good charge-transport properties [7]. However, TiO2 can only adsorb UV light due to its wide band gap of 3.2 eV (anatase), which limits its efficient use of solar energy since UV light accounts for less than 4% of the solar spectrum. Therefore, many efforts have been explored in order to narrow the band gap and align the band-edge positions, including metal ion doping [8,9], non-metal ion doping [10], noble metal deposition [7,11], semiconductor coupling [12,13], and dye sensitization [14].
Comparatively, doping TiO2 with transition metal ions can introduce mid-gap energy levels. Moreover, moderate doping can facilitate the separation of photogenerated electron-hole pairs [15], hence prolonging the lifetime of electron-hole pairs and enhancing the photocatalytic activity [16]. For metal ion doping, Fe3+ is considered a promising dopant of TiO2 in terms of its ion radius (0.64 Å) close to Ti4+ (0.68 Å), and it could replace Ti4+ in the lattice without significant alteration of the crystalline structure [17]. Furthermore, Fe3+ is relatively stable due to its 3d5 (semi-full high spin) electronic configuration, and so the trapped charges can easily release to participate in photoelectrocatalytic reaction [18]. In recent years, it was found that highly ordered TNT layers grown on Ti substrate can be doped with Fe3+ using electrochemical anodic oxidation [19] and ultrasound-assisted impregnating-calcination [20], and the photocatalytic activity of TNTs can be significantly enhanced after Fe doping. It is noteworthy that anodization of Ti alloy provides a direct way to incorporate metal ions into the lattice of TiO2 [21,22,23]. Mor et al. fabricated self-aligned, vertically oriented Ti-Fe-O nanotube arrays by anodic oxidation of Ti-Fe metal films containing different Fe content co-sputtered on fluorine-doped tin oxide (FTO)-coated glass [15]. However, most of Fe elements existed in the form of a-Fe2O3 and only a small amount of Fe3+ was incorporated in the TiO2 lattice. In recent years, Fe-doped TNTs have been fabricated by the electrochemical anodization of Ti-Fe alloy in ethylene glycol solution containing 0.25 wt % NH4F and 10 wt % H2O [24], but were not characterized systematically. In particular, there are no reports on the photoelectrocatalytic activity of Fe-doped TNTs.
In this work, Fe3+-doped TiO2 nanotube arrays (Fe-TNTs) with different Fe contents were fabricated through electrochemical anodic oxidation using Ti-Fe alloy as the substrate in 0.5 wt % HF aqueous solution and were investigated comprehensively. The photoelectrocatalytic activity of the samples was evaluated by the photoelectrocatalytic degradation of methylene blue (MB) aqueous solution under UV and visible light irradiation. Taking advantage of photocurrent and electrochemical impedance spectroscopy (EIS) techniques, the transfer behavior of photogenerated charges of Fe-TNTs was analyzed.

2. Results and Discussion

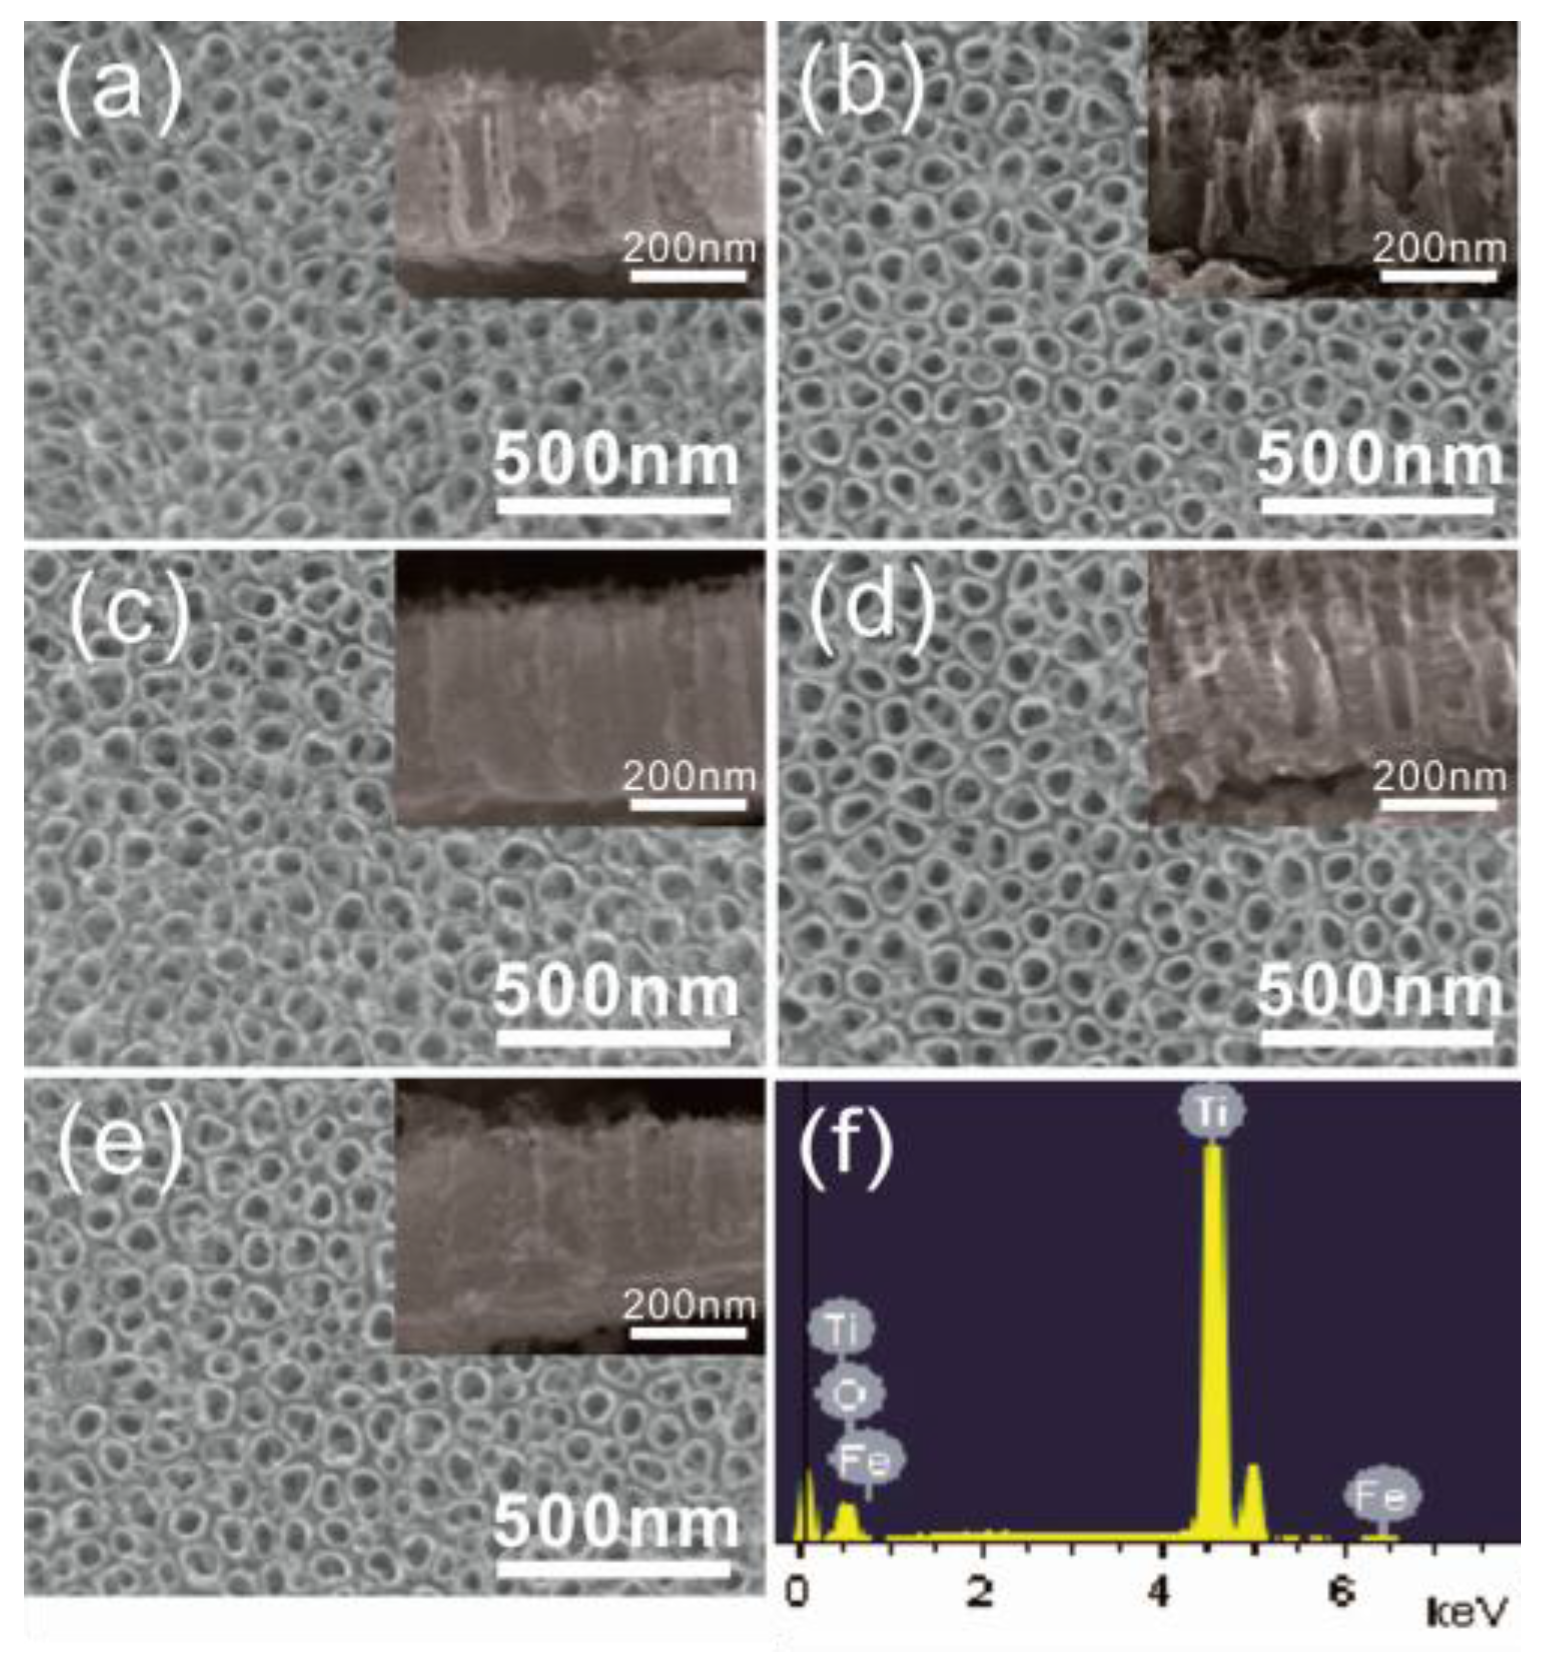
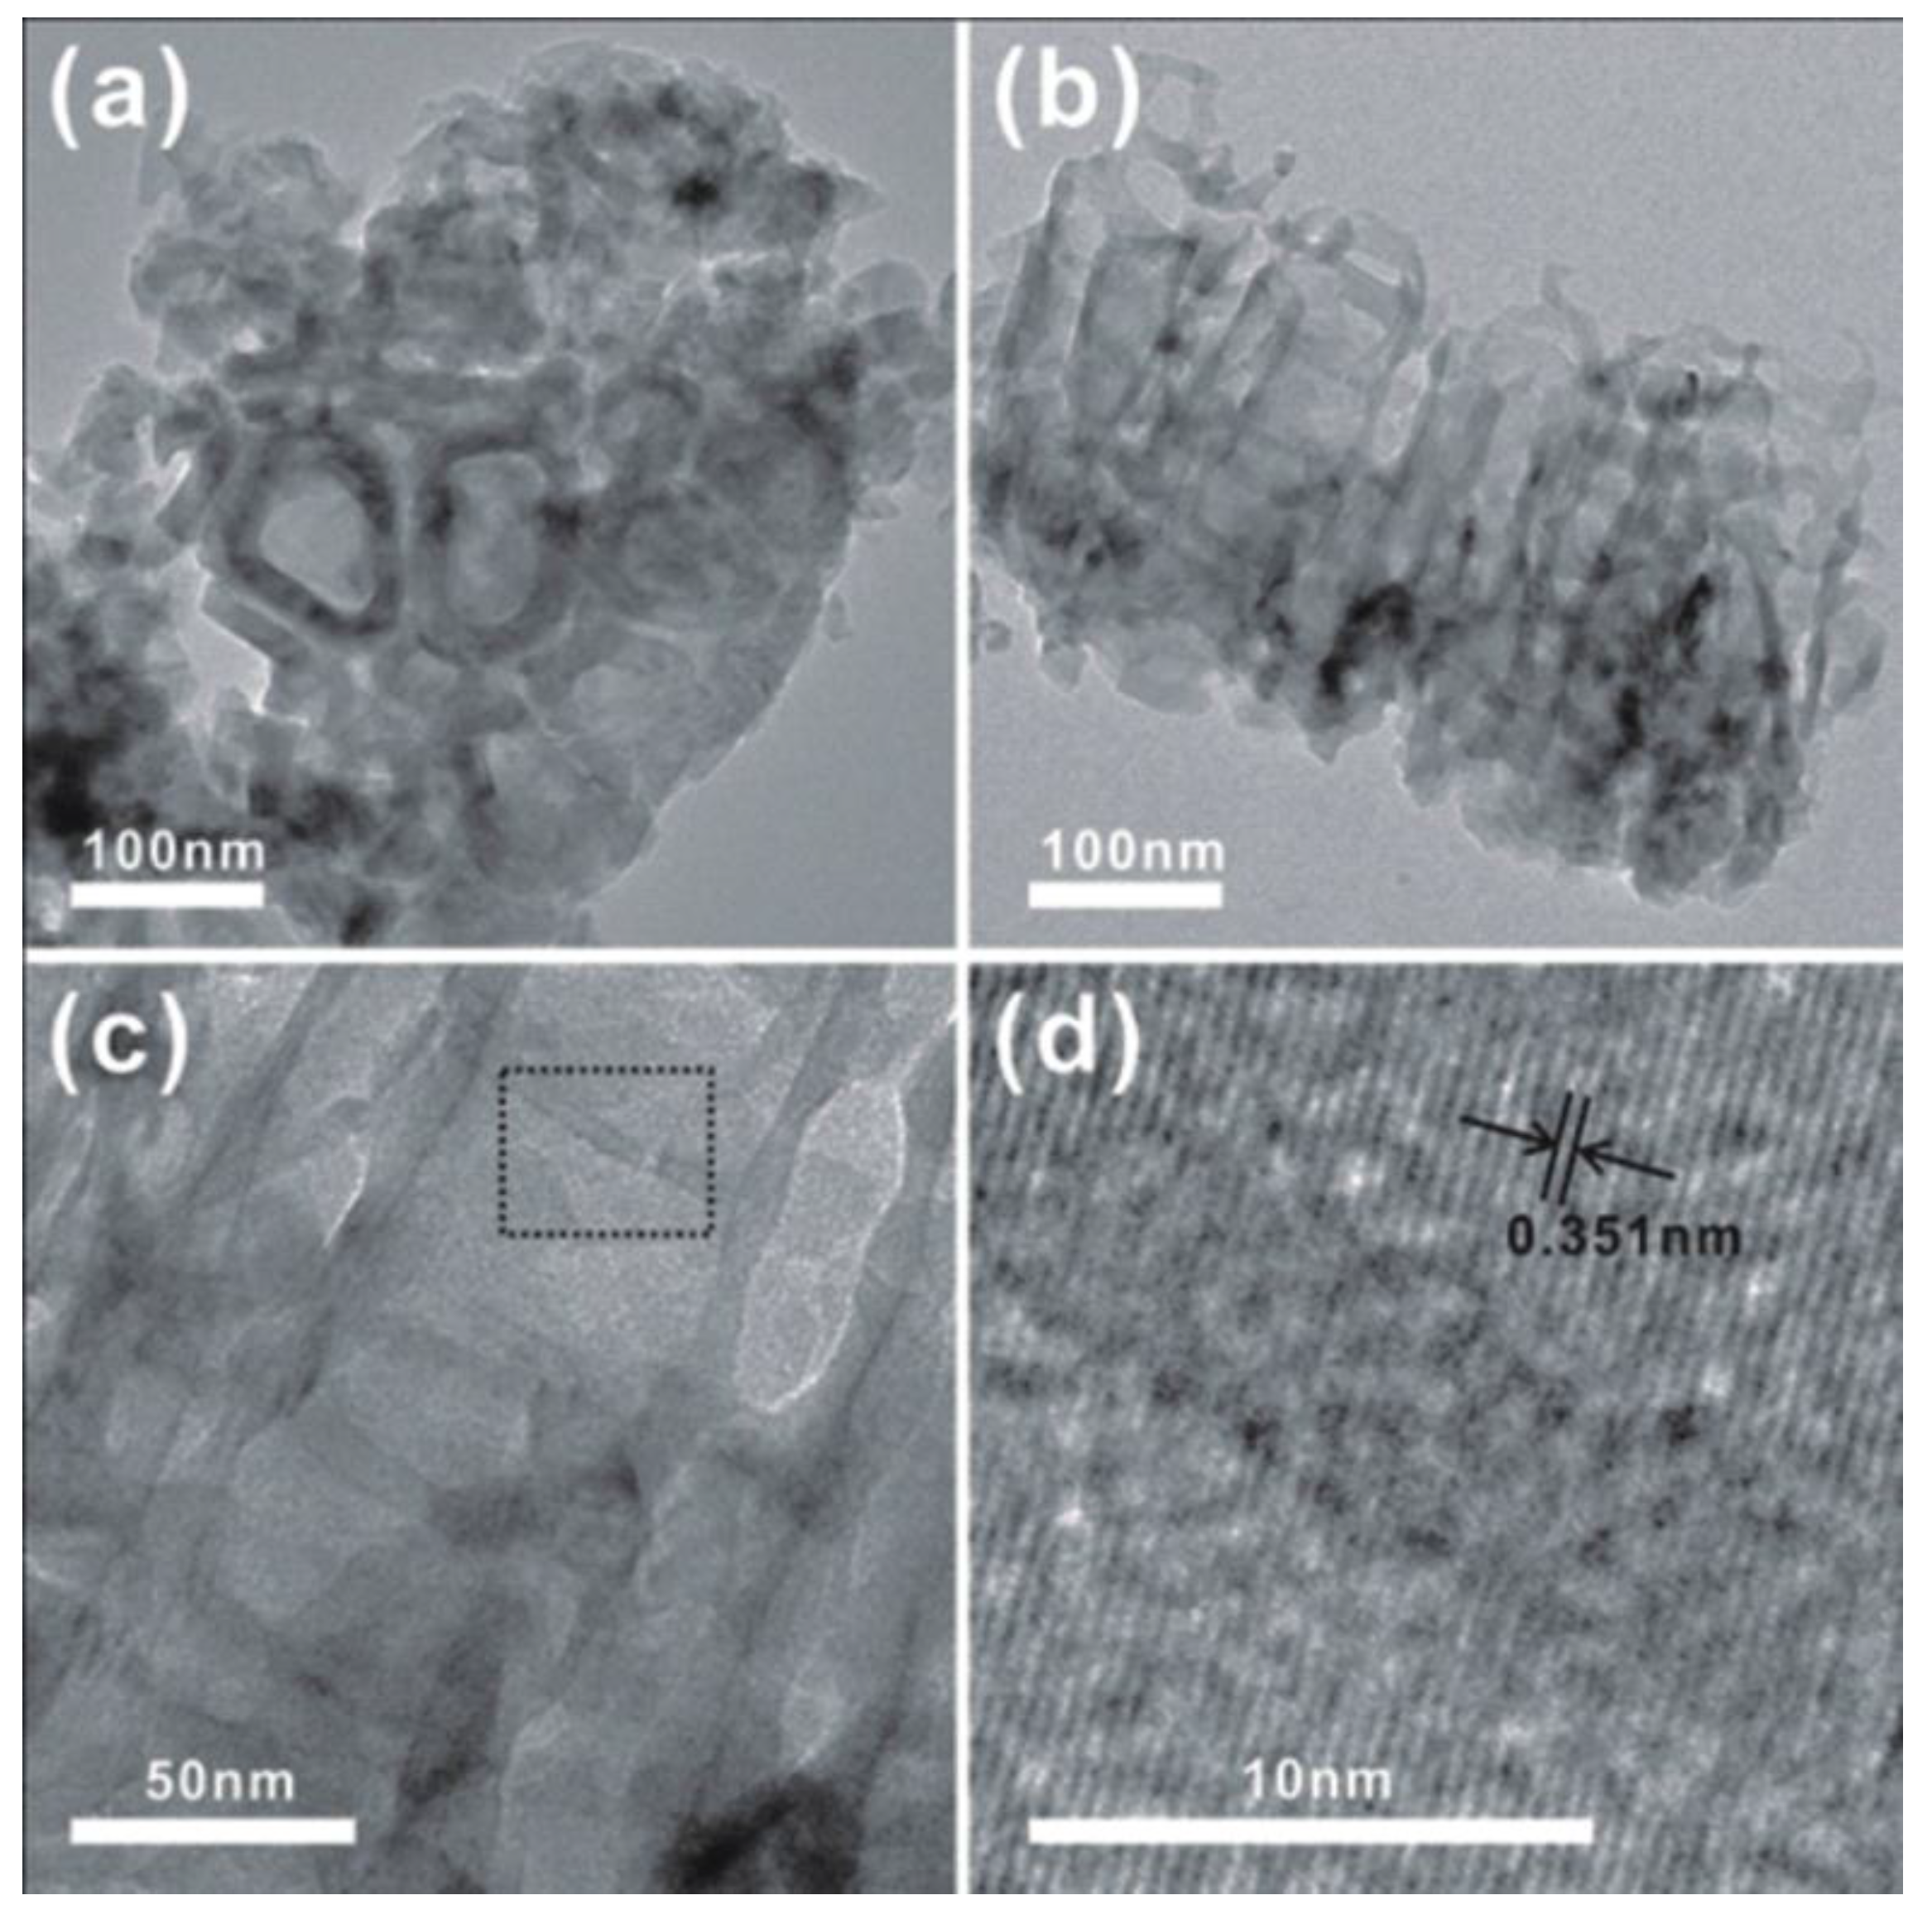
2.1. Morphological Characterization

Figure 1a shows the top-view and cross-section-view scanning electron microscope (SEM) images of pure Ti after anodization. Highly ordered and vertically oriented TiO2 nanotubes were formed with an average tube diameter of around 60 nm and a tube length of about 250 nm (shown in the inset of Figure 1). Figure 1b–e are the SEM images of Ti-Fe alloys with different Fe content after anodization. It can be seen that the tube diameter and length of the nanotubes grown from Ti-Fe alloy were almost the same as those of TNTs and were independent of the iron content. Nevertheless, the EDS spectrum of the Ti08Fe after anodization is shown in Figure 1f to identify the presence of Fe. The atomic percentage of each element is listed in Table 1. The C element is ascribed to adventitious hydrocarbon from the instrument itself, while the F element results from the anodization electrolyte. Notably, the change of Fe content in Fe-TNTs was consistent with that in Ti-Fe alloys.

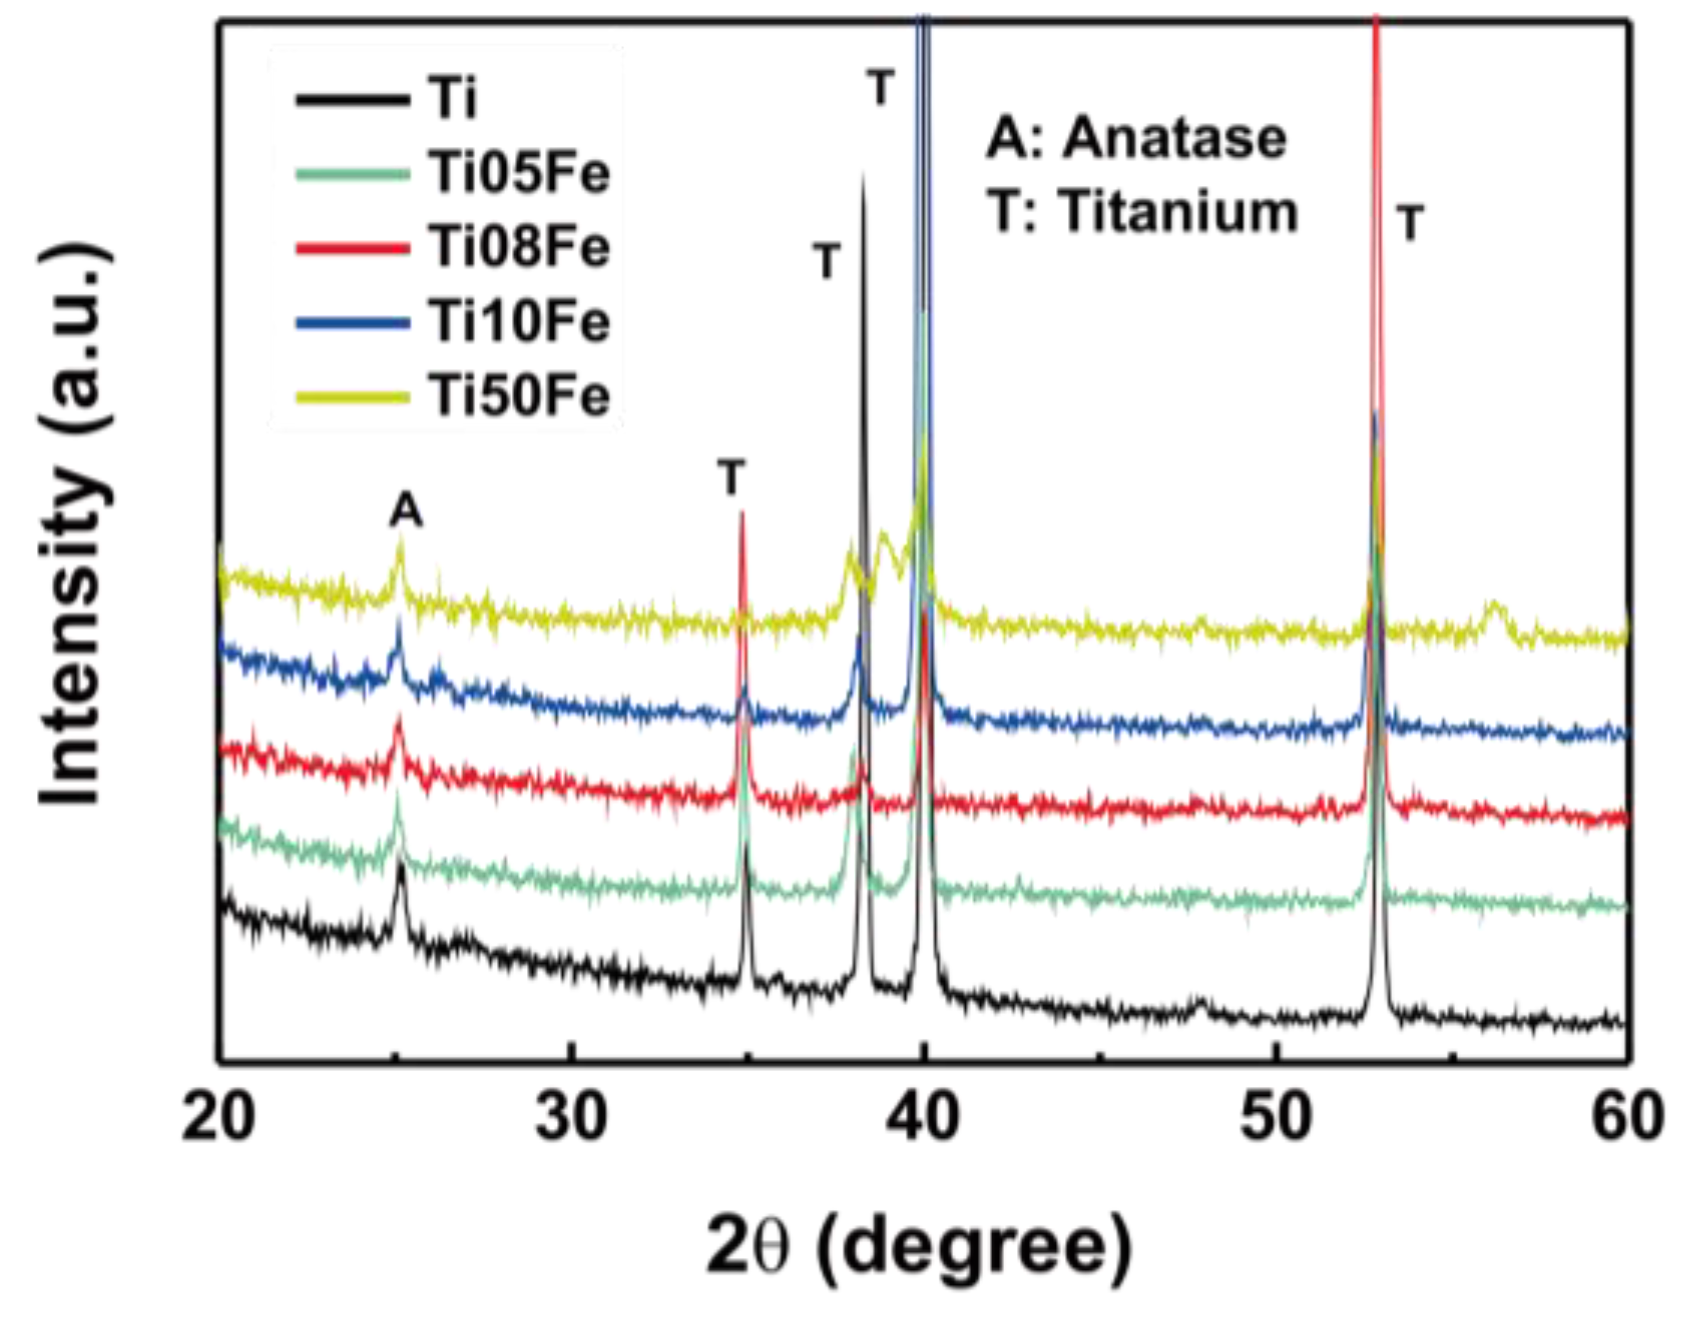
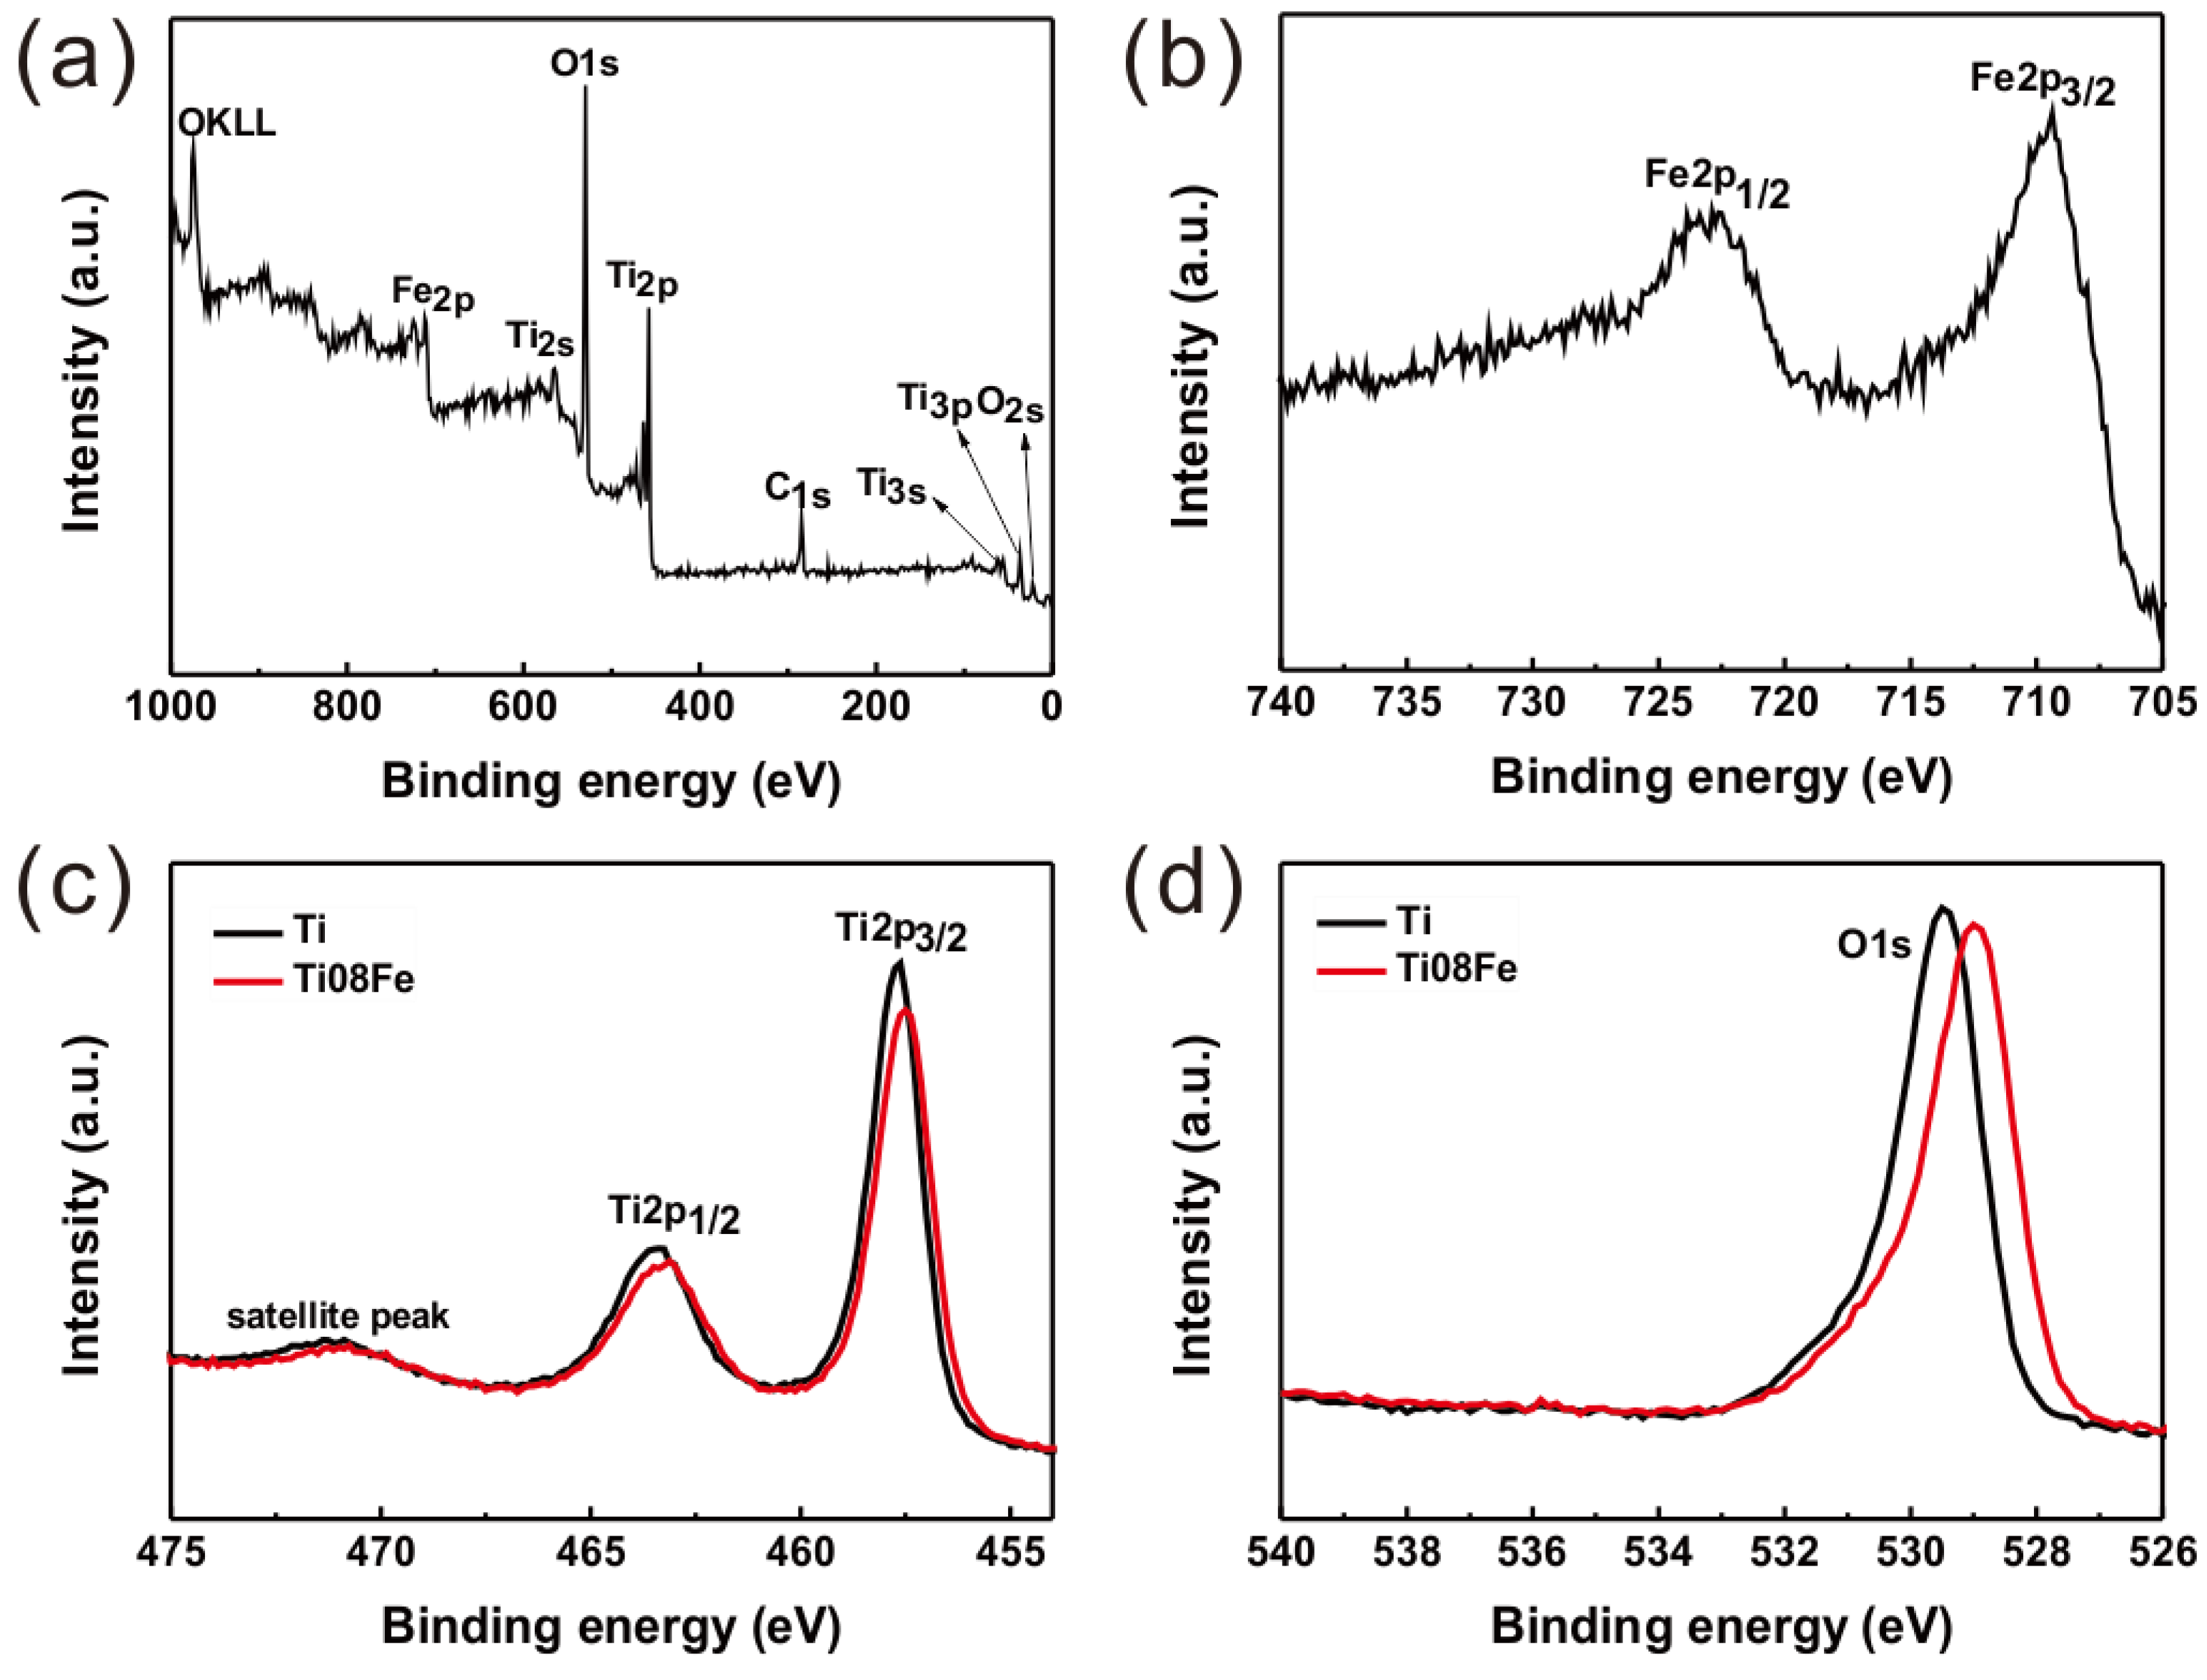
2.2. Crystalline Structure Characterization

Taken as a representative of nanotube arrays, the crystalline structure of the Fe-TNTs prepared by anodizing Ti08Fe alloy was characterized by transmission electron microscopy (TEM). Figure 2a,b show the low-magnification top and cross-sectional images of Ti08Fe, respectively. The nanotubes have a diameter of ~60 nm and a length of ~250 nm, which is consistent with the observation in SEM. The high-magnification cross-sectional image of the sample is shown in Figure 2c. Unlike those Fe-TNTs reported previously [25], the constituent of nanotube array film was homogenous and no iron oxide nanoparticles could be found. Figure 2d displays the corresponding high resolution TEM image. The intact lattice fringe of 0.351 nm corresponded to the interplanar spacing of the (110) plane of anatase TiO2, confirming that the Fe-TNTs were anatase.
The crystalline structure of samples was further analyzed by X-ray diffraction (XRD). Figure 3 shows the XRD patterns for the anodized Ti-Fe alloys and pure Ti. The predominant peak at approximately 2q = 25.2° corresponds to the (101) face of anatase TiO2. It is evident that the anatase phase can be identified in all samples after annealing at 450 °C for 30 min. It is noteworthy that the phases of iron oxide still cannot be found, even after the Fe content was further increased to 5.0 wt %. The absence of iron oxide may be attributed to Fe3+ diffused along the с-axis and substituted Ti4+ in the TiO2 lattice [26].
To investigate the oxidation state of Fe in Fe-TNTs, the Fe 2p core level was measured by X-ray photoelectron spectroscopy (XPS) and the results are shown in Figure 4b. There were two peaks for as-prepared Fe-TNTs in the high resolution spectrum of Fe 2p. The peaks located at 709.4 and 723.3 eV can be assigned to the Fe 2p3/2 and the Fe 2p1/2 photoemission spectra [19], respectively, indicating the Fe element mainly exists in the +3 valence state. Meanwhile, Figure 4c,d show the XPS spectra of Ti and O elements of nanotube arrays, respectively. The peak positions of both the Ti 2p core level and the O 1s core level of Fe-TNTs were shifted to a lower binding energy compared to TNTs. This can be attributed to the substitution of Ti4+ ions by Fe3+ ions, resulting in the formation of Ti-O-Fe bonds [27]. Accordingly, it is further demonstrated that Fe3+ ions were doped into the TiO2 lattice.

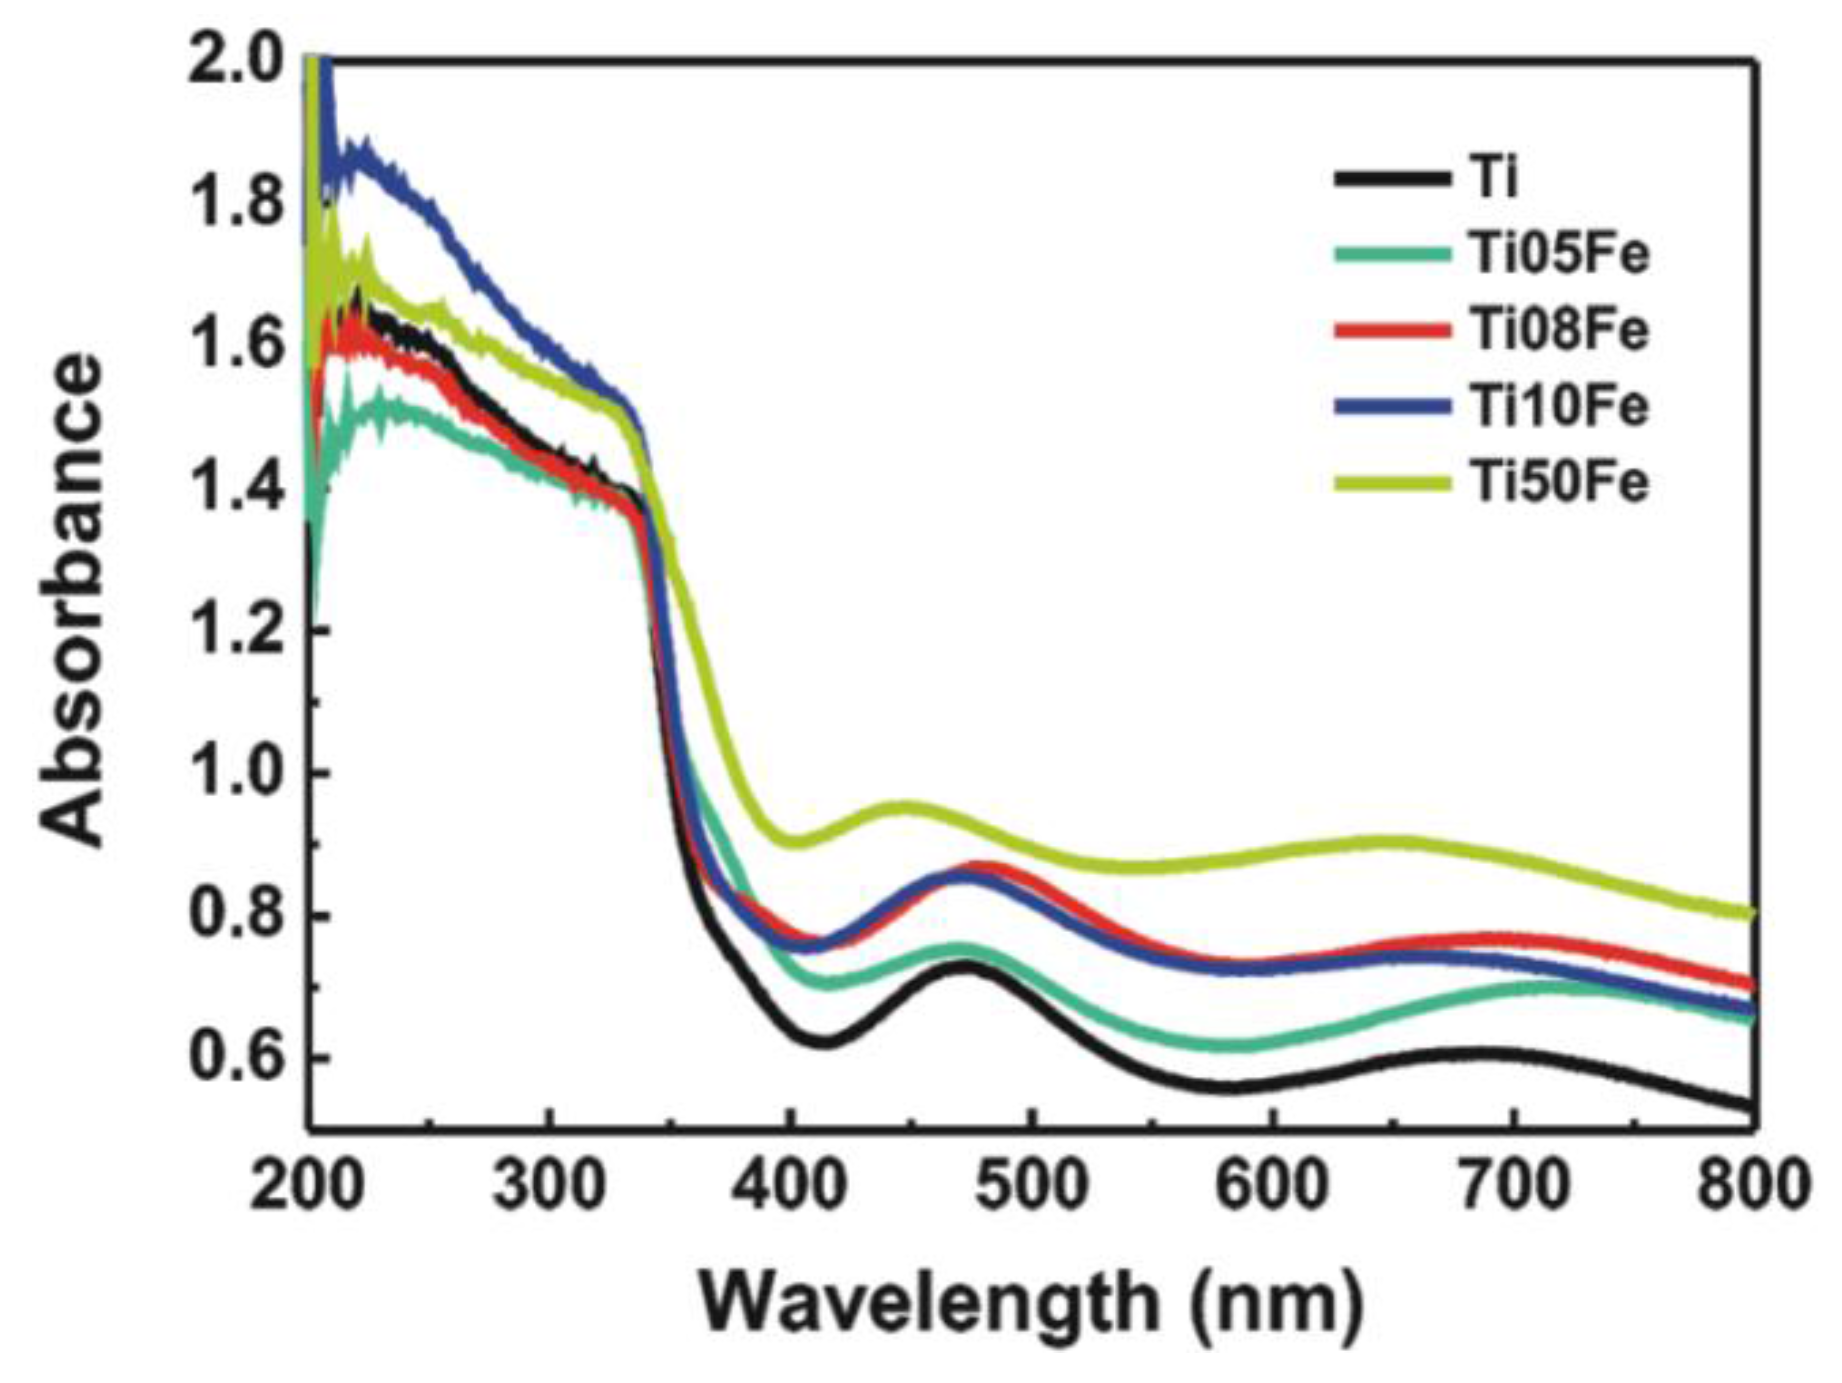
2.3. UV-Vis Diffuse Reflectance Spectra

Figure 5 shows the UV-vis diffuse reflectance spectra (DRS) of TNTs and Fe-TNTs. All the samples have strong absorption within the ultraviolet light region, corresponding to the band gap of anatase (3.2 eV). Meanwhile, the samples also exhibited several absorption peaks in the range of 400 nm–800 nm, which is attributed to the sub-band-gap states of the TNTs [28]. Compared with the TNTs, the absorption of Fe-TNTs in the visible light region was increasingly improved with the increase of iron content. Notably, the red-shift of the absorption band for Fe-TNTs with the increase of the Fe content was not obvious except for Ti50Fe. The enhanced visible light absorption can be attributed to a sub-band-gap transition between the 3d electron of Fe3+ and the TiO2 conduction band as well as the d-d transition of Fe3+ (2T2g → 2A2g,2T1g) or the charge transfer transition between interacting iron ions (Fe3+ + Fe3+ → Fe2+ + Fe4+) [29,30,31].

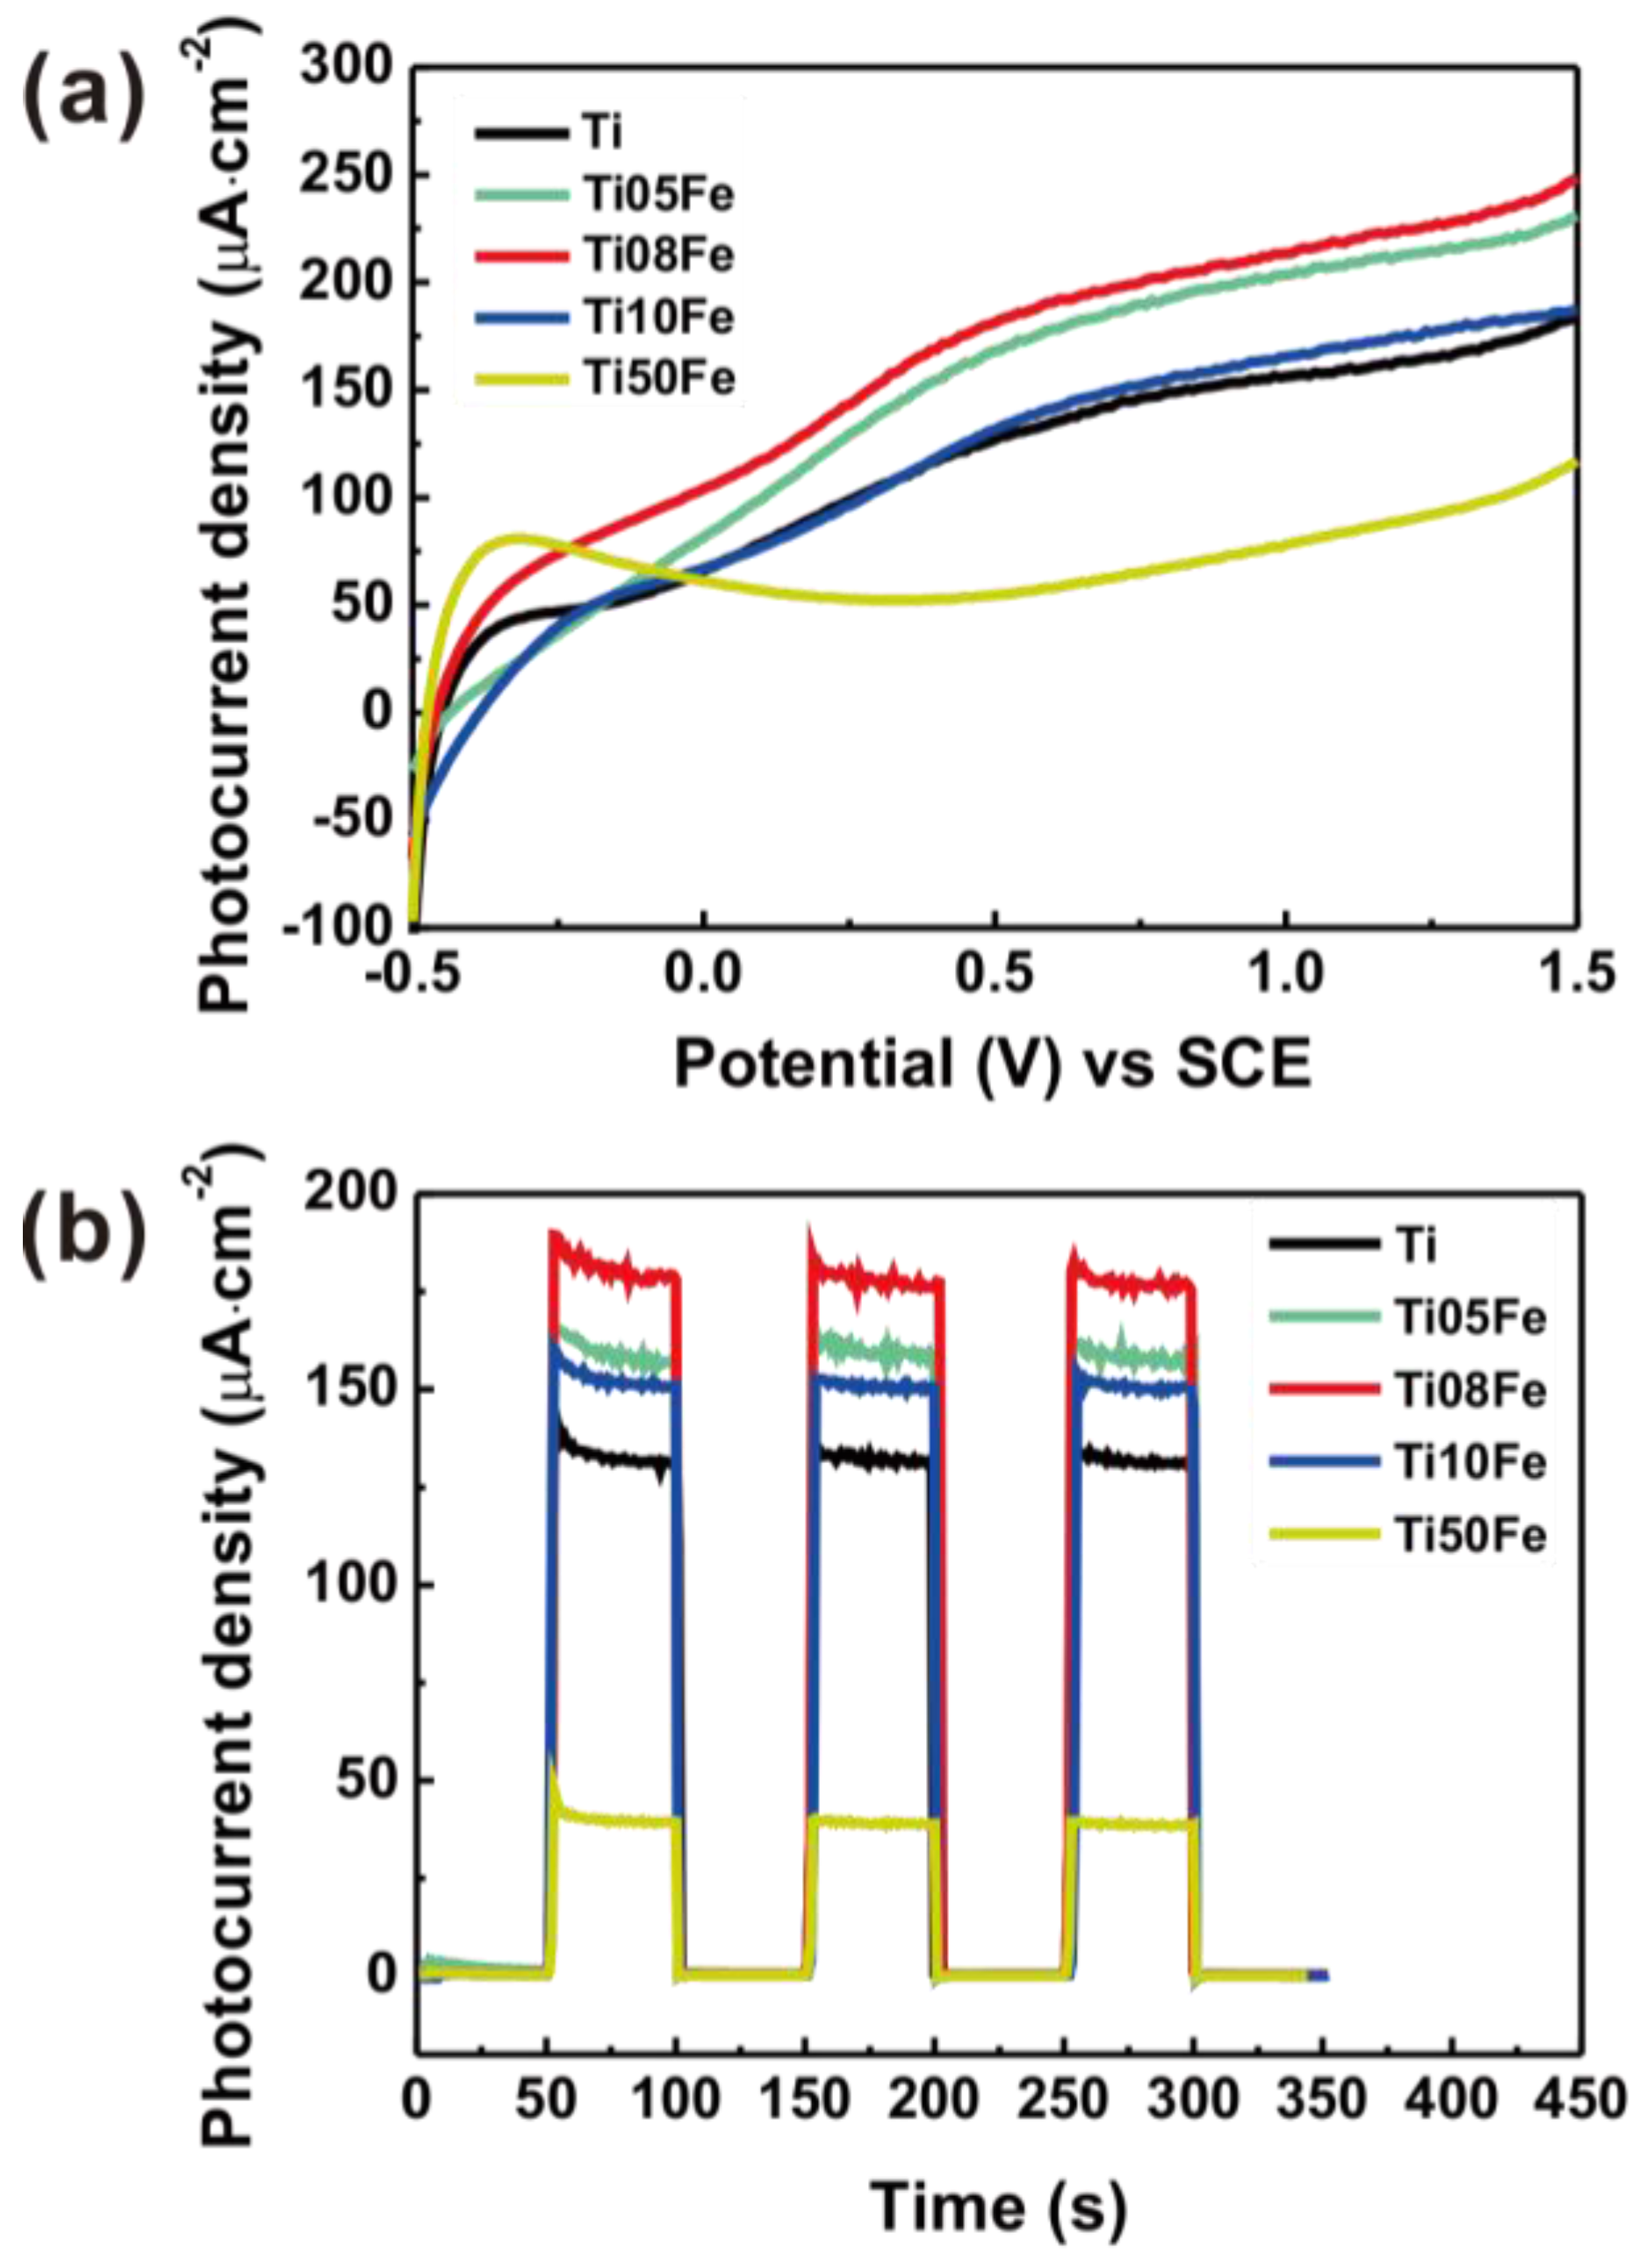
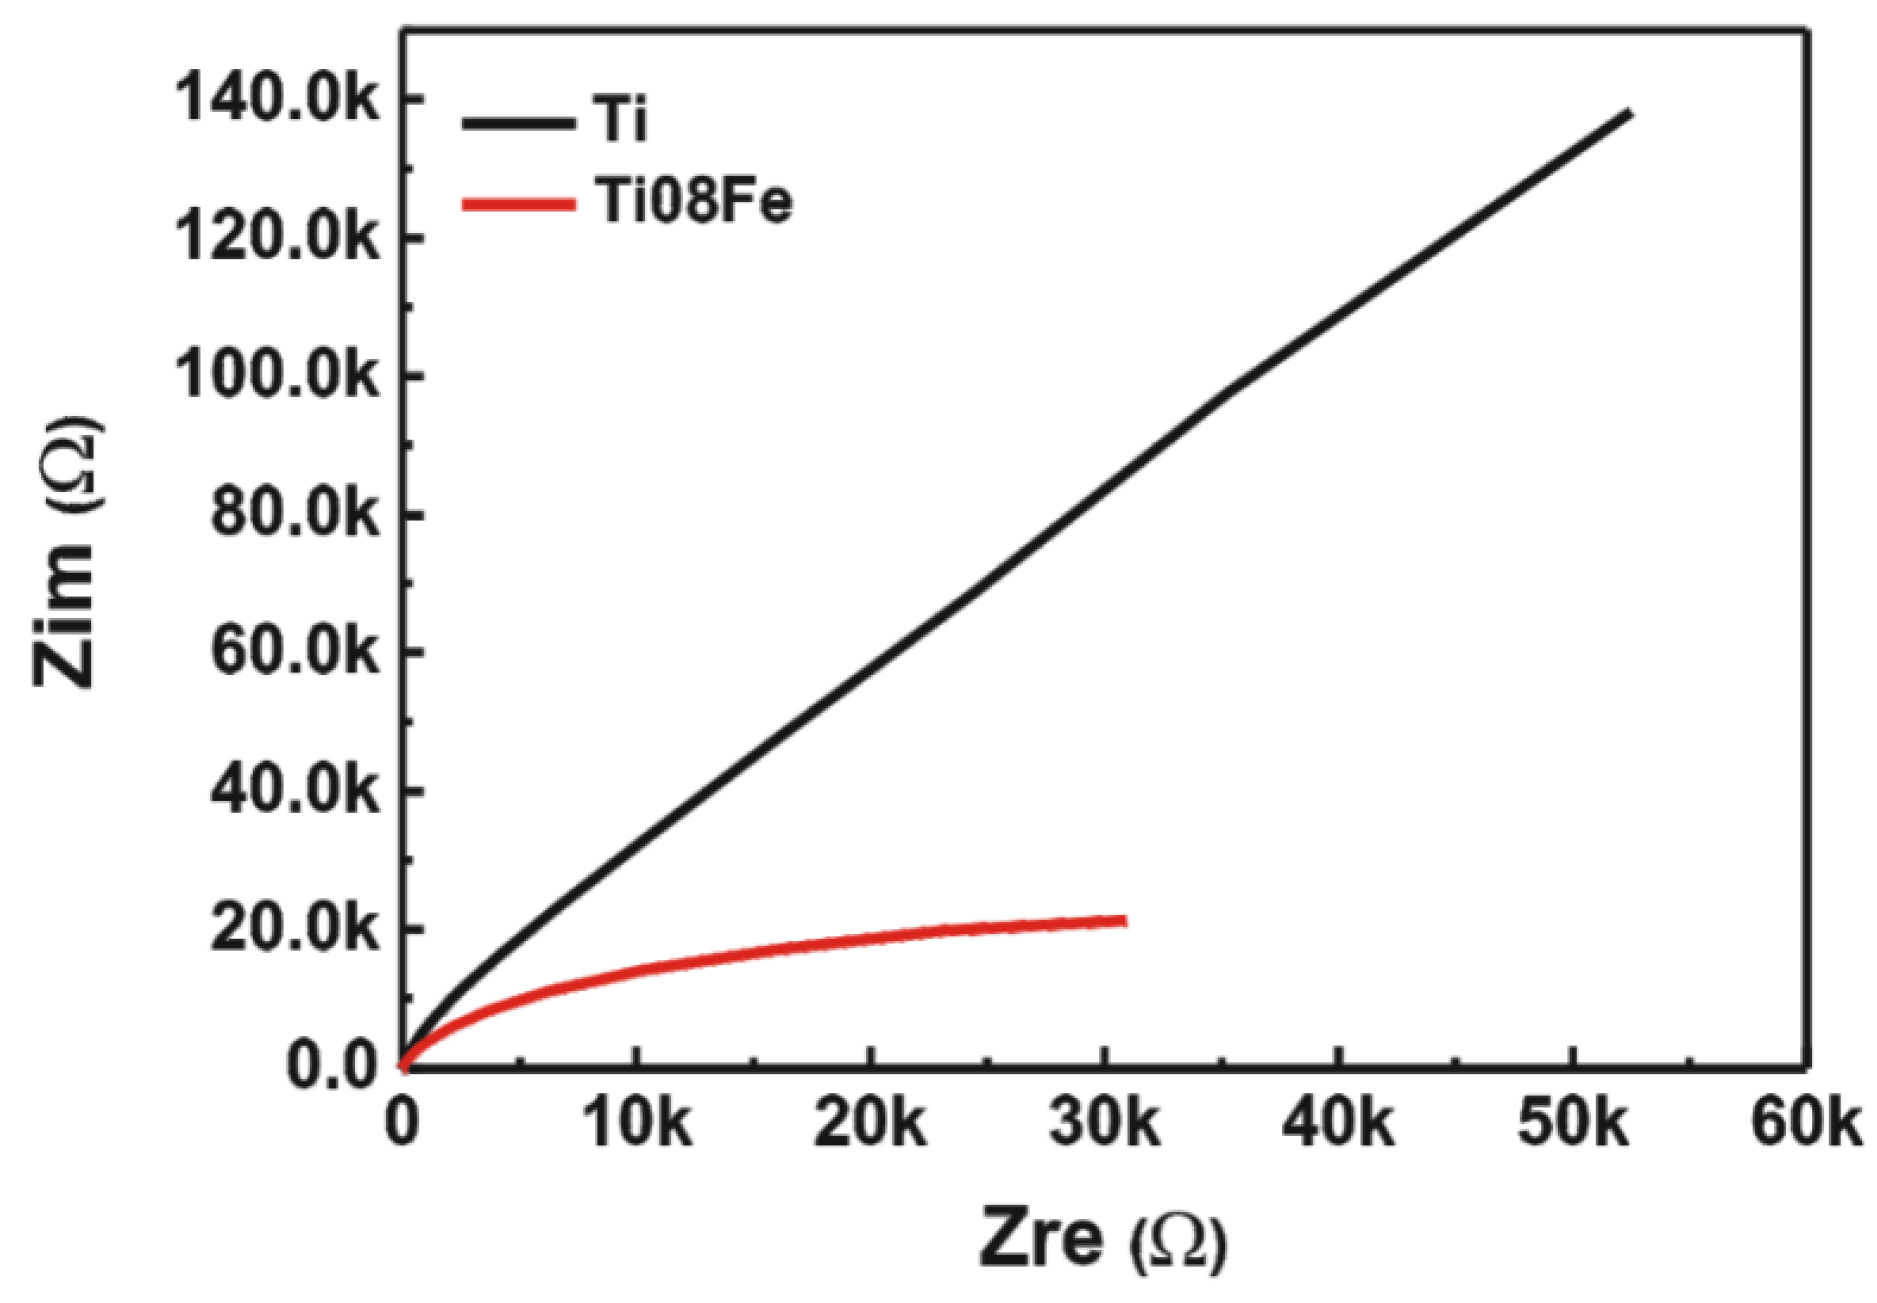
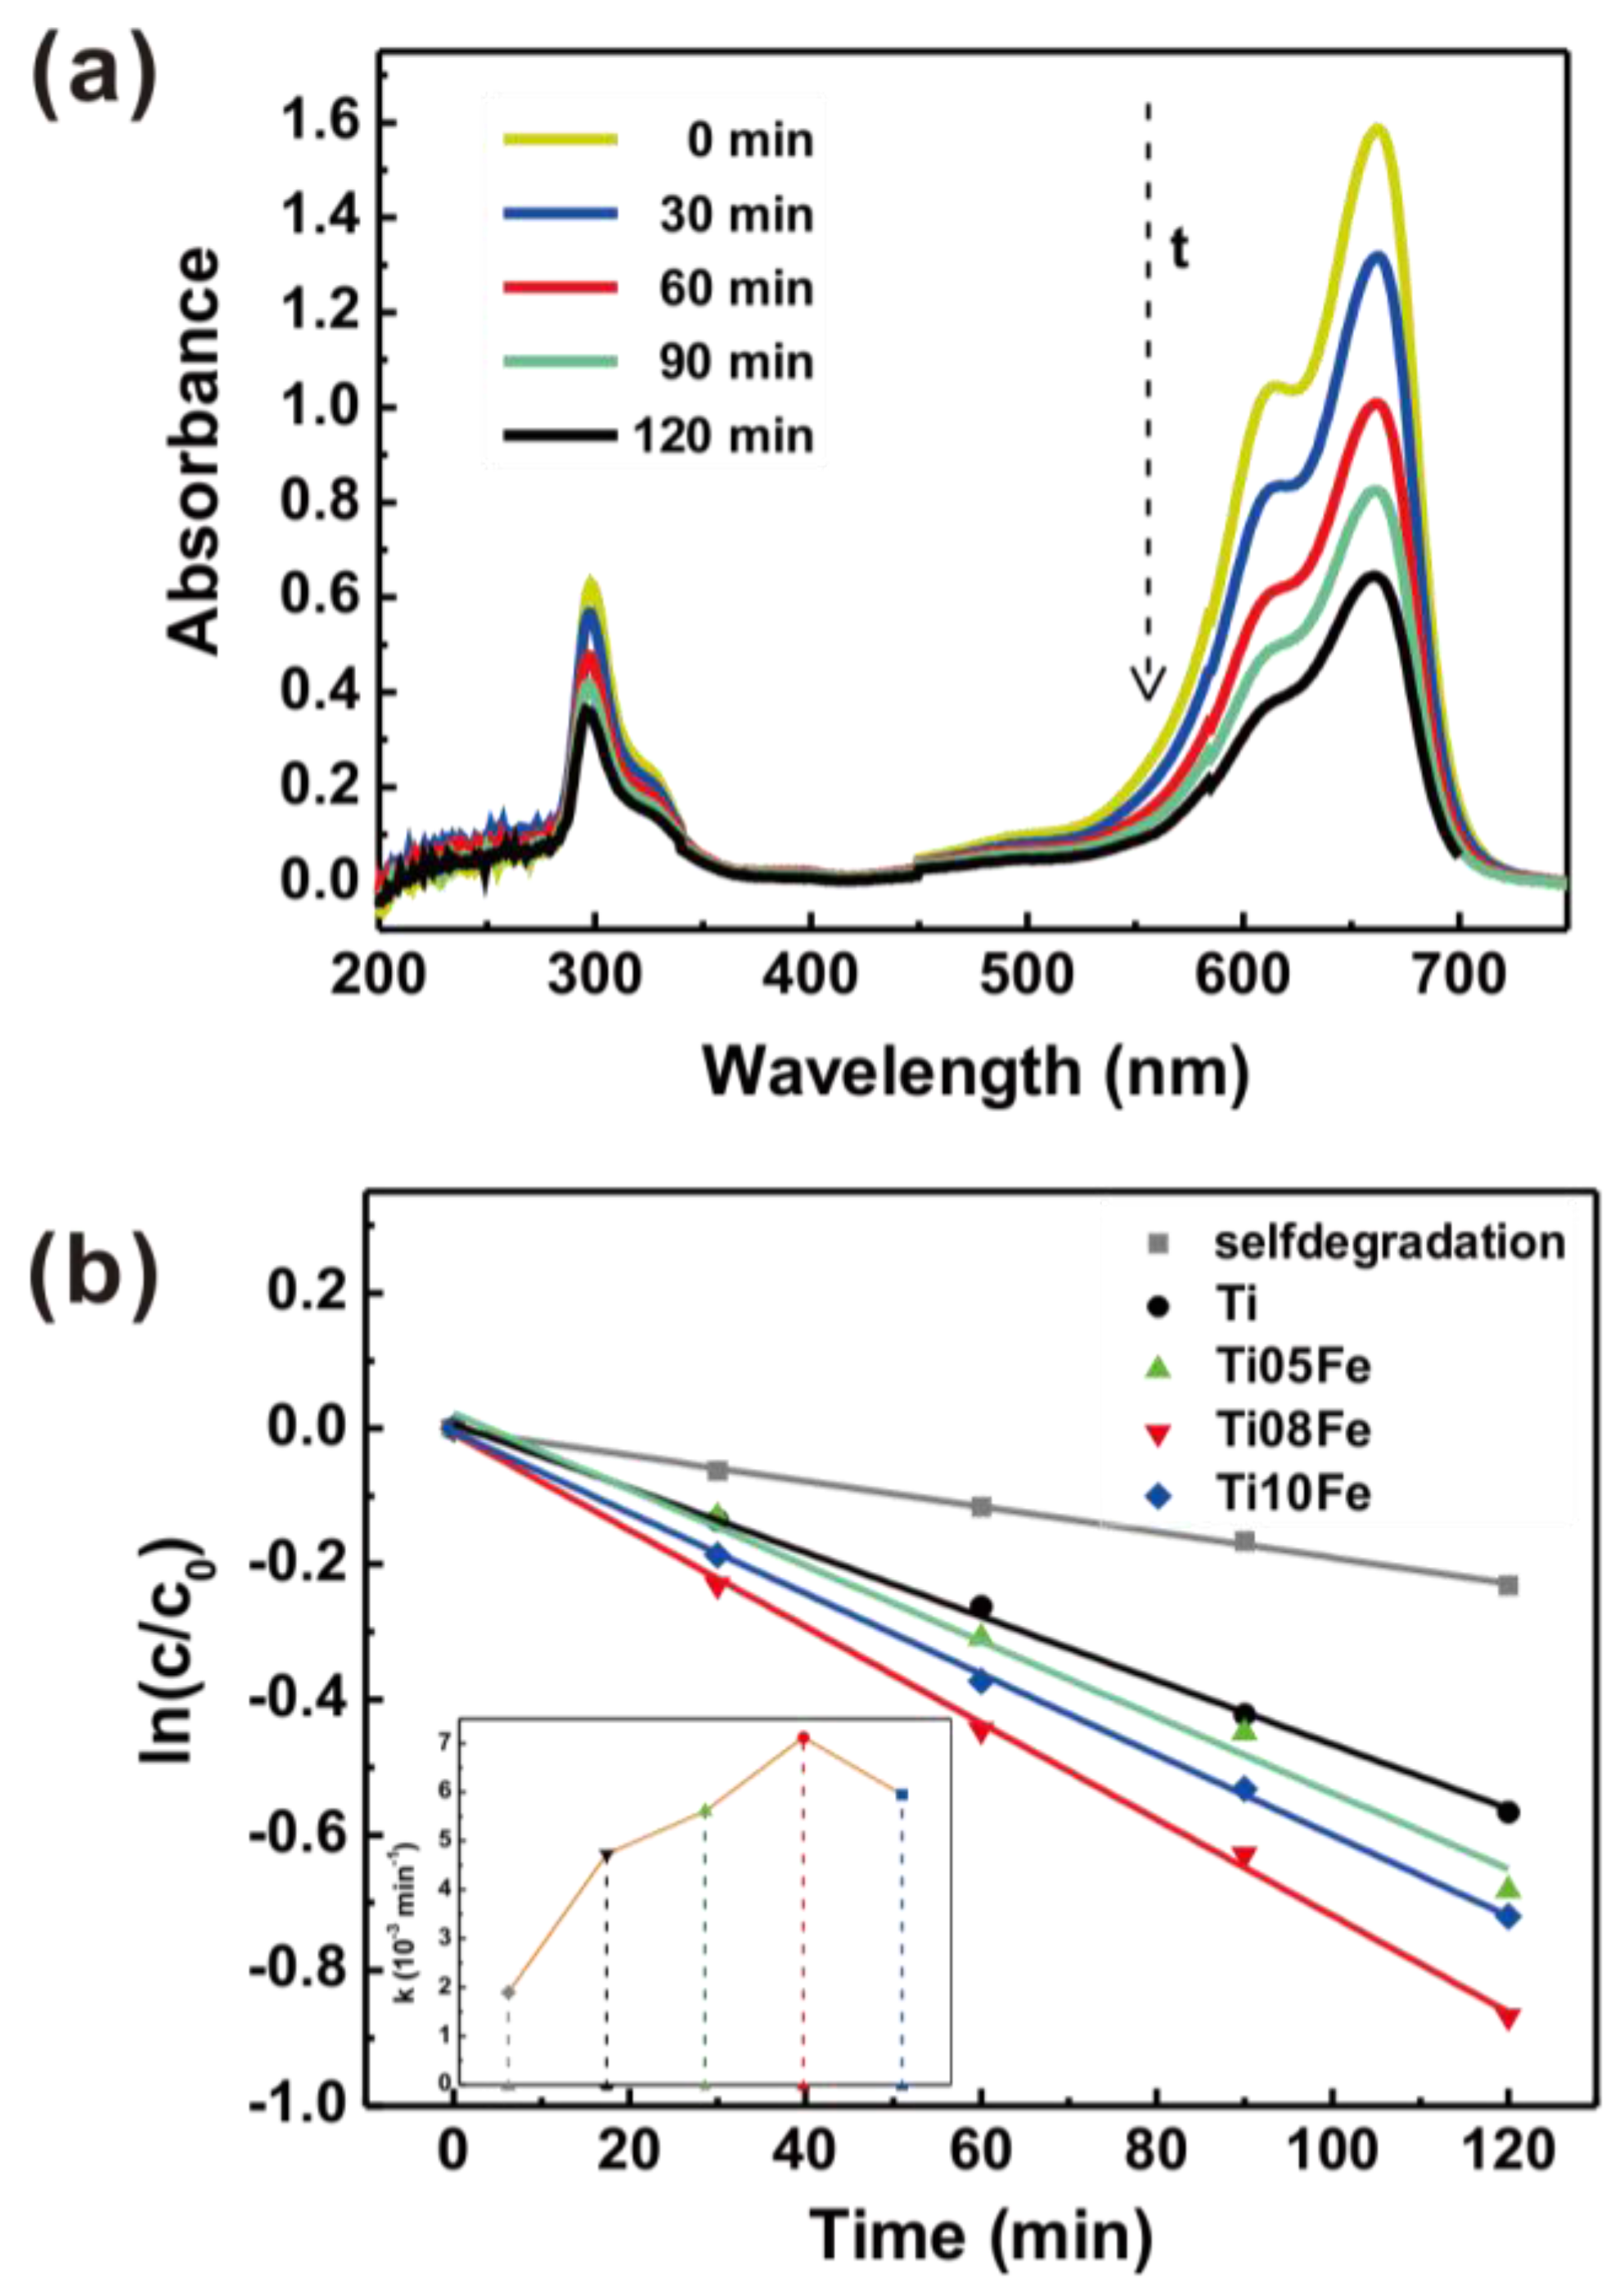
2.4. Photoelectrochemical and Photoelectrocatalytic Activity

The performance of Fe-TNTs in photoelectrochemical activity was tested by measuring the photocurrent. Figure 6a shows the photocurrent spectra of TNTs and Fe-TNTs with different Fe content under Xe lamp irradiation (i.e., UV and visible light irradiation). The photocurrent densities of all the samples except Ti50Fe increased with the increase of applied potential (vs. SCE), indicating the typical photoelectrochemical property of the n-type semiconductor. The photoelectrochemical properties were further examined by transient photocurrent measurement. Figure 6b presents the photocurrent density-time characteristics of the TNTs and Fe-TNTs in 0.1 M Na2SO4 at an applied bias of 0.6 V (vs. SCE) with a pulse of 50 s under UV and visible light irradiation. It can be seen clearly that the photocurrent density increased sharply when the light was switched on, and then decreased to a steady state for each sample. Pure TNTs have a photocurrent density of 131.5 mA·cm−2. With the increase of the Fe content, the photoresponse was firstly enhanced but then inhibited. The Ti08Fe sample exhibited the highest photocurrent density of 179.3 mA·cm−2, while the Ti50Fe sample had the lowest photocurrent density of 39.8 mA·cm−2. Higher photocurrent implies much more enhanced charge separation and a longer lifetime of the photogenerated electron-hole pairs which is closely related to the photoelectrocatalytic activity. When TNTs are irradiated, electrons are excited from the valance band to the conduction band, leaving holes in the valance band. Fe3+ dopant with a proper concentration can act as trapping sites, facilitating the separation of electron-hole pairs. However, excessive Fe3+ may act as the recombination centers of the photogenerated electrons and holes, which results in the decrease of photocurrent density [32]. Therefore, the doping level of Fe3+ plays an important role in the photoelectrochemical behavior of Fe-TNTs and the optimal doping concentration of Fe is 0.8 wt %.
As a widely used electrochemical method, EIS is a powerful and informative tool to study the electron transport processes at the solid-liquid interfaces, and a smaller size of the arc radius on the EIS Nyquist plot means a more rapid rate of electrode reaction [33,34]. Accordingly, the electron transport property of TNTs and Fe-TNTs electrodes was further analyzed by the Nyquist plots of the EIS spectra. As shown in Figure 7, the circular arc radius of Fe-TNTs prepared by anodizing the Ti08Fe alloy was much smaller than that of TNTs under UV and visible light irradiation, suggesting that the introduction of Fe3+ ions was beneficial to the separation of the photo-induced carries (e-h+) and charge transfer at the solid-liquid interface. Therefore, a higher photoelectrocatalytic rate would be expected by incorporating Fe3+ in TNTs.
In order to demonstrate the photo-induced application of Fe-TNTs, their photoelectrocatalytic activity was evaluated by degrading MB under UV and visible light irradiation and the applied bias potential was 0.6 V. Figure 8a shows a series of UV-vis absorption spectra of MB solution degraded by Fe-TNTs prepared by anodizing Ti08Fe alloy. It was reported that demethylation could also occur during the process of MB photodegradation, which could be characterized by the blue shift of the absorption peak at 663 nm in the UV-vis absorption spectrum [35]. In Figure 8a, as the irradiation time increased, the absorption peak at 663 nm dropped vertically with no blue shift observed, indicating the MB was effectively photodegraded. Figure 8b shows the photodegradation kinetics of the MB dye over TNTs and Fe-TNTs with different Fe content. The photocatalytic reactions obeyed pseudo-first-order reaction kinetics, which could be expressed by ln(C/C0) = −kt with k being the apparent first-order reaction constant, while C0 and C are the initial and reaction concentrations of the MB dye, respectively. The reaction constant k for TNTs and Ti08Fe was calculated to be 4.73 × 10⁻³ min−1 and 7.12 × 10⁻³ min−1, respectively. It means that the photoelectrocatalytic activity of Ti08Fe increased 51% more than that of TNTs due to doped Fe3+ ions in TNTs.
On the basis of laser flash photolysis measurements [36,37], the photoelectrocatalytic reaction can be described as follows:
TiO2 + hν → ecb + hvb+
ecb + hvb+ → hν
hvb+ + Red → Red+
ecb + Ox → Ox
Ti4+ + ecb → Ti3+
OH + hvb+ → OH
Ti3+ + OH → Ti4+ + OH
OH + Red → Red+
Ti3+ + Ox → Ox
Upon UV and visible light irradiation, the TiO2 could be excited to generate electron-hole pairs (Equation (1)), while the photogenerated electron-hole pairs could easily recombine (Equation (2)). The separated holes and electrons induced an oxidation (Equation (3)) and reduction (Equation (4)) reaction, respectively. At the same time, a series of thermal reactions and catalytic reactions also happened, such as those where trapping electrons or holes could produce Ti3+ or other active groups (Equations (5) and (6)), respectively. Then the Ti3+ and other active groups would take part in the subsequent redox reactions (Equations (7)–(9)). Most of these electrons and holes recombine within the first few tens of picoseconds after the photoexcitation event [36], suggesting a low quantum efficiency in pure TiO2. Figure 9 illustrates the main charge-transfer behavior in Fe-TNTs. After doping the TNTs with Fe3+, Fe3+ can trap photogenerated holes (Equation (10)) due to the energy level for Fe4+/Fe3+ above the valence band edge of anatase TiO2. The trapped photogenerated holes in Fe4+ can migrate to the surface and absorb hydroxyl ions to produce hydroxyl radicals. At the same time, Fe3+ can also trap photogenerated electrons (Equation (12)) due to the energy level for Fe3+/Fe2+ below the conduction band edge of anatase TiO2 [38,39,40,41]. Subsequently, Fe2+ could be oxidized to Fe3+ by transferring electrons to absorbed O2 on the surface of TiO2 (Equation (13)).
Fe3+ + hvb+ → Fe4+
Fe4+ + OH (ads) → Fe3+ + OH
Fe3+ + ecb → Fe2+
Fe2+ + O2(ads) → Fe3+ + O2
Accordingly, the doping of Fe3+ could depress the recombination of electron-hole pairs and prolong the lifetime of the carriers, which is beneficial for improving the quantum efficiency of the photoelectrocatalytic reaction. When a bias potential was applied, the photogenerated electrons that collected at the photoanode could be transferred to the Pt sheet through the external circuit. The separation of the photogenerated electron-hole pairs was efficiently promoted and thus the photocatalytic efficiency was improved remarkably.

3. Experimental Section

3.1. Preparation of Fe-TNTs

Pure Ti and Ti-Fe alloys with different Fe content (containing 0.5 wt %, 0.8 wt %, 1.0 wt %, and 5.0 wt %, and namely Ti05Fe, Ti08Fe, Ti10Fe and Ti50Fe) were prepared by using an arc-melting apparatus. TNTs and Fe-TNTs were prepared by electrochemical anodization of Ti substrate and Ti-Fe substrates, respectively. Prior to the anodization, the samples were cut into pieces (10 mm 10 mm 2 mm) and polished to a mirror finish, sequentially followed by ultrasonically cleaned in acetone, alcohol, and distilled water. The anodization was performed in 0.5 wt % HF aqueous solution for 20 min at 15 V in a two-electrode cell with samples as the working electrode and platinum foil as the counter electrode at room temperature. After anodization, samples were immediately rinsed with deionized water and dried in air. In order to convert the amorphous phase to the crystalline form, samples were annealed at 450 °C in air for 30 min with a heating rate of 5 °C·min−1 and a cooling rate of 2 °C·min−1.

3.2. Characterization of Fe-TNTs

The morphologies of TNTs and Fe-TNTs were studied by using a field-emission scanning electron microscope (FE-SEM, Hitachi S4800, Hitachi, Tokyo, Japan) and a transmission electron microscopy (TEM, JEM 2100, JEOL, Tokyo, Japan). Additionally, a selected area energy dispersive spectrum (EDS) was performed on the Hitachi-S4800 SEM. The structure characterization of all samples was conducted by X-ray diffraction (XRD, Philips, Amsterdam, The Netherlands, PanalyticalX’pert, Cu Karadiation (λ = 1.5417 Å)), operated at 40 kV and 30 mA. The composition of samples was analyzed by X-ray photoelectron spectroscopy (XPS, VG, Physical Electrons Quantum 2000 Scanning EscaMicroprob, Al Kα radiation, Physical Electronics, Inc., Chanhassen, MN, USA). The binding energies were normalized to the signal for adventitious carbon at 284.8 eV. UV-vis diffuse reflectance spectra (DRS) of the samples were carried out by a UV-vis-NIR spectrophotometer (Varian Cary 5000, Agilent, Santa Clara, CA, USA).

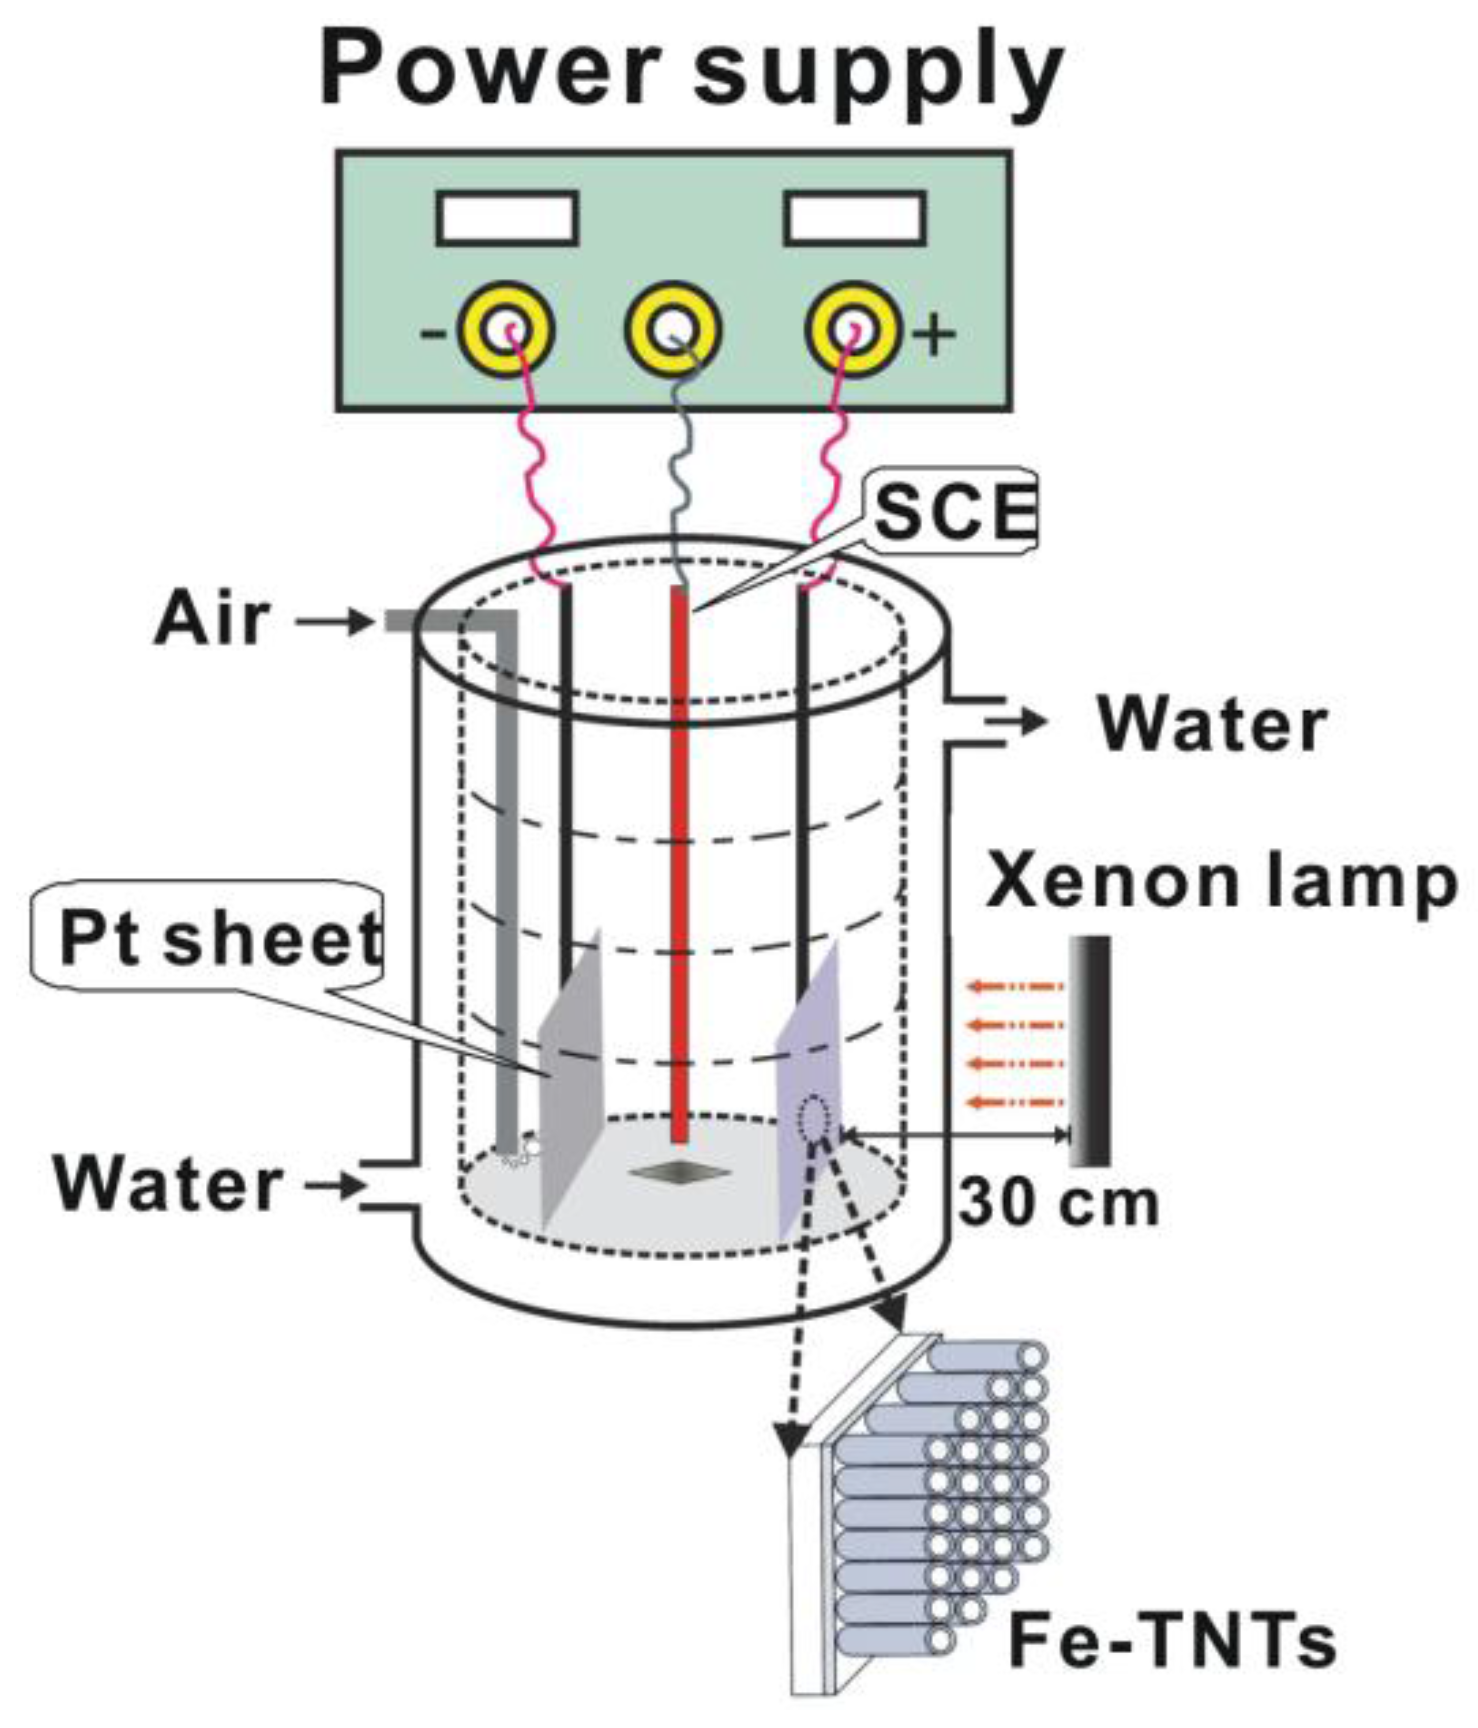
3.3. Photoelectrochemical and Electrochemical Measurement

All the measurements were carried out in a standard three-electrode configuration with a supporting electrolyte of 0.1 M Na2SO4 aqueous solution using the samples, Pt wire and a saturated calomel electrode (SCE) as the working electrode, counter electrode and reference electrode, respectively. Photocurrent was recorded using the Ivium EC portable analyzer (Ivium Technologies BV, Eindhoven, The Netherlands). Additionally, a 300 W Xe lamp was employed as the light source to keep an illumination intensity of 100 mW·cm−2. The EIS spectra were measured by applying an AC voltage of 10 mV amplitude within the frequency range of 105–10−2 Hz.

3.4. Photoelectrocatalytic Measurement

The photoelectrocatalytic activity of the samples was investigated by the degradation of a MB aqueous solution with an initial concentration of 10 mg·L−1 as model pollutant and 0.1 M Na2SO4 as supporting electrolyte in a self-building quartz glass reactor with a water jacket to control the reaction temperature, as shown in Figure 10. A 300 W Xe lamp was employed as the light source. Prior to the photoelectrocatalytic degradation, the samples were soaked in 10 mg·L−1 MB aqueous solution for 30 min while bubbling with air to reach adsorption equilibrium. After irradiation started, the solution periodically taken from the reactor was analyzed with a UV-vis spectrophotometer (Unico UV-2102 PC, Unico Instrument Co., Ltd., Shanghai, China).

4. Conclusions

Highly ordered Fe-TNTs were successfully fabricated by direct anodization of Ti-Fe alloys with different Fe contents. In all cases, ordered nanotube array layers homogeneously grew on Ti and Ti-Fe alloys, and no appreciable structure and morphology difference could be observed. The Fe3+ doping at a relatively weak level can obviously enhance the photoelectrochemical activity of TNTs. On the contrary, when the Fe3+ doping amount exceeded a certain level, the photoelectrochemical activity of TNTs remarkably decreased. The Fe-TNTs prepared by anodizing Ti08Fe alloy exhibited the highest photocurrent density and photoelectrocatalytic degradation rate of MB. The Fe-TNTs prepared by anodizing the Ti-Fe alloys may be a promising material not only for organic pollutant degradation but also for the other photocatalytic applications due to abundant Ti and Fe in the earth.

Acknowledgments

This work was supported by the National Natural Science Foundation of China (21321062 and 51402249) and NFFTBS (J1310024).

Author Contributions

The experimental design was planned by Lan Sun and Changjian Lin. The experimental word and data analysis were performed by Jiangdong Yu, Zhi Wu, Cheng Gong and Wang Xiao.

Conflicts of Interest

The authors declare no conflict of interest.

References

  1. Macdonald, T.J.; Tune, D.D.; Dewi, M.R.; Gibson, C.T.; Shapter, J.G.; Nann, T. A TiO2 Nanofiber–Carbon Nanotube–Composite Photoanode for Improved Efficiency in Dye–Sensitized Solar Cells. ChemSusChem 2015, 8, 3396–3400. [Google Scholar] [CrossRef] [PubMed]
  2. Macdonald, T.J.; Xu, J.; Elmas, S.; Mange, Y.J.; Skinner, W.M.; Xu, H.; Nann, T. NiO Nanofibers as a Candidate for a Nanophotocathode. Nanomaterials 2014, 4, 256–266. [Google Scholar] [CrossRef]
  3. Tran, D.P.; Macdonald, T.J.; Wolfrum, B.; Stockmann, R.; Nann, T.; Offenhäusser, A.; Thierry, B. Photoresponsive properties of ultrathin silicon nanowires. Appl. Phys. Lett. 2014, 105. [Google Scholar] [CrossRef]
  4. Tune, D.D.; Flavel, B.S.; Krupke, R.; Shapter, J.G. Carbon Nanotube-Silicon Solar Cells. Adv. Energy Mater. 2012, 2, 1043–1055. [Google Scholar] [CrossRef]
  5. Macdonald, T.J.; Tune, D.D.; Dewi, M.R.; Bear, J.C.; McNaughter, P.D.; Mayes, A.G.; Skinner, W.M.; Parkin, I.P.; Shapter, J.G.; Nann, T. SWCNT photocathodes sensitised with InP/ZnS core–shell nanocrystals. J. Mater. Chem. C 2016, 4, 3379–3384. [Google Scholar] [CrossRef]
  6. Gong, D.; Grimes, C.A.; Varghese, O.K.; Hu, W.; Singh, R.; Chen, Z.; Dickey, E.C. Titanium oxide nanotube arrays prepared by anodic oxidation. J. Mater. Res. 2001, 16, 3331–3334. [Google Scholar] [CrossRef]
  7. Xie, K.; Sun, L.; Wang, C.; Lai, Y.; Wang, M.; Chen, H.; Lin, C. Photoelectrocatalytic properties of Ag nanoparticles loaded TiO2 nanotube arrays prepared by pulse current deposition. Electrochim. Acta 2010, 55, 7211–7218. [Google Scholar] [CrossRef]
  8. Jang, J.S.; Choi, S.H.; Kim, D.H.; Jang, J.W.; Lee, K.S.; Lee, J.S. Enhanced photocatalytic hydrogen production from water−methanol solution by nickel intercalated into titanate nanotube. J. Phys. Chem. C 2009, 113, 8990–8996. [Google Scholar] [CrossRef]
  9. Yang, Y.; Lee, K.; Kado, Y.; Schmuki, P. Nb-doping of TiO2/SrTiO3 nanotubular heterostructures for enhanced photocatalytic water splitting. Electrochem. Commun. 2012, 17, 56–59. [Google Scholar] [CrossRef]
  10. Wu, H.; Zhang, Z. High photoelectrochemical water splitting performance on nitrogen doped double-wall TiO2 nanotube array electrodes. Int. J. Hydrogen Energy 2011, 36, 13481–13487. [Google Scholar] [CrossRef]
  11. Murdoch, M.; Waterhouse, G.; Nadeem, M.; Metson, J.; Keane, M.; Howe, R.; Llorca, J.; Idriss, H. The effect of gold loading and particle size on photocatalytic hydrogen production from ethanol over Au/TiO2 nanoparticles. Nat. Chem. 2011, 3, 489–492. [Google Scholar] [CrossRef] [PubMed]
  12. Wu, Z.; Su, Y.; Yu, J.; Xiao, W.; Sun, L.; Lin, C. Enhanced photoelectrocatalytic hydrogen production activity of SrTiO3–TiO2 hetero-nanoparticle modified TiO2 nanotube arrays. Int. J. Hydrogen Energy 2015, 40, 9704–9712. [Google Scholar] [CrossRef]
  13. Yu, J.; Gong, C.; Wu, Z.; Wu, Y.; Xiao, W.; Su, Y.; Sun, L.; Lin, C. Efficient visible light-induced photoelectrocatalytic hydrogen production using CdS sensitized TiO2 nanorods on TiO2 nanotube arrays. J. Mater. Chem. A 2015, 3, 22218–22226. [Google Scholar] [CrossRef]
  14. Mor, G.K.; Shankar, K.; Paulose, M.; Varghese, O.K.; Grimes, C.A. Use of highly-ordered TiO2 nanotube arrays in dye-sensitized solar cells. Nano Lett. 2006, 6, 215–218. [Google Scholar] [CrossRef] [PubMed]
  15. Mor, G.K.; Prakasam, H.E.; Varghese, O.K.; Shankar, K.; Grimes, C.A. Vertically oriented Ti-Fe-O nanotube array films: Toward a useful material architecture for solar spectrum water photoelectrolysis. Nano Lett. 2007, 7, 2356–2364. [Google Scholar] [CrossRef] [PubMed]
  16. Su, Y.; Wu, Z.; Wu, Y.; Yu, J.; Sun, L.; Lin, C. Acid Orange II degradation through a heterogeneous Fenton-like reaction using Fe–TiO2 nanotube arrays as a photocatalyst. J. Mater. Chem. A 2015, 3, 8537–8544. [Google Scholar] [CrossRef]
  17. Wang, C.-Y.; Böttcher, C.; Bahnemann, D.W.; Dohrmann, J.K. A comparative study of nanometer sized Fe (III)-doped TiO2 photocatalysts: Synthesis, characterization and activity. J. Mater. Chem. 2003, 13, 2322–2329. [Google Scholar] [CrossRef]
  18. Nair, P.B.; Justinvictor, V.; Daniel, G.P.; Joy, K.; Ramakrishnan, V.; Kumar, D.D.; Thomas, P. Structural, optical, photoluminescence and photocatalytic investigations on Fe doped TiO2 thin films. Thin Solid Films 2014, 550, 121–127. [Google Scholar] [CrossRef]
  19. Sun, L.; Li, J.; Wang, C.; Li, S.; Chen, H.; Lin, C. An electrochemical strategy of doping Fe3+ into TiO2 nanotube array films for enhancement in photocatalytic activity. Sol. Energy Mater. Sol. Cells 2009, 93, 1875–1880. [Google Scholar] [CrossRef]
  20. Wu, Q.; Ouyang, J.; Xie, K.; Sun, L.; Wang, M.; Lin, C. Ultrasound-assisted synthesis and visible-light-driven photocatalytic activity of Fe-incorporated TiO2 nanotube array photocatalysts. J. Hazard. Mater. 2012, 199, 410–417. [Google Scholar] [CrossRef] [PubMed]
  21. Allam, N.K.; Alamgir, F.; El-Sayed, M.A. Enhanced photoassisted water electrolysis using vertically oriented anodically fabricated Ti–Nb–Zr–O mixed oxide nanotube arrays. ACS Nano 2010, 4, 5819–5826. [Google Scholar] [CrossRef] [PubMed]
  22. Ma, Q.; Liu, S.; Weng, L.; Liu, Y.; Liu, B. Growth, structure and photocatalytic properties of hierarchical Cu–Ti–O nanotube arrays by anodization. J. Alloys Compd. 2010, 501, 333–338. [Google Scholar] [CrossRef]
  23. Nah, Y.-C.; Ghicov, A.; Kim, D.; Berger, S.; Schmuki, P. TiO2–WO3 composite nanotubes by alloy anodization: Growth and enhanced electrochromic properties. J. Am. Chem. Soc. 2008, 130, 16154–16155. [Google Scholar] [CrossRef] [PubMed]
  24. Wang, X.; Zhao, J.; Kang, Y.; Li, L.; Xu, X. Photoelectrochemical properties of Fe-doped TiO2 nanotube arrays fabricated by anodization. J. Appl. Electrochem. 2014, 44, 1–4. [Google Scholar] [CrossRef]
  25. Tu, Y.-F.; Huang, S.-Y.; Sang, J.-P.; Zou, X.-W. Preparation of Fe-doped TiO2 nanotube arrays and their photocatalytic activities under visible light. Mater. Res. Bull. 2010, 45, 224–229. [Google Scholar] [CrossRef]
  26. Zhu, J.; Chen, F.; Zhang, J.; Chen, H.; Anpo, M. Fe3+-TiO2 photocatalysts prepared by combining sol–gel method with hydrothermal treatment and their characterization. J. Photochem. Photobiol. A 2006, 180, 196–204. [Google Scholar] [CrossRef]
  27. Tong, T.; Zhang, J.; Tian, B.; Chen, F.; He, D. Preparation of Fe3+-doped TiO2 catalysts by controlled hydrolysis of titanium alkoxide and study on their photocatalytic activity for methyl orange degradation. J. Hazard. Mater. 2008, 155, 572–579. [Google Scholar] [CrossRef] [PubMed]
  28. Lai, Y.; Sun, L.; Chen, Y.; Zhuang, H.; Lin, C.; Chin, J.W. Effects of the structure of TiO2 nanotube array on Ti substrate on its photocatalytic activity. J. Electrochem. Soc. 2006, 153, D123–D127. [Google Scholar] [CrossRef]
  29. Xu, Z.; Yu, J. Visible-light-induced photoelectrochemical behaviors of Fe-modified TiO2 nanotube arrays. Nanoscale 2011, 3, 3138–3144. [Google Scholar] [CrossRef] [PubMed]
  30. Yu, J.; Xiang, Q.; Zhou, M. Preparation, characterization and visible-light-driven photocatalytic activity of Fe-doped titania nanorods and first-principles study for electronic structures. Appl. Catal. B 2009, 90, 595–602. [Google Scholar] [CrossRef]
  31. Yang, Y.; Tian, C. Effects of calcining temperature on photocatalytic activity of Fe-doped sulfated titania. Photochem. Photobiol. 2012, 88, 816–823. [Google Scholar] [CrossRef] [PubMed]
  32. Litter, M.; Navio, J.A. Photocatalytic properties of iron-doped titania semiconductors. J. Photochem Photobiol. A 1996, 98, 171–181. [Google Scholar] [CrossRef]
  33. Liu, H.; Cheng, S.; Wu, M.; Wu, H.; Zhang, J.; Li, W.; Cao, C. Photoelectrocatalytic degradation of sulfosalicylic acid and its electrochemical impedance spectroscopy investigation. J. Phys. Chem. A 2000, 104, 7016–7020. [Google Scholar] [CrossRef]
  34. Liu, H.; Li, X.; Leng, Y.; Li, W. An alternative approach to ascertain the rate-determining steps of TiO2 photoelectrocatalytic reaction by electrochemical impedance spectroscopy. J. Phys. Chem. B 2003, 107, 8988–8996. [Google Scholar] [CrossRef]
  35. Hoffmann, M.R.; Martin, S.T.; Choi, W.; Bahnemann, D.W. Environmental applications of semiconductor photocatalysis. Chem. Rev. 1995, 95, 69–96. [Google Scholar] [CrossRef]
  36. Tomkiewicz, M. Scaling properties in photocatalysis. Catal. Today 2000, 58, 115–123. [Google Scholar] [CrossRef]
  37. Harifi, T.; Montazer, M. Fe3+: Ag/TiO2 nanocomposite: Synthesis, characterization and photocatalytic activity under UV and visible light irradiation. Appl. Catal. A 2014, 473, 104–115. [Google Scholar] [CrossRef]
  38. Mizushima, K.; Tanaka, M.; Asai, A.; Iida, S.; Goodenough, J.B. Impurity levels of iron-group ions in TiO2 (II). J. Phys. Chem. Solids 1979, 40, 1129–1140. [Google Scholar] [CrossRef]
  39. Mizushima, K.; Tanaka, M.; Iida, S. Energy levels of iron group impurities in TiO2. J. Phys. Soc. Jap. 1972, 32, 1519–1524. [Google Scholar] [CrossRef]
  40. Yogi, C.; Kojima, K.; Wada, N.; Tokumoto, H.; Takai, T.; Mizoguchi, T.; Tamiaki, H. Photocatalytic degradation of methylene blue by TiO2 film and Au particles-TiO2 composite film. Thin Solid Films 2008, 516, 5881–5884. [Google Scholar] [CrossRef]
  41. Mo, S.-D.; Lin, L.; Lin, D. Electron states of iron group impurities in doped rutile (TiO2). J. Phys. Chem. Solids 1994, 55, 1309–1313. [Google Scholar]
Figure 1. Top-view scanning electron microscope (SEM) images of the nanotube arrays grown on (a) Ti; (b) Ti05Fe; (c) Ti08Fe; (d) Ti10Fe; (e) Ti50Fe and (f) energy dispersive spectrum (EDS) pattern of Ti08Fe. The insets were the corresponding cross-sectional images.
Nanomaterials 06 00107 g001
Figure 2. Transmission electron microscopy (TEM) images of Fe-TNTs based on Ti08Fe: (a) low magnification of top-view image; (b) low magnification of cross-section-view image; (c) high magnification of cross-section-view image; and (d) HRTEM image. TNTs: TiO2 nanotube arrays (TNTs).
Nanomaterials 06 00107 g002
Figure 3. X-ray diffraction (XRD) patterns of the nanotube arrays grown on Tiand different Ti-Fe alloys.
Nanomaterials 06 00107 g003
Figure 4. X-ray photoelectron spectroscopy (XPS) survey spectrum of Fe-TNTs (a) and high resolution XPS spectra of Fe 2p (b); Ti 2p (c) and O 1s (d) of Fe-TNTs.
Nanomaterials 06 00107 g004
Figure 5. UV-vis diffuse reflectance spectra of TNTs and Fe-TNTs prepared by anodizing Ti-Fe alloys with different Fe content.
Nanomaterials 06 00107 g005
Figure 6. (a) J-V and (b) J-t curves with a bias of 0.6 V for all samples under Xe lamp irradiation.
Nanomaterials 06 00107 g006
Figure 7. Electrochemical impedance spectroscopy (EIS) Nyquist plots for TNTs and Fe-TNTs prepared by anodizing Ti08Fe alloy under Xe lamp irradiation.
Nanomaterials 06 00107 g007
Figure 8. (a) UV-vis absorption spectra of methylene blue (MB) solution photoelectrodegraded by Ti08Fe and (b) MB degradation kinetic curves of TNTs and Fe-TNTs.
Nanomaterials 06 00107 g008
Figure 9. Schematic illustrating the separation and transport of charge carriers in the process of photoelectrocatalytic degradation over Fe-TNTs.
Nanomaterials 06 00107 g009
Figure 10. Schematic diagram of a photoelectrochemical cell for photoelectrocatalytic degradation of organic pollutant by capitalizing on Fe-TNTs (or TNTs) as working electrode, Pt as counter electrode, and saturated calomel electrode (SCE) as the reference electrode, respectively.
Nanomaterials 06 00107 g010
Table 1. Composition of the as-prepared Fe-TNTs (TiO2 nanotube arrays) based on different Fe-Ti alloys (atomic percentage according to energy dispersive spectrum (EDS)).
SamplesCFTiOFe
Ti05Fe2.662.5242.6551.610.55
Ti08Fe3.132.1442.1951.670.87
Ti10Fe3.202.6041.6651.431.11
Ti50Fe3.040.8138.6152.704.83

