In the preparation process of CNF/CdS nanocomposite via in situ compositing, a number of factors may have influences on the CdS particles size and size distribution and, thus, the photoluminescence performance of the CNF/CdS nanocomposite may change. The involved factors include the adsorption of Cd2+ precursor on CNFs, the generation of CdS and its compositing on the CNFs. This paper mainly studies the following three aspects, the -COOH/Cd2+ ratios, the Na2S feeding time and the ultrasonic maturing time.
2.1. Effect of –COOH/Cd2+ Ratio
Firstly, the effects of –COOH/Cd
2+ ratios on the morphology structure of the CNFs/CdS nanocomposite material were studied. The experiment was carried out on the following conditions: the feeding time of Na
2S was 20 min, the ultrasonic maturing time was 60 min, and the –COOH/Cd
2+ ratios were 0.5, 1.0, and 2.0. The results are shown in
Figure 1. From
Figure 1, the particle size and distribution of CdS were obtained using Nano Measurer software (Microsoft Corporation, Redmond, WA, USA). The results are shown in
Figure 2.
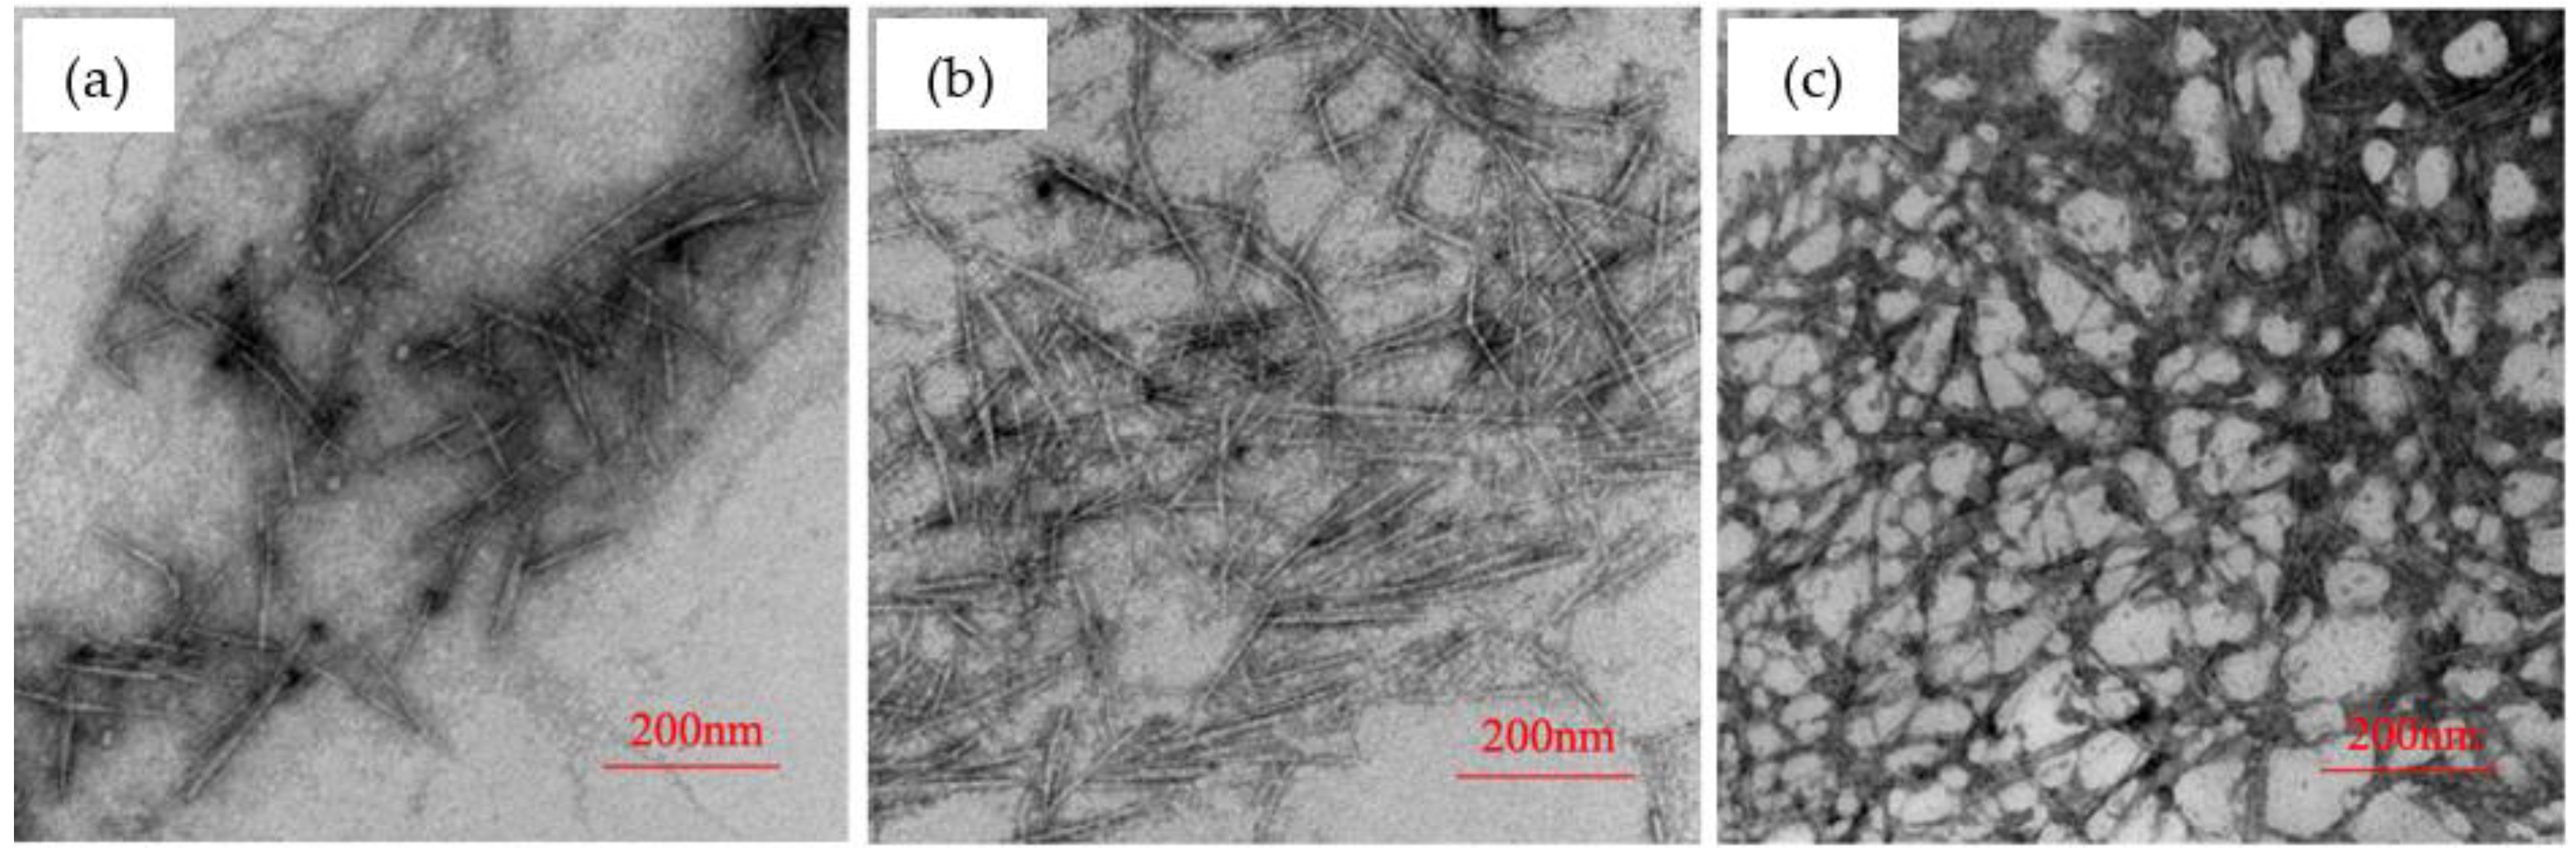
Figure 1 presents the distribution change of CdS nanoparticles on the CNFs with the variation of the –COOH/Cd
2+ ratio. The black points are CdS nanoparticles. It could be seen from the transmission electron microscope (TEM) image that the CdS nanoparticles were all uniformly dispersed onto the CNFs for three CNF/CdS nanocomposites prepared with different –COOH/Cd
2+ ratios. This indicated that the CdS nanocomposite materials with CNFs as organic carriers could be successfully prepared by an in situ compositing method. The generation position of CdS was controlled by the position of –COOH on the CNFs.
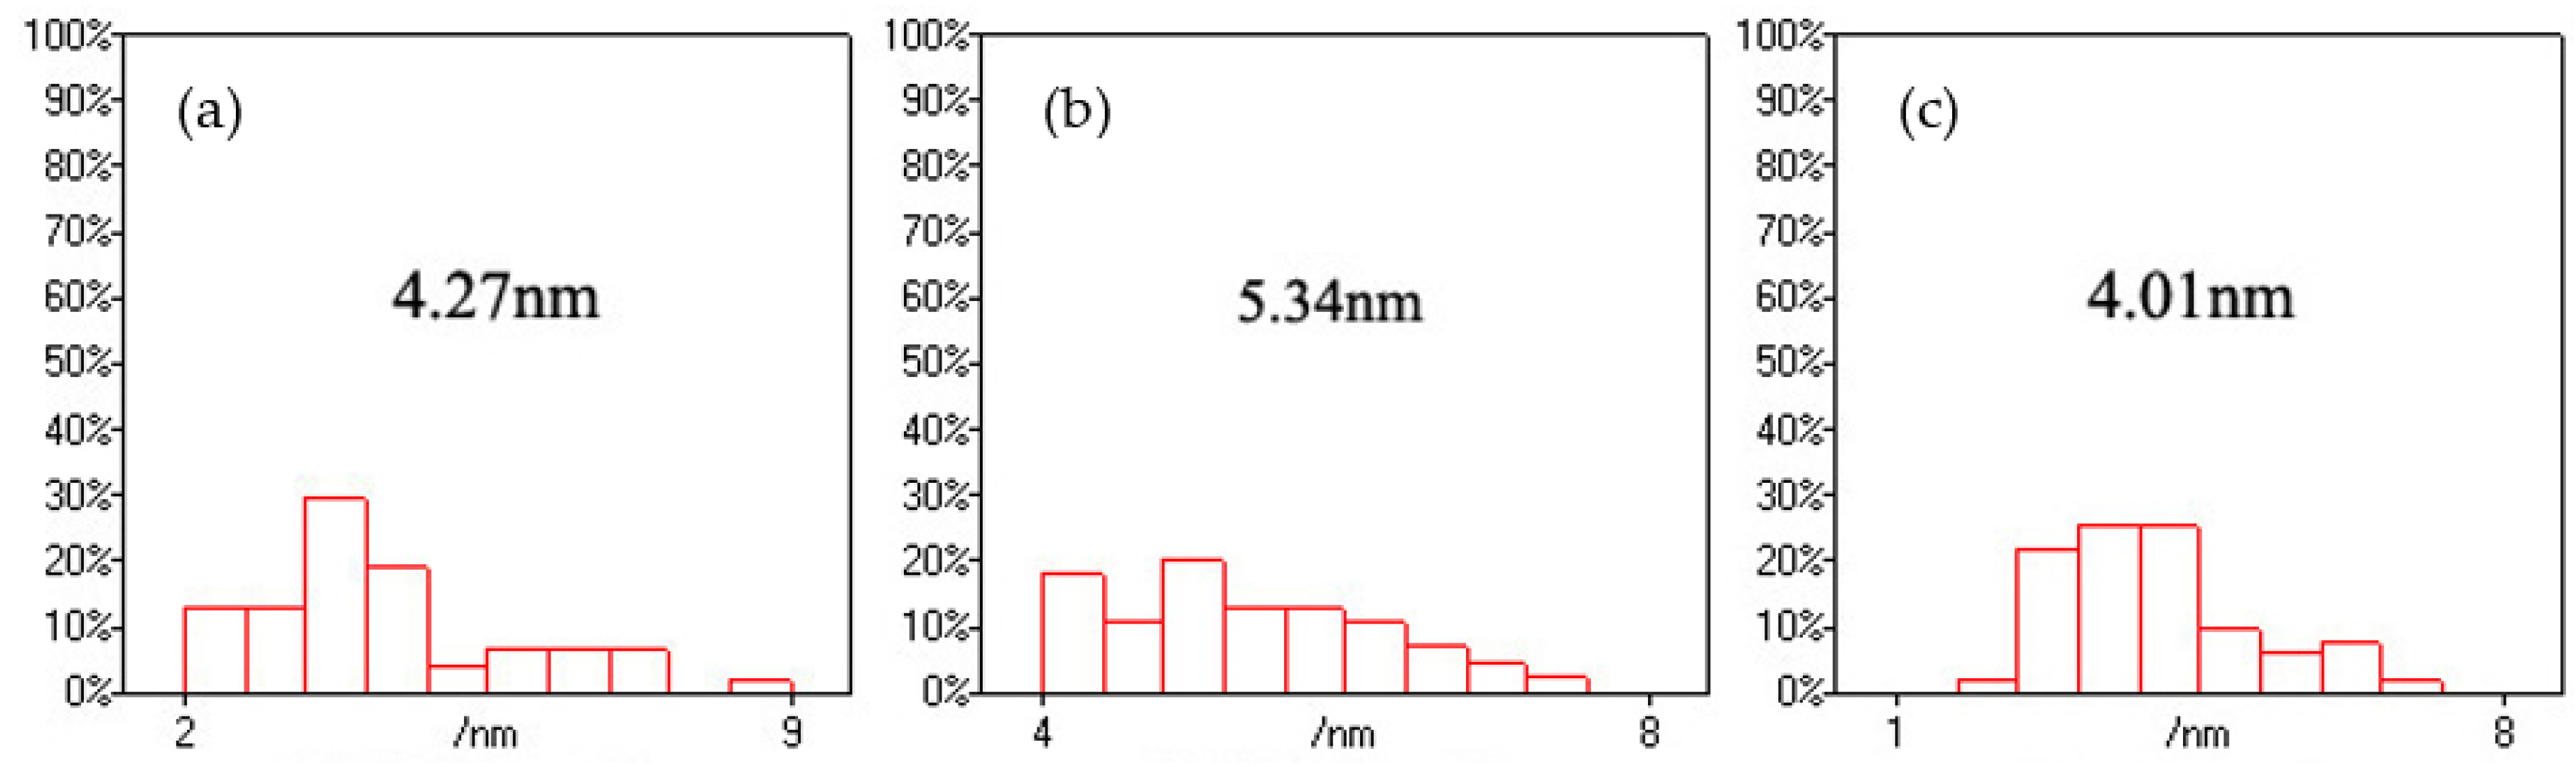
Figure 2 shows the size distribution of the CdS nanoparticles. When the –COOH/Cd
2+ ratio was 0.5, the average size of CdS nanoparticles in the CNF/CdS nanocomposite was 4.27 nm, and the particle size was distributed in the range of 2–9 nm. The particles with sizes of 3.3–4.7 nm accounted for 50% of all CdS particles, indicating the wide size distribution. In other words, the uniformity of CdS particle size was poor. When the –COOH/Cd
2+ ratio was 1.0, the average size of CdS was clearly increased to 5.34 nm. Moreover, the particle sizes were fully distributed in the range of 4.0–7.5 nm. The distribution width was lower than that of the sample with a –COOH/Cd
2+ ratio of 0.5. Therefore, the uniformity of CdS particle size distribution was improved. When the –COOH/Cd
2+ ratio was 2.0, the average particle size of CdS was reduced to 4.01 nm. In this case, the particles with sizes of 2.3–4.3 nm accounted for 72% of particles, indicating the further improvement in the uniformity of particle size distribution. Dai et al. [
17] found that the size of CdS nanoparticles also increases with increasing precursor (CdCl
2 and Na
2S) concentration. In this study, varying the ratio of –COOH and Cd
2+ was used to control the adsorption amount of Cd
2+ onto the CNFs. As a result, the size of the generated CdS nanoparticles was adjusted. Moreover, the distribution and distribution uniformity of the CdS nanoparticles on the CNFs were controlled through the localized adsorption of Cd
2+ by –COOH. When the –COOH/Cd
2+ ratio was 0.5, the amount of Cd
2+ adsorbed by the CNFs was small. Therefore, the average size of CdS nanoparticles in the CNF/CdS nanocomposite was small. The compositing amount was also relatively low. When the –COOH/Cd
2+ ratio was increased to 1.0, the content of –COOH increased, leading to an increase in the amount of Cd
2+ adsorbed by the CNFs. After adding Na
2S, the number of generated CdS nanoparticles increased. Meanwhile, the particle size also increased. When the –COOH/Cd
2+ ratio was 2.0, the content of –COOH on the CNFs further increased; thus, the numbers of composited CdS nanoparticles increased. In addition, due to the chemical anchoring effect of –COOH on CNFs, the adsorbed Cd
2+ was uniformly distributed onto the CNFs. Therefore, the number of generated CdS crystal nuclei increased. The particle size of CdS decreased while the distribution uniformity improved.
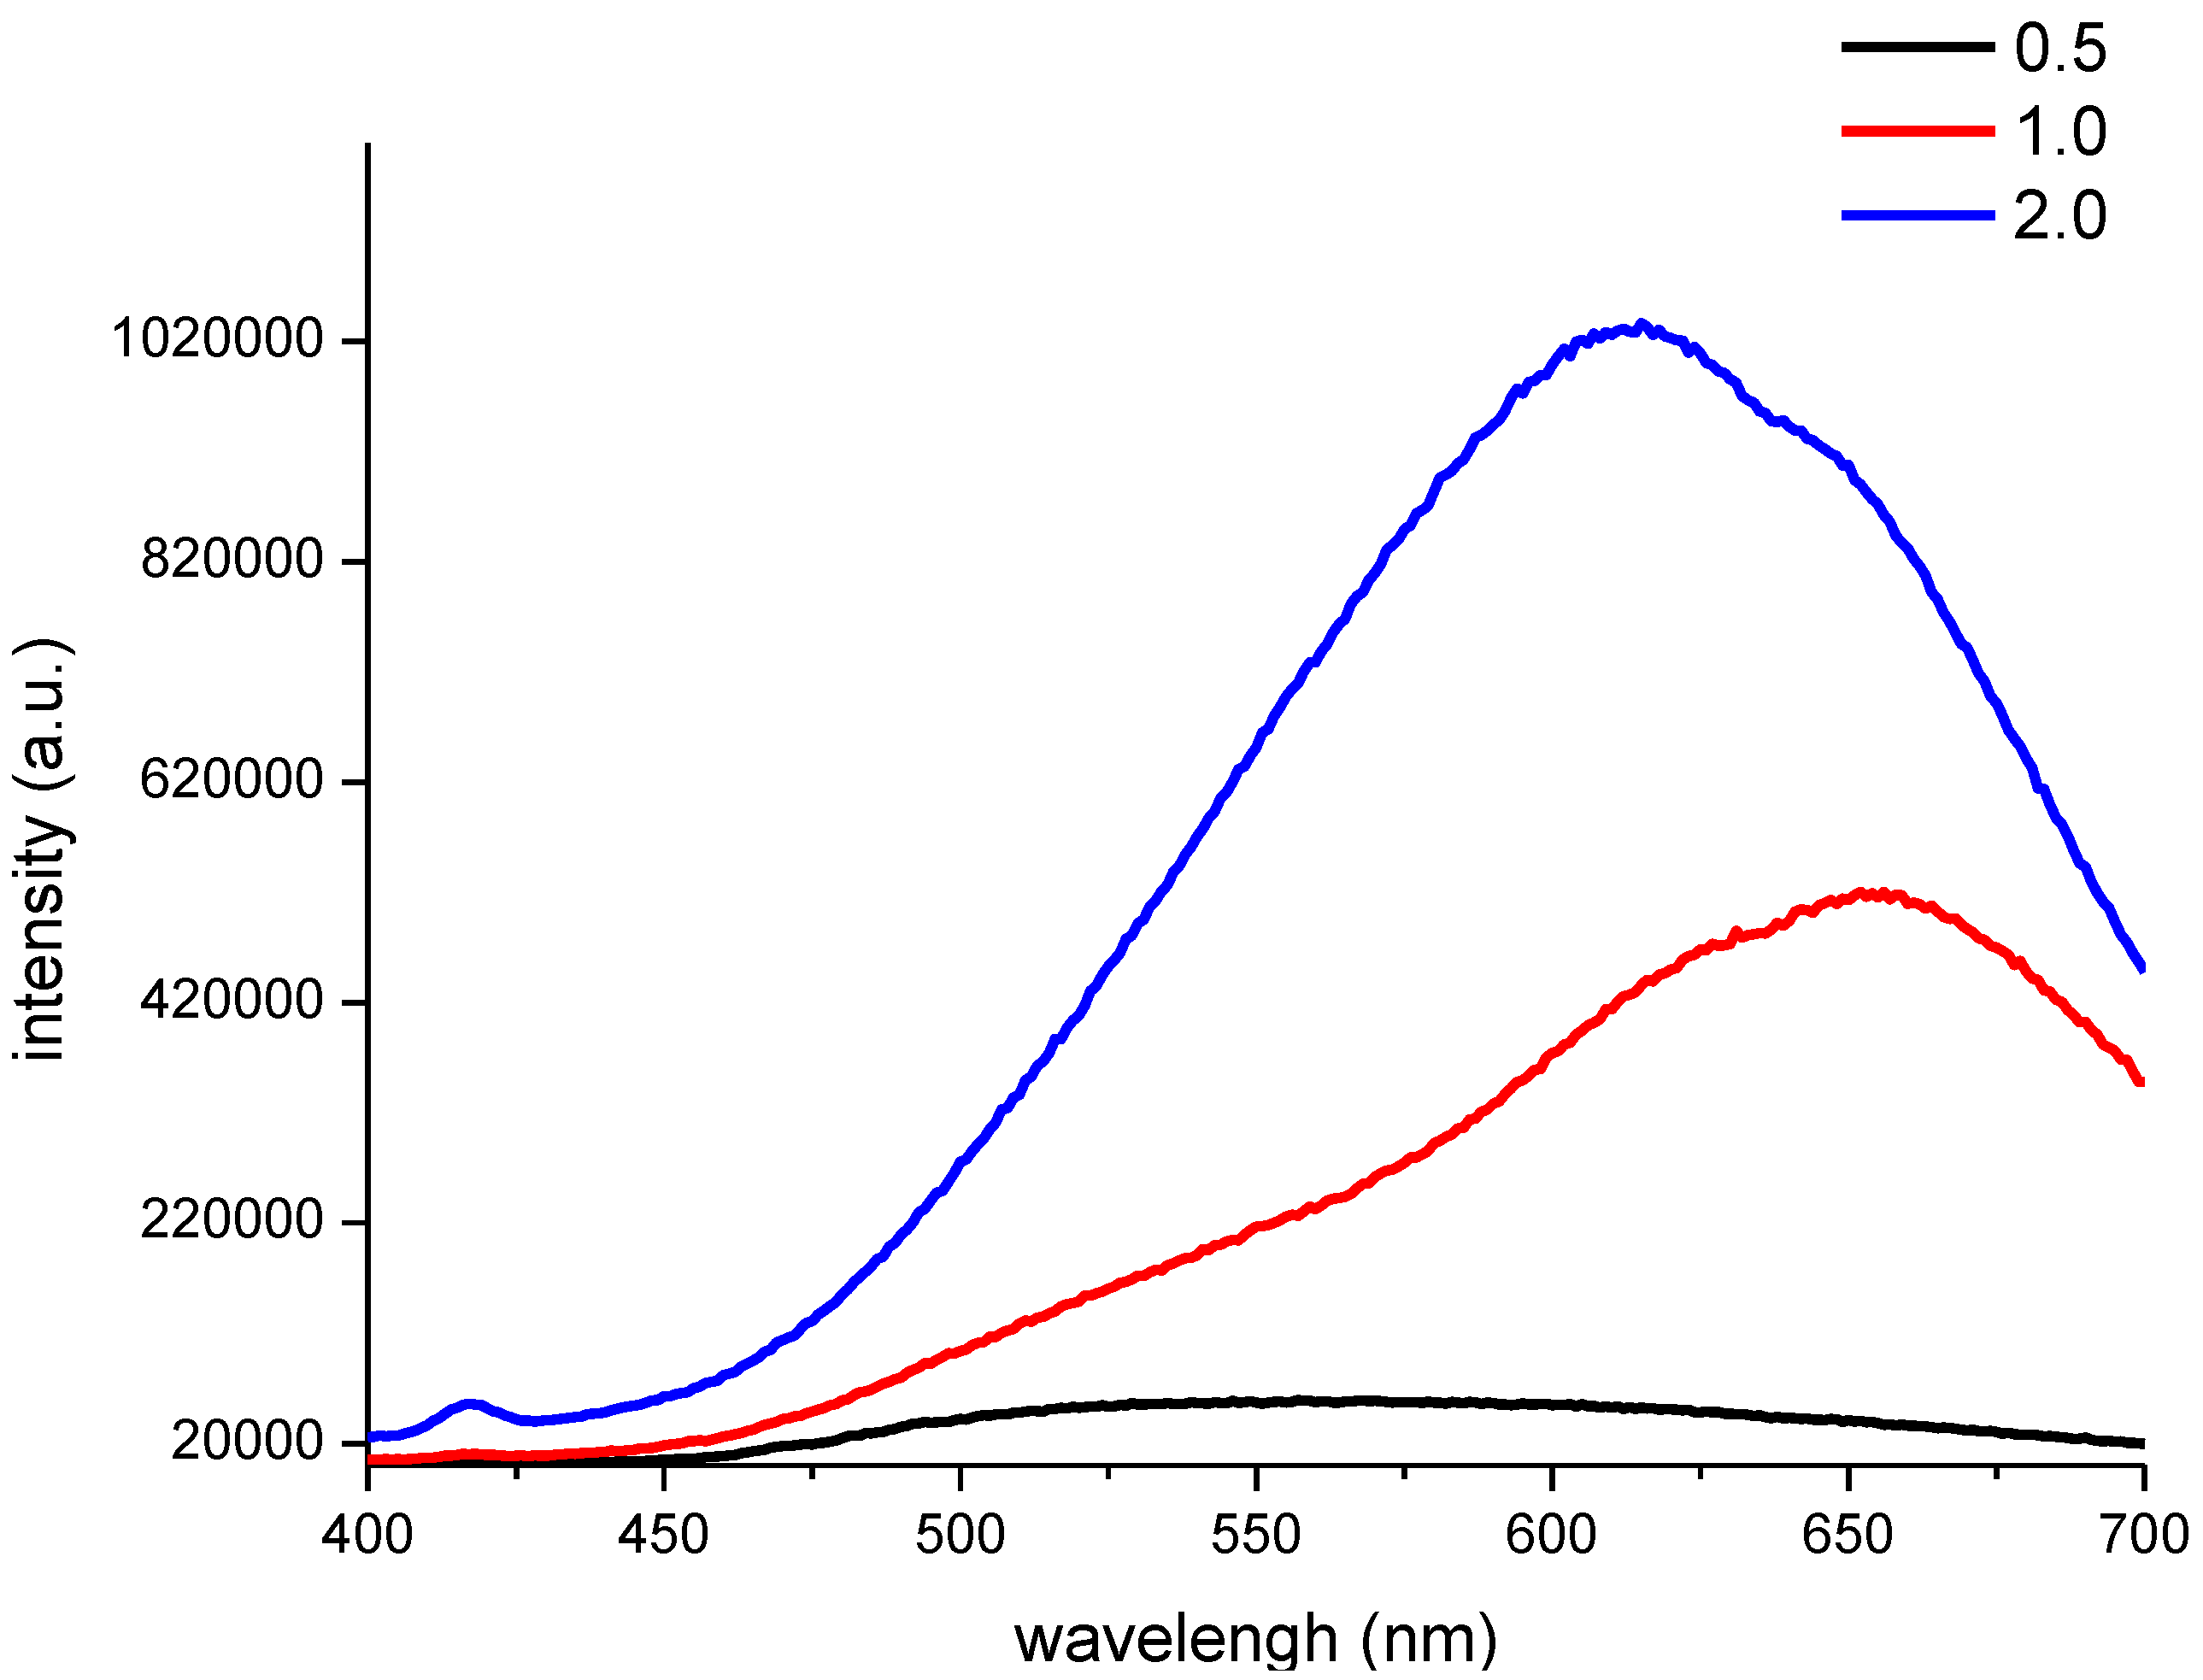
Furthermore, the PL spectra of the CNF/CdS nanocomposites with different –COOH/Cd
2+ ratios were investigated. As shown in
Figure 3, at an excitation wavelength of 365 nm, a strong emission peak with an intensity of 420,000 a.u. was observed at 655 nm for the CNF/CdS nanocomposite material when the –COOH/Cd
2+ ratio was 1.0. The emission peak blueshifted to 613 nm when the –COOH/Cd
2+ ratio was 2.0. However, the fluorescence intensity was at a maximum (1,020,000 a.u) at this time. When the –COOH/Cd
2+ ratio was 0.5, the CNF/CdS nanocomposite had a very wide emission bandwidth at 500–625 nm, and the intensity was only 20,000 a.u. By comparing the data in
Figure 2, it could be found that the CdS particle size distribution range was wide, the size and number of composited CdS particles was small when the –COOH/Cd
2+ ratio was 0.5. As a result, the resulting CNF/CdS nanocomposite exhibited a wide fluorescence emission band with low intensity. When the –COOH/Cd
2+ ratio increased, the size distribution uniformity of the CdS particles was gradually improved. Meanwhile, the number of composited CdS nanoparticles increased. Therefore, the fluorescence emission band of the CNF/CdS nanocomposite was gradually narrowed and the intensity was enhanced significantly. In addition, it has been reported [
18] that a redshift phenomenon occurs with increasing CdS particle size, as a result of the quantum size effect. When the –COOH/Cd
2+ ratio was decreased from 2.0 to 1.0, the average size of the CdS nanoparticles composited onto the CNFs increased from 4.01 nm to 5.34 nm, so that the PL spectra of the material showed the redshift phenomenon. Therefore, in this study, the PL spectra of the CNF/CdS nanocomposite were consistent with the size distribution results of CdS nanoparticles.
2.2. Effect of Na2S Feeding Time
In the condition of that the CNFs carboxyl contents was 1.63 mmol/g, –COOH/Cd
2+ ratio was controlled at 2.0 and ultrasonic maturing time was fixed at 60 min, the effect of Na
2S feeding time on the PL spectrum of the CNF/CdS nanocomposite material was investigated. The results are shown in
Figure 4.
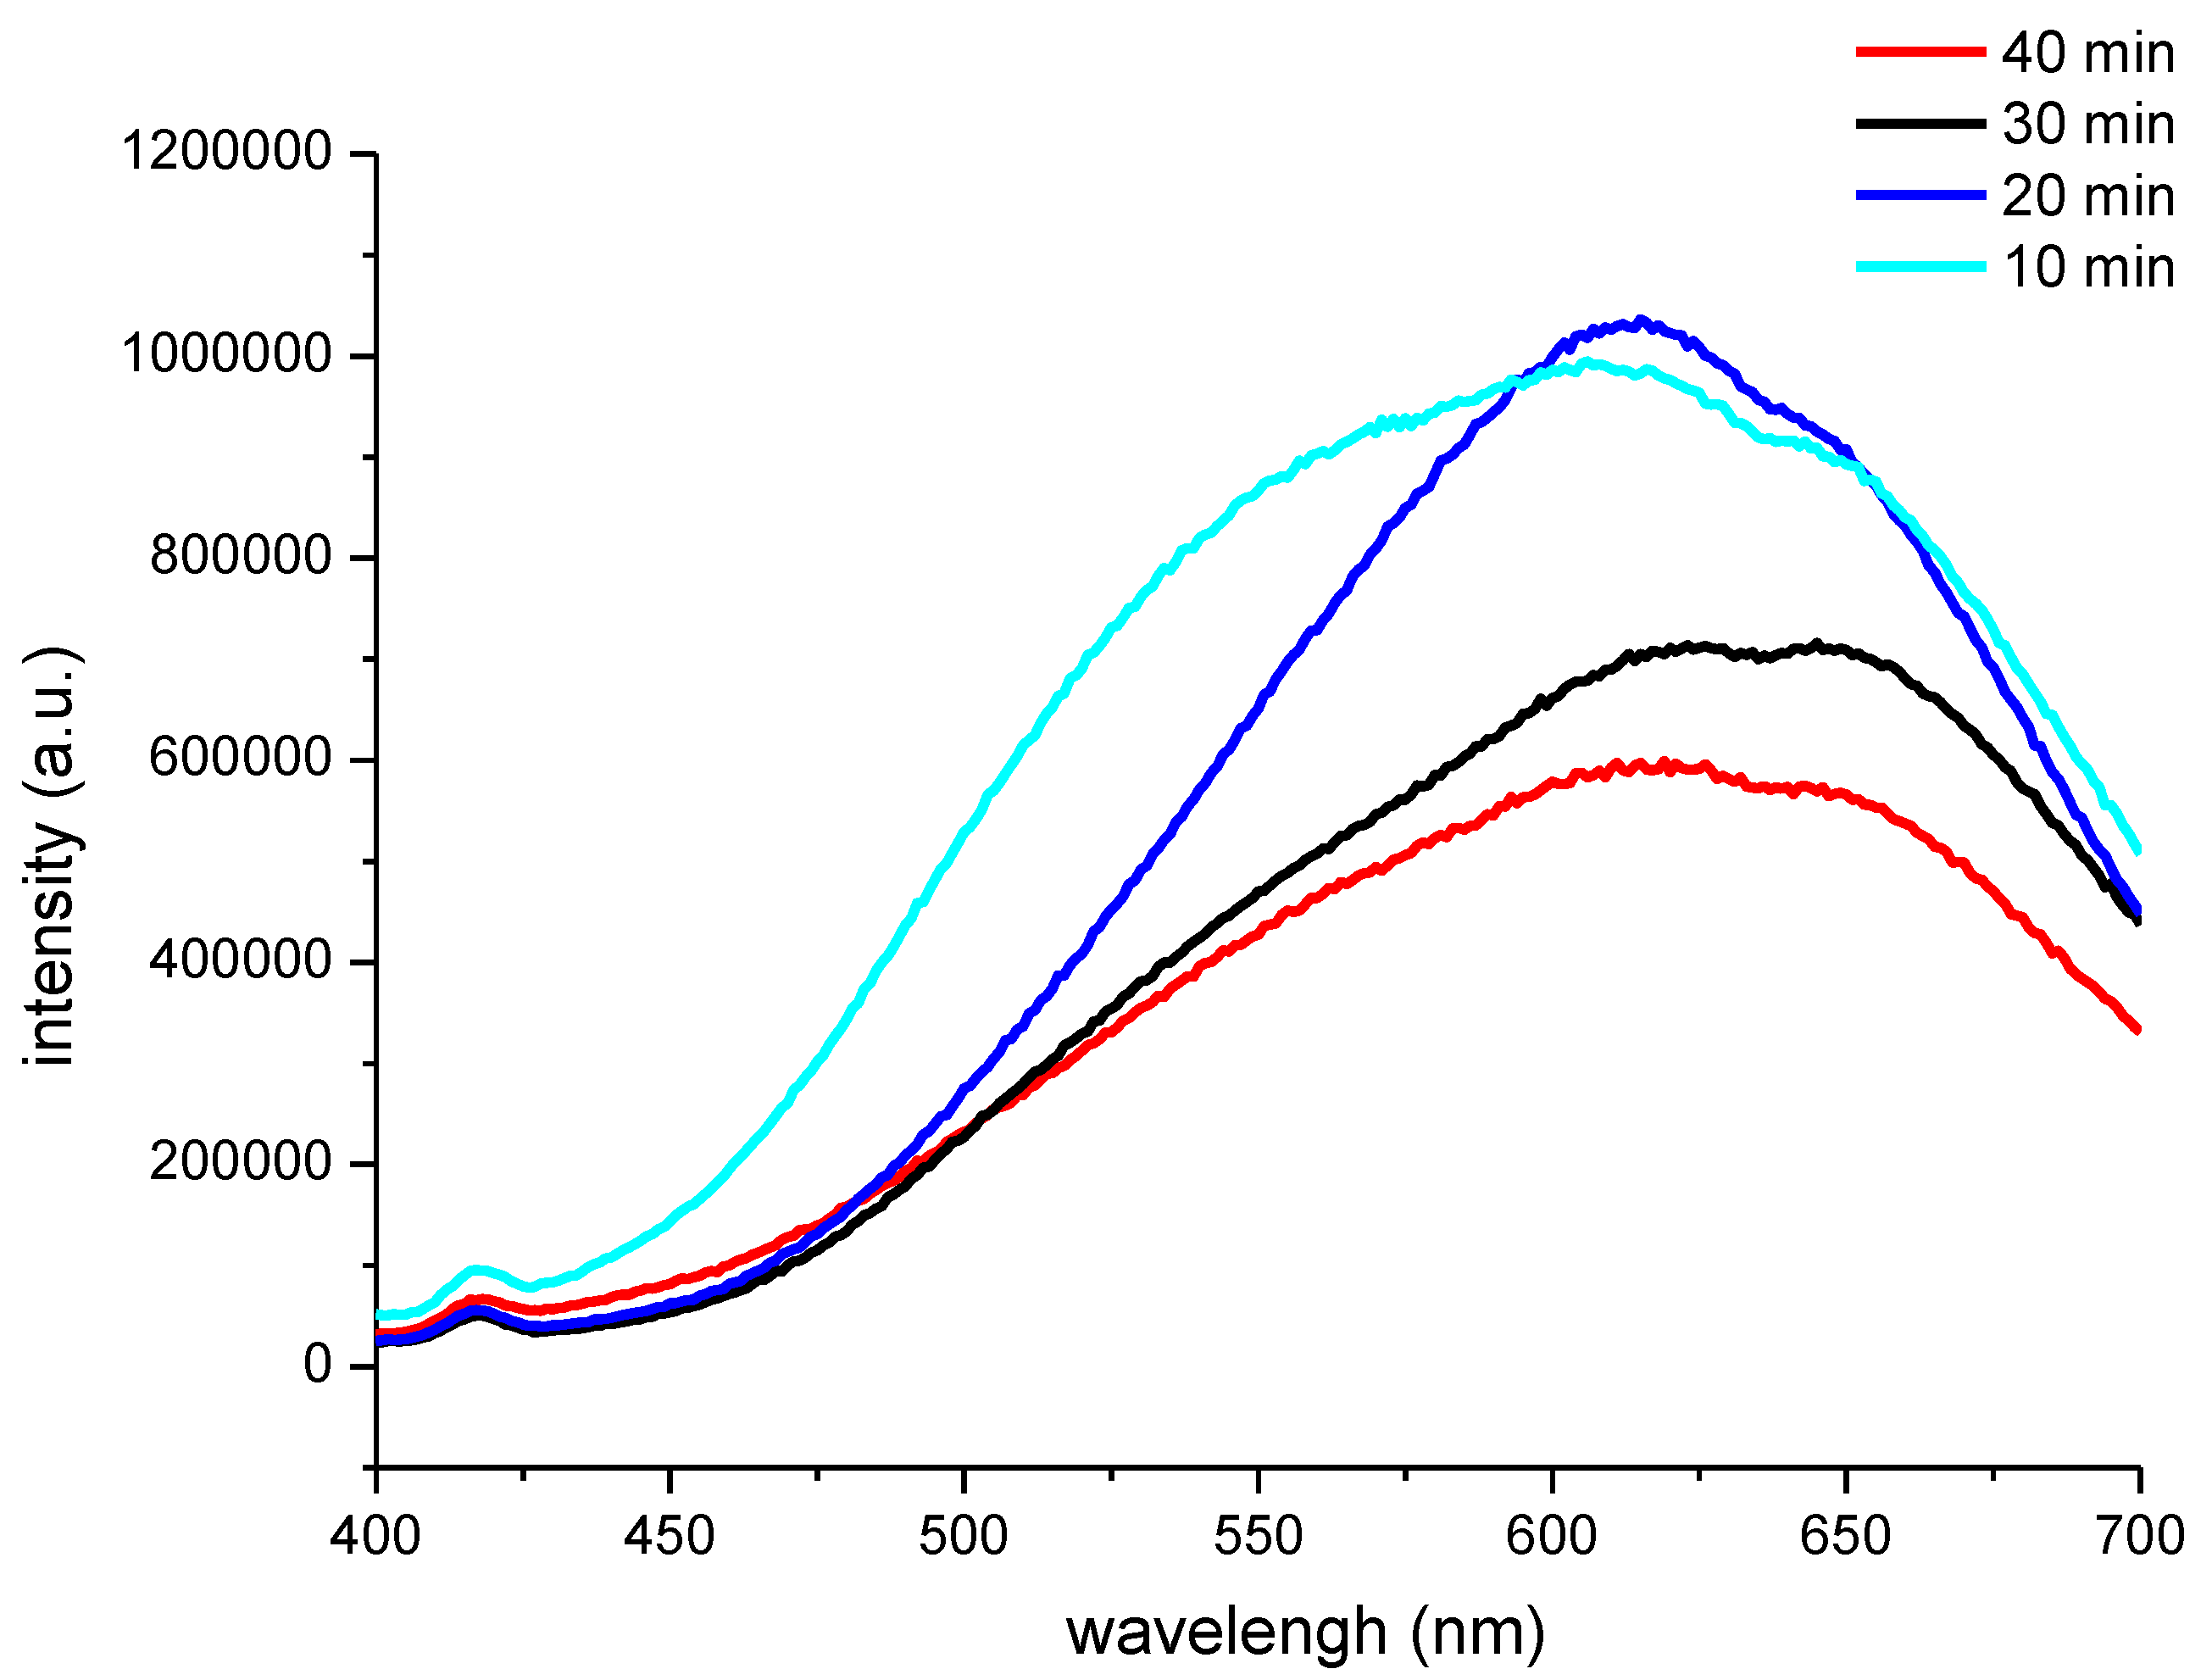
It could be seen from
Figure 4 that the PL peak of the CNF/CdS nanocomposite was 605 nm (excitation wavelength, 365 nm) when the feeding time of Na
2S solution was 10 min. Moreover, the emission band appeared in the range of 500–650 nm with a serious broadening phenomenon. When the feeding time of Na
2S solution was prolonged to 20 min and 30 min, the PL peaks showed redshifts at 613 nm and 640 nm, respectively. If the feeding time of Na
2S solution was further prolonged to 40 min, the PL peak at 625 nm showed a blue shift. It was generally accepted that the high energy luminescence band (300–500 nm) of CdS was due to the band gap, while the low energy luminescence band (500–700 nm) was related to the surface defects. The wavelengths of the PL peaks of the CNF/CdS nanocomposite in this study were all higher than 600 nm, indicating that they were mainly due to the surface defects emission.
In order to reveal the reasons why the CNF/CdS nanocomposites prepared with different Na
2S feeding time shows different luminescence, TEM analysis and Nano Measurer software was used to statistically calculate the CdS particle sizes.
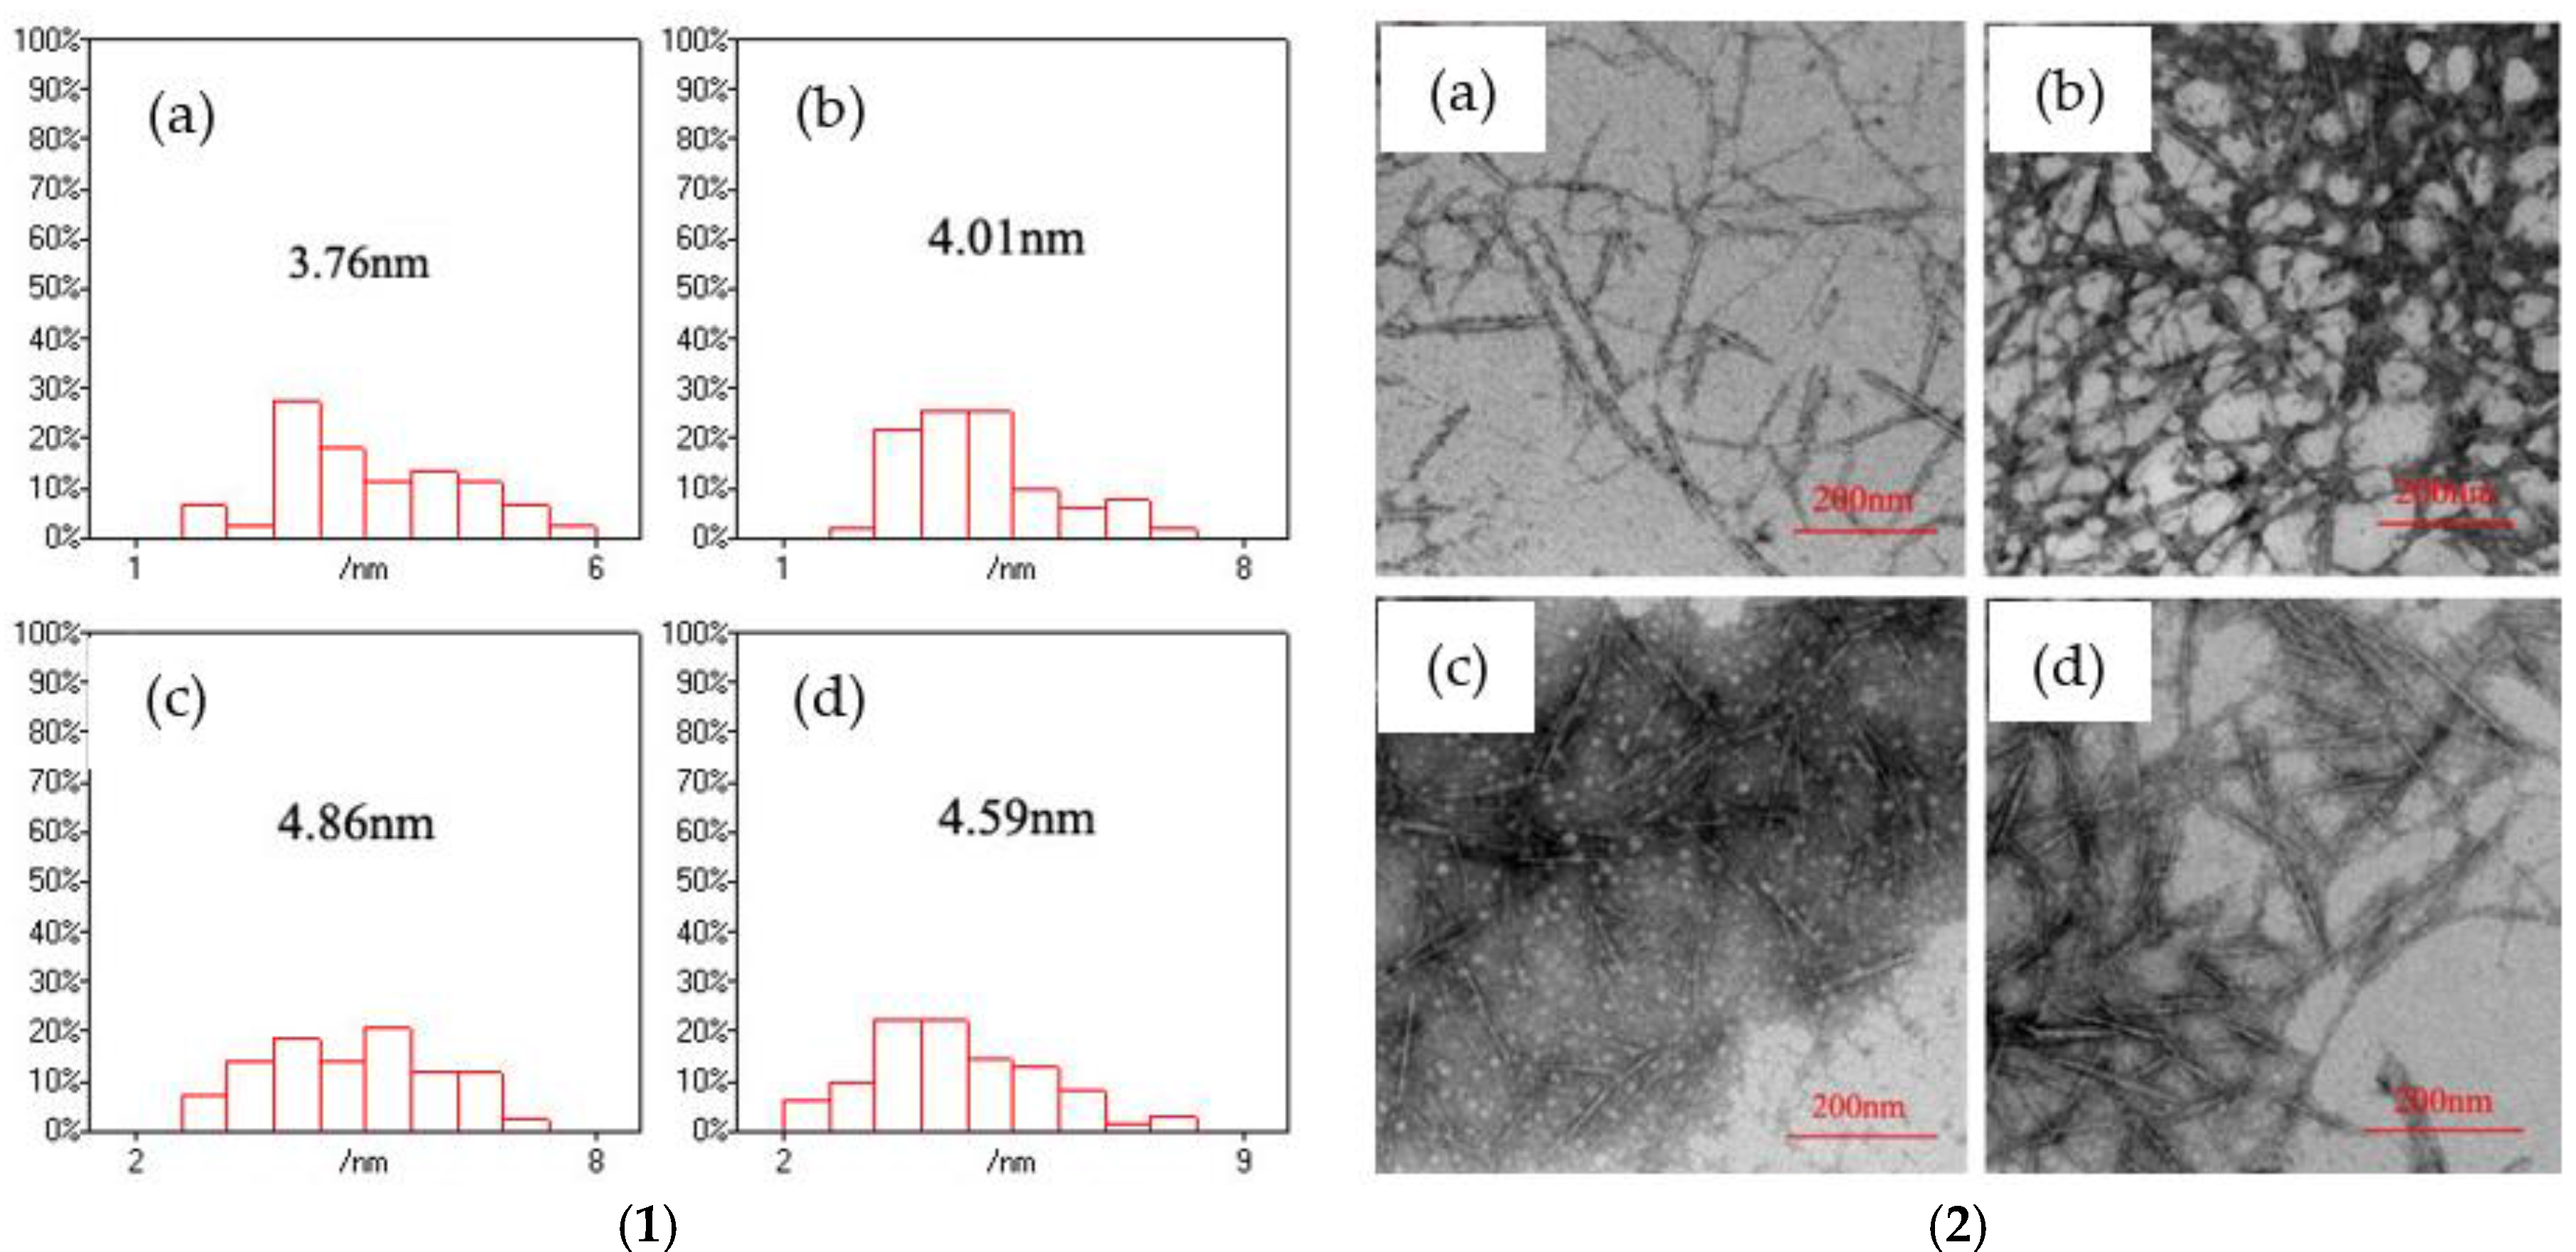
Figure 5 presents the size distribution of CdS nanoparticles, which was obtained using the Nano Measurer software based on a TEM image of the CNF/CdS nanocomposite. It indicated that the CdS particle sizes in the CNF/CdS nanocomposite were 3.76 nm and 4.01 nm when the feeding time of Na
2S was 10 min and 20 min, respectively. The average size of the CdS nanoparticles increased to 4.86 nm when the feeding time of Na
2S was 30 min. With the further prolonging of the Na
2S feeding time to 40 min, the CdS particle size decreased to 4.59 nm. This could be explained by the fact that when the feeding time of Na
2S was less than 20 min (relatively fast dropping speed), the number of generated CdS crystal nuclei was large. However, the crystalline grains were not fully grown within a short time, so the particle size was small. When the feeding time was prolonged to 30 min, the formation reaction of CdS nanoparticles was basically complete, and the average size of the obtained CdS nanoparticles was at a maximum. If the feeding time of Na
2S was further increased (relatively slow dropping speed), there was not enough S
2− during the formation reaction of CdS. As a result, the average size of the CdS nanoparticles decreased. The studies of Martinez-Castanon et al. [
19] showed the S
2−:Cd
2+ molar ratios affected the growth and size of particles. It was observed that the particle size increased with the S
2− concentration in precursors during the reaction. The different feeding time of Na
2S made the different S
2−:Cd
2+ molar ratios in unit time.
The work of Pattabi et al. [
20] indicated that the absorption spectrum of CdS nanoparticles showed a blueshift when particle size decreased. As the particle size decreased, the blueshift increased. This was associated with the quantum confinement effect. According to [
21], the band gap of a CdS quantum dot is in accordance with the Brus equation (Equation (1)) of the absorption band edge movement:
where
, where
E1 is the band gap energy of the quantum dot,
R is the radius of the quantum dot,
me and
mh are the effective mass of an excited electron and excited hole, respectively,
Eg is the band gap energy of the bulk semiconductor,
ERy is a parameter related to the exciton binding energy of the bulk semiconductor, and h is Planck’s constant.
According to the Brus equation, when the radius of quantum dot (
R) is small enough, the band gap will increase with decreasing nanoparticle size, resulting in the blue shift of absorption peaks. It could be seen from
Figure 4 and
Figure 5 that the average size of the CdS nanoparticles was 4.86 nm when the feeding time of Na
2S was 30 min, and the PL peak of the CNF/CdS nanocomposite was 640 nm. When the feeding time of Na
2S was 40 min, 20 min, and 10 min, the average sizes of the CdS nanoparticles decreased to 4.59 nm, 4.01 nm and 3.76 nm, respectively. Accordingly, the PL peaks of the CNF/CdS nanocomposite showed blue shifts at 625 nm, 613 nm and 605 nm, respectively. Therefore, the PL peaks of the CNF/CdS nanocomposite were in the range of 640–605 nm, with only a small difference occurring when the feeding time of Na
2S was changed. These results indicated that the size of the CdS nanoparticles could be changed by varying the feeding time of Na
2S in order to adjust the PL spectrum of the CNF/CdS nanocomposite. However, the adjustable degree was not large.
2.3. Effect of Ultrasonic Maturing Time
For these experiments, the –COOH/Cd
2+ ratio was 1.0 and the feeding time of Na
2S was 20 min. The effect of ultrasonic maturing time on the PL spectrum of the CNF/CdS nanocomposite was investigated. The maturing time in the ultrasonic setup was 40 min, 60 min, 80 min, and 100 min, respectively. The results are shown in
Figure 6 and
Figure 7.
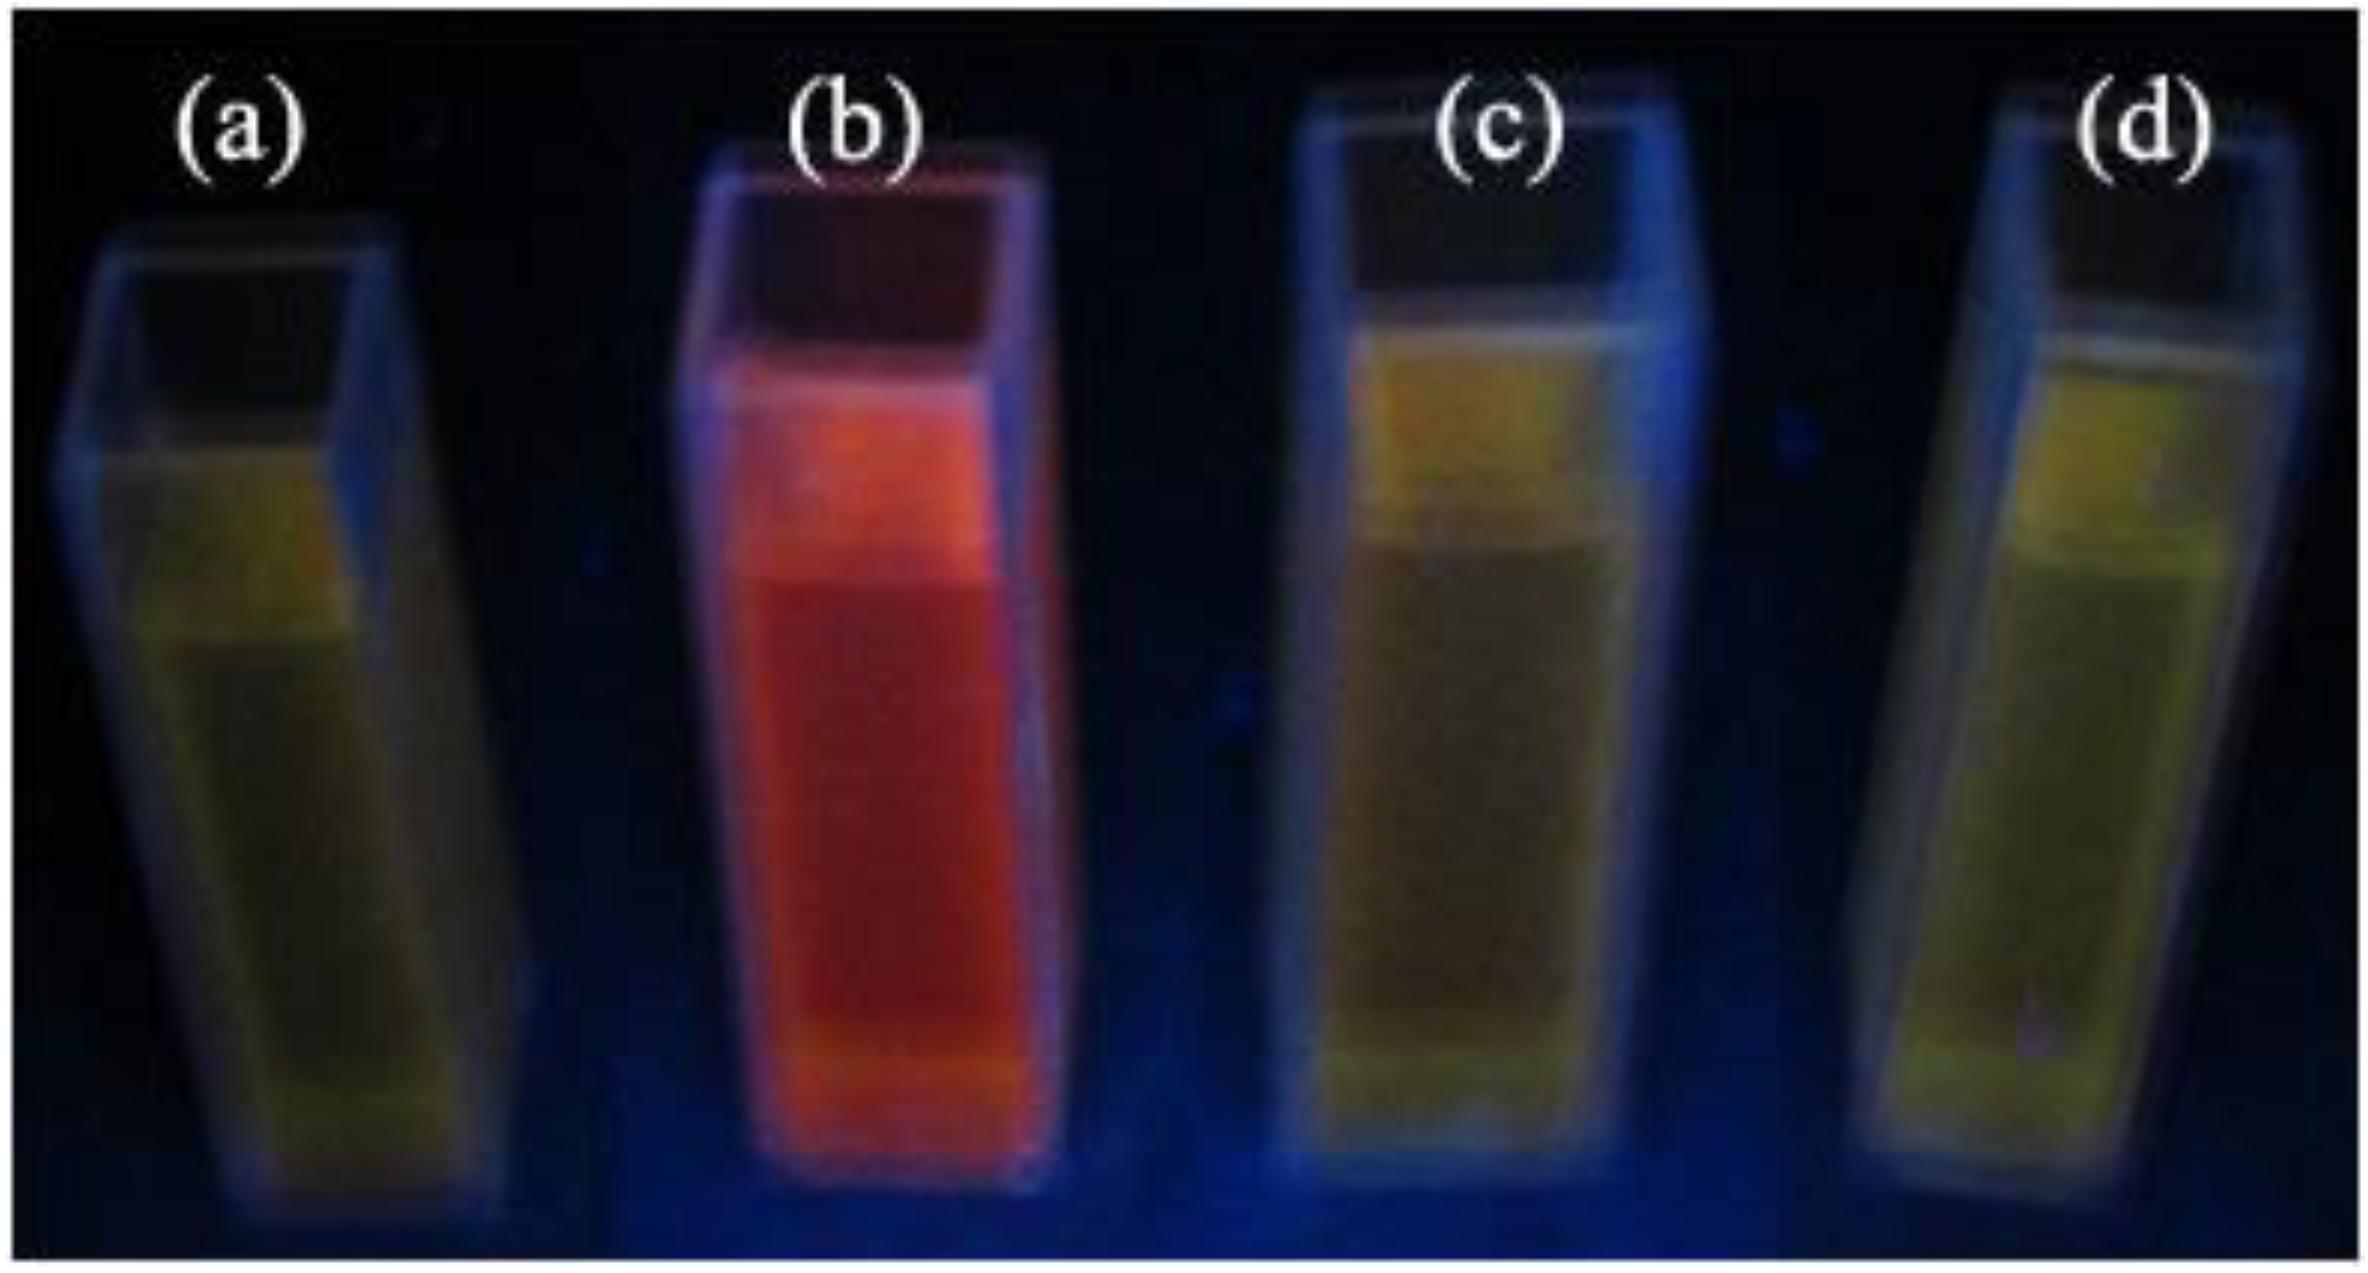
Figure 6 illustrates the fluorescence image of the CNF/CdS nanocomposite obtained under different ultrasonic maturing time conditions (λ = 365 nm UV light). It could be seen that the CNF/CdS nanocomposite showed a red color under the excitation of the UV light only when the maturing time was 60 min, while the composite showed a yellow-green color when the ultrasonic maturing time was 40 min, 80 min, or 100 min.
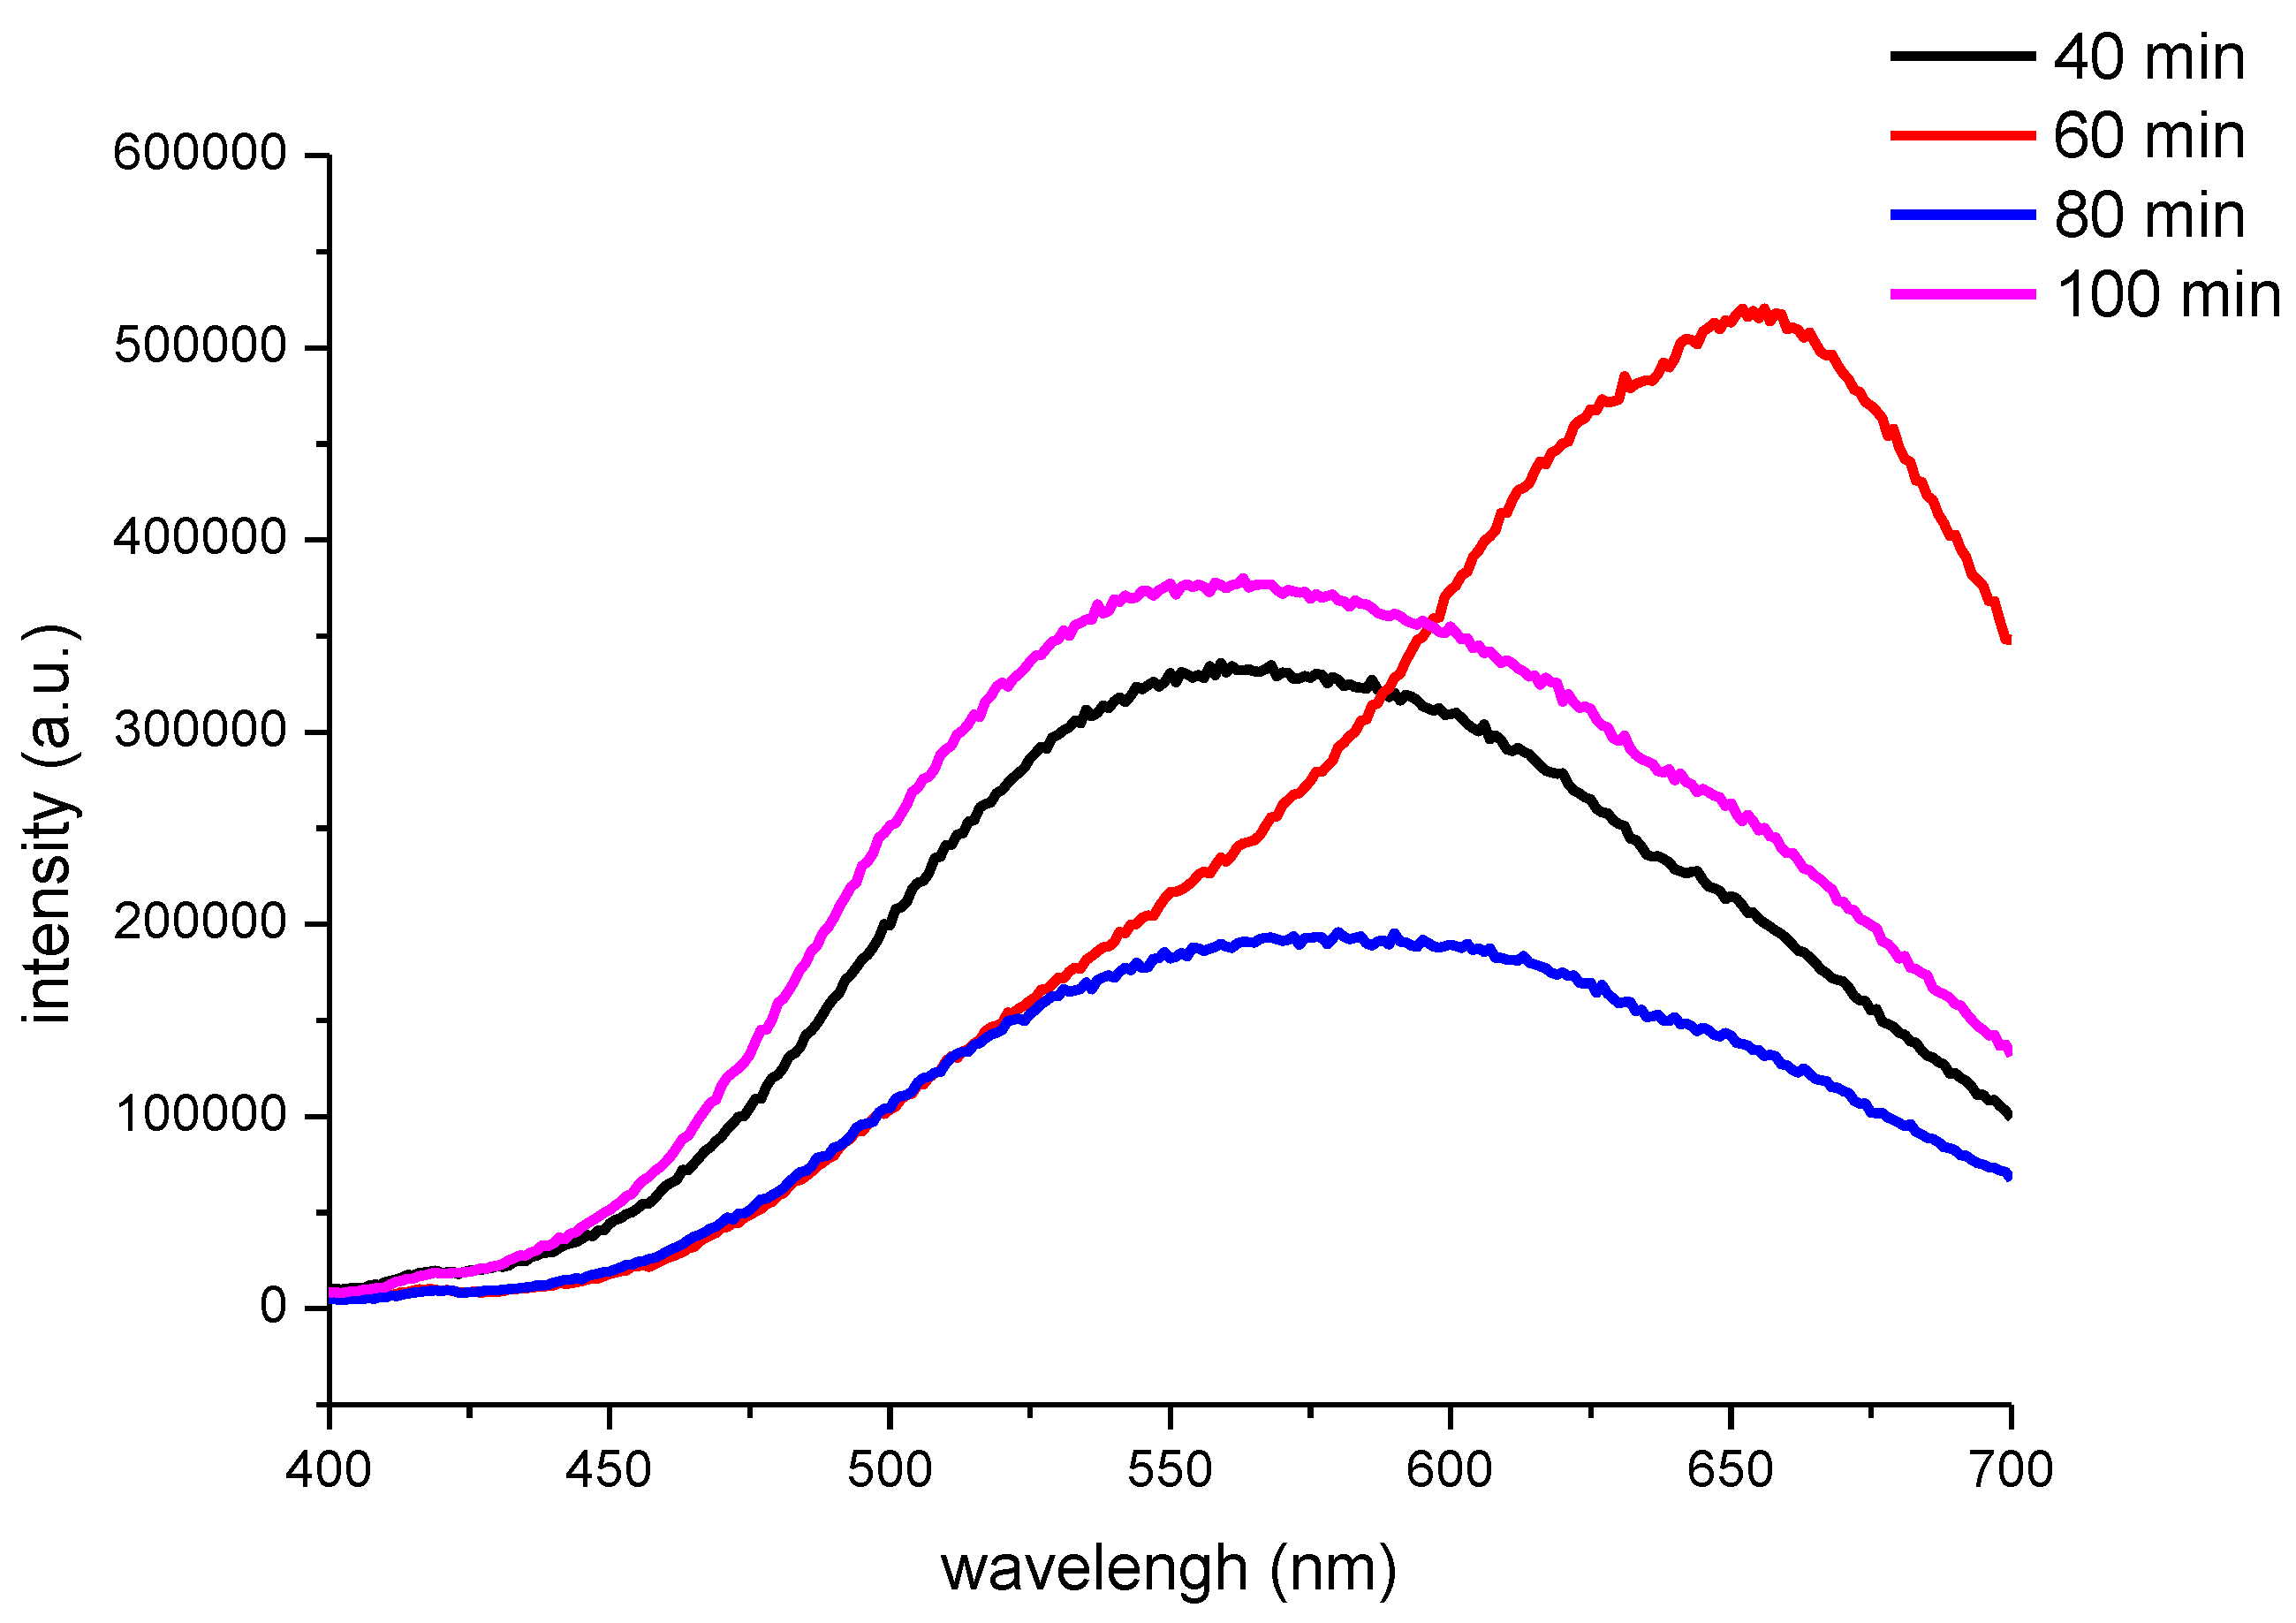
Figure 7 shows the PL spectra of the CNF/CdS nanocomposite with different maturing times. The excitation wavelength used was 365 nm. It could be seen that the PL peak of the CNF/CdS nanocomposite was at 560 nm when the maturing time was 40 min. When the maturing time was 60 min, a strong emission peak at 655 nm could be observed in the PL spectrum. When the maturing time was further prolonged to 80 min and 100 min, the emission peaks showed blueshifts at 580 nm and 546 nm, respectively. The wavelength at 655 nm was red light, which is consistent with the result of the fluorescence image with the UV light (
Figure 6). When the maturing time was 40 min, 80 min, or 100 min, however, the emission peak in the PL spectrum showed an obvious blueshift phenomenon. The emission wavelength was in the range of 546–580 nm, which belonged to yellow-green light. This was also consistent with the results of the fluorescence imaging.
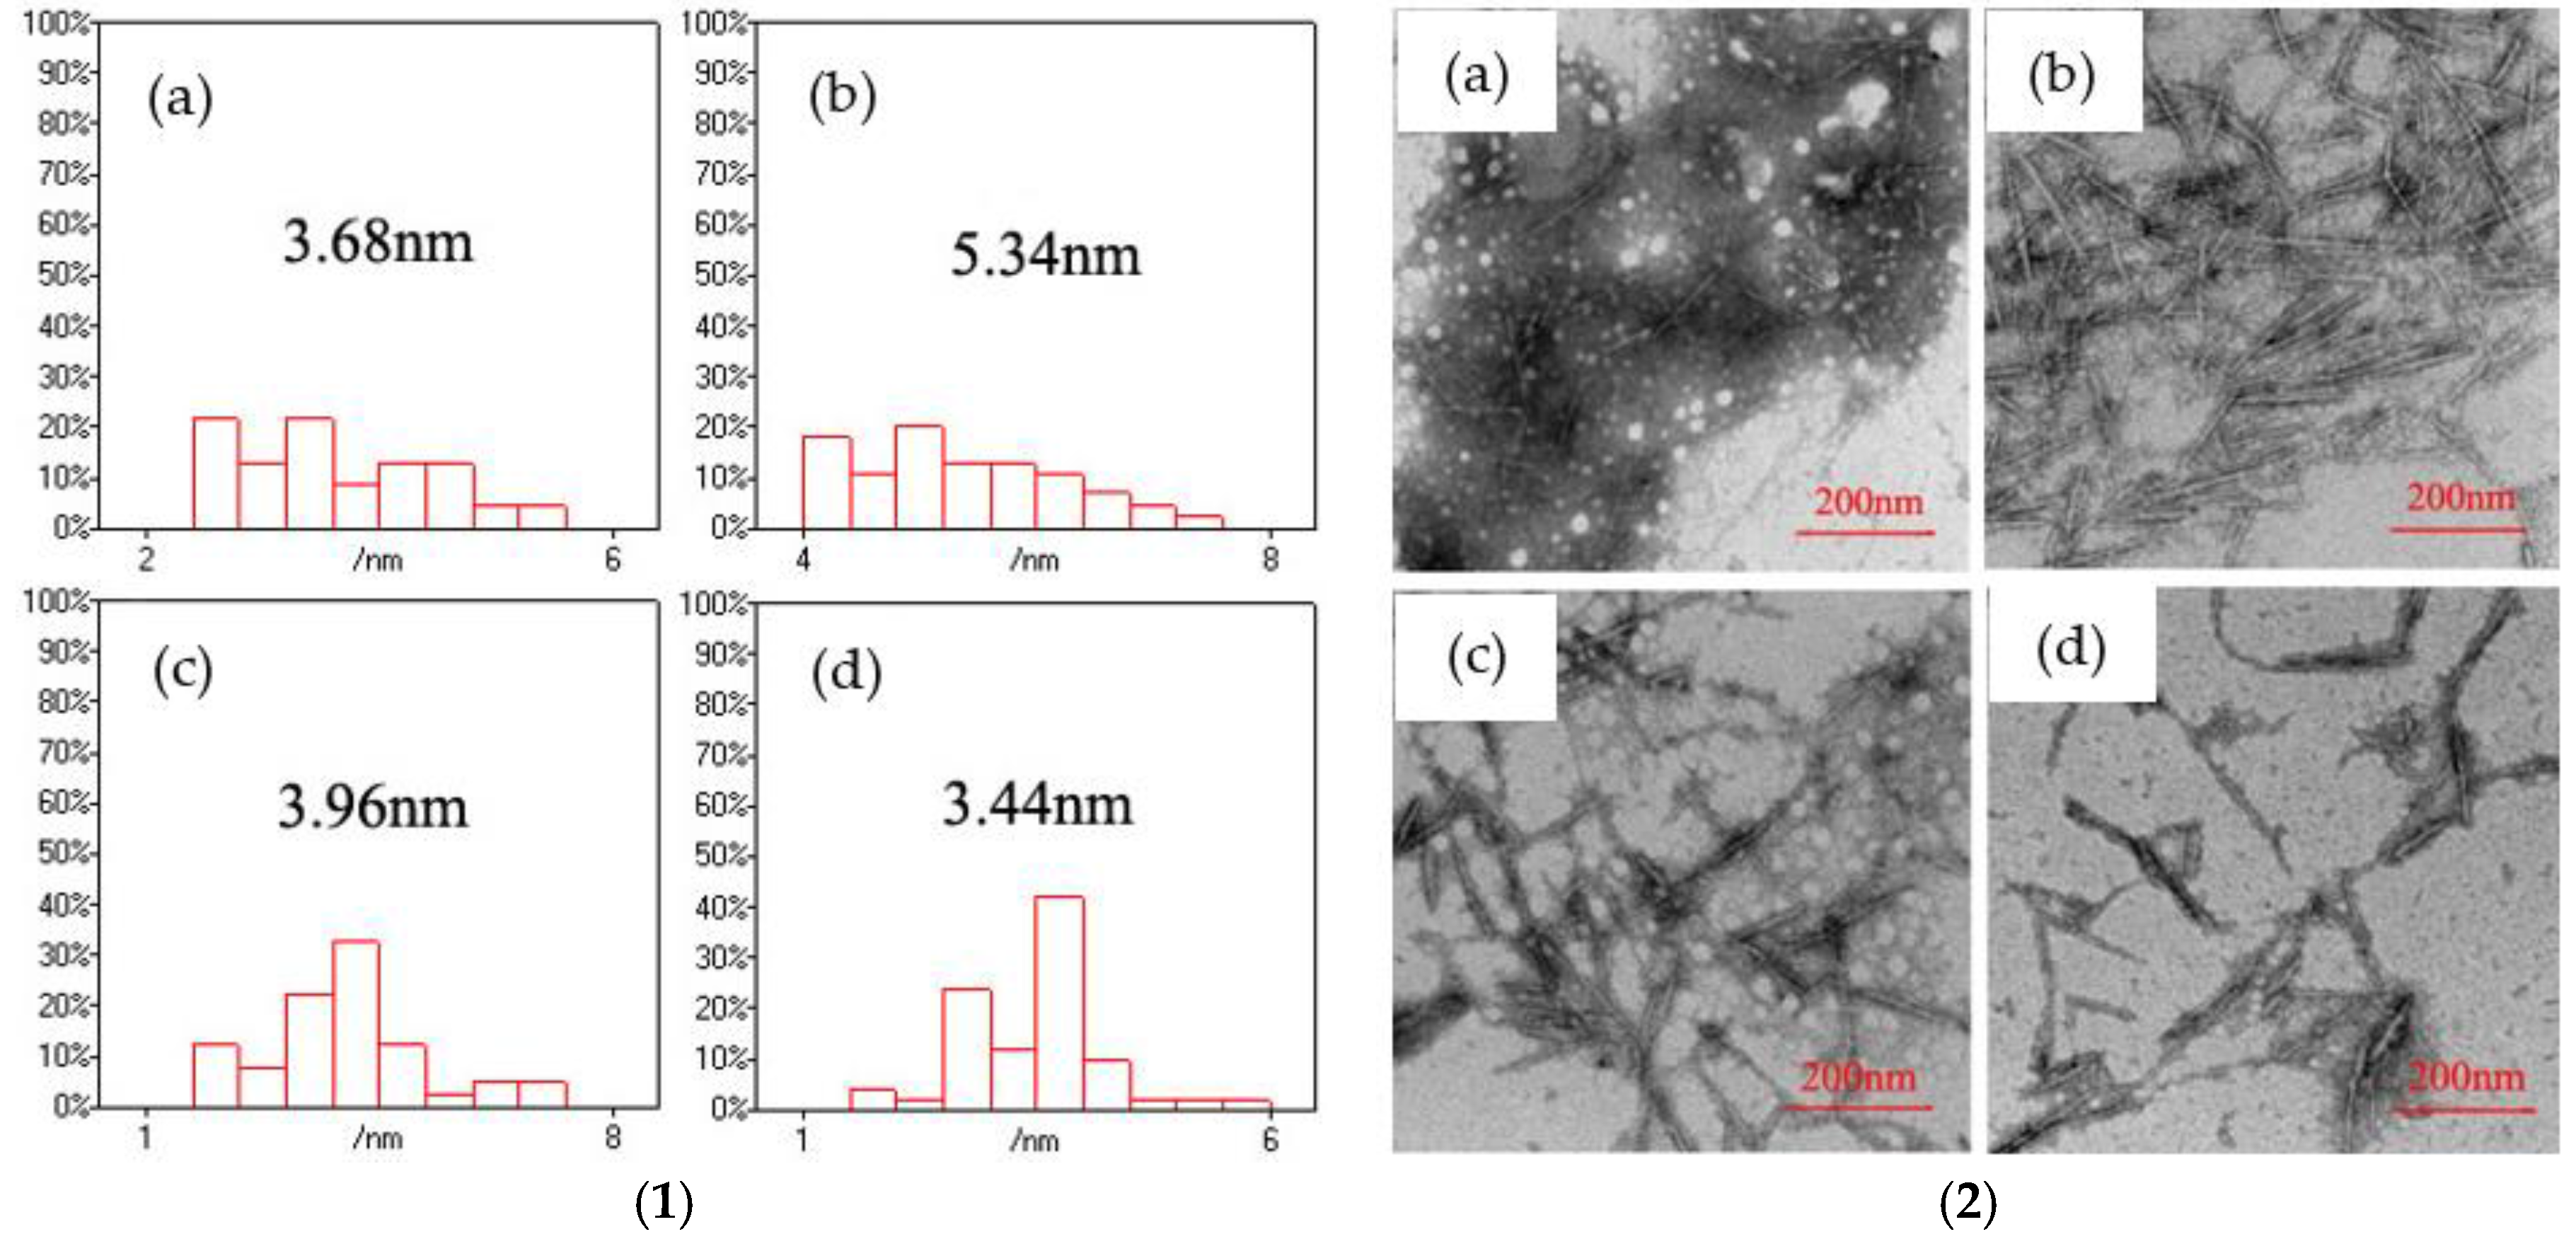
The morphology of CNF/CdS nanocomposite was observed by TEM. The size of the CdS particles on the CNFs was calculated using the Nano Measurer software. The results are shown in
Figure 8. It could be seen that the average sizes of the CdS nanoparticles in the CNF/CdS nanocomposite were 3.68 nm, 5.34 nm, 3.96 nm, and 3.44 nm when the maturing times were 40 min, 60 min, 80 min, and 100 min, respectively. Therefore, the average size of the CdS nanoparticles was at a maximum when the maturing time in the ultrasonic setup was 60 min. This was because the cavitation of the ultrasonic treatment had two effects on the CdS nanoparticles, i.e., induced crystallization and shearing. When the maturing time in the ultrasonic equipment was short (40 min), the growth of CdS grains was incomplete, so the size of the obtained CdS nanoparticles was relatively small. When the maturing time was 60 min, the CdS grains grew completely and the average particle size reached the maximum value. If the maturing time was further prolonged, the CdS nanoparticles were broken due to the continuous shearing effect of the ultrasonic treatment. As a result, the average particle size of CdS decreased. The studies of Dai et al. [
17] showed the particle size of CdS nanoparticles with 60 mM 3-mercaptopropionic acid (MPA) as a function of incubation time. It was observed that the growth of the CdS particles rapidly increased at the initial stage and gradually slowed down, indicating the MPA inhibition on CdS particle growth. In this study, the size of CdS particles was related to the maturing time in the ultrasonic setup. However, the CdS nanoparticles had smaller sizes due to shearing effect of the ultrasonic when the maturing time was too long. The results were consistent with the PL spectra. In other words, the CNF/CdS nanocomposite showed only red when the maturing time was 60 min. If the maturing time was 40 min or prolonged to 80 min and 100 min, the size of the resultant CdS nanoparticles decreased significantly, and the emission peak of the PL spectra showed an obvious blueshift phenomenon. Therefore, during the preparation of the CNF/CdS nanocomposite material, the size of the CdS nanoparticles could be adjusted by controlling the maturing time for the ultrasonic maturing. Accordingly, the PL performance could be adjusted and its variation was very significant.
2.4. Effect of CdS Particle Size on CNF/CdS Nanocomposite PL Performance
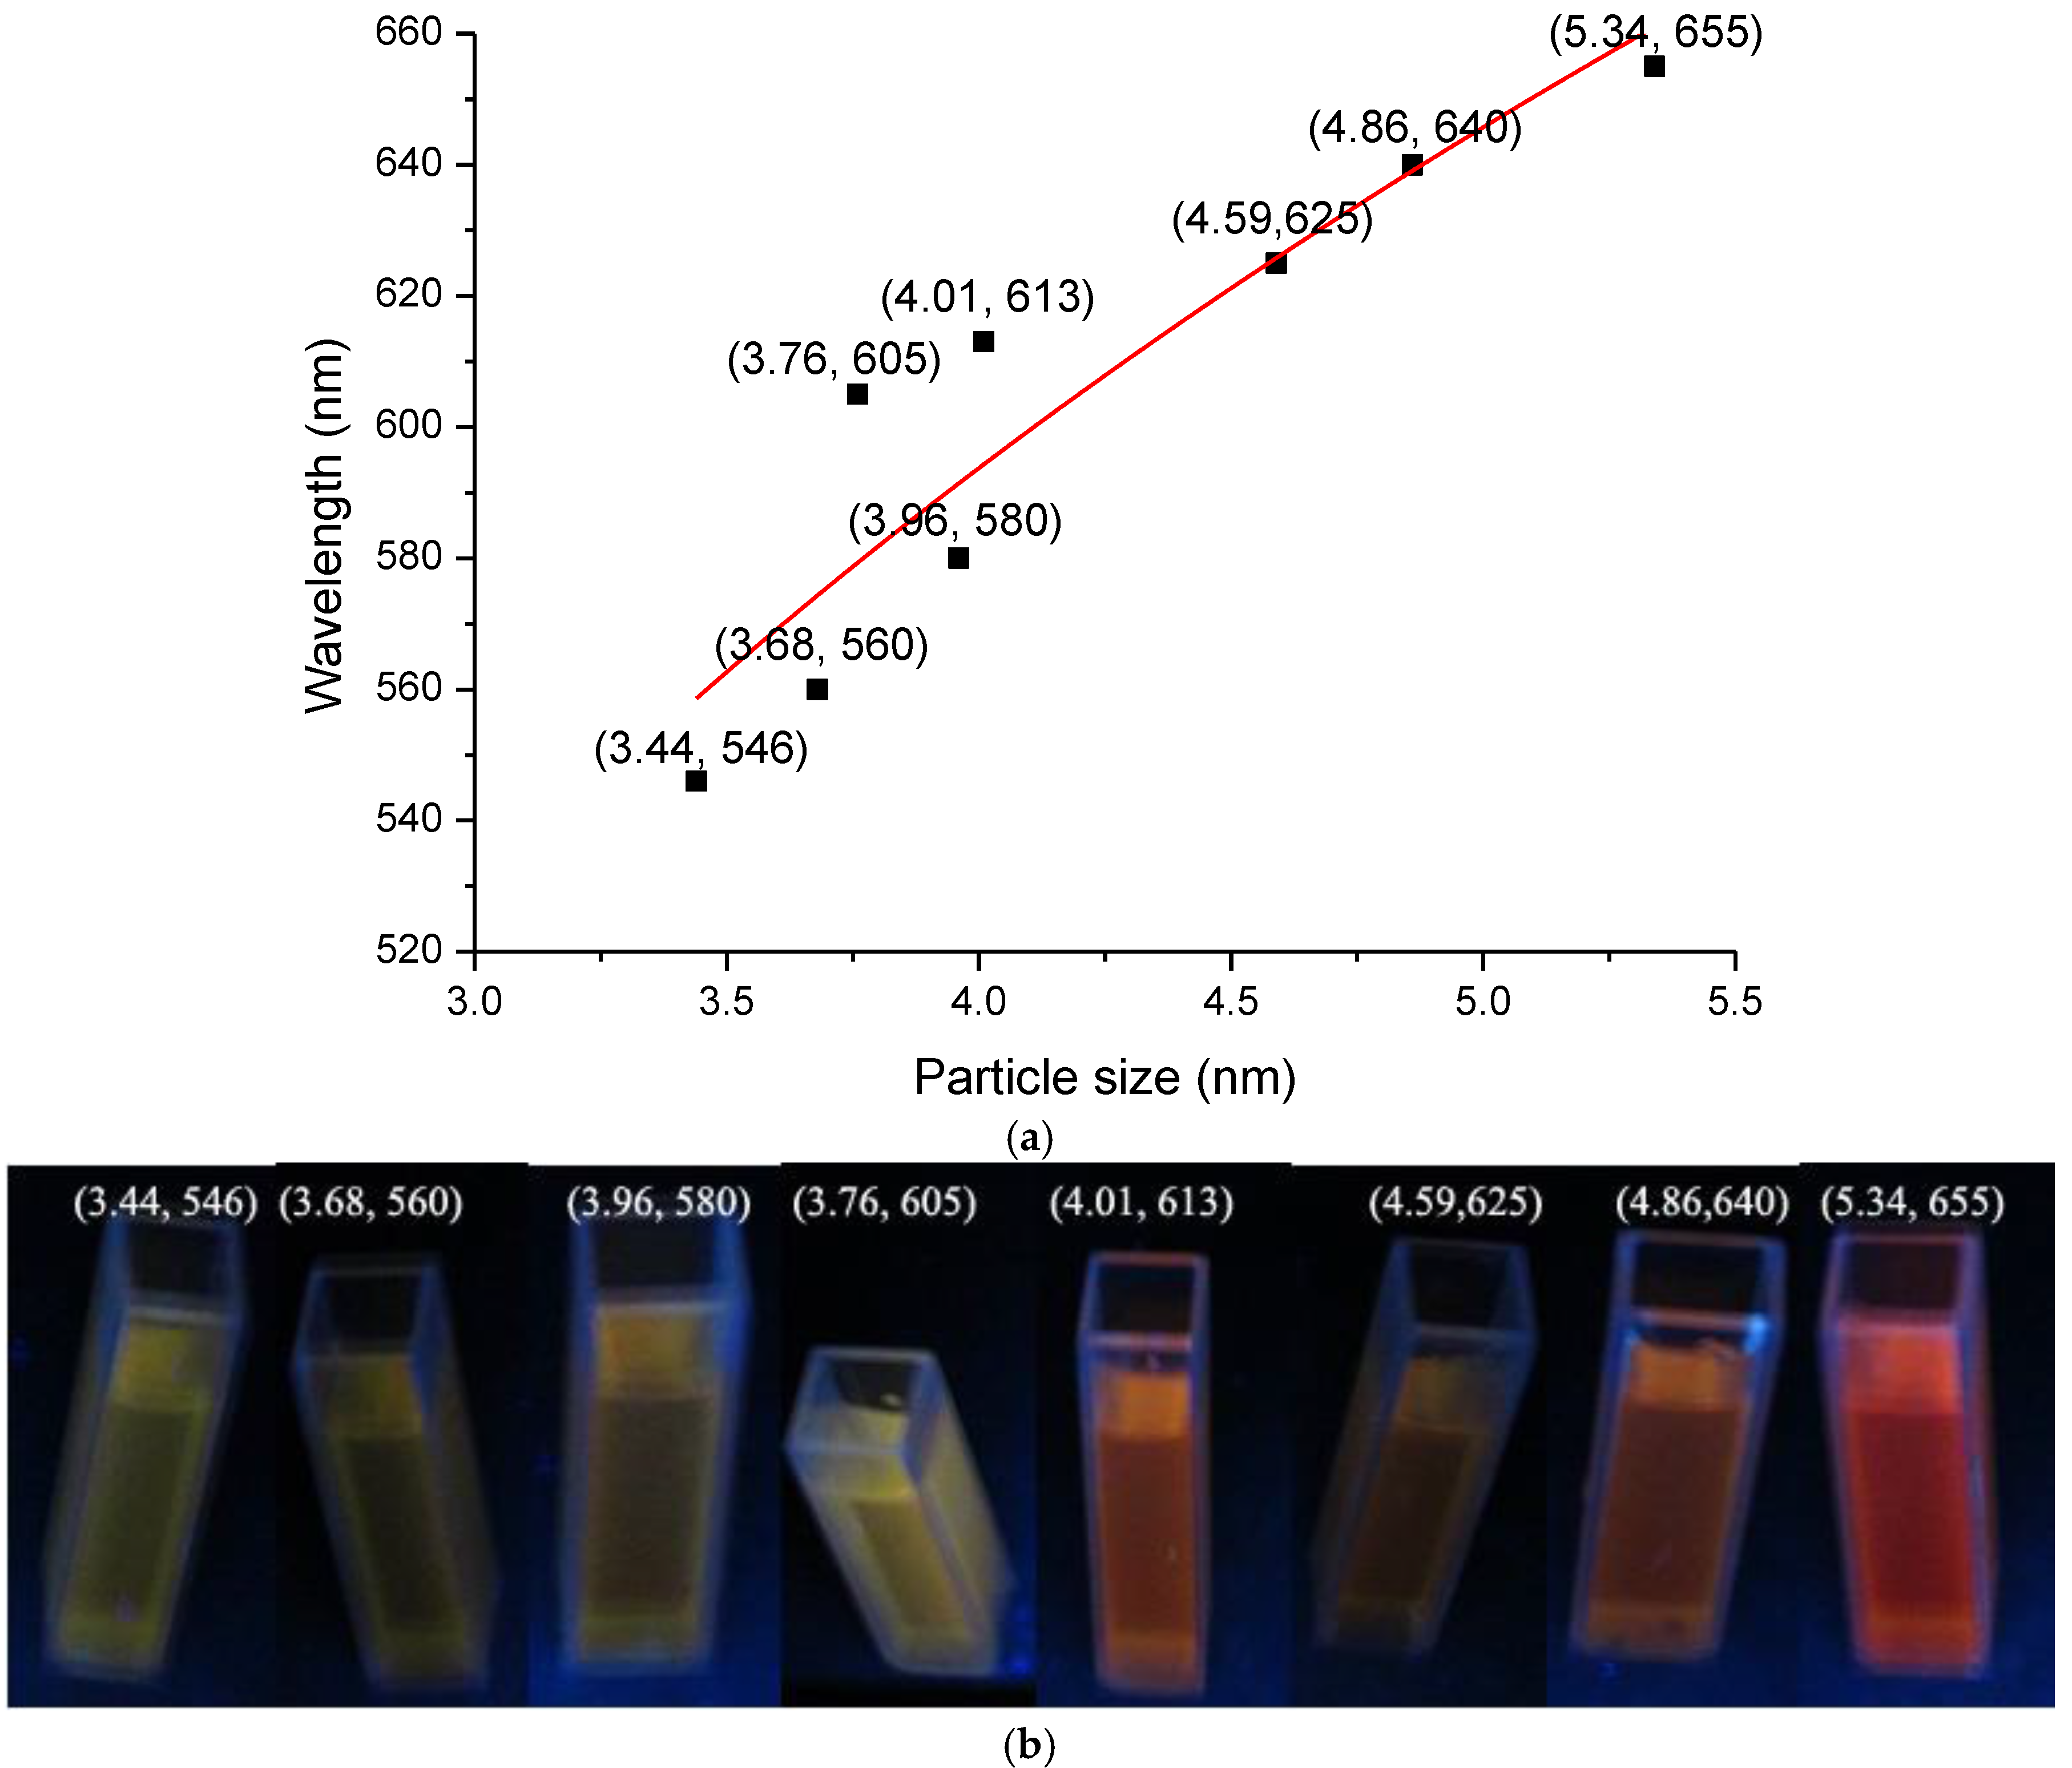
The effect of CdS quantum dot size on the PL performance was analyzed according to the size of the CdS particles (
S) and the fluorescence emission wavelength (λ) of the CNF/CdS nanocomposite material based on the above analysis data. The results are shown in
Figure 9. When the size of the CdS particles increased from 3.44 nm to 5.34 nm, the fluorescence emission wavelength of the CNF/CdS nanocomposite gradually redshifted from 546 nm to 655 nm, and their fluorescence color changed from green, to yellow, to red. In addition, the larger the CdS size was, the more significant the redshift was. This was in agreement with the quantum confinement effect [
22,
23,
24]. Based on the data in
Figure 9, the size of the CdS particles (
S) and the fluorescence emission wavelength (λ) of the composite material were fitted. The relation between λ and
S could be expressed as follows (Equation (2)). The correlation coefficient was 0.850.
The results indicated that the PL performance of the CNF/CdS nanocomposite was decided by the size of CdS quantum dot. The size adjustable CdS quantum dot could be prepared by controlling the –COOH/Cd2+ ratio, the feeding time of Na2S and the maturing time in ultrasonic. Therefore, a PL performance tunable CNF/CdS nanocomposite could be obtained.


