TiO2 Nanowire Networks Prepared by Titanium Corrosion and Their Application to Bendable Dye-Sensitized Solar Cells


Department of Chemistry, Chung-Ang University, 84 Heukseok-ro, Dongjak-gu, Seoul 06974, Korea
*
Author to whom correspondence should be addressed.
†
Equal contribution to this work.
Nanomaterials 2017, 7(10), 315; https://doi.org/10.3390/nano7100315
Submission received: 10 August 2017
/
Revised: 20 September 2017
/
Accepted: 25 September 2017
/
Published: 12 October 2017
(This article belongs to the Special Issue ZnO and TiO2 Based Nanostructures)
Abstract
:TiO2 nanowire networks were prepared, using the corrosion of Ti foils in alkaline (potassium hydroxide, KOH) solution at different temperatures, and then a further ion-exchange process. The prepared nanostructures were characterized by field emission scanning electron microscopy, Raman spectroscopy, and X-ray photoelectron spectroscopy. The wet corroded foils were utilized as the photoanodes of bendable dye-sensitized solar cells (DSSCs), which exhibited a power conversion efficiency of 1.11% under back illumination.
1. Introduction
The dye-sensitized solar cell (DSSC, or Grätzel cell) was first presented in 1991 [1], and has since been considered a low-cost alternative to conventional silicon solar cells, and a promising construction element for building-integrated photovoltaics (BIPV). This is due to its transparency and diverse colors [2]. Recently, cost-effective (Ti and stainless steel) metal foils have been proposed for the fabrication of bendable DSSCs for flat and curved building skins instead of plastic materials. This is primarily because of the lack of limitations with respect to high-temperature processing [3,4,5,6]. In particular, Ti substrates decreased the series resistance of DSSCs, and thus allowed for a better fill factor (FF) and power conversion efficiency, as compared with F-doped SnO2 (FTO)-conducting glasses [5,6]. The DSSC consists of a dye-sensitized porous photoanode, a redox electrolyte, and a platinized counter electrode. Photoanodes are generally prepared using TiO2 nanoparticles with a size of 5–20 nm. However, such mesoporous nanoparticle films are hampered by the limited electron transport caused by particle-to-particle hopping and charge recombination at interfaces [7,8]. With the aim of improving the DSSC performance, one-dimensional (1D) TiO2 nanostructures, such as nanotubes, nanorods, and nanowires, have been synthesized by various methods including anodization [9,10,11], electrospinning [12] and hydrothermal alkali treatment of titania nanoparticles [13,14]. It is suggested that one-dimensional (1D) nanostructures offer better transport pathways for photogenerated electrons than nanoparticles because of their longer carrier diffusion lengths [8,15]. Recently, 1D titania arrays have been directly prepared on a Ti foil via the anodic oxidation of Ti in different electrolytes containing fluoride ions [16], and have been used as the photoanode of DSSCs [9,11,17]. The 1D titania arrays could also be detached and transferred onto the FTO glass for the fabrication of DSSCs [17]. However, it is not easy to reliably produce such nanostructures over a large area, since the anodization process is sensitive to electrochemical reaction conditions. Direct oxidation of Ti foils can also produce nanorods or nanowires directly grown on Ti substrates, but they require a long growth time [18] or high temperatures [19]. In this study, we report a facile approach for fabricating TiO2 nanowire networks on Ti foil using a Ti corrosion reaction in KOH aqueous solutions at different temperatures, followed by a further ion-exchange process. We also investigate the efficacy of the TiO2 nanowire networks as photoanodes for bendable DSSCs.
2. Results and Discussion
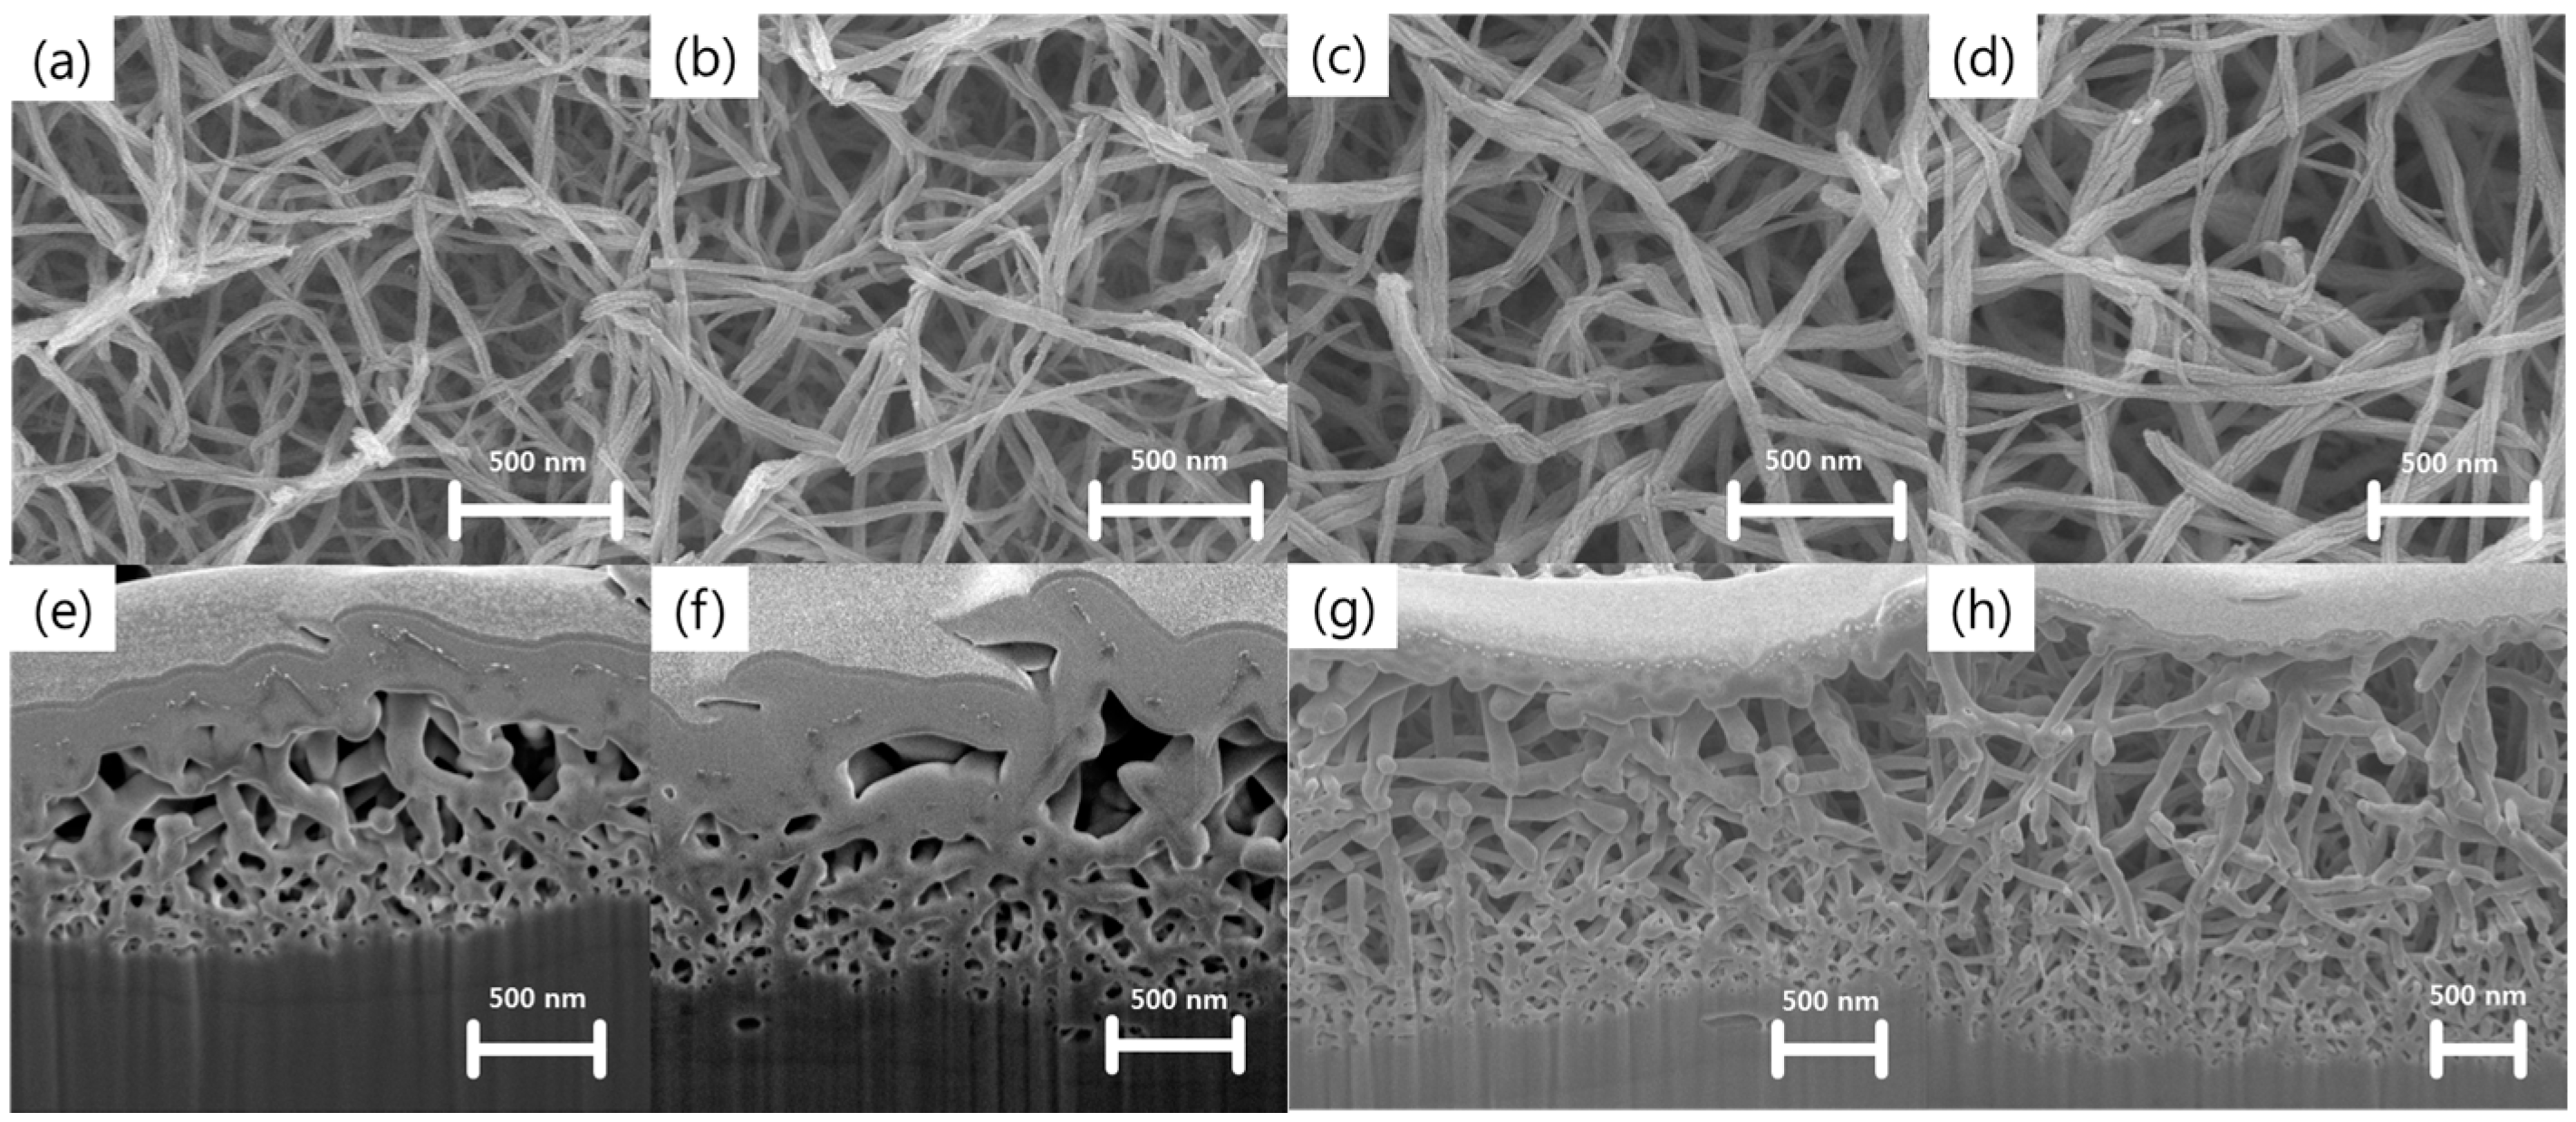
Figure 1 shows field emission scanning electron microscopy (FE-SEM) images of the nanostructures prepared using Ti wet corrosion in 5 M KOH aqueous solution at different temperatures. Porous nanowire networks were formed on the Ti surface at all corrosion temperatures. Details of the chemical reactions occurring between Ti and alkaline solution can be found elsewhere [20,21]. Ti reacts with hydroxide ions through hydration reactions, which results in hydrated TiO2. Meanwhile, hydrated TiO2 can be also dissolved as negatively charged hydrates by hydroxyl attack. Notably, a higher corrosion temperature yielded thicker nanowires, networks that were more aggregated, and a deeper corrosion depth. Figure 2 shows FE-SEM images of nanowire networks formed in 5 M KOH at 50 °C, and compares various corrosion time periods. Interestingly, compact nanowire networks were formed near the metal/oxide interface, whereas porous networks were produced near the surface. This result might be related to the local concentration gradient of hydroxide ions. The average thicknesses of the nanostructures formed for corrosion times of 6, 12, 24, and 48 h were 1.4 ± 0.1, 1.6 ± 0.2, 2.6 ± 0.2, and 3.3 ± 0.1 μm, respectively.
As reported previously, the resulting nanostructures could be K-incorporated TiO2 nanowires containing K–Ti–O bonds [20,21,22,23,24]. Figure 3 shows the Raman scattering spectra of all of the wet-corroded samples under 531 nm excitation to identify Ti–O bonds of the anatase and rutile phases and K–Ti–O bonds of potassium titanates. Anatase has six Raman active modes (i.e., 144 cm−1 (Eg), 197 cm−1 (Eg), 399 cm−1 (B1g), 513 cm−1 (A1g), and 639 cm−1 (Eg)) and rutile has four Raman active modes (i.e., 143 cm−1 (B1g), 447 cm−1 (Eg), 612 cm−1 (A1g), and 826 cm−1 (B2g)) [25]. All samples showed typical Raman peaks originating from the anatase and rutile phases of TiO2 (i.e., 197 cm−1, 448 cm−1, 640 cm−1, and 826 cm−1). Interestingly, prominent Raman peaks resulting from the potassium-doped TiO2 (K-doped TiO2; i.e., 285 cm−1 and 660 cm−1) were also observed [26,27]. As the reaction temperature increased, all of the peaks became more intense and sharper, as a result of which the crystallinity of the nanostructures improved. Similarly, the corrosion time also had an influence on the degree of crystallinity. The X-ray diffraction (XRD) patterns of the wet-corroded Ti foils were also obtained (Figure S1 in Supplementary Materials). The intensity of the crystalline Ti peaks decreased with the increase in the reaction temperature. Unfortunately, prominent crystalline TiO2 peaks were not observed using XRD.
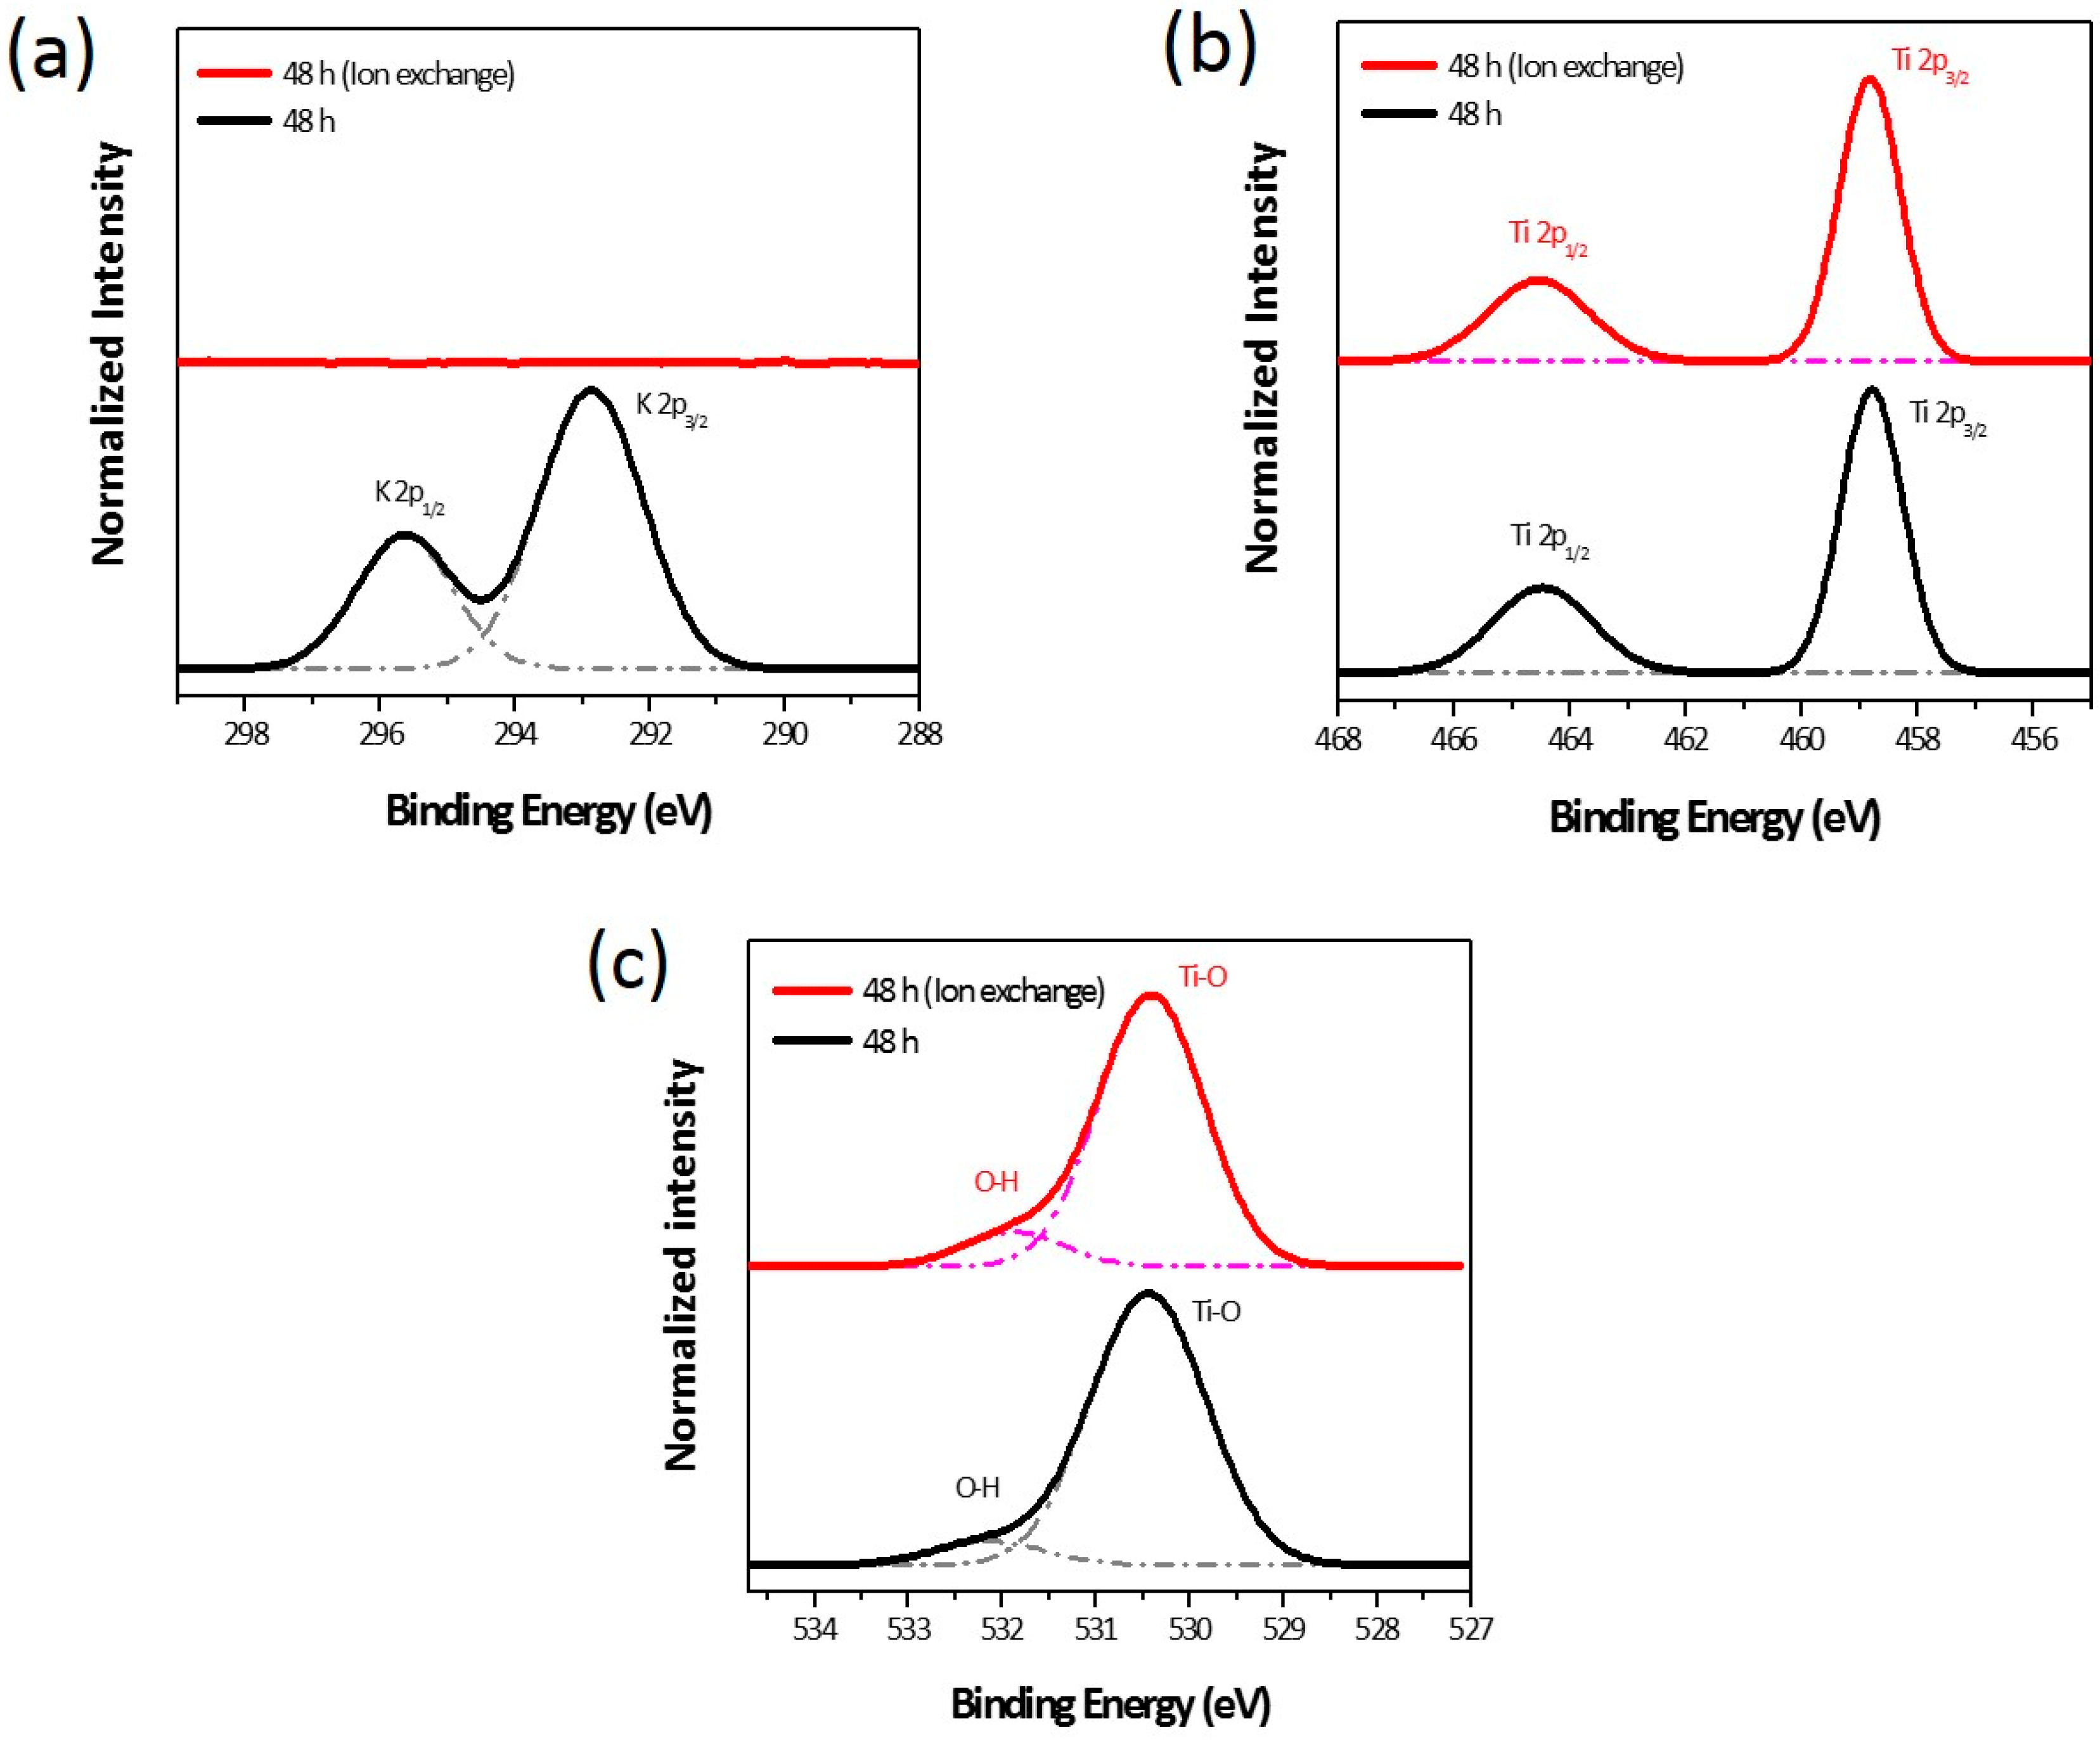
The chemical identity of the wet-corroded samples was confirmed by X-ray photoelectron spectroscopy (XPS). To replace K+ with H+, the wet-corroded Ti foil was immersed in HCl solution and the efficacy of the ion-exchange (hereafter referred to as “ion-exchange” and abbreviated as “IE”) was investigated as well. According to the survey XPS scans, the samples contained K, Ti, and O; no other elements were detected, except for carbon (Figure S2 in Supplementary Materials). Figure 4 shows the X-ray photoelectron narrow scan spectra of the K 2p, Ti 2p, and O 1s levels in the nanostructures prepared at 50 °C for 48 h. The observed binding energies of the K 2p, Ti 2p, and O 1s levels are summarized in Table 1. As can be seen from Figure 4a, the binding energy of the K 2p3/2 level before IE treatment was in fairly good agreement with that of the K-incorporated titanates reported in the literature. However, the K 2p peak disappeared completely after the IE treatment. As shown in Figure 4b, the Ti 2p doublet peaks of Ti 2p1/2 and Ti 2p3/2 were observed at 464.5 eV and 458.8 eV, respectively, and this is ascribed to the Ti–Ti bond. In Figure 4c, the binding energy of the O 1s level corresponds mainly to the Ti–O bond (bulk O2−) in TiO2 (530.0 eV and 530.5 eV for anatase and rutile, respectively). The small peak at the higher binding energy was a result of OH groups belonging to hydroxyl groups and adsorbed H2O, and its intensity became slightly higher after the IE treatment. On the basis of the observed binding energies, the as-received nanostructures were concluded to be K-doped TiO2. Unfortunately, the K-doped TiO2 exhibited p-type characteristics [24], and thus the removal of potassium dopant was crucial in order to use the nanostructures as the DSSC photoanode. It should be noted that the IE process was highly effective in removing potassium from the nanostructures without affecting the Ti–Ti and Ti–O bonds.
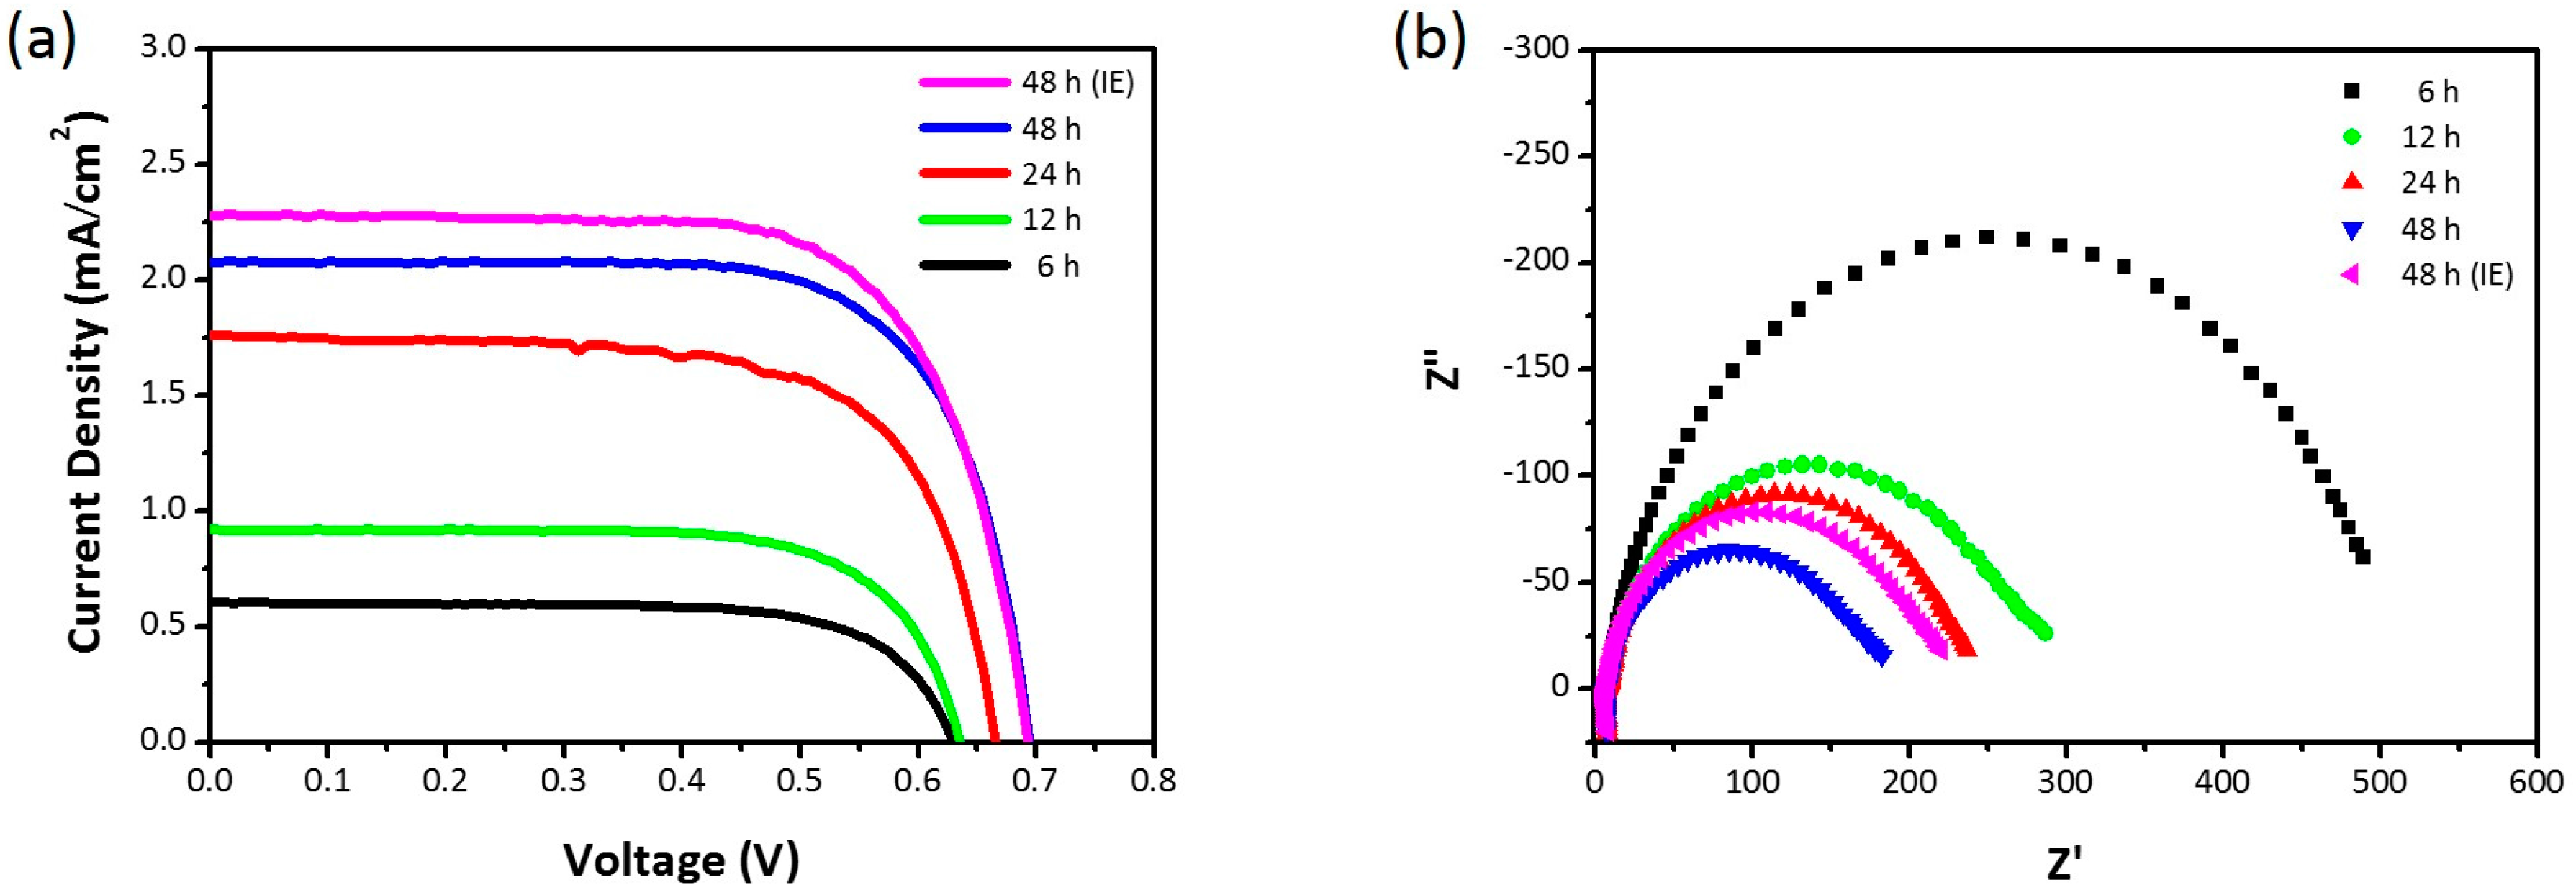
The fabricated nanowire networks were sensitized with N719 dye on the Ti foil and then used as the photoanode of a DSSC. However, because the substrate was metallic, the DSSC was required to be illuminated from the Pt counter electrode side (i.e., back illumination). The main drawback of this configuration relates to the transmission losses due to the Pt-based catalyst and the I−/I3− liquid electrolyte. Figure 5a shows the current density-voltage (J-V) characteristics of the DSSCs under back illumination. Table 2 summarizes the photovoltaic parameters. The photovoltaic performance improved with an increase in the reaction time: open-circuit voltage (Voc) increased from 0.63 V to 0.69 V; photocurrent density (Jsc) increased from 0.60 mA/cm2 to 2.08 mA/cm2; and power conversion efficiency (η) increased from 0.27% to 1.03%. Notably, the IE treatment resulted in better photovoltaic performance: η increased from 1.03% to 1.11%. Electrochemical impedance spectroscopy (EIS) can offer valuable insights into interfacial charge-transfer processes of DSSCs. Figure 5b shows the Nyquist plots of the DSSCs under back illumination with applied open-circuit voltage. The semicircle in the intermediate frequency region reflects the charge-transfer resistance at the TiO2/photosensitizer/electrolyte interface. As the photoanode thickness increased, the charge-transfer resistance decreased; thus, this coincides with the resultant DSSC performance.
3. Material and Methods
3.1. Three-Dimensional TiO2 Nanowire Networks
A pure titanium foil (Ti > 99.5%, Nilaco Co., Tokyo, Japan) with a thickness of 1 mm was used as the starting material for wet corrosion. TiO2 nanostructures could be prepared through a Ti corrosion reaction in KOH aqueous solution [20]. A Ti substrate 15 mm × 30 mm in size was polished with a SiC sheet (No. 1000) and subsequently cleaned by ultrasonication in acetone, isopropanol, and deionized (DI) water. The cleaned substrate was immersed in 5 M KOH (95%) for 24 h at different temperatures (20, 50, and 80 °C). The wet-corroded Ti substrate was thoroughly rinsed with DI water. The 3D morphology of the TiO2 nanostructures was investigated by field emission scanning electron microscopy (FE-SEM, S-4800, Hitachi, Tokyo, Japan). A Focused Ion Beam (FIB, Thermo Fisher Scientific, Waltham, MA, USA) was used to prepare the cross-sectional samples. Micro-Raman spectroscopy was performed in a back-scattering geometry by using a laser operating at a wavelength of approximately 531 nm and with a spectral resolution of 1.4 cm−1 (FEX, NOST, Seongnam, Korea). The Raman signals were detected using a charge-coupled-device (CCD) camera (iDus DV401A, Andor, Concord, MA, USA). The XRD patterns were collected on a D/max250/PC (Rigaku, Tokyo, Japan) using Cu radiation at 40 kV and 200 mA at room temperature. X-ray photoelectron spectroscopy (XPS) was performed with the K-Alpha XPS system (Thermo Fischer Scientific, Waltham, MA, USA) using a monochromated Al Kα X-ray source with an energy of 1486.6 eV. The spectra of Ti 2p and O 1s energy levels were calibrated with respect to the C 1s peak of the adventitious carbon on the sample surface at 285.0 eV.
3.2. DSSCs
The wet-corroded foil was immersed in 0.1 M HCl aqueous solution for 24 h at room temperature (RT) to replace K+ with H+, after which it was rinsed with deionized (DI) water and dried under N2 flow. The titanium tetrachloride (TiCl4) treatment was performed by soaking the foil in 0.04 M TiCl4 aqueous solution at 75 °C for 30 min. It was then rinsed with DI water and sintered at 500 °C for 30 min. The foil was exposed to O2 plasma and then immersed in 0.1 M HNO3 solution for 30 min to facilitate dye adsorption. The final foil was immersed in a 0.5 mM N719 (Solaronix) ethanol solution for 12 h. A Pt counter electrode was prepared on fluorine-doped SnO2 (FTO)-coated conducting glass (TEC 8, Pilkington; thickness: 2.2 mm, sheet resistance: 8 Ω/sq) by spin-coating of 0.04 M chloroplatinic acid (H2PtCl6) solution and post-annealing at 400 °C for 1 h. Both the dye-sensitized foil and the Pt counter electrode were sealed with a 25-μm-thick layer of Surlyn (Solaronix, Aubonne, Switzerland). An iodide based redox electrolyte (Iodolyte AN-50, Solaronix, Aubonne, Switzerland) was injected into the cell. The photovoltaic characteristics of the cell were measured using a solar cell I–V measurement system (K3000 LAB, McScience Inc., Suwon, Korea) under air mass 1.5 (AM 1.5) global, one-sun illumination (100 mW/cm2). The effective area of the fabricated solar cell was 1 cm × 0.7 cm. The open-circuit voltage (Voc), photocurrent density (Jsc), fill factor (FF), and power conversion efficiency (η) were recorded simultaneously. EIS experiments were performed using a frequency response analyzer (Solartron 1260, AMETEK. Inc., Berwyn, PA, USA). A sinusoidal potential perturbation with an amplitude of 10 mV was applied over a frequency range from 100 kHz to 0.1 Hz.
4. Conclusions
TiO2 nanowire networks were easily prepared with Ti corrosion in strong basic solutions at different temperatures and then a further IE process. Importantly, the prepared nanostructures on Ti foils were utilized as the photoanodes of bendable DSSCs, and consequently, the DSSCs exhibited a power conversion efficiency of 1.11%, even under back illumination. Our work towards further developments (e.g., fabrication optimization and transfer of the TiO2 nanowire networks to various substrates [11,17,28] for front illumination) will be explored and published in due course.
Supplementary Materials
The following are available online at https://www.mdpi.com/2079-4991/7/10/315/s1, Figure S1: XRD patterns of the wet-corroded Ti foil samples at various temperatures in 5 M KOH aqueous solution and normal Ti foil, Figure S2: Survey XPS spectrum of wet-corroded Ti foil sample at corrosion temperature of 50 °C and corrosion time of 48 h.
Acknowledgments
This work was supported by a grant (17CTAP-C129910-01) from the Technology Advancement Research Program (TARP) funded by the Ministry of Land, Infrastructures, and Transport (MOLIT) of Korea and the Chung-Ang University Graduate Research Scholarship (2016).
Author Contributions
Saera Jin, Eunhye Shin and Jongin Hong conceived and designed the experiments; Saera Jin and Eunhye Shin performed the experiments; Saera Jin and Eunhye Shin analyzed the data; Saera Jin, Eunhye Shin and Jongin Hong wrote the paper; Saera Jin and Eunhye Shin significantly contributed to manuscript preparation.
Conflicts of Interest
The authors declare no conflict of interest.
References
- O’Regan, B.; Gratzel, M. A low-cost, high-efficiency solar-cell based on dye-sensitized colloidal TiO2 films. Nature 1991, 353, 737–740. [Google Scholar] [CrossRef]
- Hagfeldt, A.; Boschloo, G.; Sun, L.; Kloo, L.; Pettersson, H. Dye-sensitized solar cells. Chem. Rev. 2010, 110, 6595–6663. [Google Scholar] [CrossRef] [PubMed]
- Kang, M.G.; Park, N.-G.; Ryu, K.S.; Chang, S.H.; Kim, K.-J. A 4.2% efficient flexible dye-sensitized TiO2 solar cells using stainless steel substrate. Sol. Energy Mater. Sol. Cell 2006, 90, 574–581. [Google Scholar] [CrossRef]
- Park, J.H.; Jun, Y.; Yun, H.-G.; Lee, S.-Y.; Kang, M.G. Fabrication of an Efficient Dye-Sensitized Solar Cell with Stainless Steel Substrate. J. Electrochem. Soc. 2008, 155, F145–F149. [Google Scholar] [CrossRef]
- Onoda, K.; Ngamsinlapasathian, S.; Fujieda, T.; Yoshikawa, S. The superiority of Ti plate as the substrate of dye-sensitized solar cells. Sol. Energy Mater. Sol. Cell 2007, 91, 1176–1181. [Google Scholar] [CrossRef]
- Chen, H.W.; Huang, K.-C.; Hsu, C.-Y.; Lin, C.-Y.; Chen, J.-G.; Lee, C.-P.; Lin, L.-Y.; Vittal, R.; Ho, K.-C. Electrophoretic deposition of TiO2 film on titanium foil for a flexible dye-sensitized solar cell. Electrochim. Acta 2011, 56, 7991–7998. [Google Scholar] [CrossRef]
- Frank, A.J.; Kopidakis, N.; van de Lagemaat, J. Electrons in nanostructured TiO2 solar cells: Transport, recombination and photovoltaic properties. Coord. Chem. Rev. 2004, 248, 1165–1179. [Google Scholar] [CrossRef]
- Zhang, Q.; Cao, G. Nanostructured photoelectrodes for dye-sensitized solar cells. Nano Today 2011, 6, 91–109. [Google Scholar] [CrossRef]
- Mor, G.K.; Varghese, O.K.; Paulose, M.; Shankar, K.; Grimes, C.A. A review on highly ordered, vertically oriented TiO2 nanotube arrays: Fabrication, material properties, and solar energy applications. Sol. Energy Mater. Sol. Cell 2006, 90, 2011–2075. [Google Scholar] [CrossRef]
- Wang, J.; Lin, Z. Anodic formation of ordered TiO2 nanotube arrays: Effects of electrolyte temperature and anodization potential. J. Phys. Chem. 2009, 113, 4026–4030. [Google Scholar] [CrossRef]
- Yip, C.T.; Huang, H.; Zhou, L.; Xie, K.; Wang, Y.; Feng, T.; Li, J.; Tam, W.Y. Direct and seamless coupling of TiO2 nanotube photonic crystal to dye-sensitized solar cell: A single-step approach. Adv. Mater. 2011, 23, 5624–5628. [Google Scholar] [CrossRef] [PubMed]
- Song, M.Y.; Kim, D.K.; Ihn, K.J.; Jo, S.M.; Kim, D.Y. Electrospun TiO2 electrodes for dye-sensitized solar cells. Nanotechnology 2004, 15, 1861–1865. [Google Scholar] [CrossRef]
- Ohsaki, Y.; Masaki, N.; Kitamura, T.; Wada, Y.; Okamoto, T. Dye-sensitized TiO2 nanotube solar cells: Fabrication and electronic characterization. Phys. Chem. Chem. Phys. 2005, 7, 4157–4163. [Google Scholar] [CrossRef] [PubMed]
- Wu, W.-Q.; Rao, H.-S.; Xu, Y.-F.; Wang, Y.-F.; Su, C.-Y.; Kuang, D.-B. Hierarchical oriented anatase TiO2 nanostructure arrays on flexible substrate for efficient dye-sensitized solar cells. Sci. Rep. 2013, 3, 1892. [Google Scholar] [CrossRef] [PubMed]
- Wu, W.-Q.; Xu, Y.-F.; Su, C.-Y.; Kuang, D.-B. Ultra-long anatase TiO2 nanowire arrays with multi-layered configuration on FTO glass for high-efficiency dye-sensitized solar cells. Energy Environ. Sci. 2014, 7, 644–649. [Google Scholar] [CrossRef]
- Gong, D.; Grimes, C.A.; Varghese, O.K.; Hu, W.C.; Singh, R.S.; Chen, Z.; Dickey, E.C. Titanium oxide nanotube arrays prepared by anodic oxidation. J. Mater. Res. 2001, 16, 3331–3334. [Google Scholar] [CrossRef]
- Park, J.; Lee, T.-W.; Kang, M.G. Growth, detachment and transfer of highly-ordered TiO2 nanotube arrays: Use in dye-sensitized solar cells. Chem. Commun. 2008, 2867–2869. [Google Scholar] [CrossRef] [PubMed]
- Wu, J.M. Low-temperature preparation of titania nanorods through direct oxidation of titanium with hydrogen peroxide. J. Cryst. Growth 2004, 269, 347–355. [Google Scholar] [CrossRef]
- Peng, X.; Chen, A. Aligned TiO2 nanorod arrays synthesized by oxidizing titanium with acetone. J. Mater. Chem. 2004, 14, 2542–2548. [Google Scholar] [CrossRef]
- Shin, E.; Jin, S.; Kim, J.; Chang, S.-J.; Jun, B.-H.; Park, K.-W.; Hong, J. Preparation of K-doped TiO2 nanostructures by wet corrosion and their sunlight-driven photocatalytic performance. Appl. Surf. Sci. 2016, 379, 33–38. [Google Scholar] [CrossRef]
- Lee, S.Y.; Lee, C.H.; Kim, D.Y.; Locquet, J.-P.; Seo, J.W. Preparation and photocatalytic activity of potassium-incorporated titanium oxide nanostructures produced by the wet corrosion process using various titanium alloys. Nanomaterials 2015, 5, 1397–1417. [Google Scholar] [CrossRef] [PubMed]
- Kim, J.-I.; Lee, S.-Y.; Pyun, J.-C. Characterization of photocatalytic activity of TiO2 nanowire synthesized from Ti-plate by wet corrosion process. Curr. Appl. Phys. 2009, 9, e252–e255. [Google Scholar] [CrossRef]
- Lee, S.-Y.; Takai, M.; Kim, H.-M.; Ishihara, K. Preparation of nano-structured titanium oxide film for biosensor substrate by wet corrosion process. Curr. Appl. Phys. 2009, 9, e266–e269. [Google Scholar] [CrossRef]
- Lee, S.-Y.; Matsuno, R.; Ishihara, K.; Takai, M. Electrical transport ability of nanostructured potassium-doped titanium oxide film. Appl. Phys. Express 2011, 4, 407–416. [Google Scholar] [CrossRef]
- Zhang, J.; Li, M.; Feng, Z.; Chen, J.; Li, C. UV Raman spectroscopic study on TiO2. I. phase transformation at the surface and in the bulk. J. Phys. Chem. B 2006, 110, 927–935. [Google Scholar] [CrossRef] [PubMed]
- Liu, C.; Lu, X.; Yu, G.; Feng, X.; Zhang, Q.; Xu, Z. Role of an intermediate phase in solid state reaction of hydrous titanium oxide with potassium carbonate. Mater. Chem. Phys. 2005, 94, 401–407. [Google Scholar] [CrossRef]
- Chen, L.-C.; Huang, C.-M.; Tsai, F.-R. Characterization and photocatalytic activity of K+-doped TiO2 photocatalysts. J. Mol. Catal. A Chem. 2007, 265, 133–140. [Google Scholar] [CrossRef]
- Ke, S.; Chen, C.; Fu, N.; Zhou, H.; Ye, M.; Lin, P.; Yuan, W.; Zeng, X.; Chen, L.; Huang, H. Transparent indium tin oxide electrodes on muscovite mica for high-temperature-processed flexible optoelectronic devices. ACS Appl. Mater. Interfaces 2016, 8, 28406–28411. [Google Scholar] [CrossRef] [PubMed]
Figure 1.
Field emission scanning electron microscopy (FE-SEM) images of the surface and cross-section of wet-corroded Ti foil at various temperatures in 5 M KOH aqueous solution: (a,d) 20 °C, (b,e) 50 °C, and (c,f) 80 °C.
Figure 1.
Field emission scanning electron microscopy (FE-SEM) images of the surface and cross-section of wet-corroded Ti foil at various temperatures in 5 M KOH aqueous solution: (a,d) 20 °C, (b,e) 50 °C, and (c,f) 80 °C.
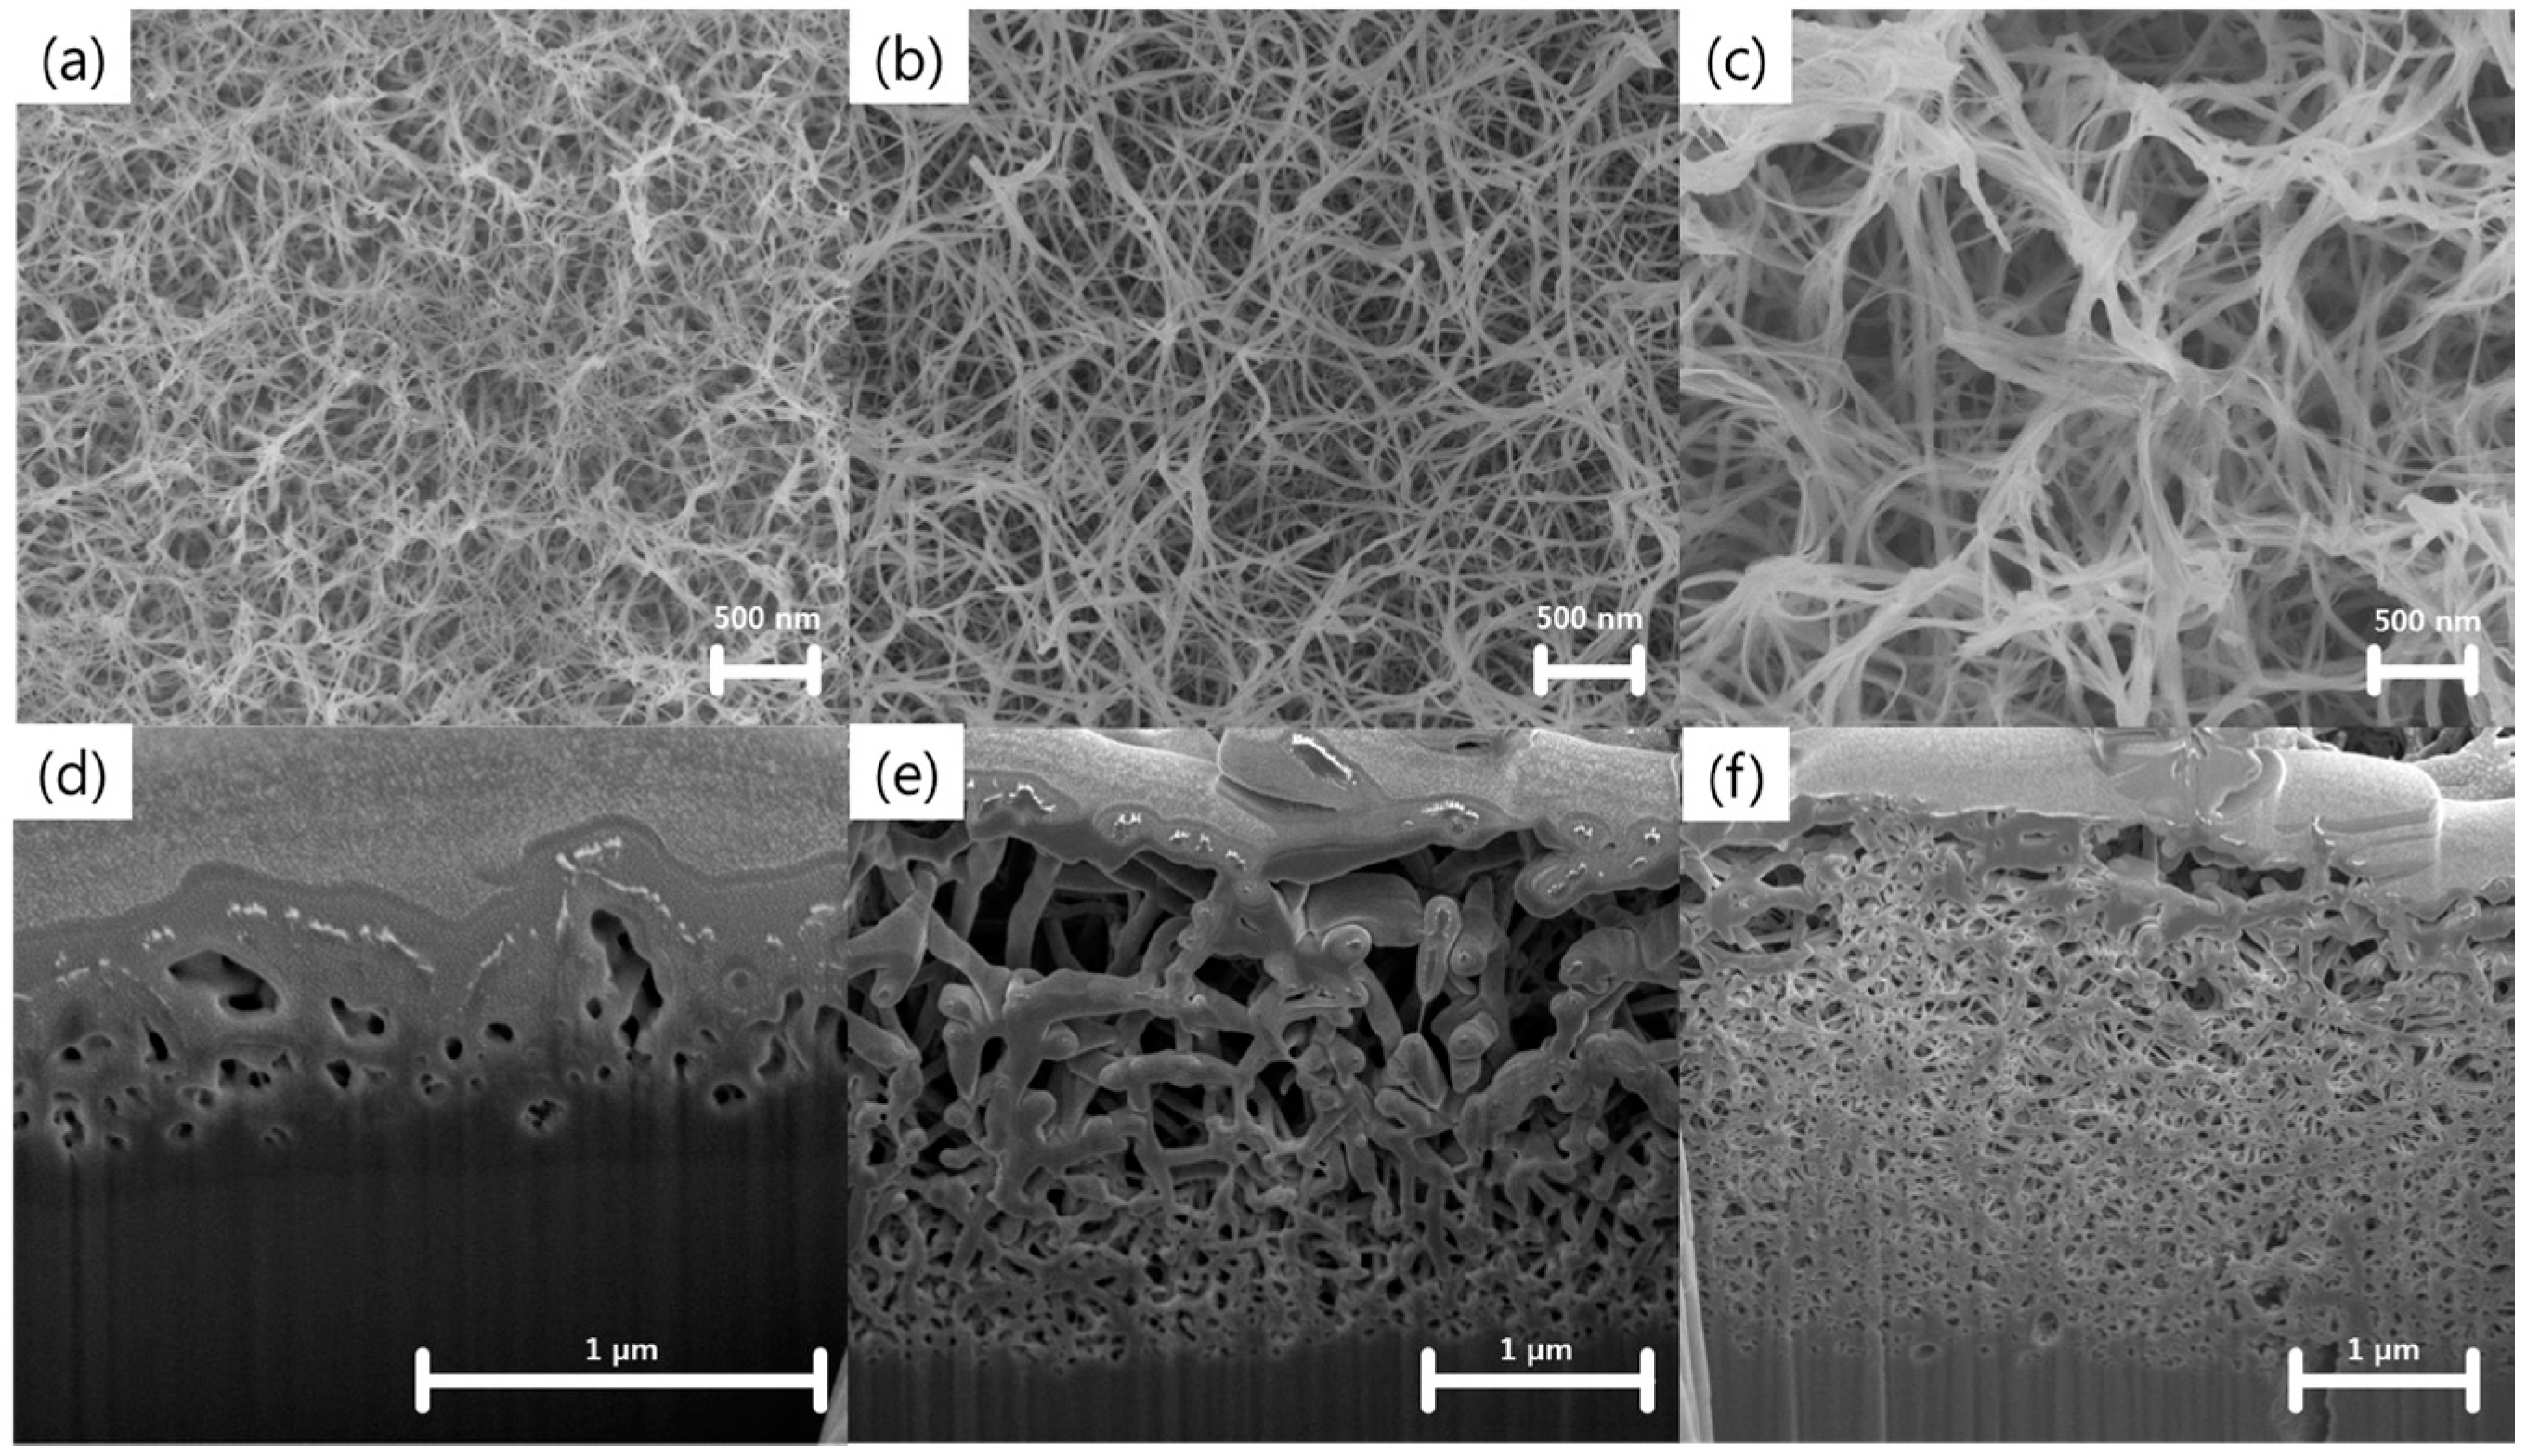
Figure 2.
FE-SEM images of the surface and cross-section of wet-corroded Ti foil at 50 °C in 5 M KOH aqueous solution for various time periods: (a,e) 6 h, (b,f) 12 h, (c,g) 24 h, and (d,h) 48 h.
Figure 2.
FE-SEM images of the surface and cross-section of wet-corroded Ti foil at 50 °C in 5 M KOH aqueous solution for various time periods: (a,e) 6 h, (b,f) 12 h, (c,g) 24 h, and (d,h) 48 h.

Figure 3.
Raman spectra of Ti foils corroded (a) in 5 M KOH aqueous solution for 24 h at different temperatures and (b) in 5 M KOH aqueous solution at 50 °C for different time periods.
Figure 3.
Raman spectra of Ti foils corroded (a) in 5 M KOH aqueous solution for 24 h at different temperatures and (b) in 5 M KOH aqueous solution at 50 °C for different time periods.
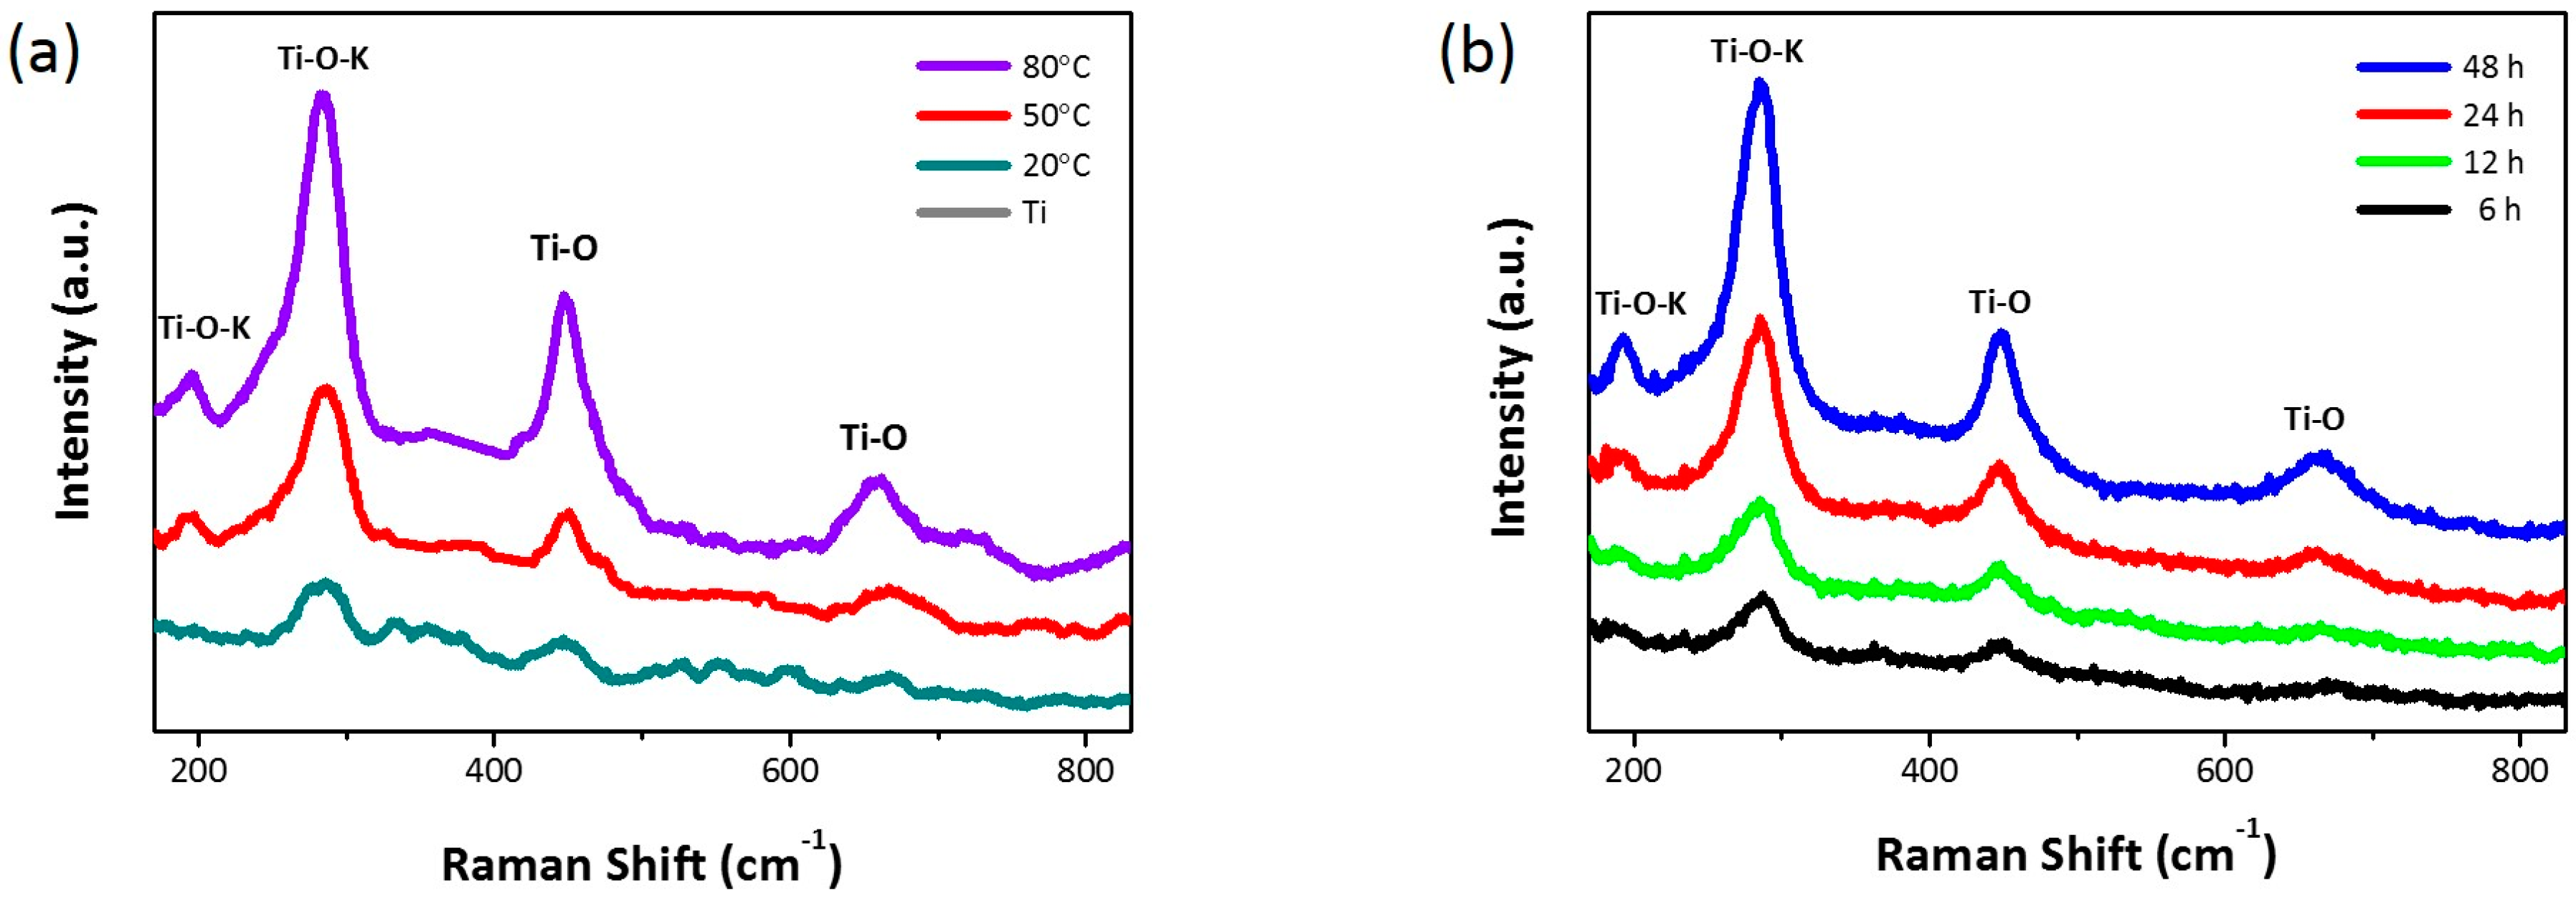
Figure 4.
Normalized intensity of the XPS narrow scan spectra of (a) K 2p, (b) Ti 2p, and (c) O 1s levels. The dotted lines below the XPS spectra represent the Lorentzian-fitted curves.
Figure 4.
Normalized intensity of the XPS narrow scan spectra of (a) K 2p, (b) Ti 2p, and (c) O 1s levels. The dotted lines below the XPS spectra represent the Lorentzian-fitted curves.

Figure 5.
(a) J-V characteristics and (b) Nyquist plots of DSSCs.

Table 1.
Binding energies of K 2p, Ti 2p, and O 1s levels in X-ray photoelectron spectroscopy (XPS) fitting. IE: ion exchange.
Table 1.
Binding energies of K 2p, Ti 2p, and O 1s levels in X-ray photoelectron spectroscopy (XPS) fitting. IE: ion exchange.
| (Unit: eV) | K 2p | Ti 2p | O 1s | |||
|---|---|---|---|---|---|---|
| 2p1/2 | 2p3/2 | 2p1/2 | 2p3/2 | O–H | Ti–O | |
| 48 h | 295.6 | 292.9 | 464.5 | 458.8 | 532.1 | 530.4 |
| 48 h (IE) | - | - | 464.5 | 458.8 | 531.9 | 530.4 |
Table 2.
Photovoltaic characteristics of wet-corroded Ti foil dye-sensitized solar cells (DSSCs) at 50 °C for different corrosion time periods. IE: ion exchange; FF: fill factor; Voc: open-circuit voltage; η: power conversion efficiency; Jsc: photocurrent density.
Table 2.
Photovoltaic characteristics of wet-corroded Ti foil dye-sensitized solar cells (DSSCs) at 50 °C for different corrosion time periods. IE: ion exchange; FF: fill factor; Voc: open-circuit voltage; η: power conversion efficiency; Jsc: photocurrent density.
| Wet Corrosion Time (h) | Voc (V) | Jsc (mA/cm2) | FF (%) | η (%) |
|---|---|---|---|---|
| 6 | 0.63 | 0.60 | 72.0 | 0.27 |
| 12 | 0.64 | 0.92 | 71.7 | 0.42 |
| 24 | 0.67 | 1.76 | 68.3 | 0.80 |
| 48 | 0.69 | 2.08 | 71.5 | 1.03 |
| 48 (IE) | 0.69 | 2.28 | 70.1 | 1.11 |
© 2017 by the authors. Licensee MDPI, Basel, Switzerland. This article is an open access article distributed under the terms and conditions of the Creative Commons Attribution (CC BY) license (http://creativecommons.org/licenses/by/4.0/).
Share and Cite
MDPI and ACS Style
Jin, S.; Shin, E.; Hong, J. TiO2 Nanowire Networks Prepared by Titanium Corrosion and Their Application to Bendable Dye-Sensitized Solar Cells. Nanomaterials 2017, 7, 315. https://doi.org/10.3390/nano7100315
AMA Style
Jin S, Shin E, Hong J. TiO2 Nanowire Networks Prepared by Titanium Corrosion and Their Application to Bendable Dye-Sensitized Solar Cells. Nanomaterials. 2017; 7(10):315. https://doi.org/10.3390/nano7100315
Chicago/Turabian StyleJin, Saera, Eunhye Shin, and Jongin Hong. 2017. "TiO2 Nanowire Networks Prepared by Titanium Corrosion and Their Application to Bendable Dye-Sensitized Solar Cells" Nanomaterials 7, no. 10: 315. https://doi.org/10.3390/nano7100315
Note that from the first issue of 2016, this journal uses article numbers instead of page numbers. See further details here.