
Linear and Nonlinear Rheology Combined with Dielectric Spectroscopy of Hybrid Polymer Nanocomposites for Semiconductive Applications


Abstract
:1. Introduction
Present Study
2. Materials and Methods
2.1. Materials and Preparation
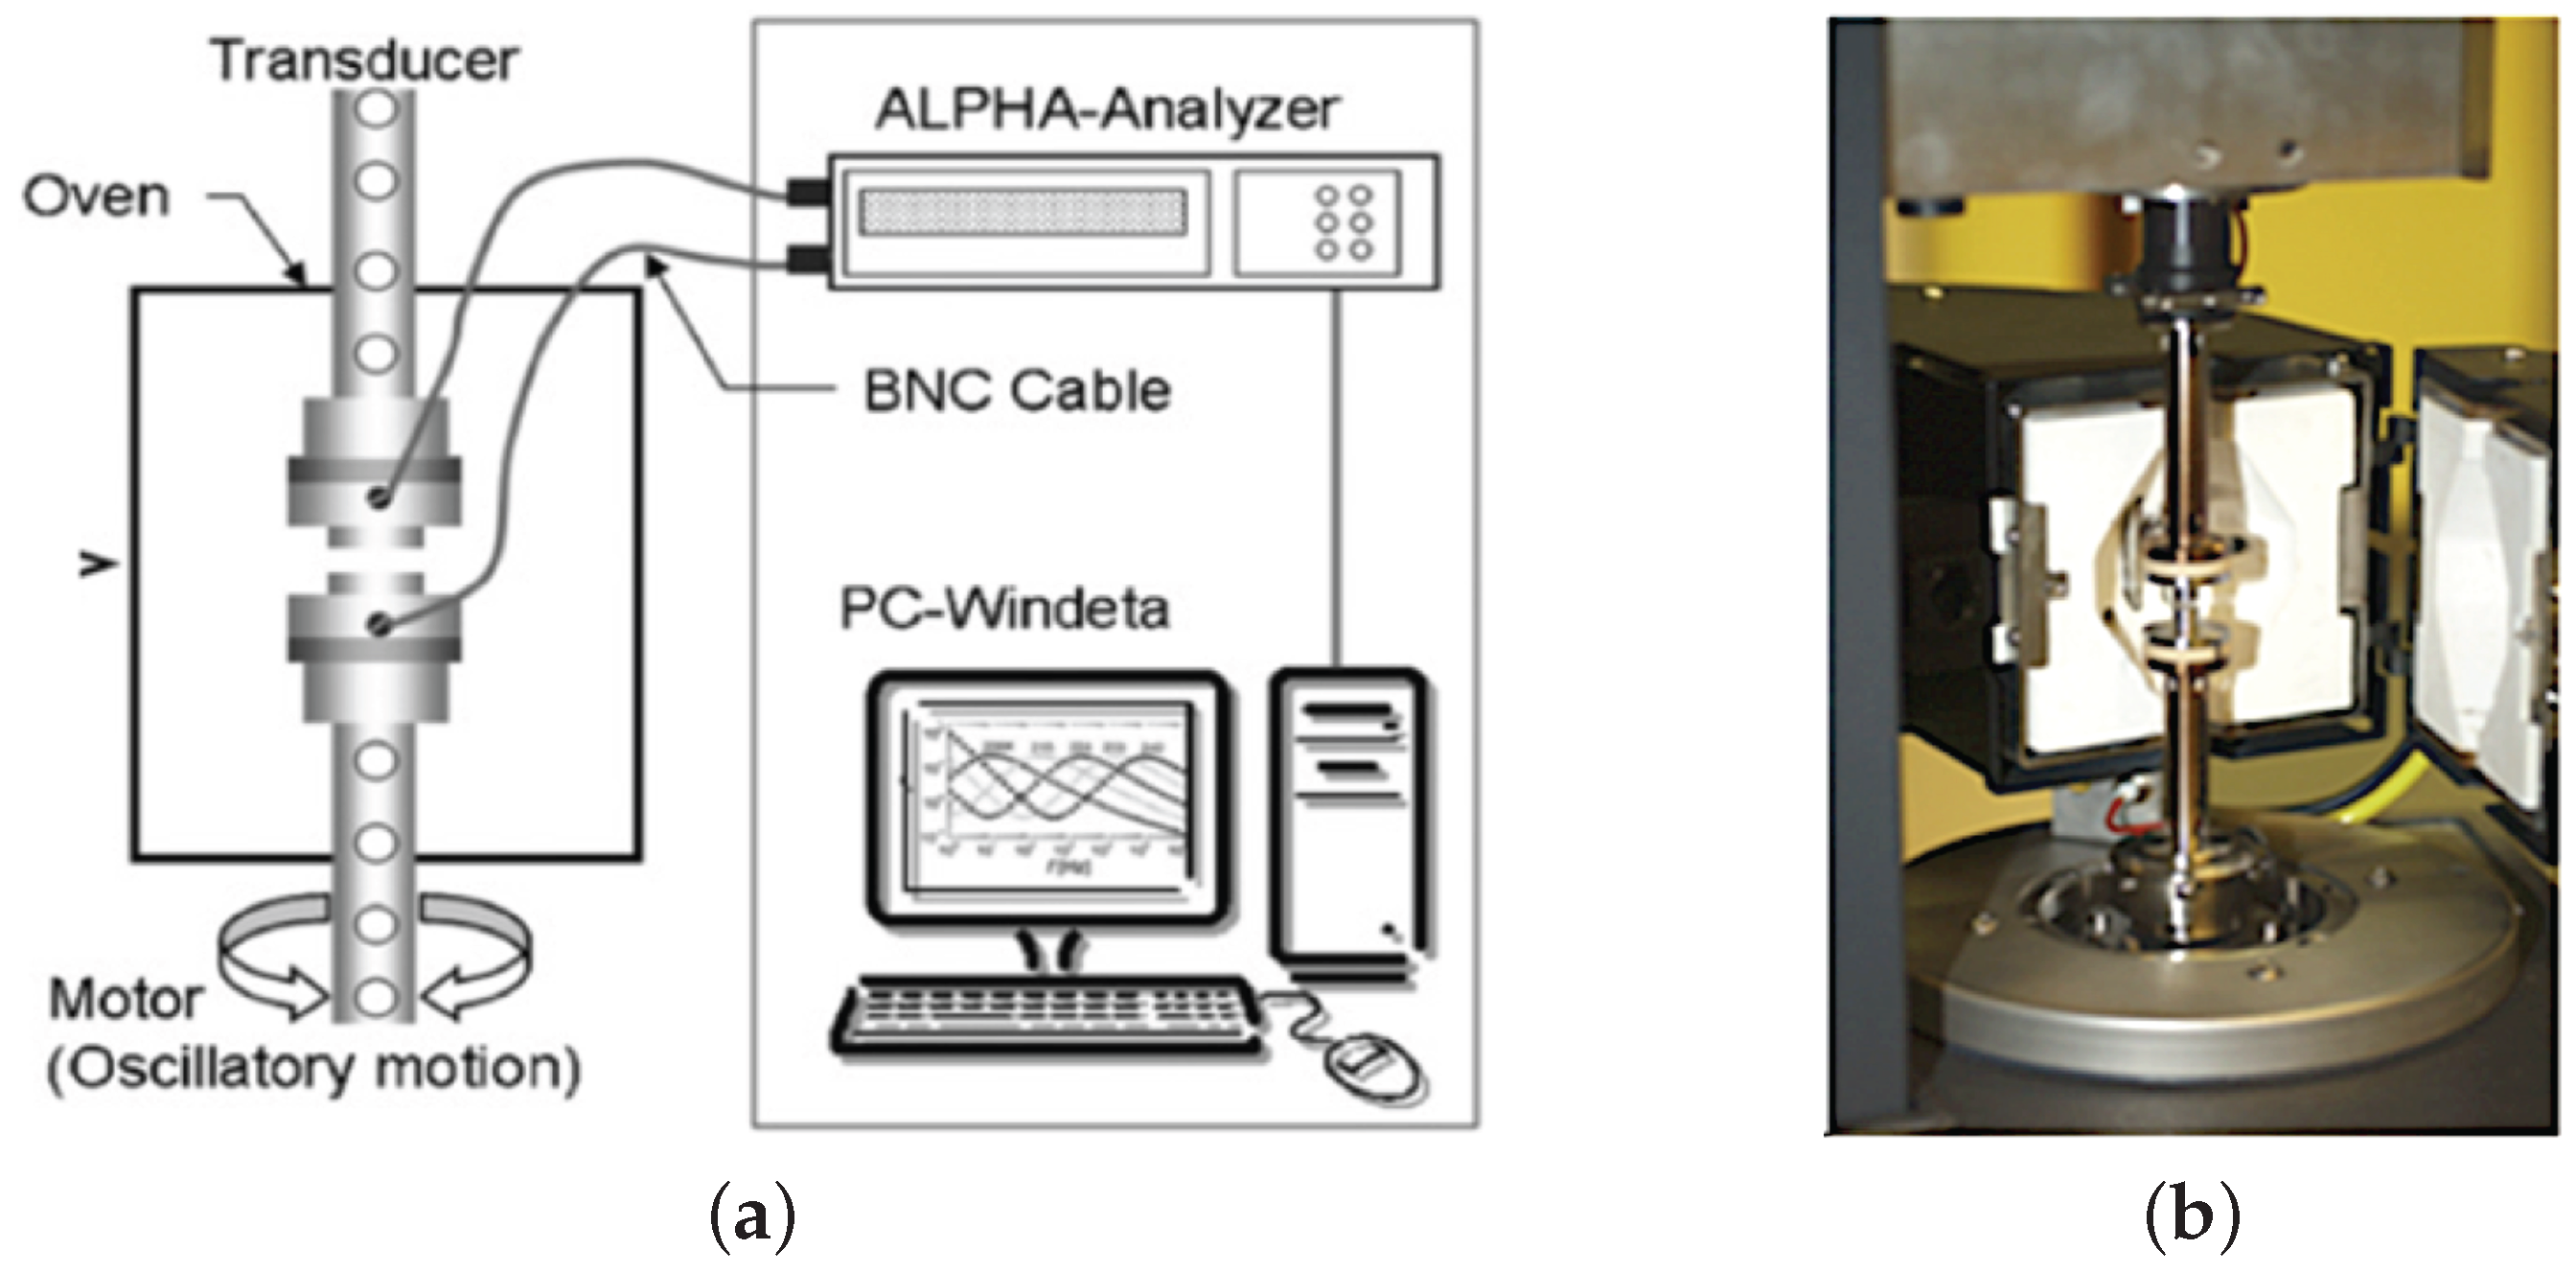
2.2. Rheological Characterization
2.3. Extensional Rheology and the Molecular Stress Function Theory
2.4. Combined Rheology: Dielectric Spectroscopy
3. Results and Discussion
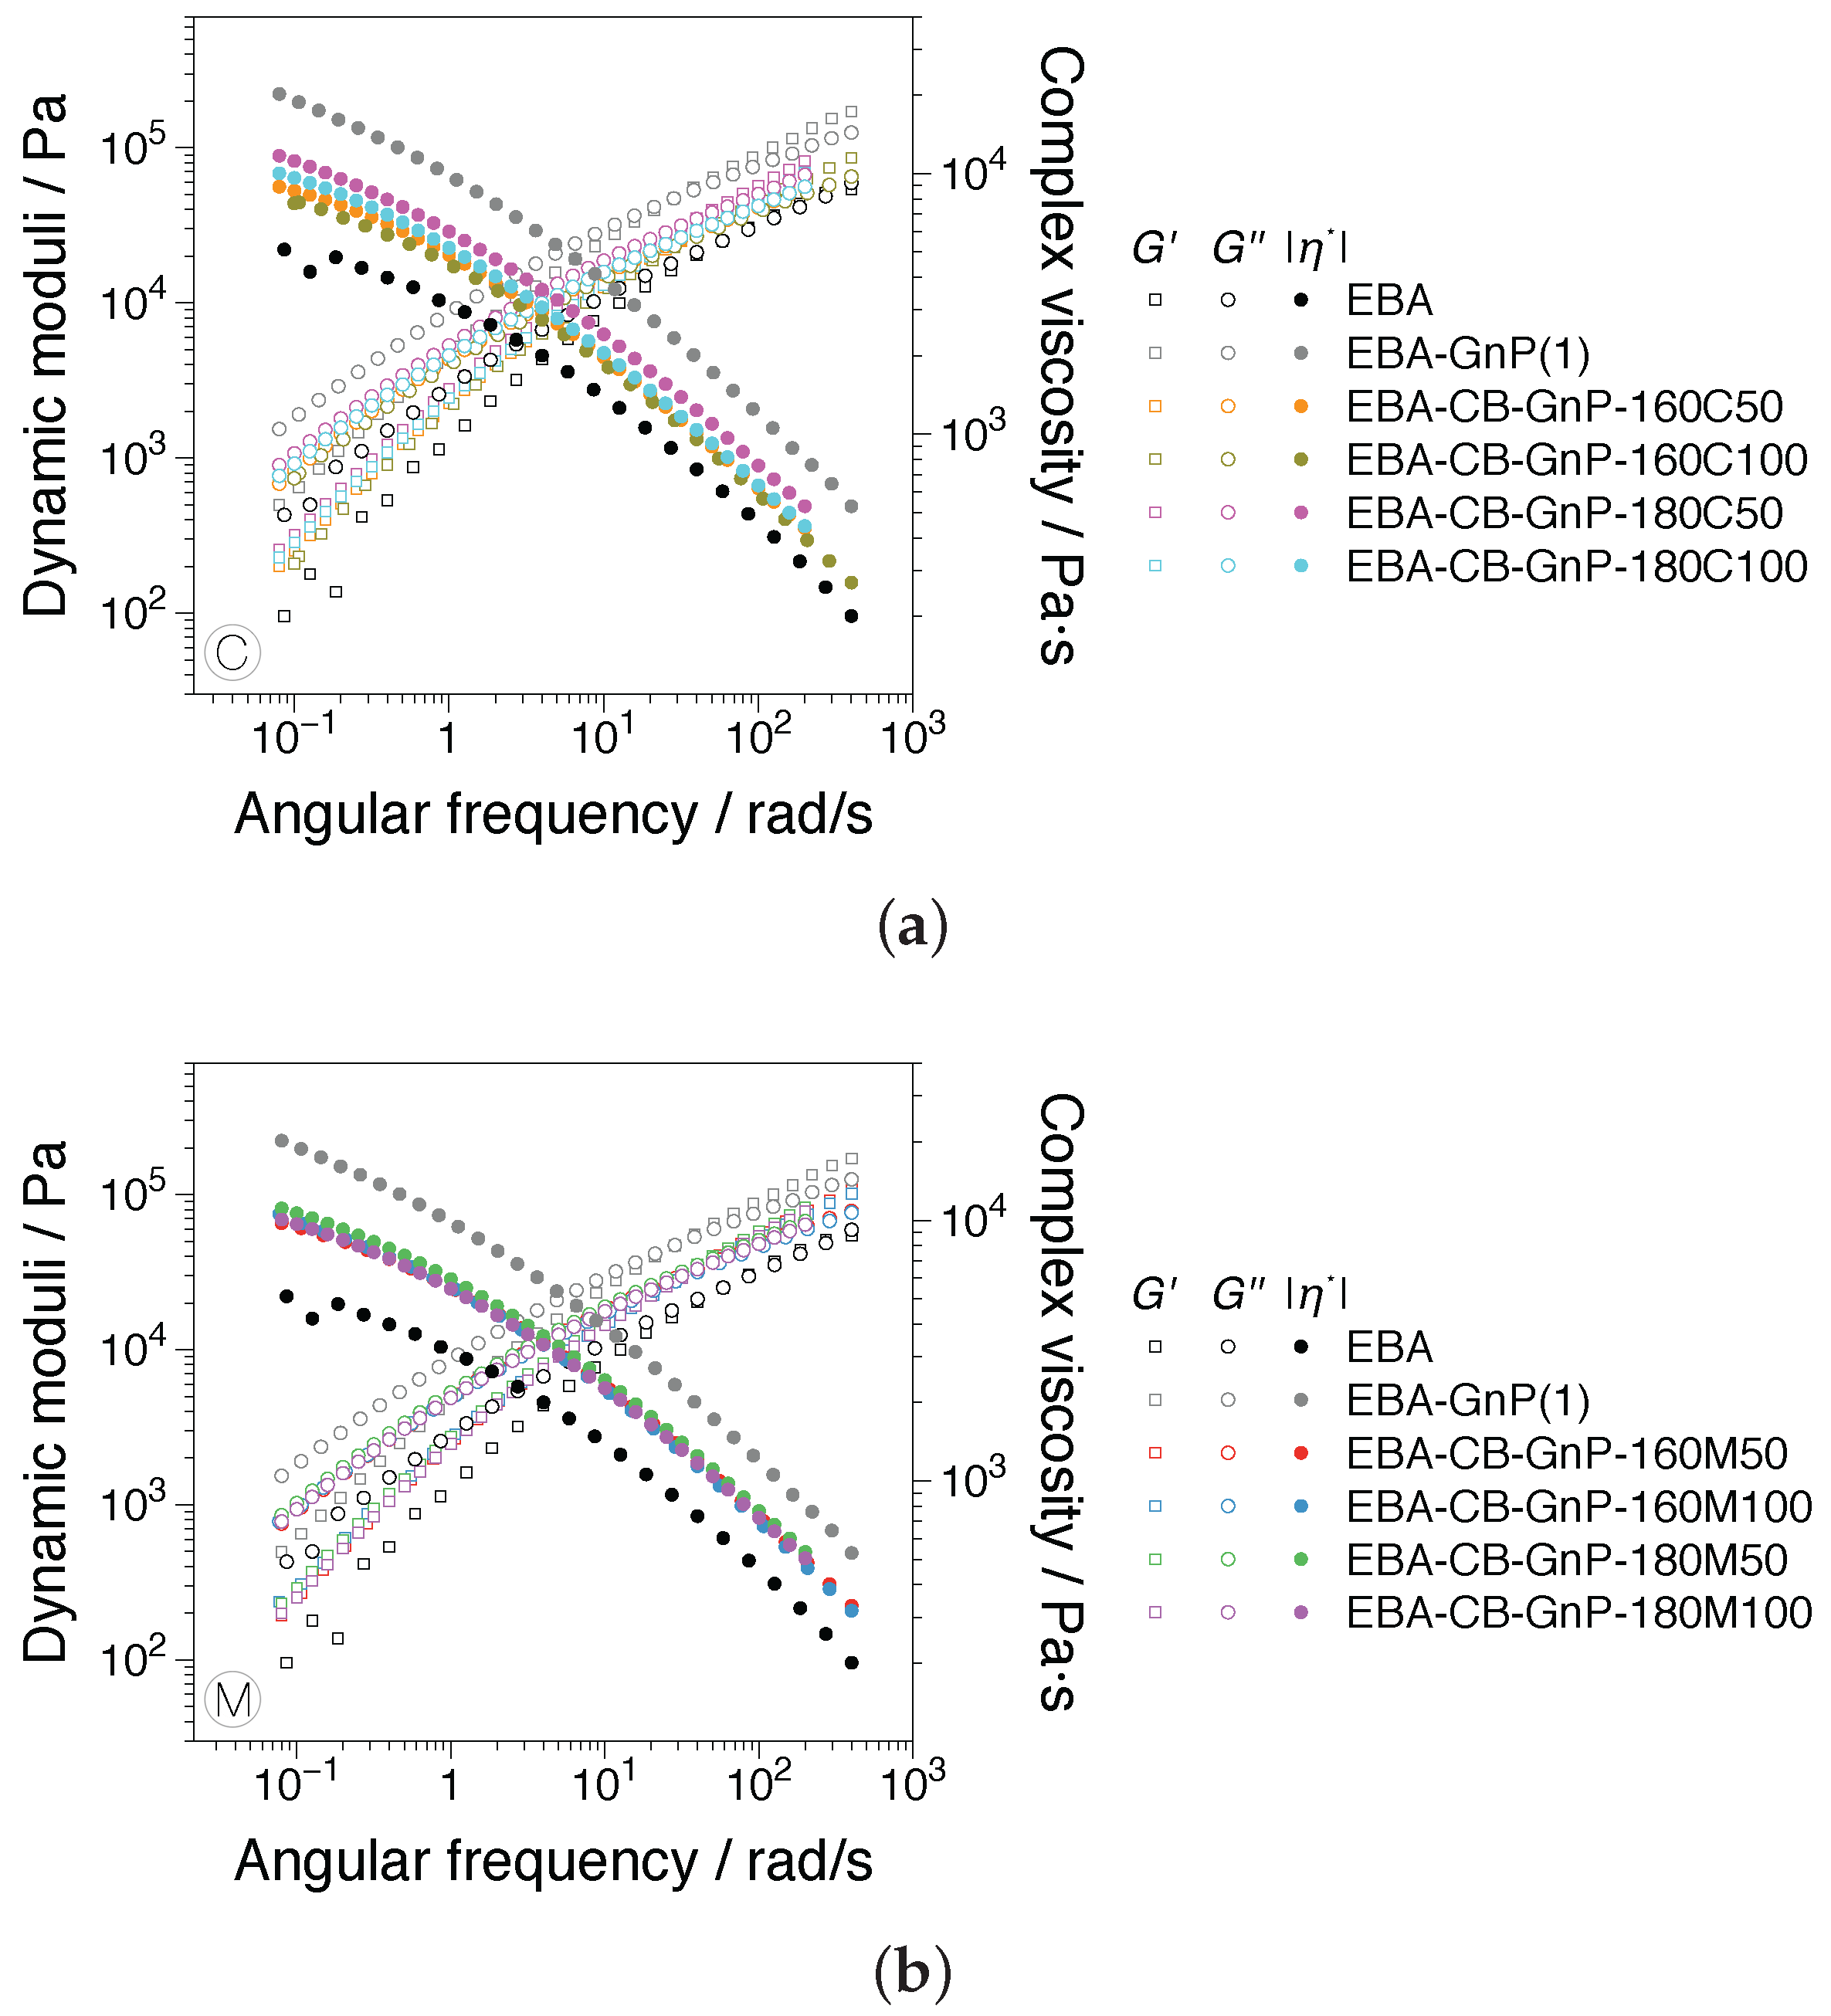
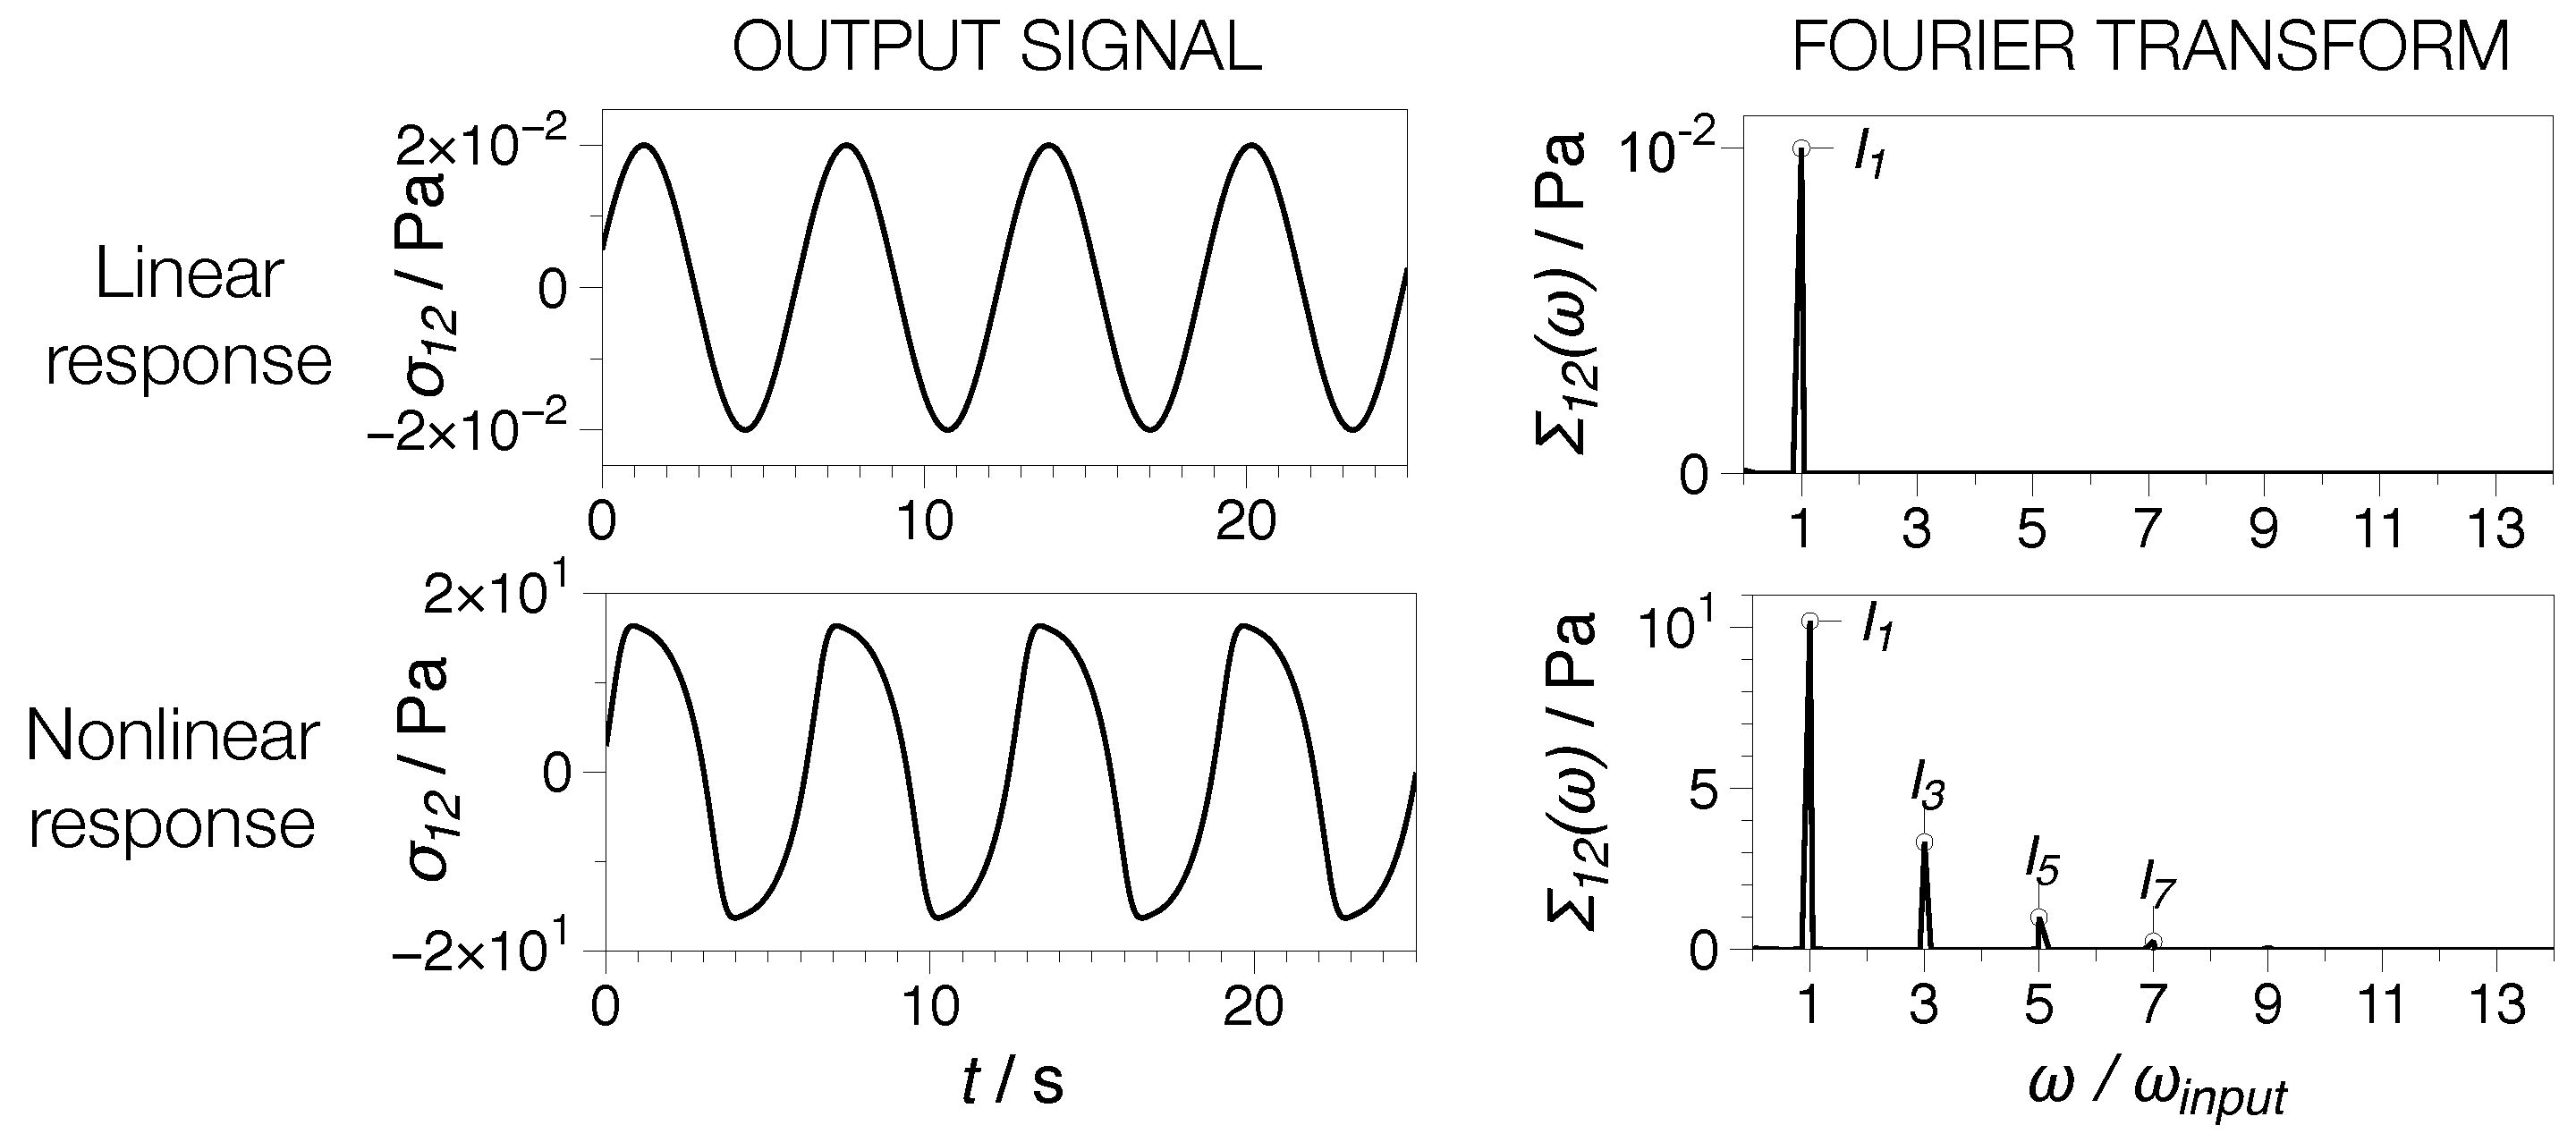
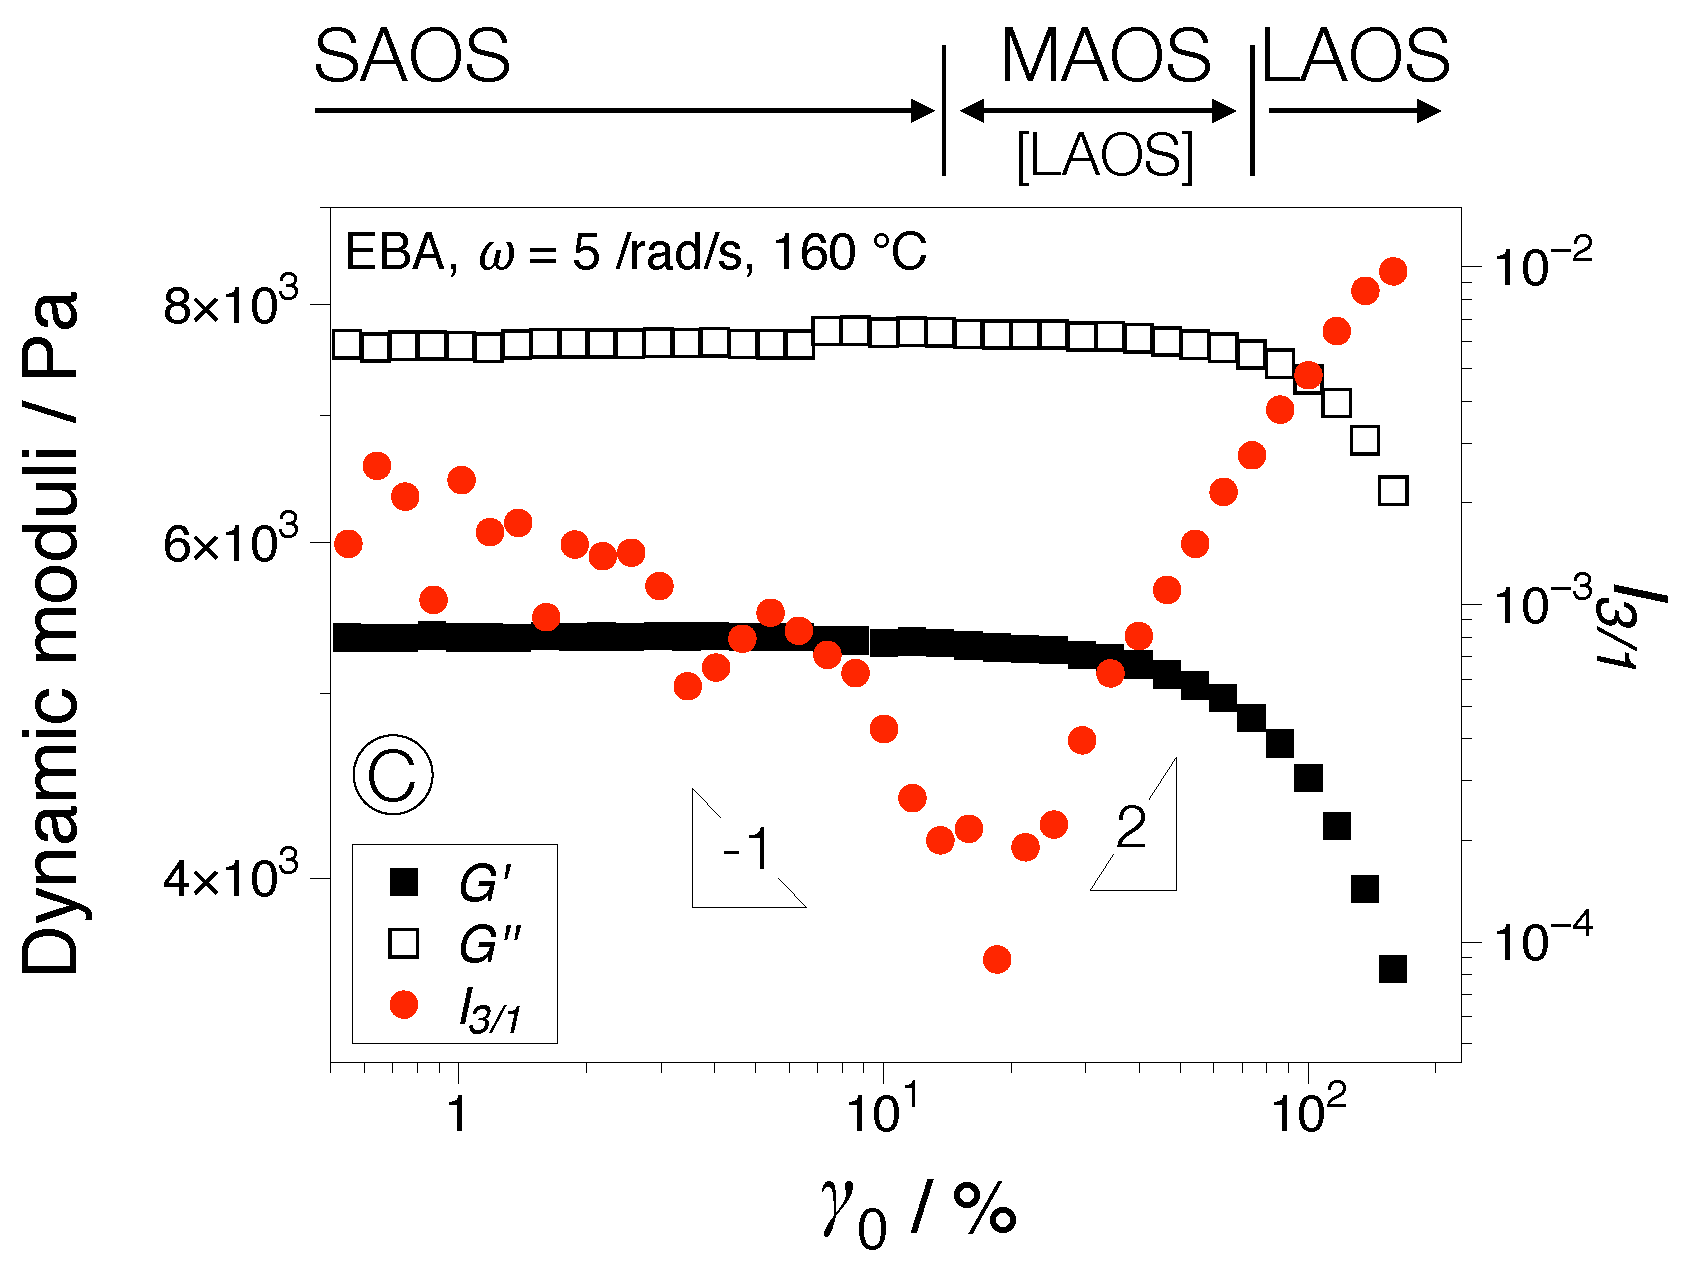
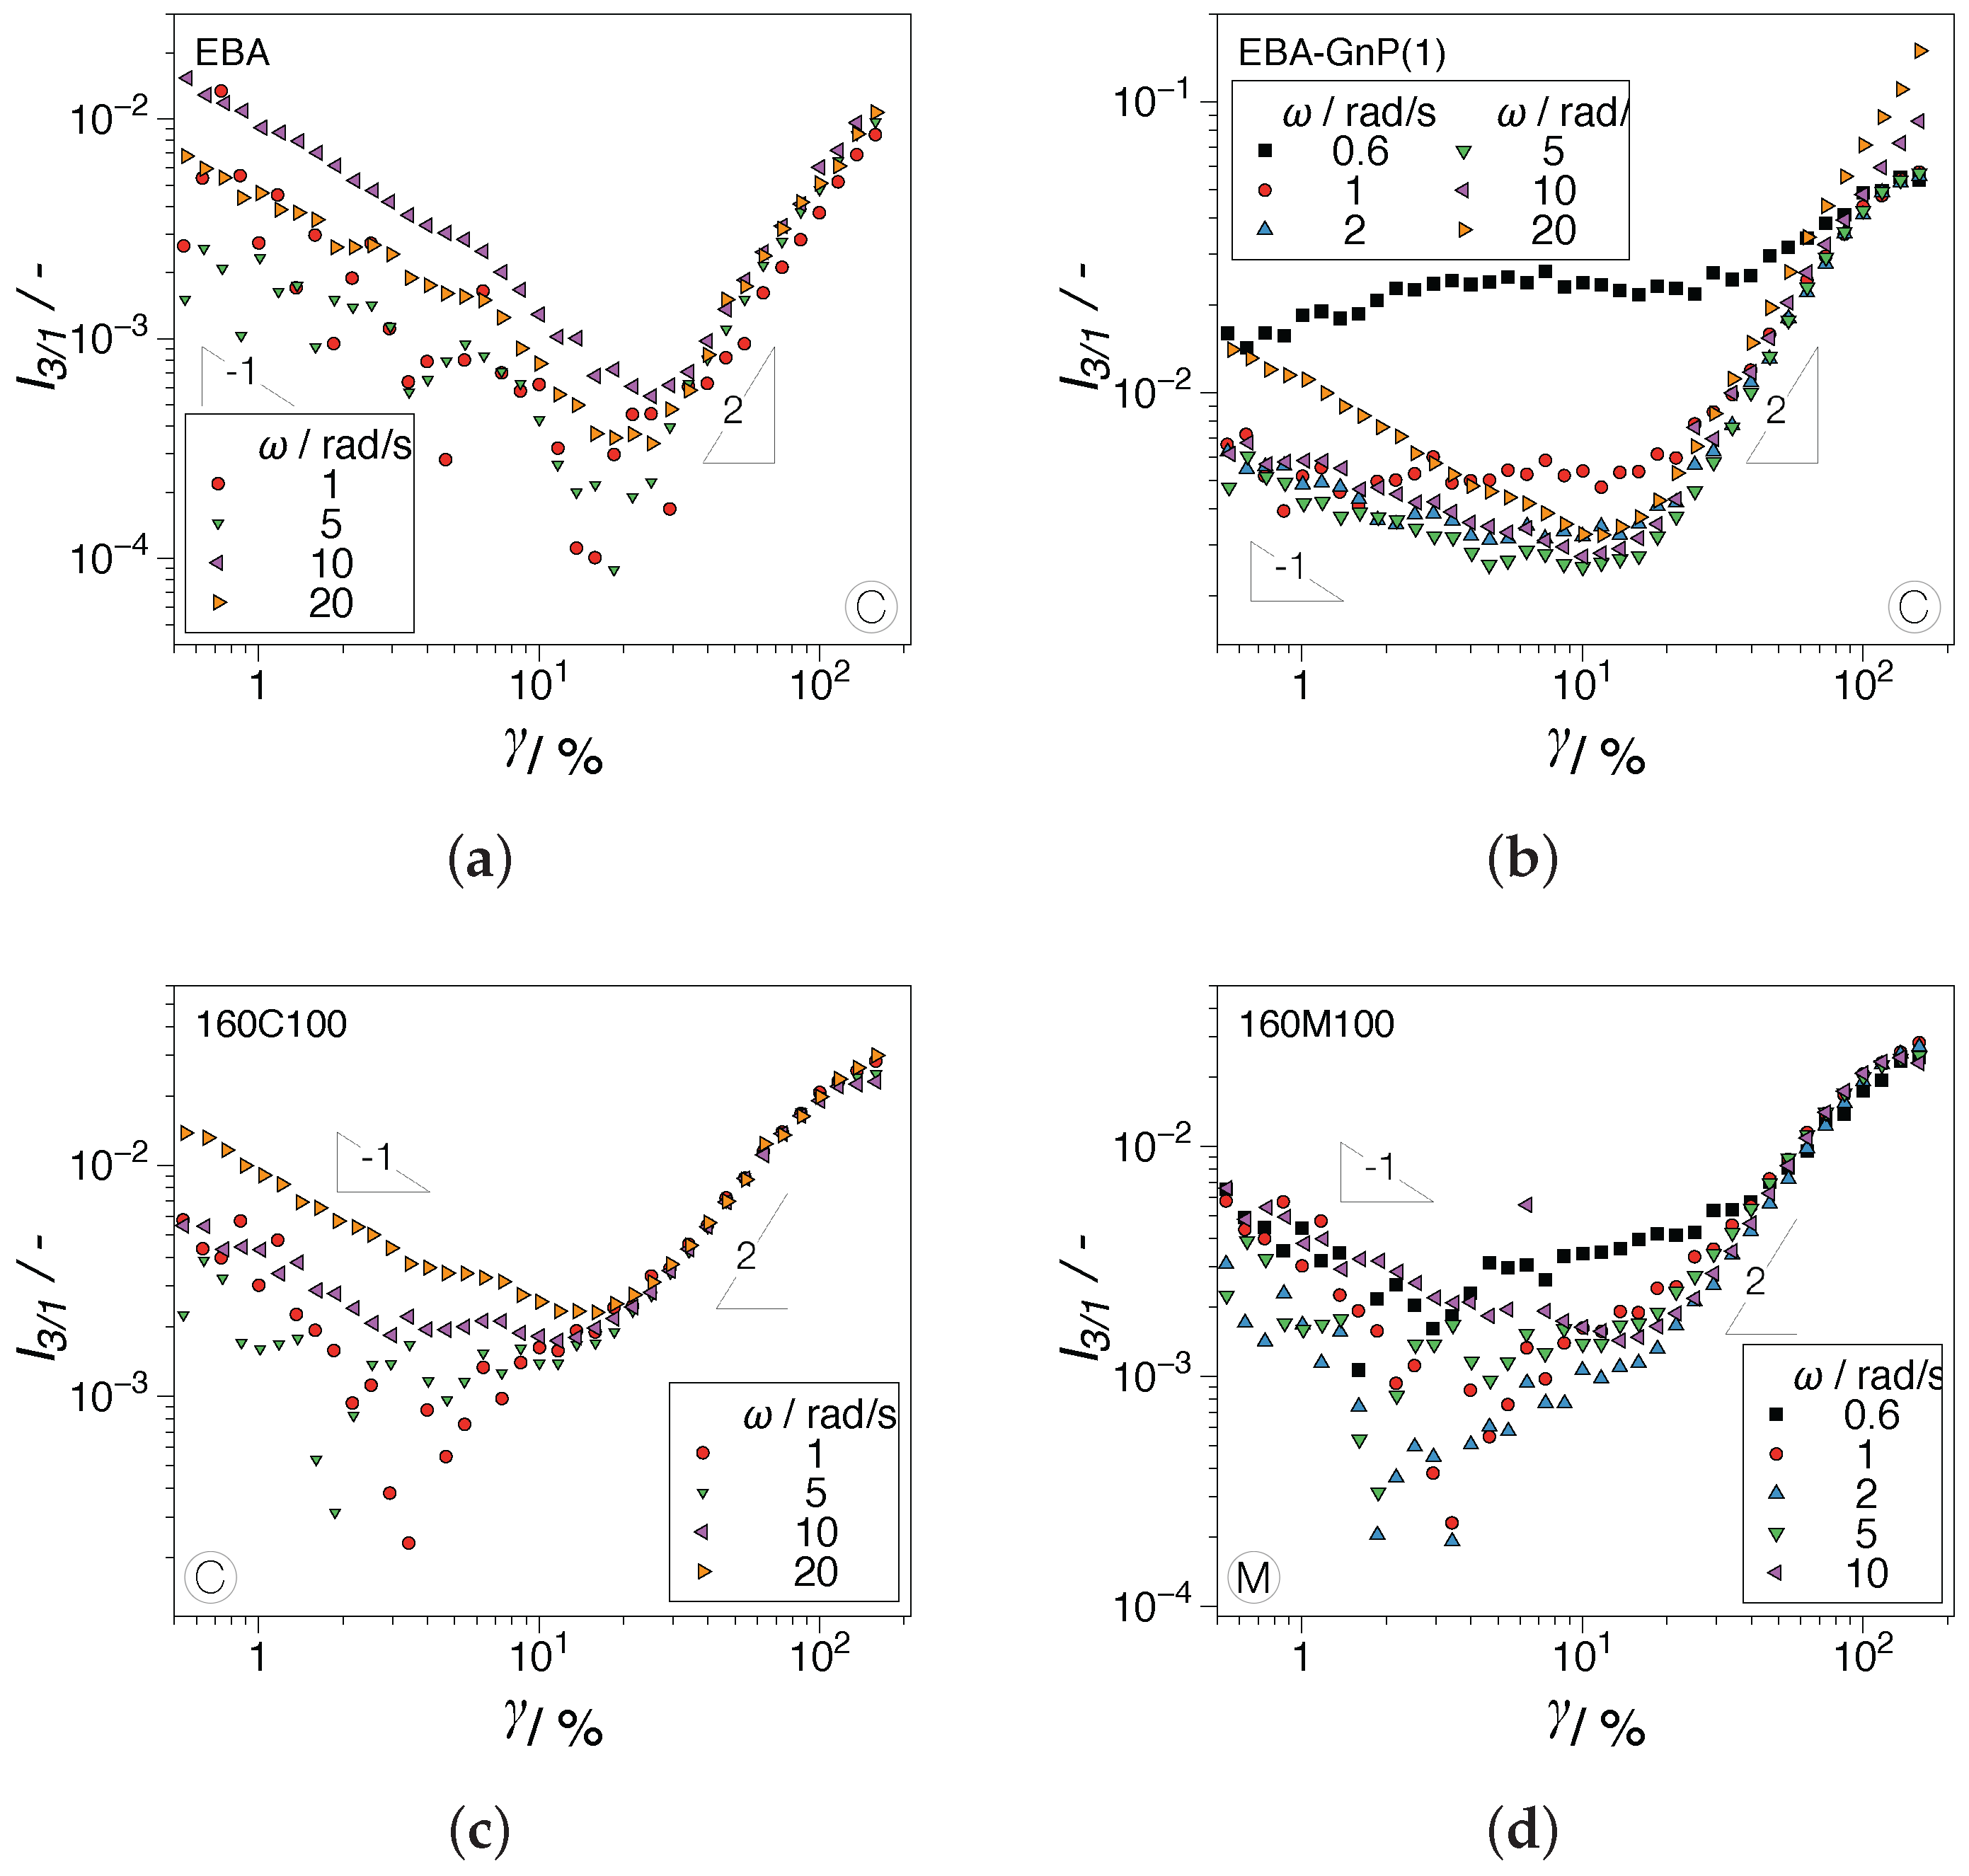
3.1. Linear and Nonlinear Oscillatory Shear
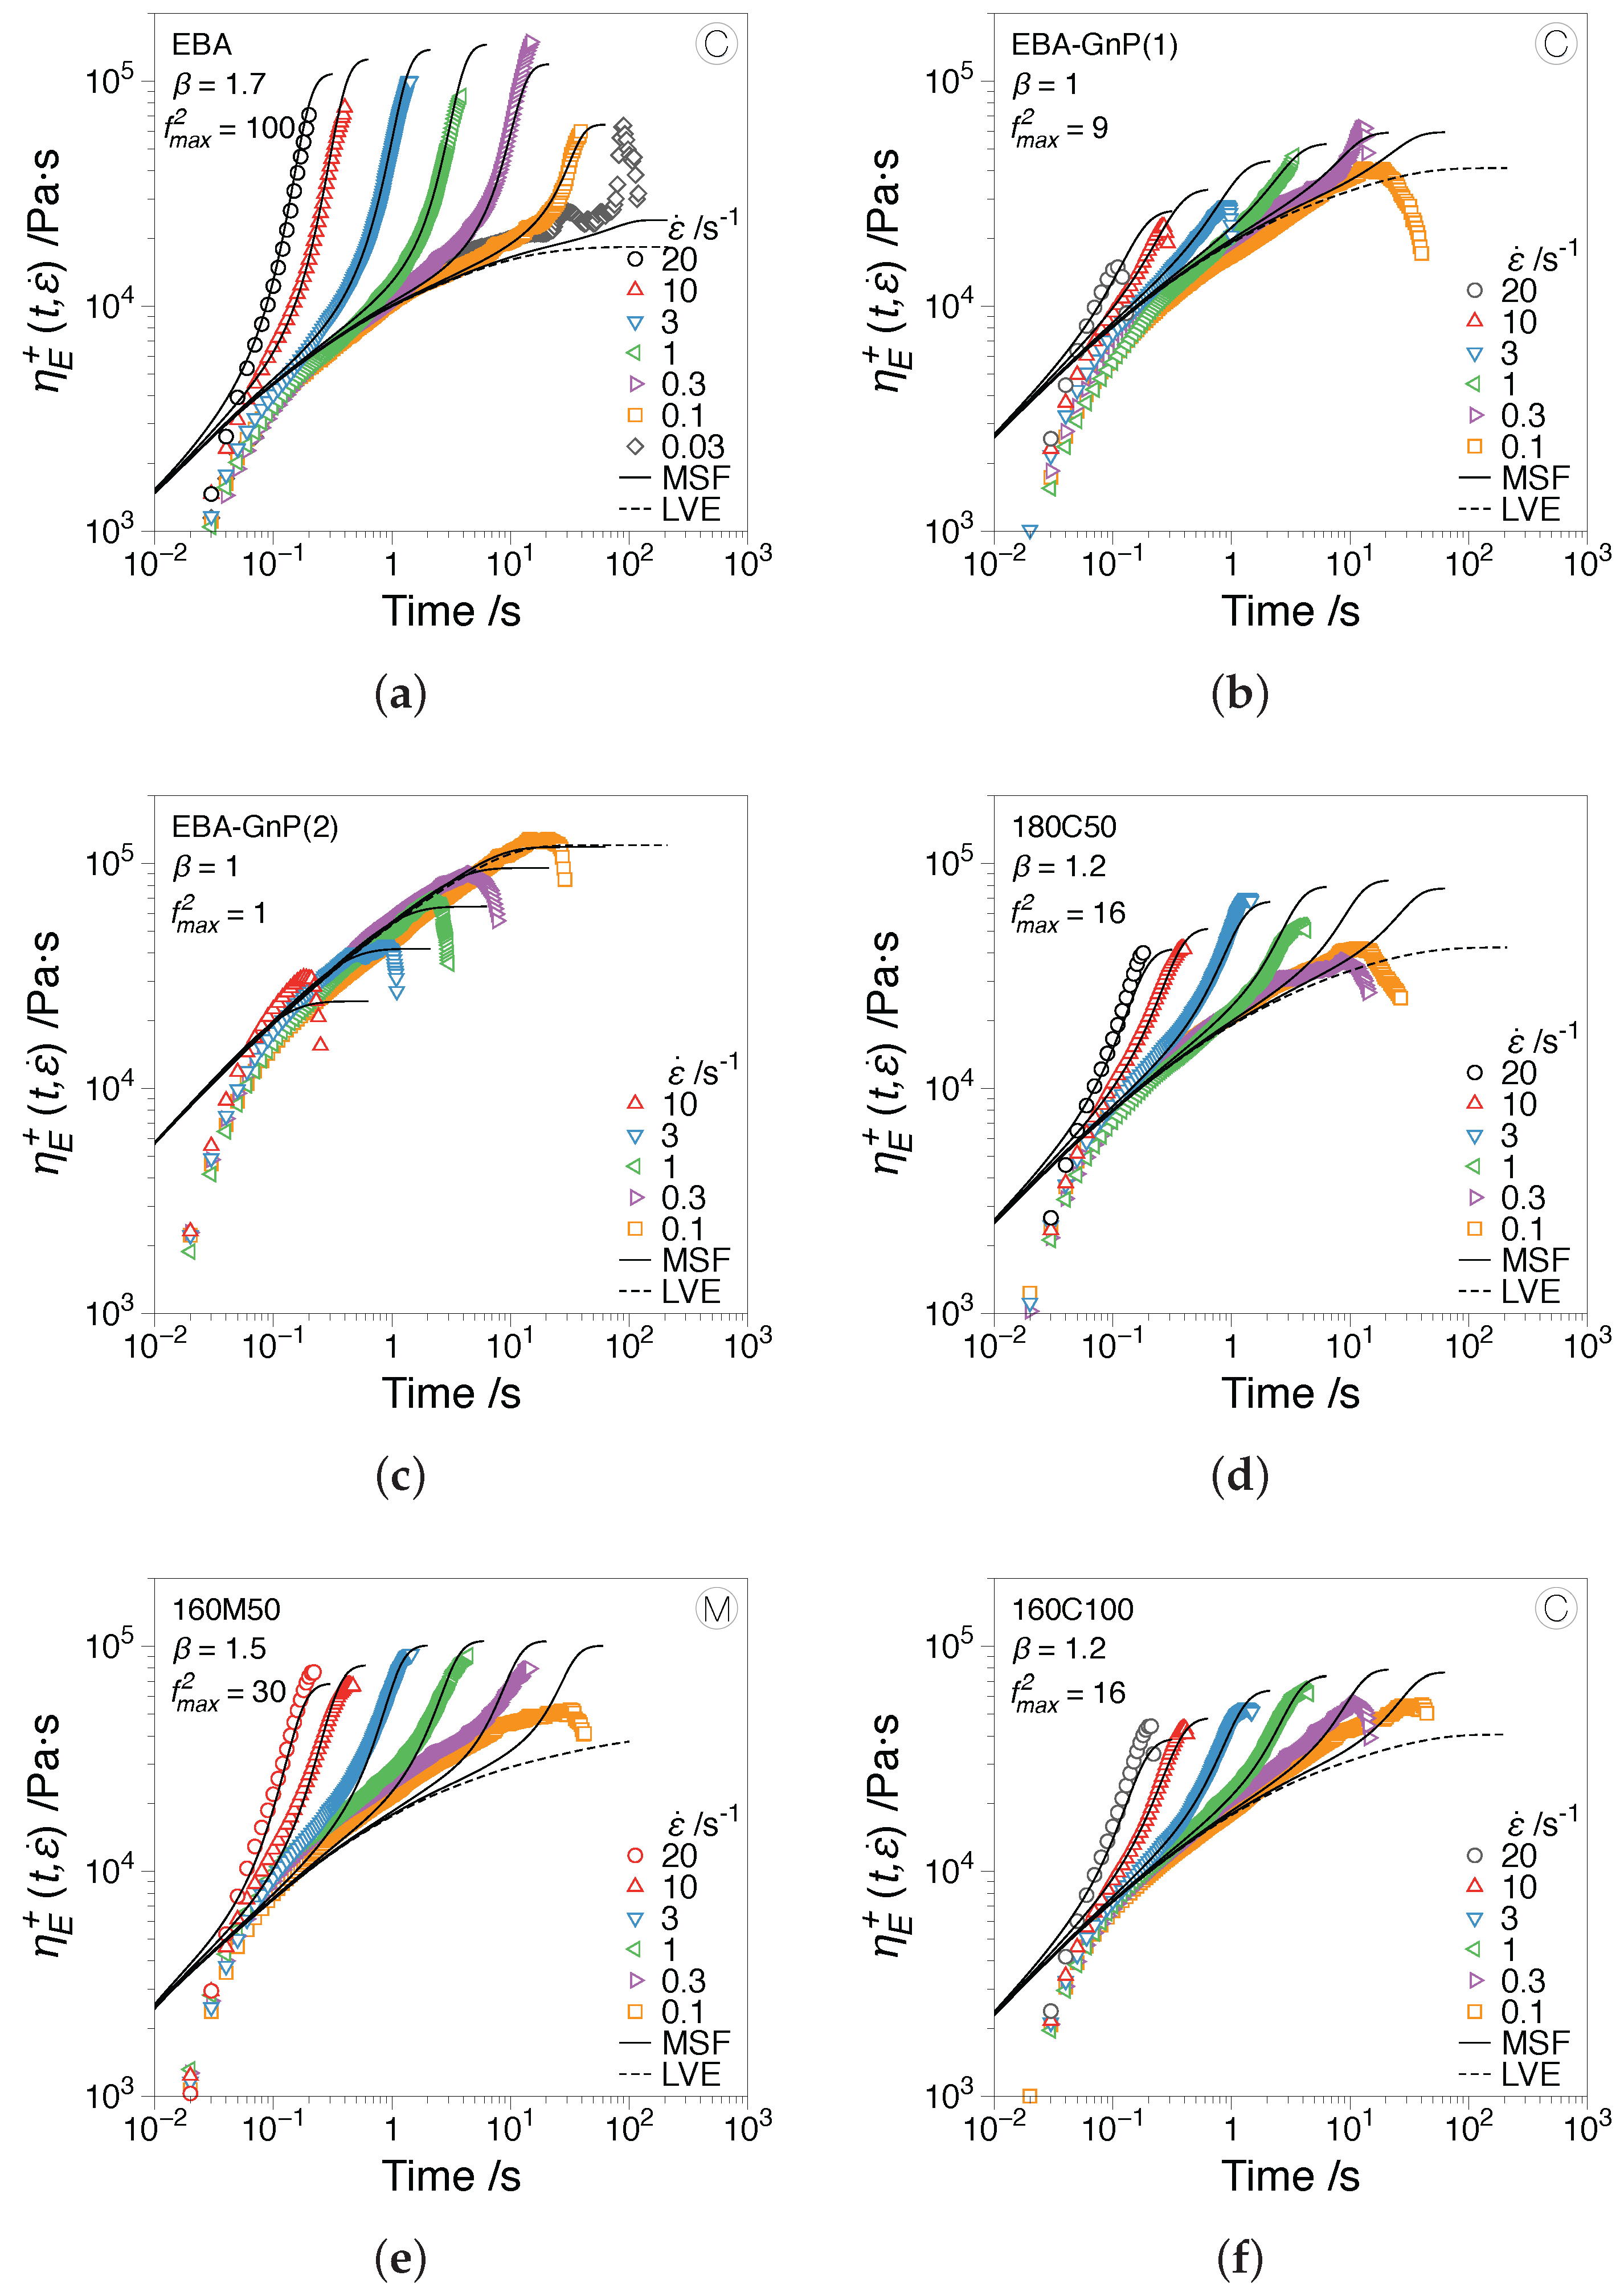
3.2. Extensional Rheology
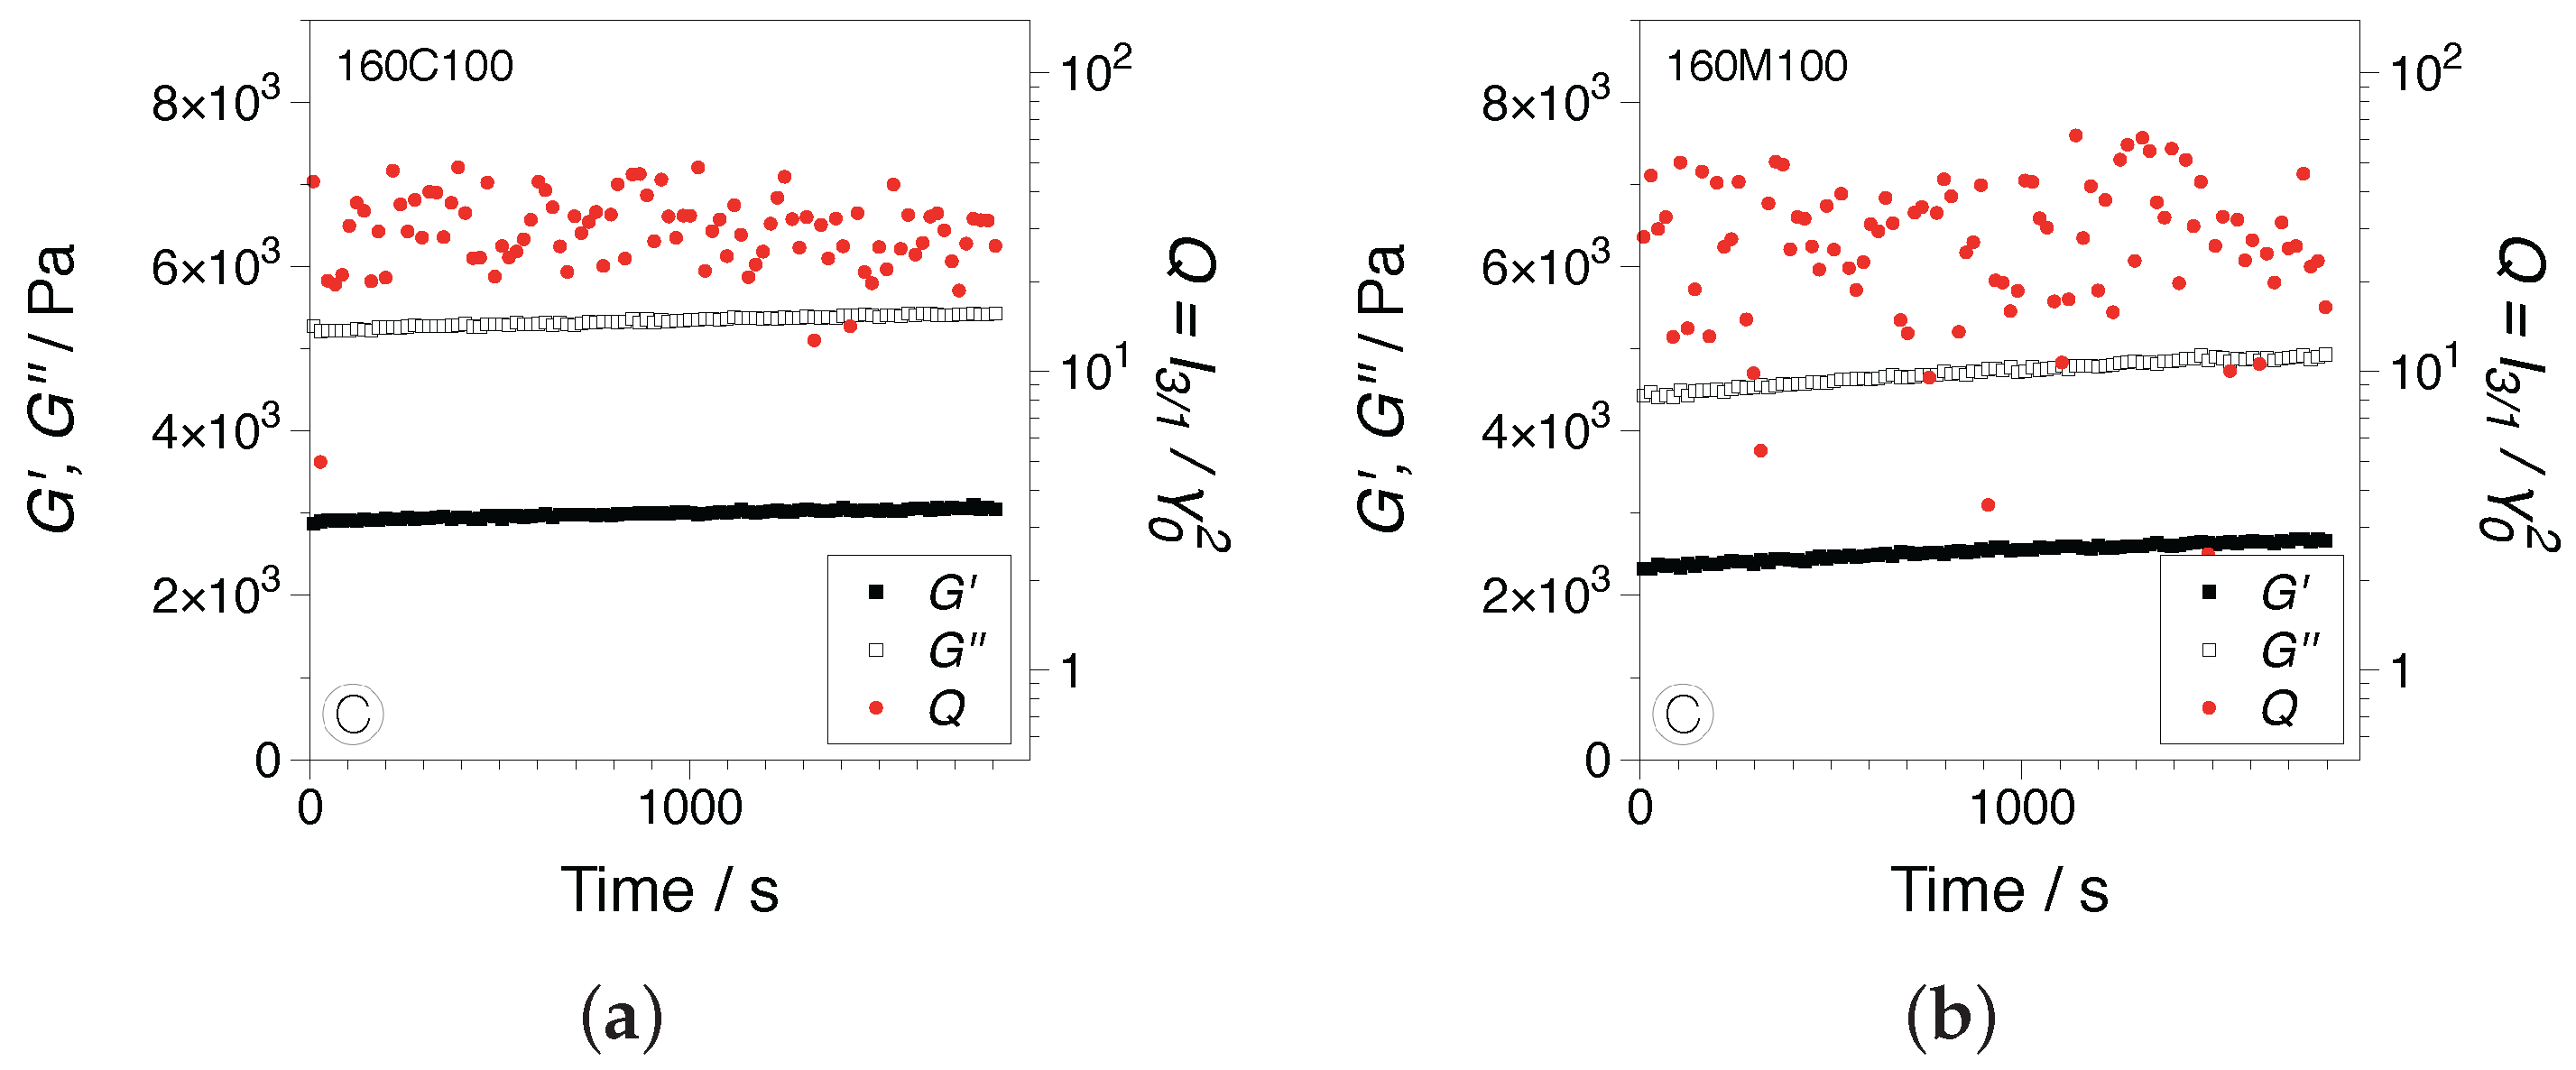
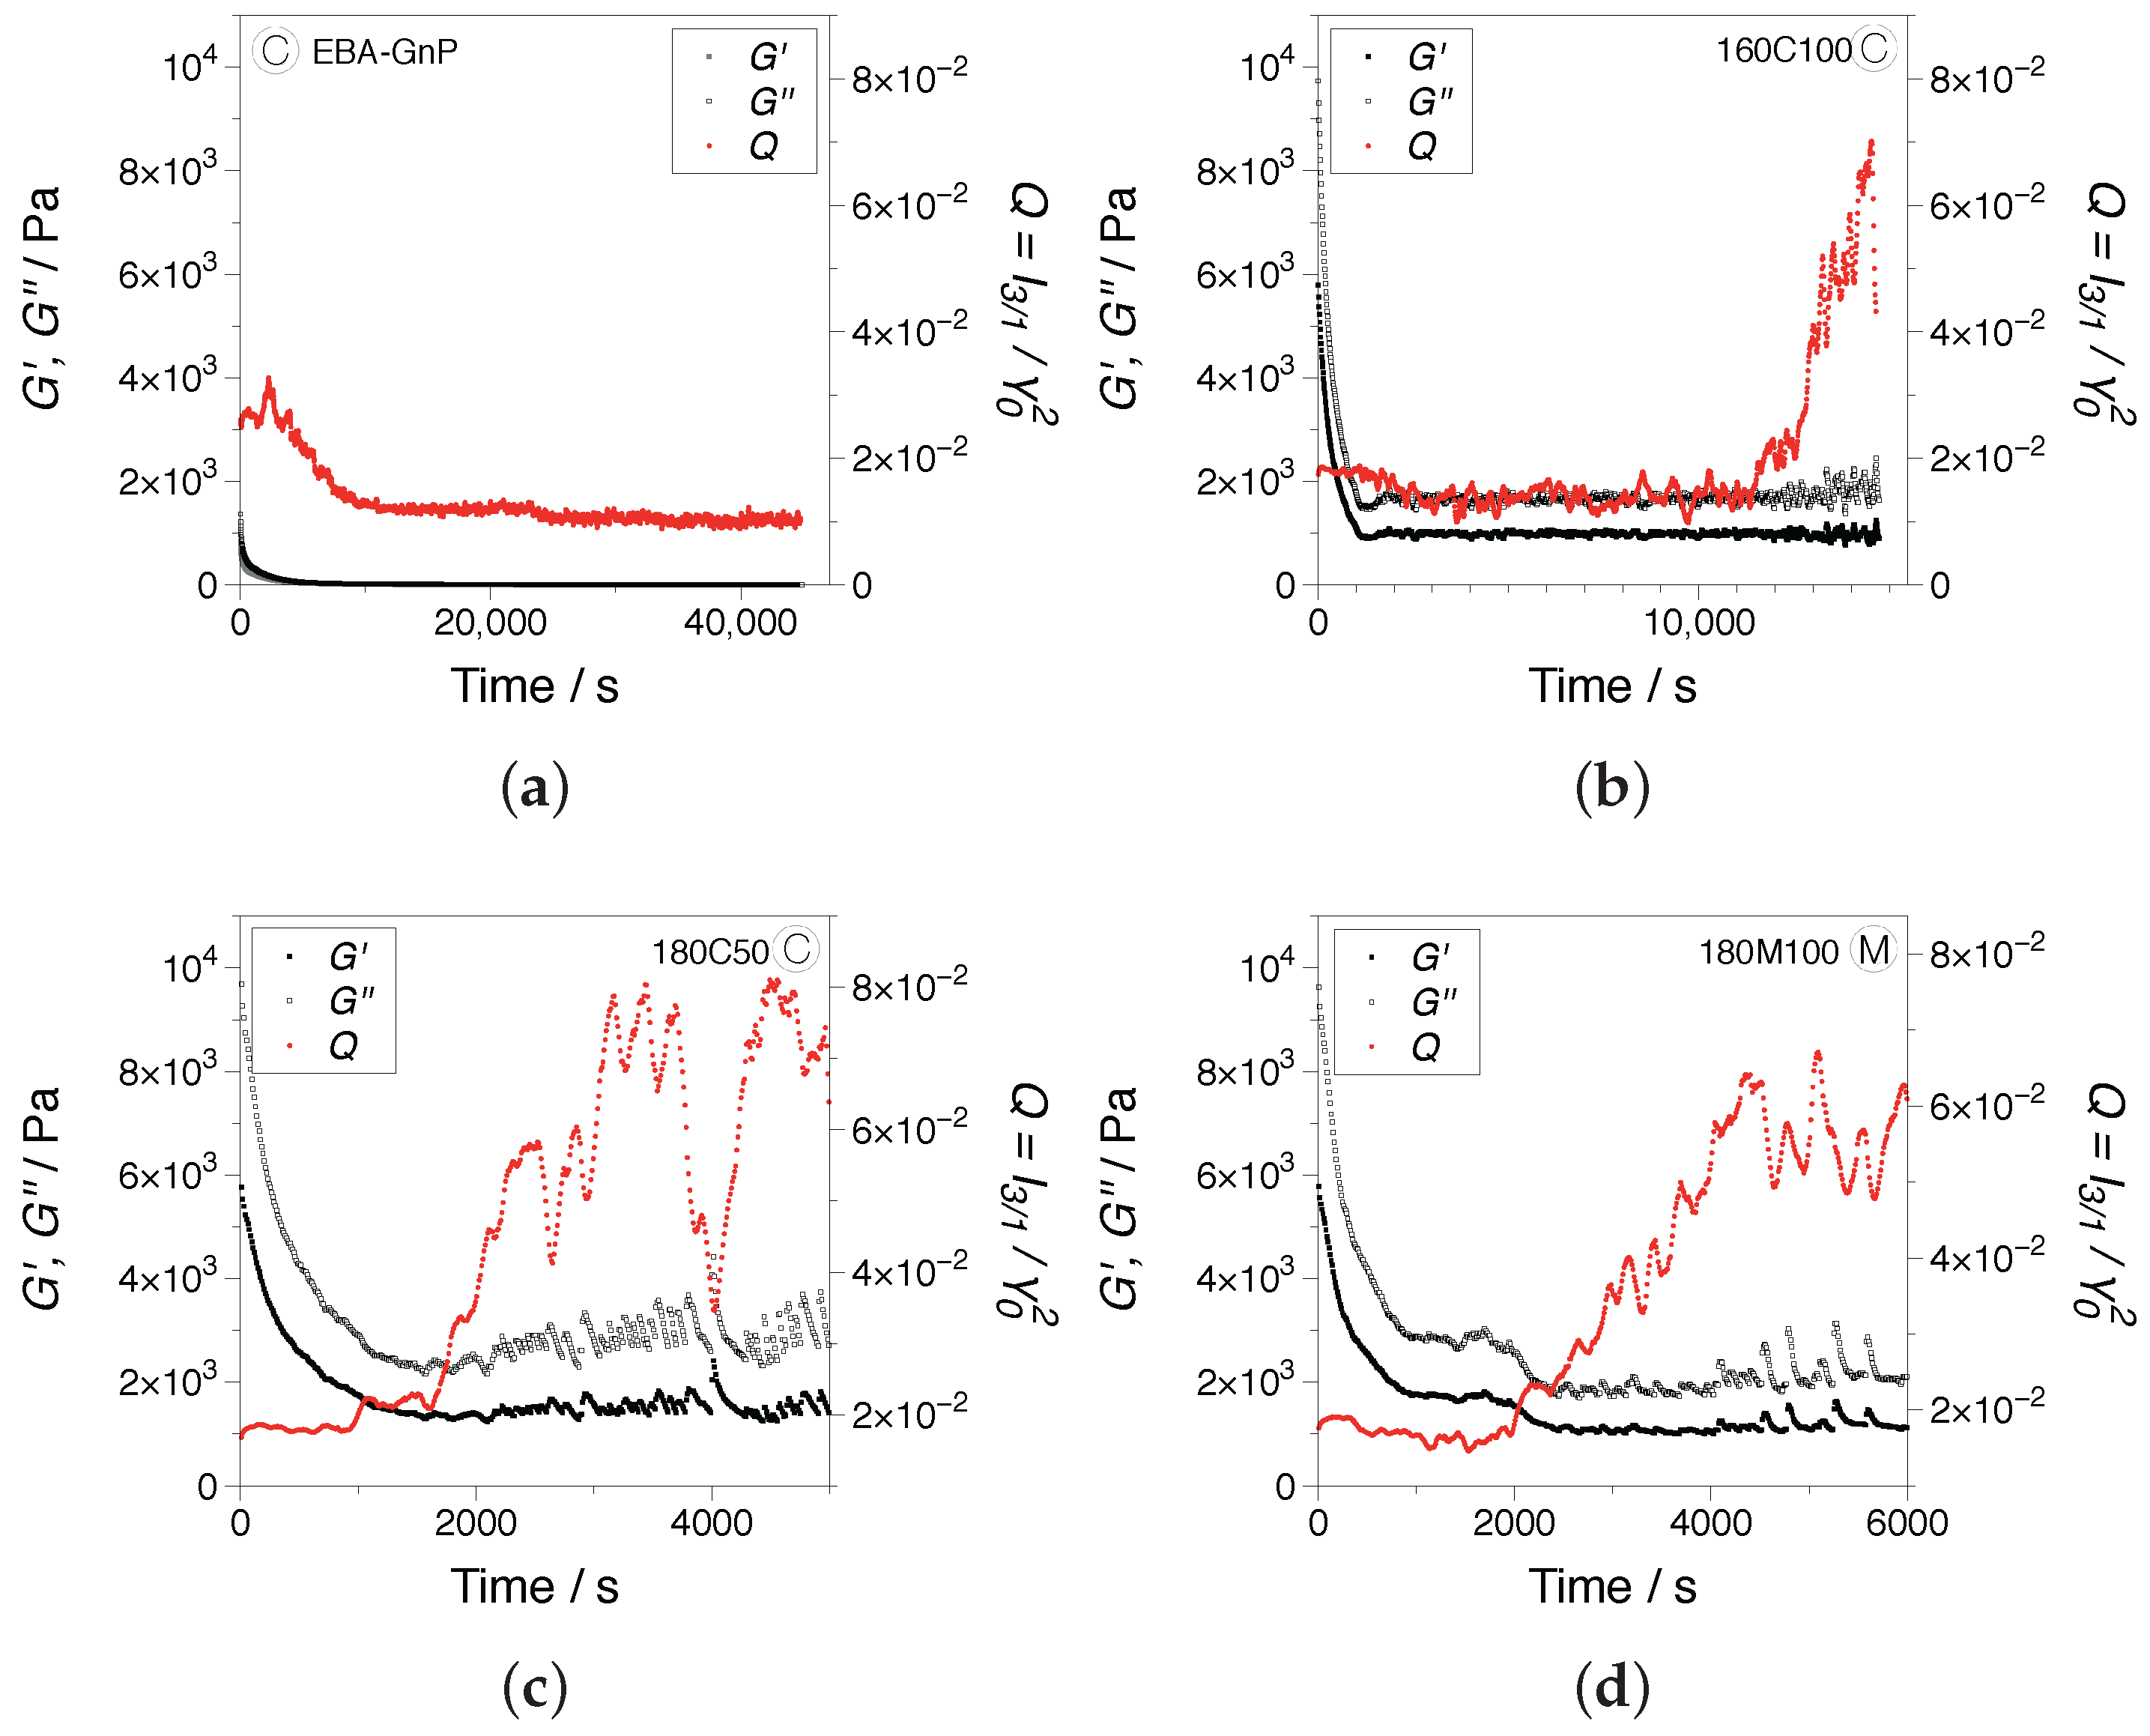
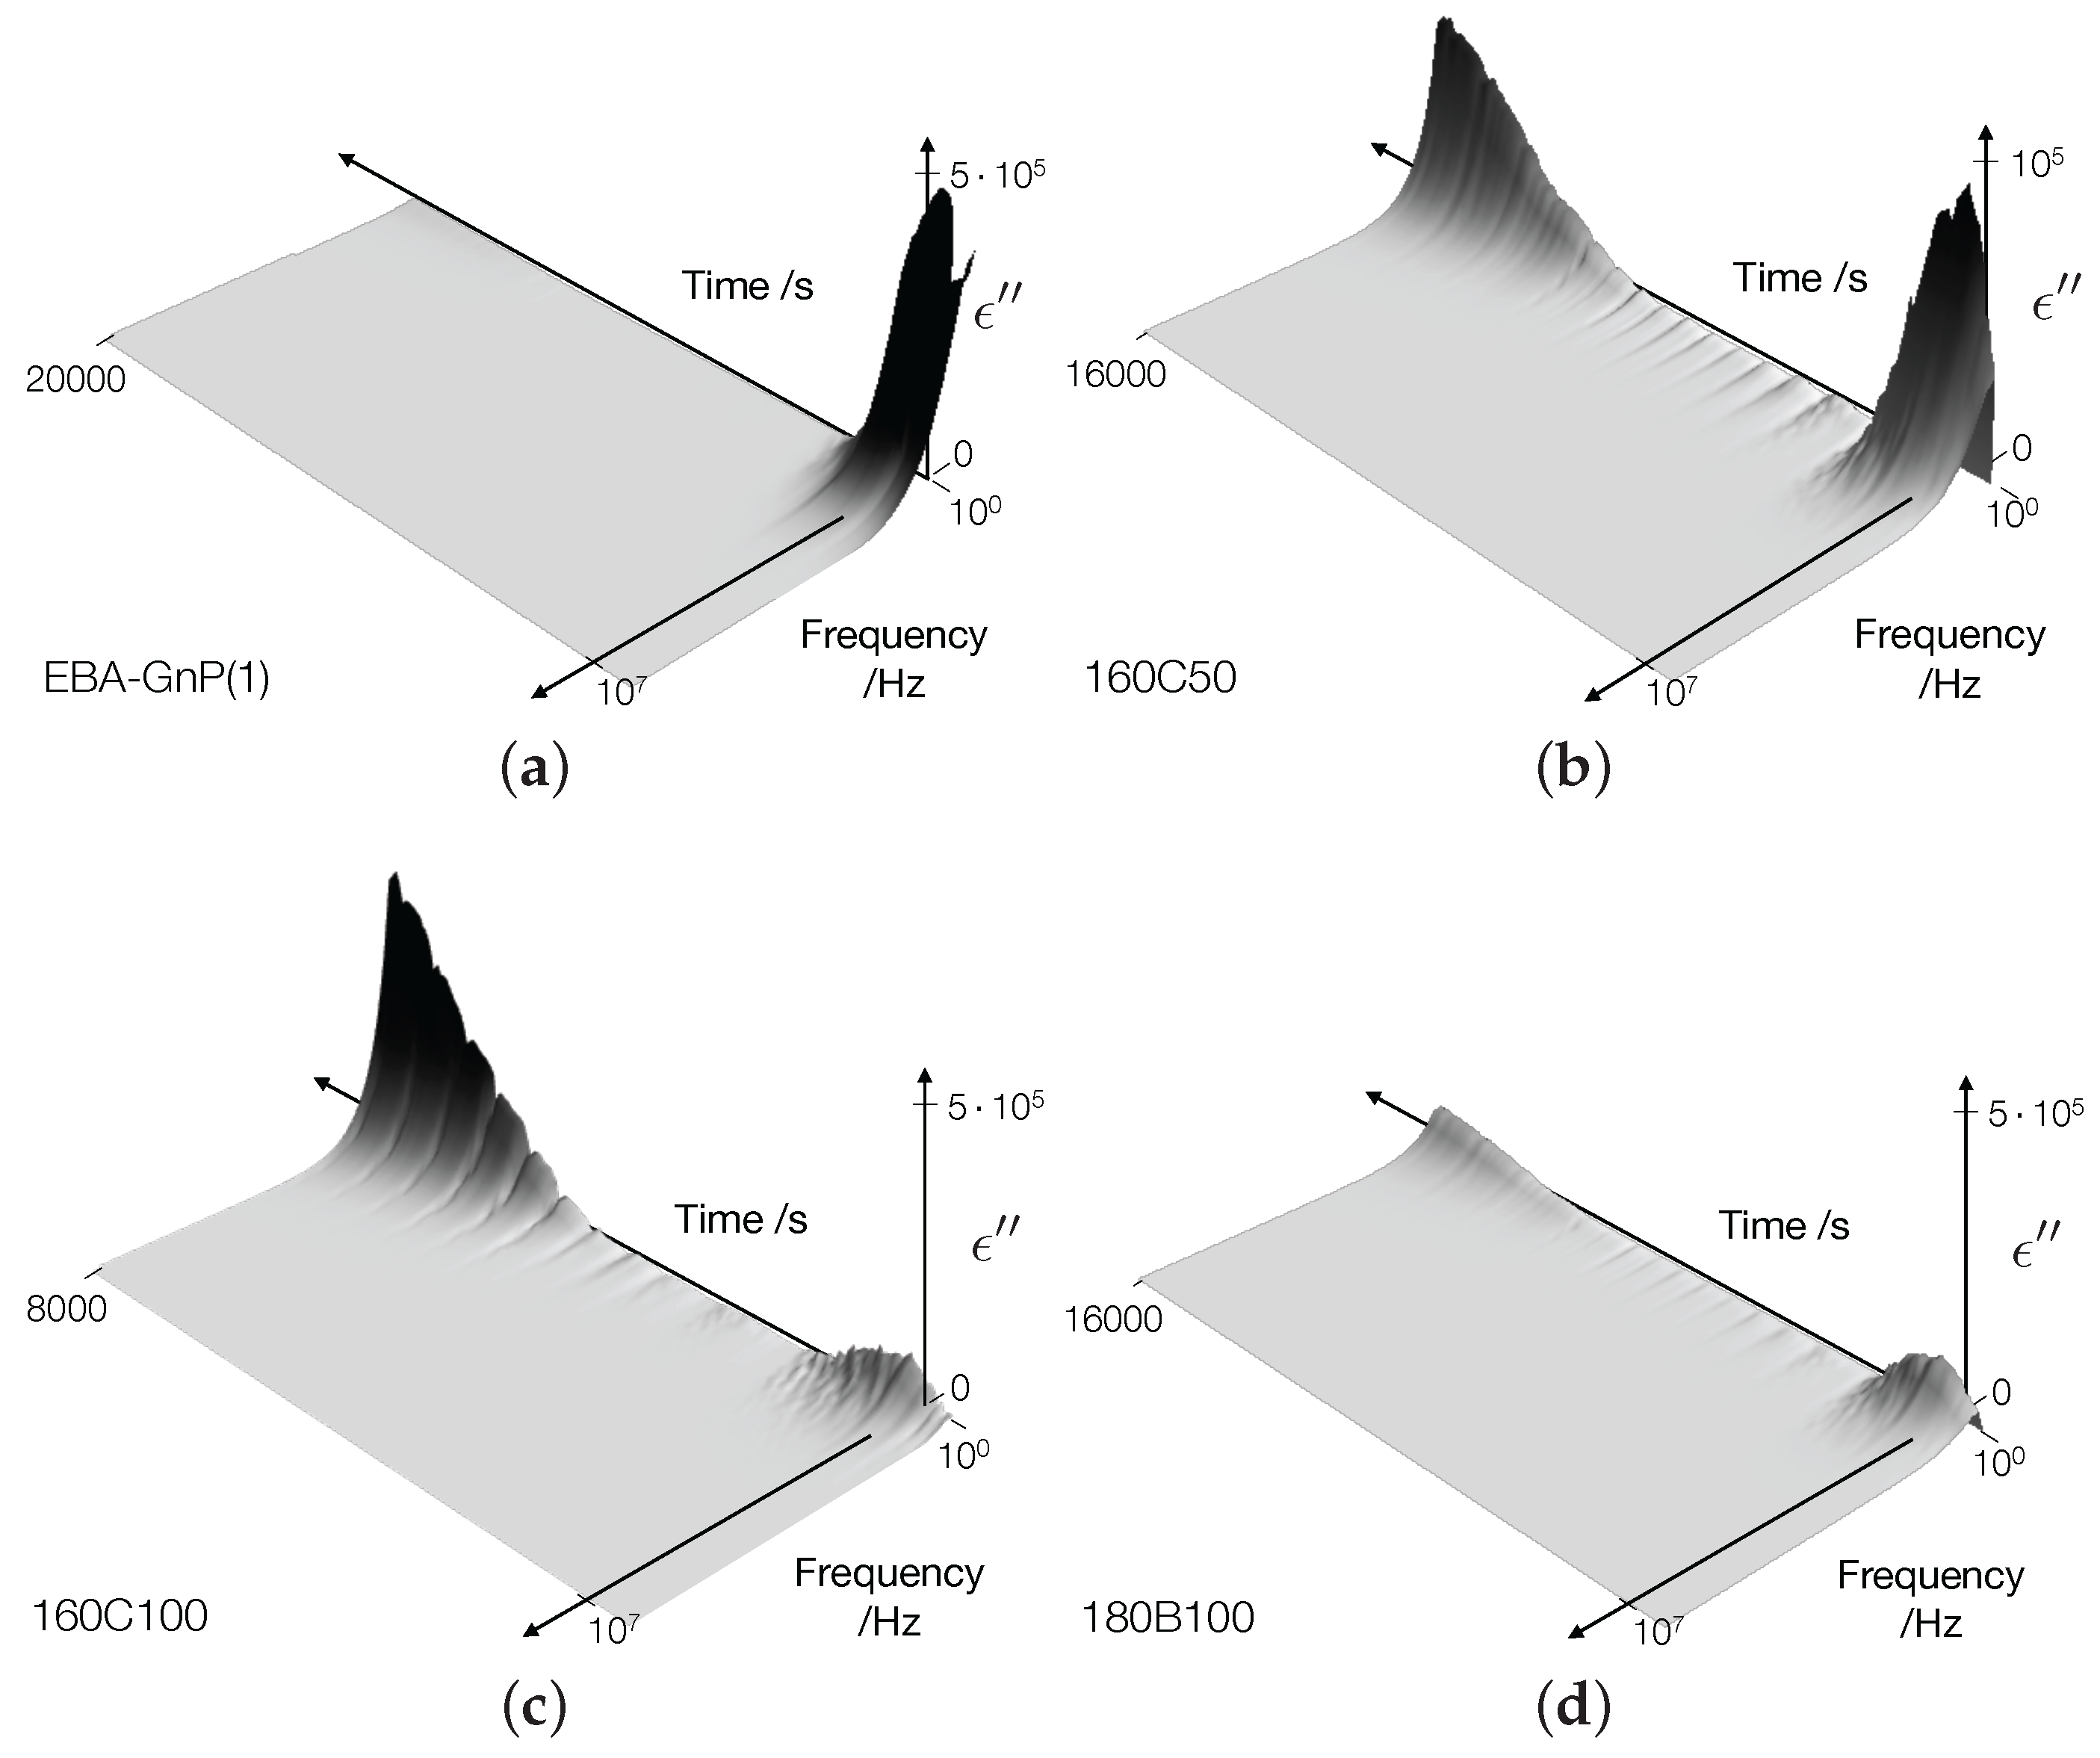
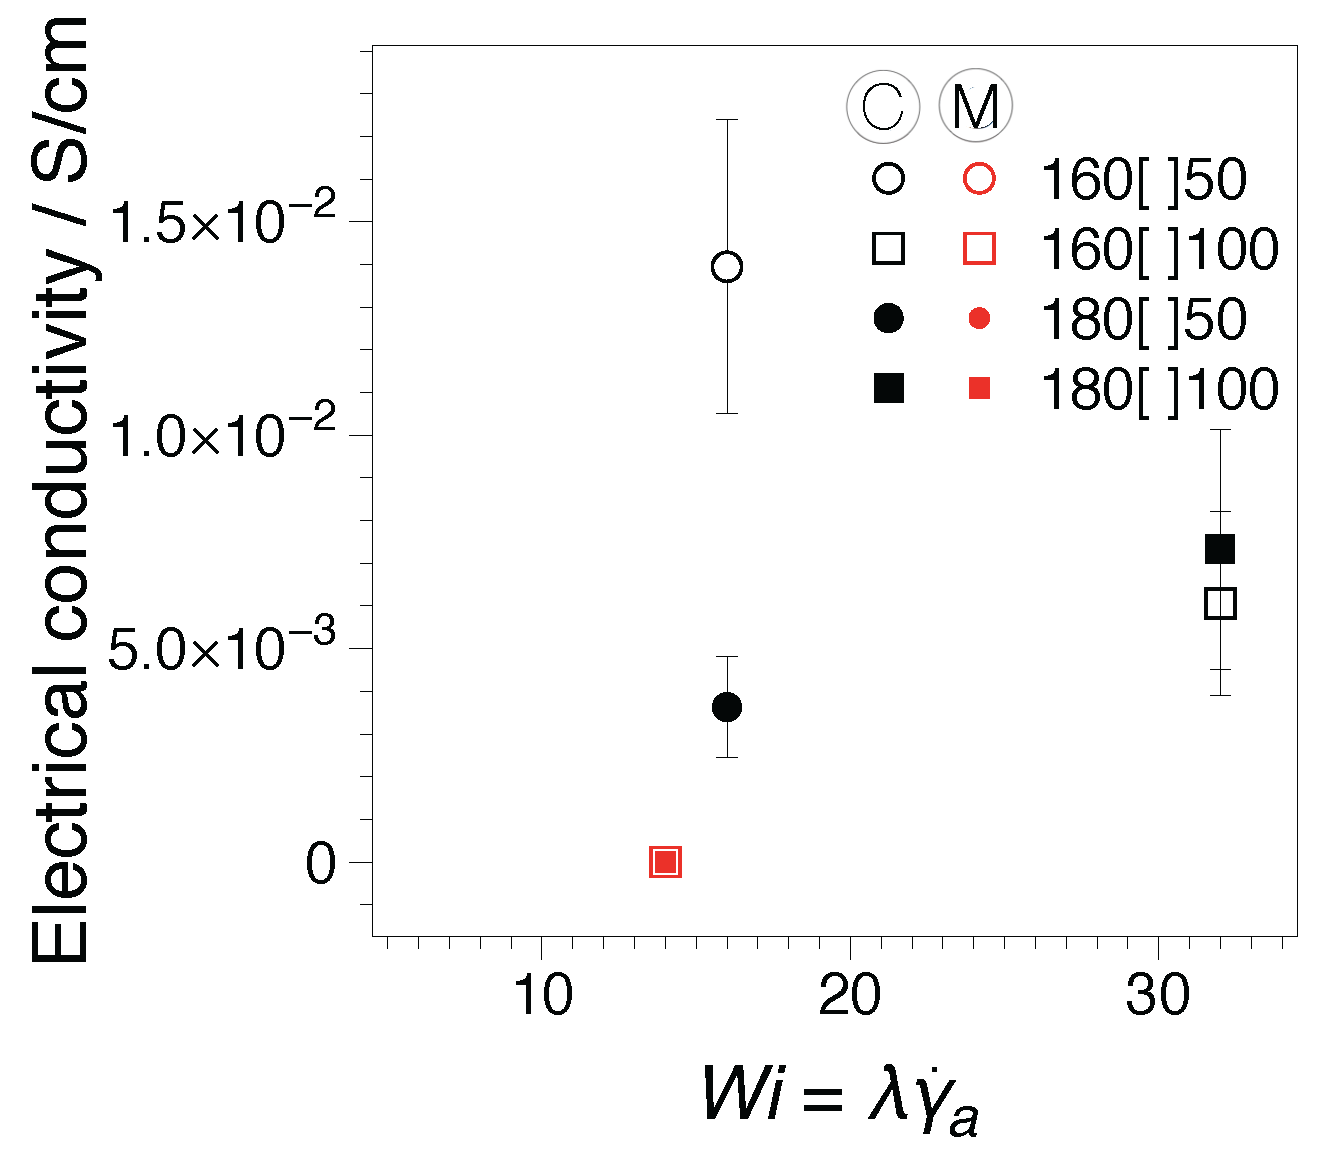
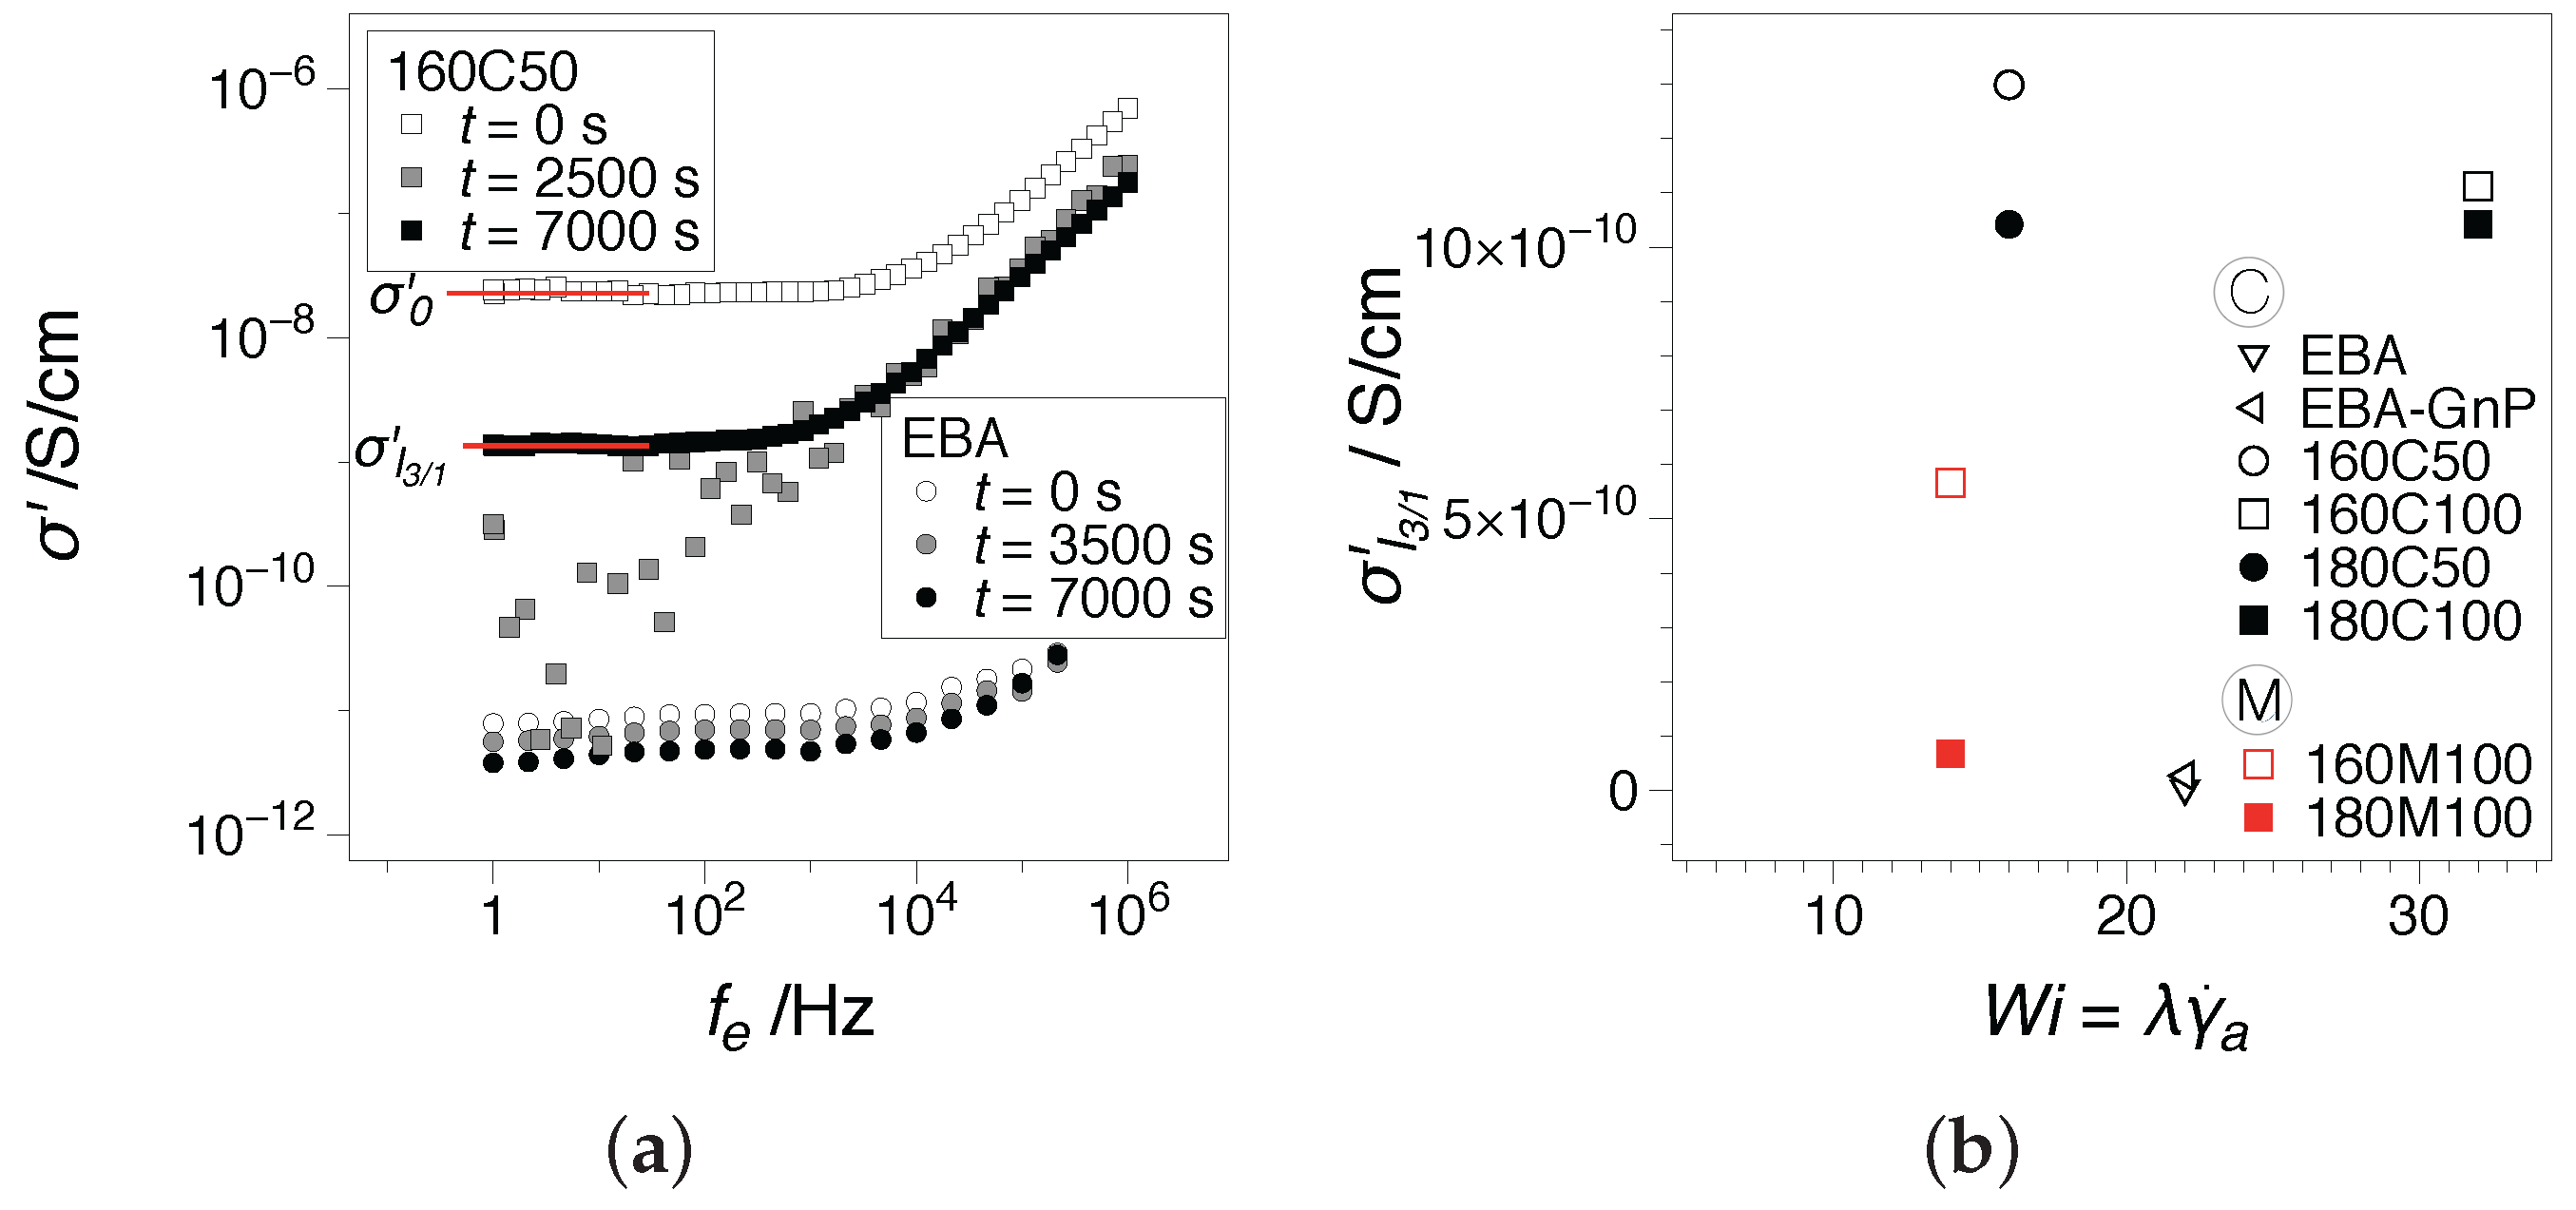
3.3. Time Dependence and Electrical Conductivity
4. Conclusions
Acknowledgments
Author Contributions
Conflicts of Interest
Abbreviations
| FT | Fourier-transform |
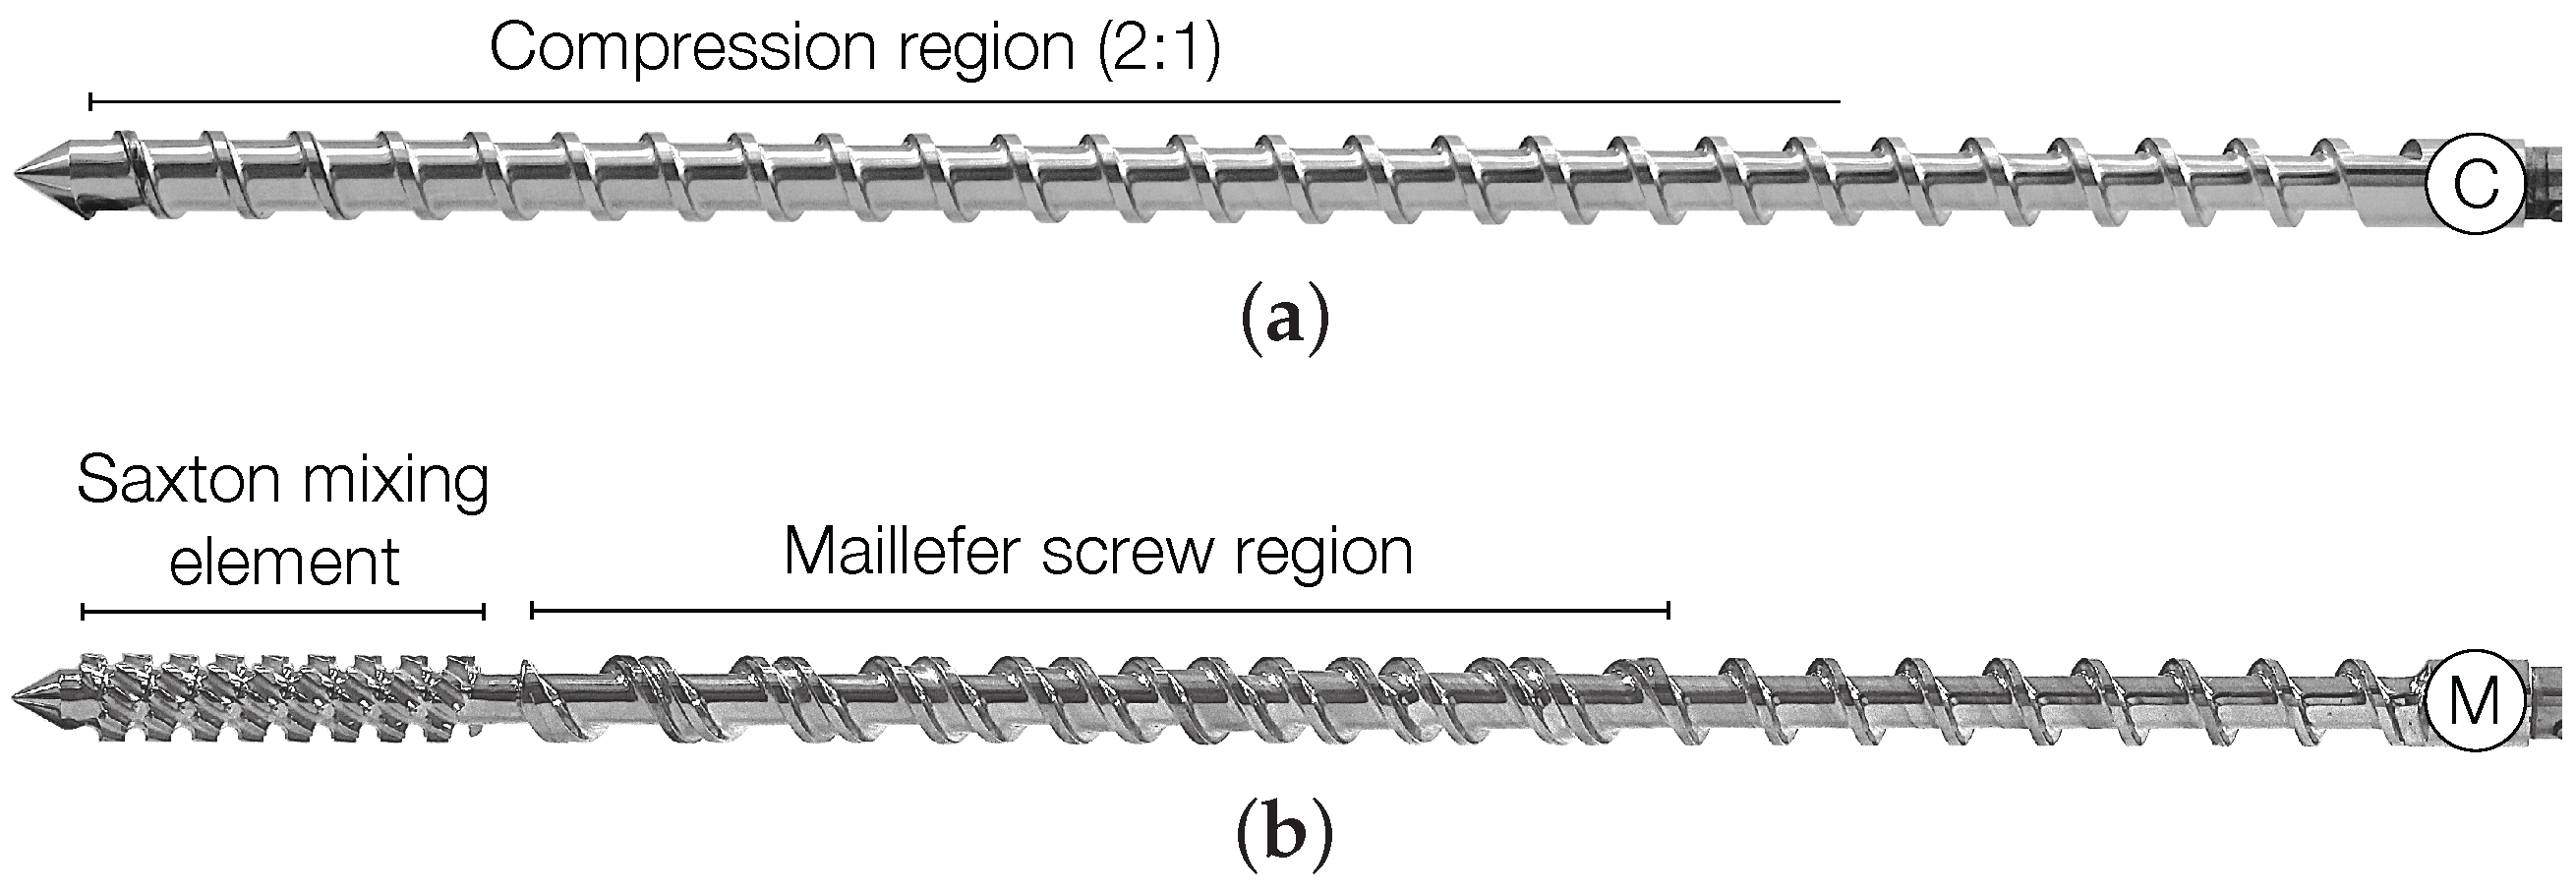
| C | compression screw (2:1) |
| CB | carbon black |
| DES | dielectric spectroscopy |
| EBA | ethylene-butyl acrylate |
| GnP | graphite nanoplatelets |
| LAOS | large amplitude oscillatory shear |
| MSF | molecular stress function |
| M | mixing screw (Maillefer + Saxton mixer) |
| MWCNT | multi-walled carbon nanotubes |
| OMMT | organomodified montmorillonite |
| PCC | precipitated calcium carbonate |
| PCL | polycaprolactone |
| PE | polyethylene |
| SAOS | small amplitude oscillatory shear |
| SWCNT | single-walled carbon nanotubes |
References
- Ferrari, A.C.; Bonaccorso, F.; Fal’ko, V.; Novoselov, K.S.; Roche, S.; Boggild, P.; Borini, S.; Koppens, F.H.L.; Palermo, V.; Pugno, N.; et al. Science and technology roadmap for graphene, related two-dimensional crystals, and hybrid systems. Nanoscale 2015, 7, 4598–4810. [Google Scholar] [CrossRef] [PubMed] [Green Version]
- Oxfall, H.; Ariu, G.; Gkourmpis, T.; Rychwalski, R.; Rigdahl, M. Effect of carbon black on electrical and rheological properties of graphite nanoplatelets/poly(ethylene-butyl acrylate) composites. Express Polym. Lett. 2015, 9, 66–76. [Google Scholar] [CrossRef] [Green Version]
- Arino, R.; Diez, E.A.; Rigdahl, M. Enhancing the electrical conductivity of carbon black/graphite nanoplatelets: Poly(ethylene-butyl acrylate) composites by melt extrusion. J. Appl. Polym. Sci. 2016, 133. [Google Scholar] [CrossRef]
- Induchoodan, G.; Kádár, R. Tailoring polymer nanocomposite microstructure by controlling orientation, dispersion and exfoliation of GnP in LDPE via extrusion flow. Trans. Nord. Rheol. Soc. 2016, 25, 187–191. [Google Scholar]
- Song, Y.; Zheng, Q. Concepts and conflicts in nanoparticles reinforcement to polymers beyond hydrodynamics. Prog. Mater. Sci. 2016, 84, 1–58. [Google Scholar] [CrossRef]
- Cassagnau, P. Linear viscoelasticity and dynamics of suspensions and molten polymers filled with nanoparticles of different aspect ratios. Polymer 2013, 54, 4762–4775. [Google Scholar] [CrossRef]
- Kim, H.; Abdala, A.A.; Macosko, C.W. Graphene/Polymer Nanocomposites. Macromolecules 2010, 43, 6515–6530. [Google Scholar] [CrossRef]
- Zhao, J.; Morgan, A.B.; Harris, J.D. Rheological characterization of polystyrene–clay nanocomposites to compare the degree of exfoliation and dispersion. Polymer 2005, 46, 8641–8660. [Google Scholar] [CrossRef]
- Wagener, R.; Reisinger, T.J. A rheological method to compare the degree of exfoliation of nanocomposites. Polymer 2003, 44, 7513–7518. [Google Scholar] [CrossRef]
- Aranguren, M.I.; Mora, E.; DeGroot, J.V.; Macosko, C.W. Effect of reinforcing fillers on the rheology of polymer melts. J. Rheol. 1992, 36, 1165–1182. [Google Scholar] [CrossRef]
- Hassanabadi, H.M.; Wilhelm, M.; Rodrigue, D. A rheological criterion to determine the percolation threshold in polymer nano-composites. Rheol. Acta 2014, 53, 869–882. [Google Scholar] [CrossRef]
- Hassanabadi, H.M.; Abbasi, M.; Wilhelm, M.; Rodrigue, D. Validity of the modified molecular stress function theory to predict the rheological properties of polymer nanocomposites. J. Rheol. 2013, 57, 881–899. [Google Scholar] [CrossRef]
- Leblanc, J.L.; Jäger, K.M. Investigating Nonlinear Viscoelastic Properties of Molten Carbon Black/Poly(ethylene-co-butyl acrylate) Composites, Using Fourier Transform Rheometry and Other Test Techniques. J. Appl. Polym. Sci. 2016, 101, 4071–4082. [Google Scholar] [CrossRef]
- Ahirwal, D.; Palza, H.; Schlatter, G.; Wilhelm, M. New way to characterize the percolation threshold of polyethylene and carbon nanotube polymer composites using Fourier transform (FT) rheology. Korea-Aust. Rheol. J. 2014, 26, 319–326. [Google Scholar] [CrossRef]
- Lim, H.T.; Ahn, K.H.; Hong, J.S.; Hyun, K. Nonlinear viscoelasticity of polymer nanocomposites under large amplitude oscillatory shear flow. J. Rheol. 2013, 57, 767–789. [Google Scholar] [CrossRef]
- Nelson, J.K.; Hu, Y. Nanocomposite dielectrics—Properties and implications. J. Phys. D 2005, 38, 213–222. [Google Scholar] [CrossRef]
- Jeong, K.U.; Lim, J.Y.; Lee, J.Y.; Kang, S.L.; Nah, C. Polymer nanocomposites reinforced with multi-walled carbon nanotubes for semiconducting layers of high-voltage power cables. Polym. Int. 2010, 59, 100–106. [Google Scholar] [CrossRef]
- Oxfall, H. Manufacturing and Characterization of Filled Polymeric Systems. Ph.D. Thesis, Chalmers University of Technology, Gothenburg, Sweden, 2013. [Google Scholar]
- Sinha Ray, S.; Okamoto, M. Polymer/layered silicate nanocomposites: A review from preparation to processing. Prog. Polym. Sci. 2003, 28, 1539–1641. [Google Scholar] [CrossRef]
- Kremer, F.; Schönhals, A. (Eds.) Broadband Dielectric Spectroscopy; Springer: Berlin/Heidelberg, Germany, 2003.
- Potschke, P.; Abdel-Goad, M.; Alig, I.; Dudkin, S.; Lellinger, D. Rheological and dielectrical characterization of melt mixed polycarbonate-multiwalled carbon nanotube composites. Polymer 2004, 45, 8863–8870. [Google Scholar] [CrossRef]
- Alig, I.; Skipa, T.; Lellinger, D.; Potschke, P. Destruction and formation of a carbon nanotube network in polymer melts: Rheology and conductivity spectroscopy. Polymer 2008, 49, 3524–3532. [Google Scholar] [CrossRef]
- Moreira, L.; Fulchiron, R.; Seytre, G.; Dubois, P.; Cassagnau, P. Aggregation of Carbon Nanotubes in Semidilute Suspension. Macromolecules 2010, 43, 1467–1472. [Google Scholar] [CrossRef]
- Bharati, A.; Wubbenhorst, M.; Moldenaers, P.; Cardinaels, R. Effect of Compatibilization on Interfacial Polarization and Intrinsic Length Scales in Biphasic Polymer Blends of PαMSAN and PMMA: A Combined Experimental and Modeling Dielectric Study. Macromolecules 2016, 49, 1464–1478. [Google Scholar] [CrossRef]
- Figuli, R.; Schwab, L.; Lacayo-Pineda, J.; Deckmann, H.; Wilhelm, M. Combined Dielectric (DEA) and Dynamic Mechanical Thermal Analysis (DMTA) in Compression Mode; Kautschuk Gummi Kunststoffe (KGK): Leverkusen, Germany, 2016; pp. 30–35. [Google Scholar]
- Costa, L.; Achour, M.; Graça, M.; Hasnaoui, M.E.; Outzourhit, A.; Oueriagli, A. Dielectric properties of the ethylene butylacrylate/carbon black nanocomposites. J. Non-Cryst. Solids 2010, 356, 270–274. [Google Scholar] [CrossRef]
- Kádár, R.; Naue, I.F.; Wilhelm, M. First normal stress difference and in-situ spectral dynamics in a high sensitivity extrusion die for capillary rheometry via the ‘hole effect’. Polymer 2016, 104, 193–203. [Google Scholar] [CrossRef]
- Merger, D.; Wilhelm, M. Intrinsic nonlinearity from LAOStrain—Experiments on various strain- and stress-controlled rheometers: a quantitative comparison. Rheol. Acta 2014, 53, 621–634. [Google Scholar] [CrossRef]
- Hyun, K.; Wilhelm, M.; Klein, C.; Cho, K.S.; Nam, J.; Ahn, K.; Lee, S.; Ewoldt, R.; McKinley, G. A review of nonlinear oscillatory shear tests: Analysis and application of large amplitude oscillatory shear (LAOS). Prog. Polym. Sci. 2011, 36, 1697–1753. [Google Scholar] [CrossRef]
- Walters, K. Rheometry; Chapman and Hall: London, UK, 1975. [Google Scholar]
- Calin, A.; Wilhelm, M.; Balan, C. Determination of the non-linear parameter (mobility factor) of the Giesekus constitutive model using {LAOS} procedure. J. Non-Newton. Fluid Mech. 2010, 165, 1564–1577. [Google Scholar] [CrossRef]
- Cziep, M.A.; Abbasi, M.; Heck, M.; Arens, L.; Wilhelm, M. Effect of Molecular Weight, Polydispersity, and Monomer of Linear Homopolymer Melts on the Intrinsic Mechanical Nonlinearity (ω) in MAOS. Macromolecules 2016, 49, 3566–3579. [Google Scholar] [CrossRef]
- Hyun, K.; Wilhelm, M. Establishing a New Mechanical Nonlinear Coefficient Q from FT-Rheology: First Investigation of Entangled Linear and Comb Polymer Model Systems. Macromolecules 2009, 42, 411–422. [Google Scholar] [CrossRef]
- Ewoldt, R.H.; Hosoi, A.E.; McKinley, G.H. New measures for characterizing nonlinear viscoelasticity in large amplitude oscillatory shear. J. Rheol. 2008, 52, 1427–1458. [Google Scholar] [CrossRef]
- Rolón-Garrido, V.H. The molecular stress function (MSF) model in rheology. Rheol. Acta 2014, 53, 663–700. [Google Scholar] [CrossRef]
- Abbasi, M.; Golshan Ebrahimi, N.; Nadali, M.; Khabazian Esfahani, M. Elongational viscosity of LDPE with various structures: Employing a new evolution equation in MSF theory. Rheol. Acta 2012, 51, 163–177. [Google Scholar] [CrossRef]
- Abbasi, M.; Golshan Ebrahimi, N.; Wilhelm, M. Investigation of the rheological behavior of industrial tubular and autoclave LDPEs under SAOS, LAOS, transient shear, and elongational flows compared with predictions from the MSF theory. J. Rheol. 2013, 57, 1693–1714. [Google Scholar] [CrossRef]
- Polizos, G.; Tuncer, E.; Tomer, V.; Sauers, I.; Randall, C.; Manias, E. Dielectric Spectroscopy of Polymer-Based Nanocomposite Dielectrics with Tailored Interfaces and Structured Spatial Distribution of Fillers. In Nanoscale Spectroscopy with Applications; CRC Press: Boca Raton, FL, USA, 2013. [Google Scholar]
- Meins, T.; Hyun, K.; Ratzsch, K.; Friedrich, C.; Struth, B.; Wilhelm, M. Combined methods in Rheology: Rheo-SAXS, Rheo-NMR and Rheo-Dielectric to bridge length and time scales. Annu. Trans. Nord. Rheol. Soc. 2011, 19, 201–206. [Google Scholar]
- Meins, T.; Dingenouts, N.; Kübel, J.; Wilhelm, M. In Situ Rheodielectric, ex Situ 2D-SAXS, and Fourier Transform Rheology Investigations of the Shear-Induced Alignment of Poly(styrene-b-1,4-isoprene) Diblock Copolymer Melts. Macromolecules 2012, 45, 7206–7219. [Google Scholar] [CrossRef]
- Hyun, K.; Höfl, S.; Kahle, S.; Wilhelm, M. Polymer motion as detected via dielectric spectra of 1,4-cis-polyisoprene under large amplitude oscillatory shear (LAOS). J. Non-Newton. Fluid Mech. 2009, 160, 93–103. [Google Scholar] [CrossRef]
- Rolón-Garrido, V.; Wagner, M. The MSF model: Relation of nonlinear parameters to molecular structure of long-chain branched polymer melts. Rheol. Acta 2007, 46, 583–593. [Google Scholar] [CrossRef]
- Chan, Y.; White, J.L.; Oyanagi, Y. A Fundamental Study of the Rheological Properties of Glass-Fiber-Reinforced Polyethylene and Polystyrene Melts. J. Rheol. 1978, 22, 507–524. [Google Scholar] [CrossRef]
- Takahashi, T.; Wu, W.; Toda, H.; Takimoto, J.I.; Akatsuka, T.; Koyama, K. Elongational viscosity of ABS polymer melts with soft or hard butadiene particles. J. Non-Newton. Fluid Mech. 1997, 68, 259–269. [Google Scholar] [CrossRef]
- Li, L.; Masuda, T.; Takahashi, M. Elongational flow behavior of ABS polymer melts. J. Rheol. 1990, 34, 103–116. [Google Scholar] [CrossRef]
- Schopp, S.; Thomann, R.; Ratzsch, K.F.; Kerling, S.; Altstädt, V.; Mülhaupt, R. Functionalized Graphene and Carbon Materials as Components of Styrene-Butadiene Rubber Nanocomposites Prepared by Aqueous Dispersion Blending. Macromol. Mater. Eng. 2014, 299, 319–329. [Google Scholar] [CrossRef]
- Heaney, M.B. Electrical Measurement, Signal Processing, and Displays; CRC Press: Boca Raton, FL, USA, 2003; Chapter 7. [Google Scholar]


| Sample | CB/wt % | GnP/wt % | Screw Type | /°C | n/ | / | / | |
|---|---|---|---|---|---|---|---|---|
| EBA | - | - | C | 160 | 100 | 1080 | 0.02 | 22 |
| GnP(1) | - | 15 (7 vol %) | C | 160 | 50 | 540 | 0.04 | 22 |
| CB + GnP = 5 vol % | ||||||||
| 160C50 | 20 | 80 | C | 160 | 50 | 540 | 0.03 | 16 |
| 160C100 | 20 | 80 | C | 160 | 100 | 1080 | 0.03 | 32 |
| 180C50 | 20 | 80 | C | 180 | 50 | 540 | 0.03 | 16 |
| 180C100 | 20 | 80 | C | 180 | 100 | 1080 | 0.03 | 32 |
| 160M100 | 20 | 80 | M | 160 | 100 | 480 | 0.03 | 14 |
| 180M100 | 20 | 80 | M | 180 | 100 | 480 | 0.03 | 14 |
© 2017 by the authors. Licensee MDPI, Basel, Switzerland. This article is an open access article distributed under the terms and conditions of the Creative Commons Attribution (CC BY) license ( http://creativecommons.org/licenses/by/4.0/).
Share and Cite
Kádár, R.; Abbasi, M.; Figuli, R.; Rigdahl, M.; Wilhelm, M. Linear and Nonlinear Rheology Combined with Dielectric Spectroscopy of Hybrid Polymer Nanocomposites for Semiconductive Applications. Nanomaterials 2017, 7, 23. https://doi.org/10.3390/nano7020023
Kádár R, Abbasi M, Figuli R, Rigdahl M, Wilhelm M. Linear and Nonlinear Rheology Combined with Dielectric Spectroscopy of Hybrid Polymer Nanocomposites for Semiconductive Applications. Nanomaterials. 2017; 7(2):23. https://doi.org/10.3390/nano7020023
Chicago/Turabian StyleKádár, Roland, Mahdi Abbasi, Roxana Figuli, Mikael Rigdahl, and Manfred Wilhelm. 2017. "Linear and Nonlinear Rheology Combined with Dielectric Spectroscopy of Hybrid Polymer Nanocomposites for Semiconductive Applications" Nanomaterials 7, no. 2: 23. https://doi.org/10.3390/nano7020023