
Preparation and Characterization of Cellulose Nanocrystals from the Bio-ethanol Residuals

 and
and
Abstract
:1. Introduction
2. Results and Discussion
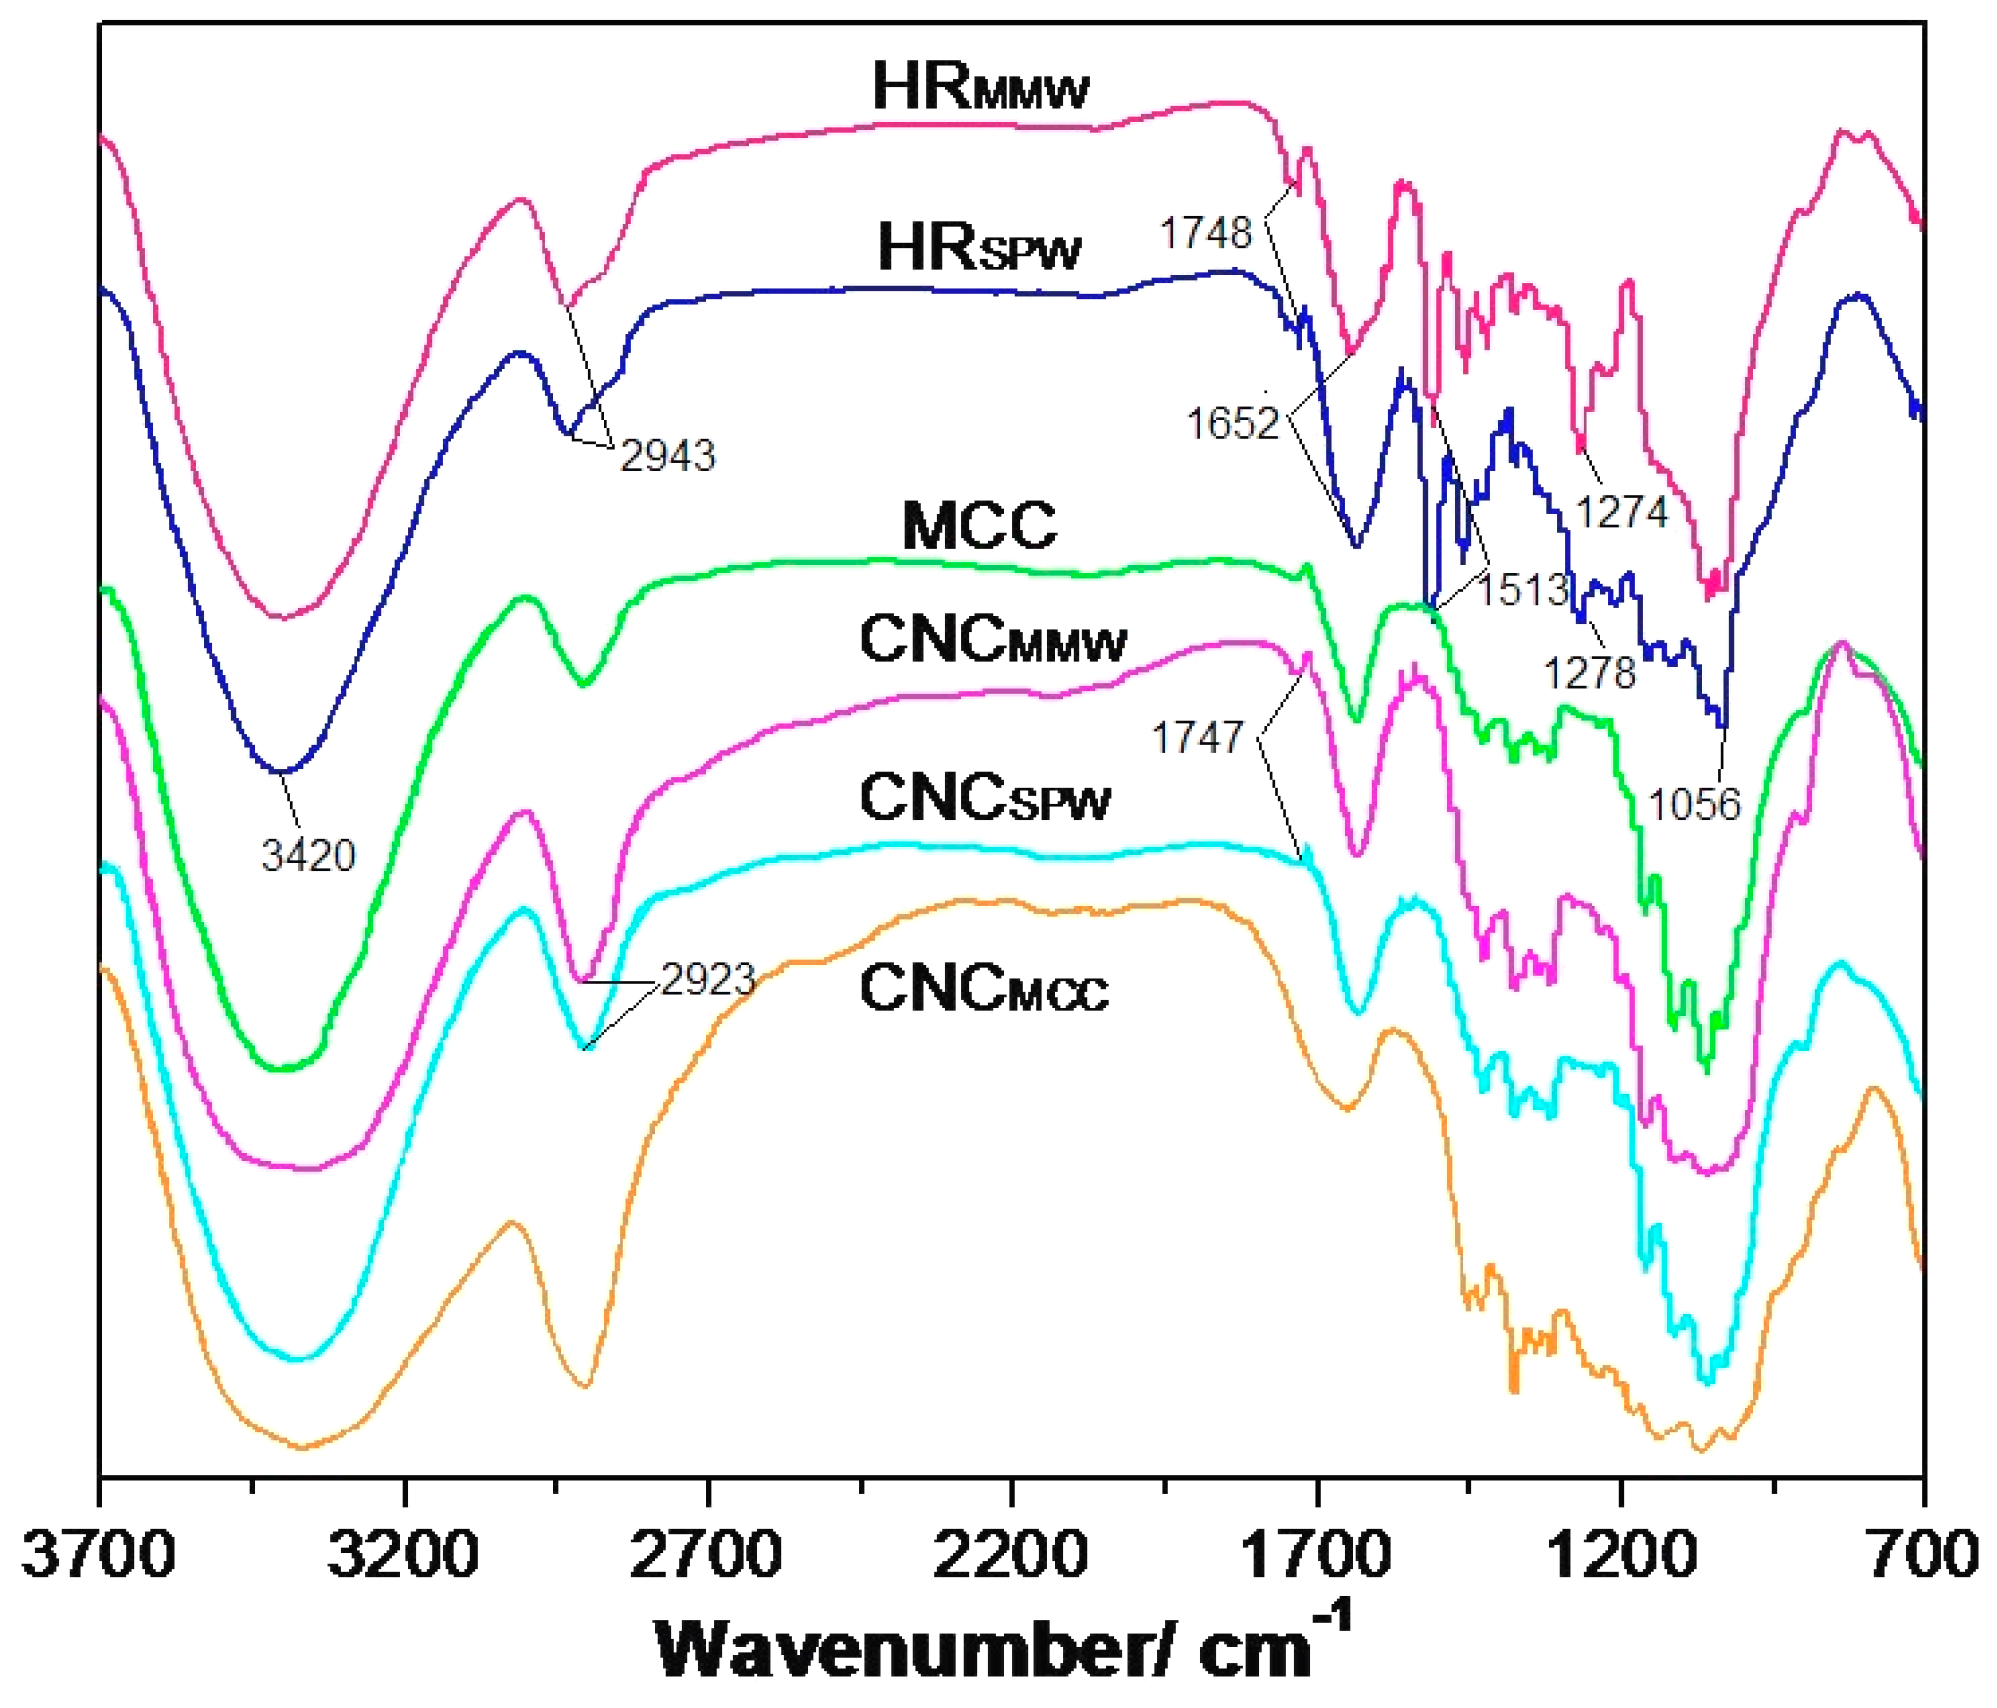
2.1. Chemical Analysis
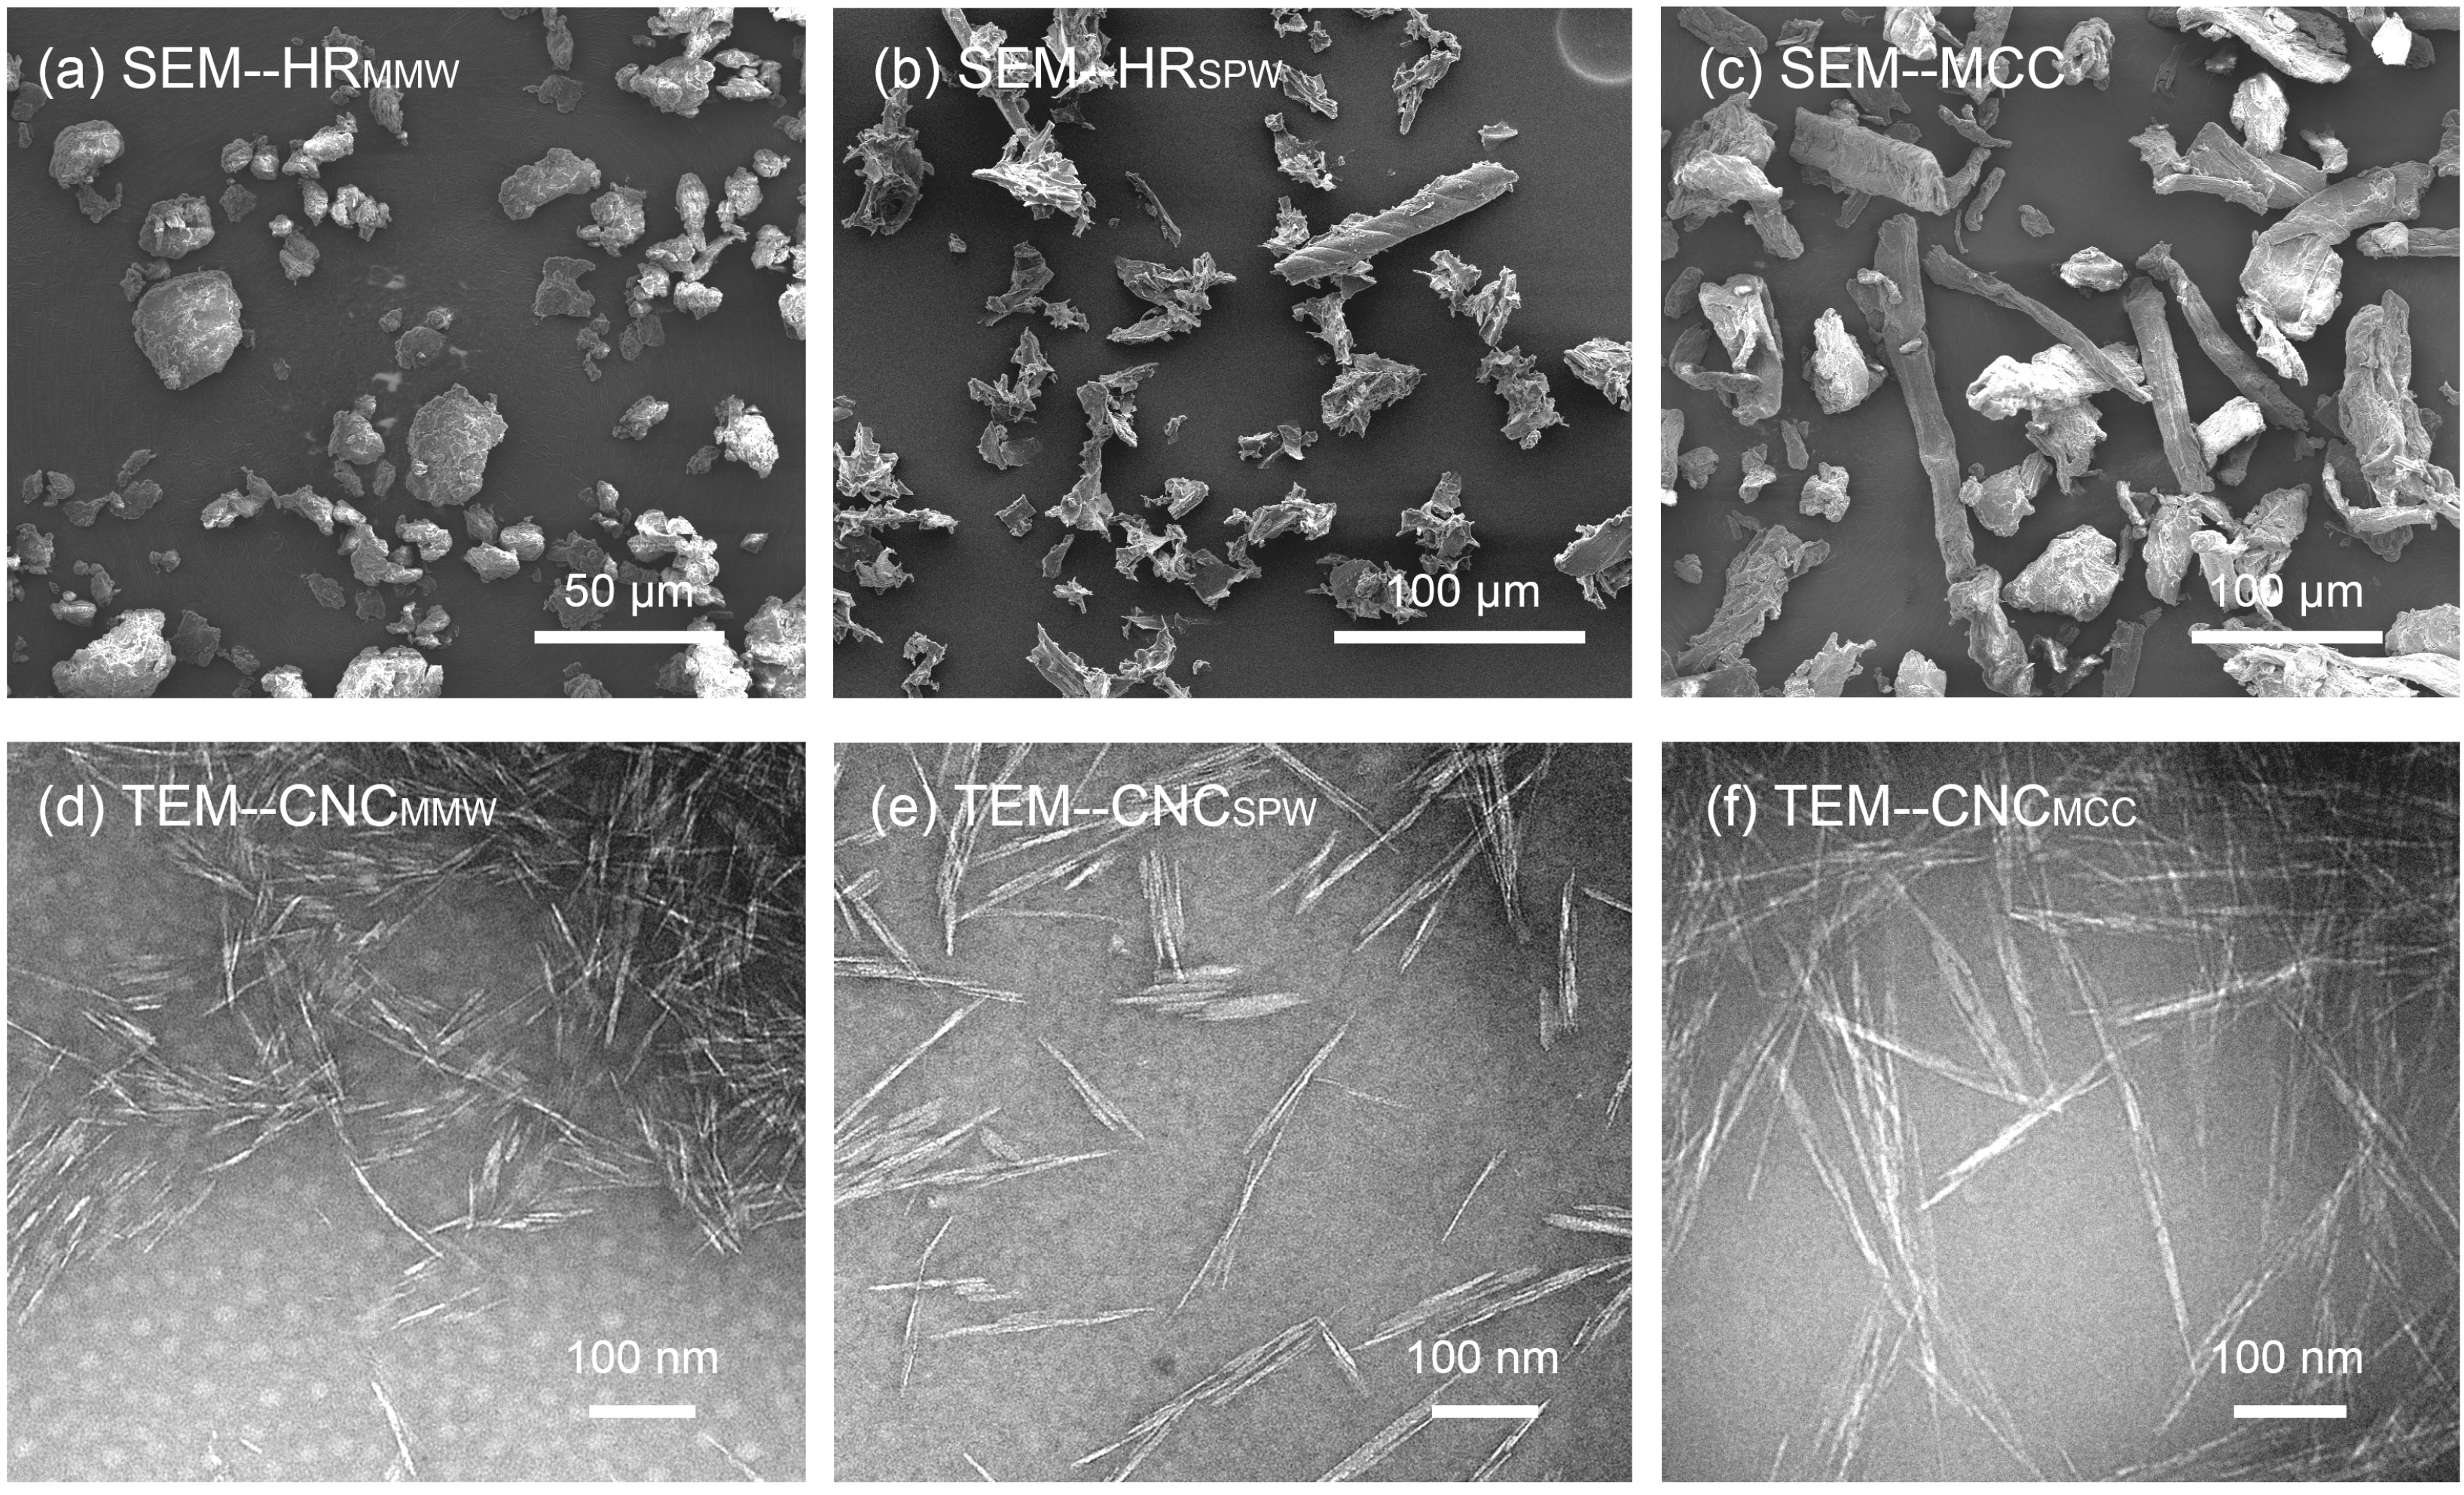
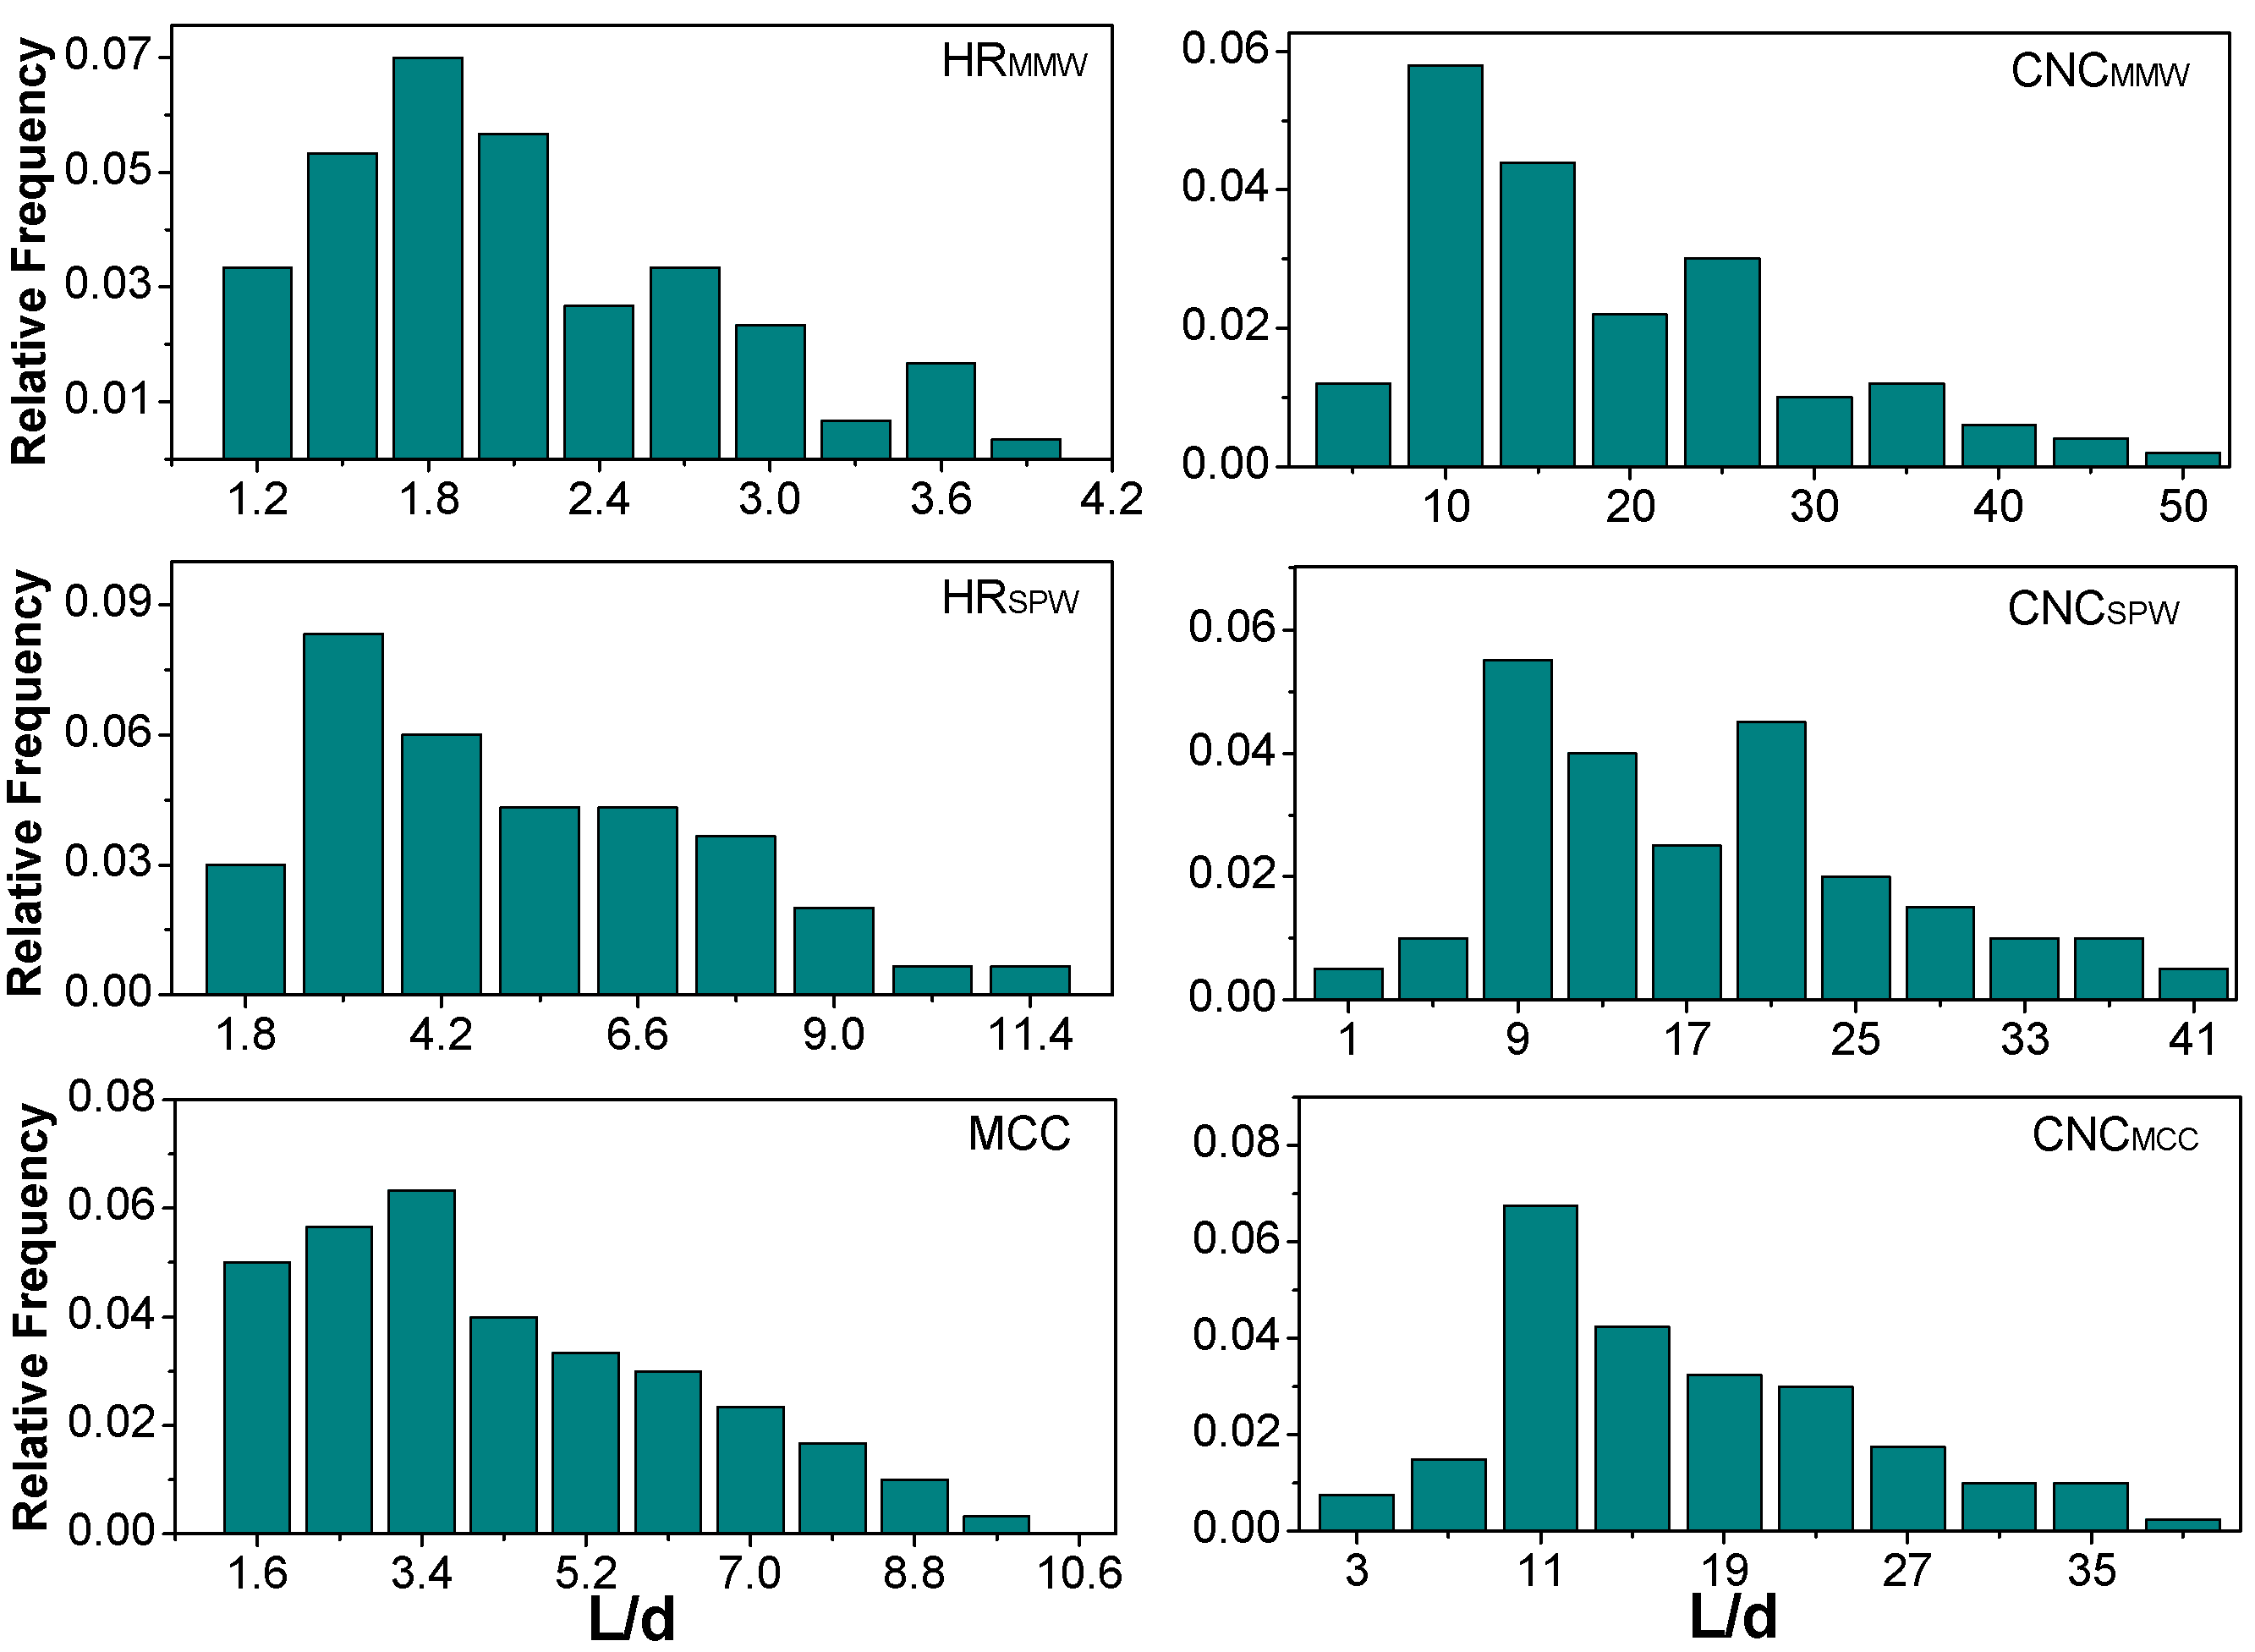
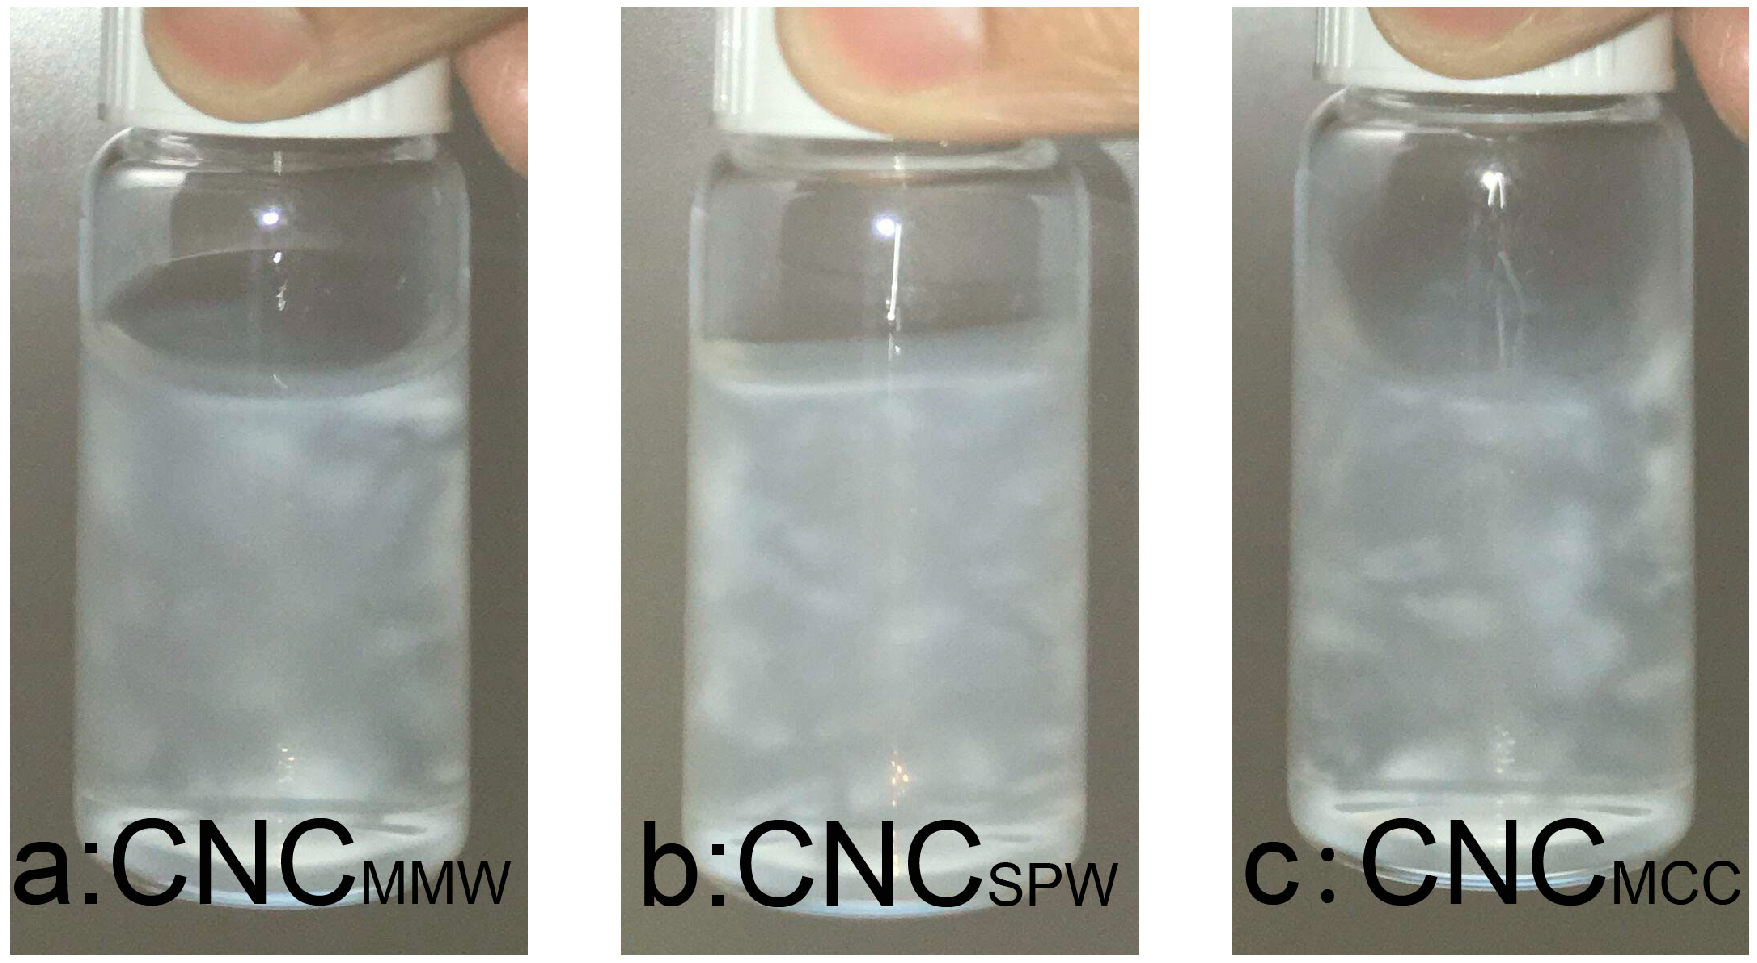
2.2. Morphology
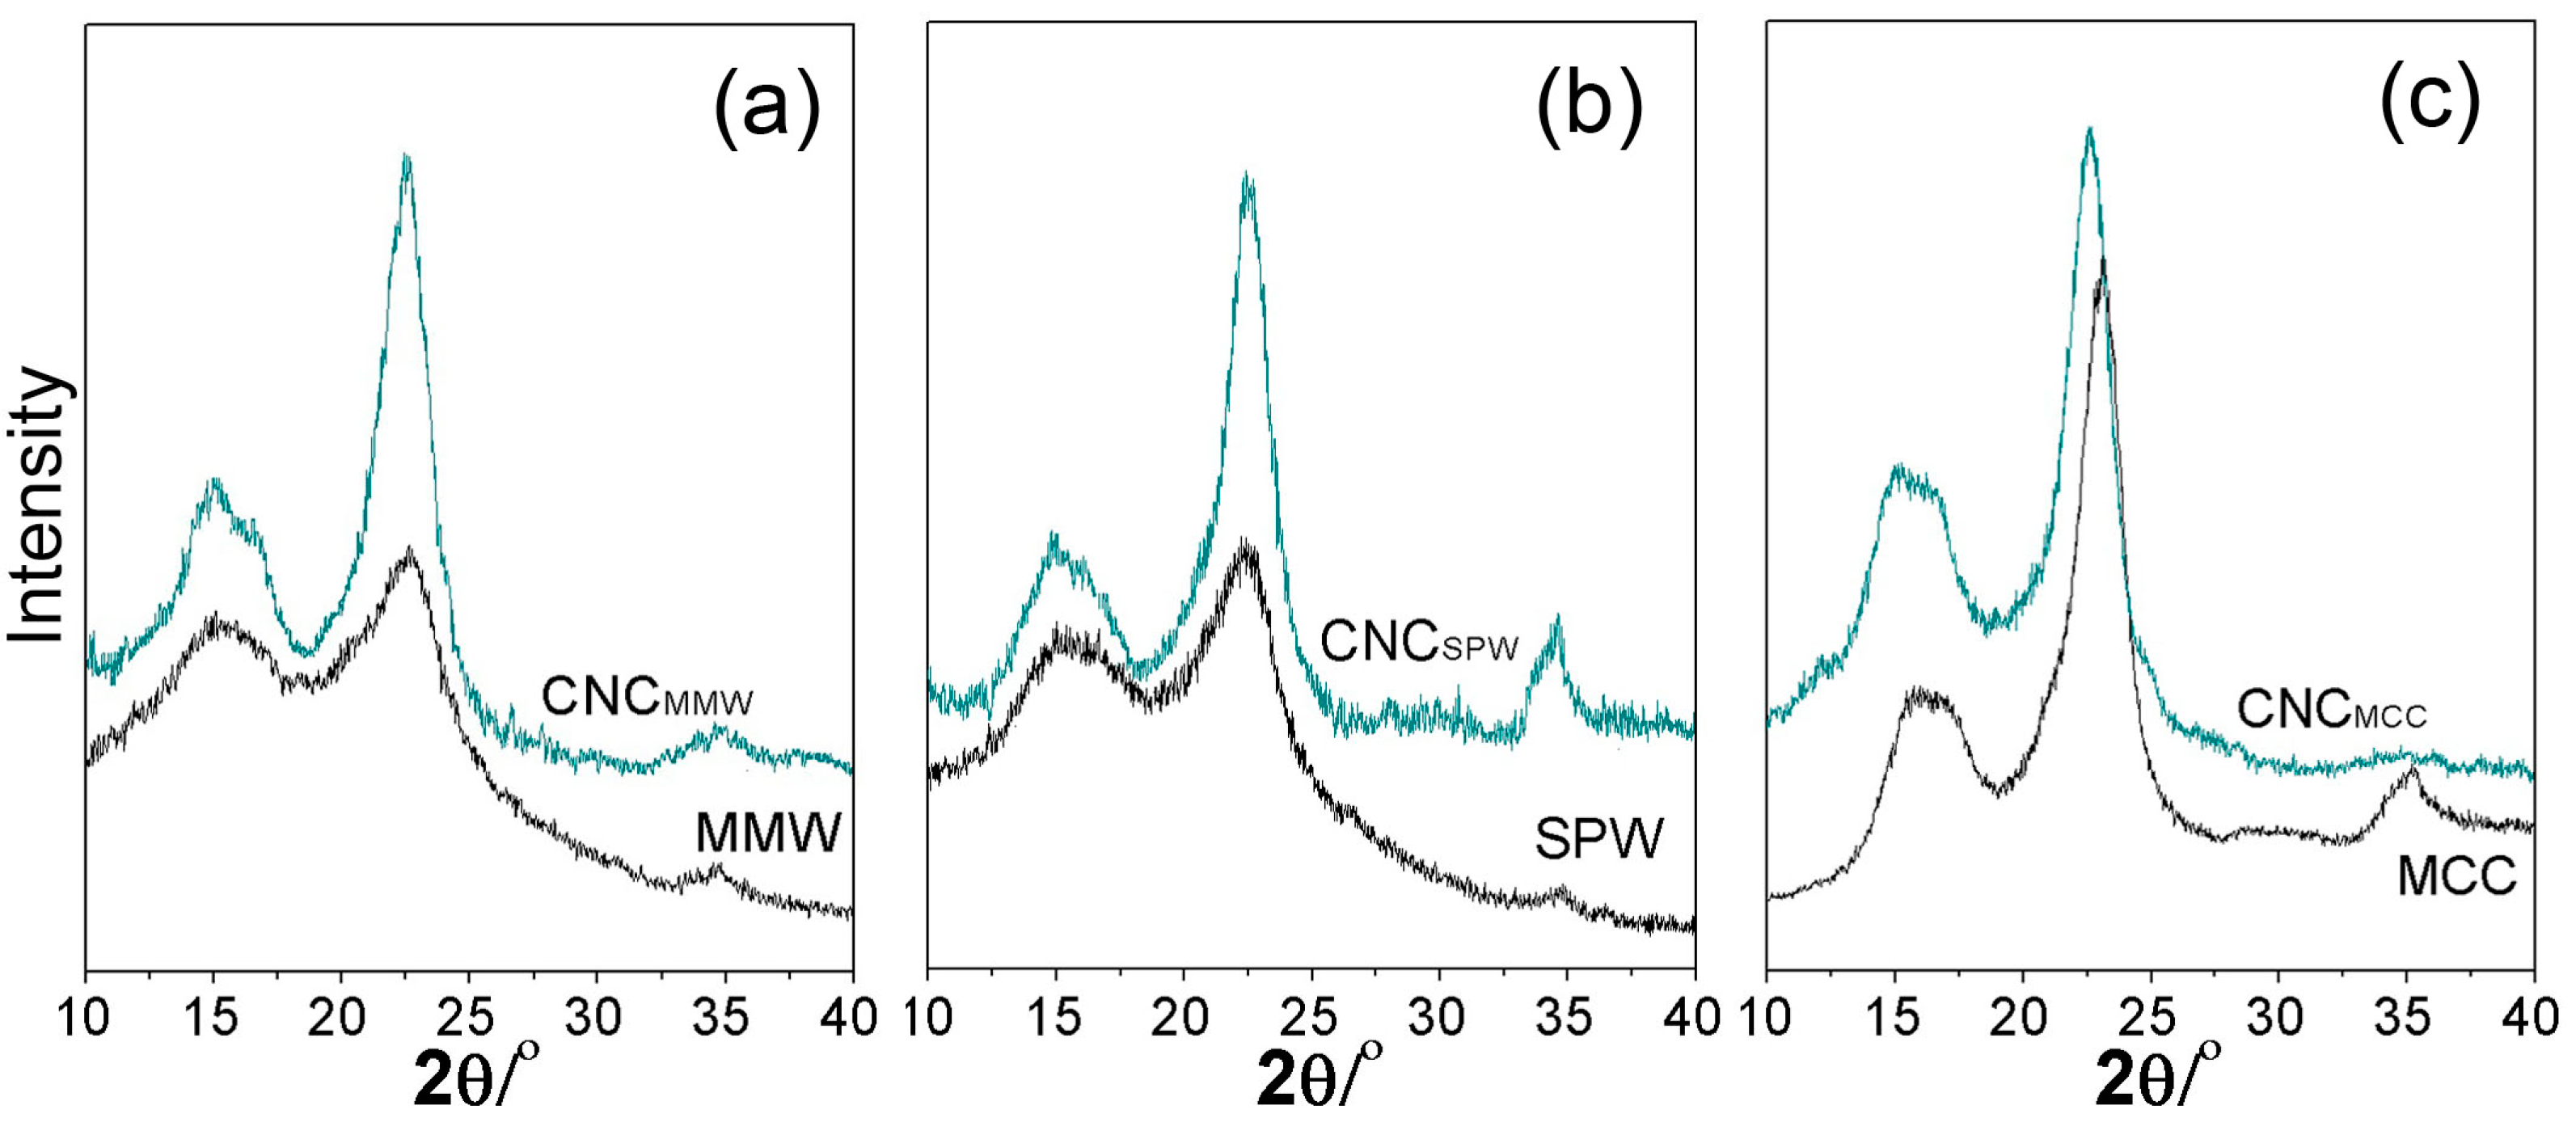
2.3. Crystallinity
2.4. Zeta Potential
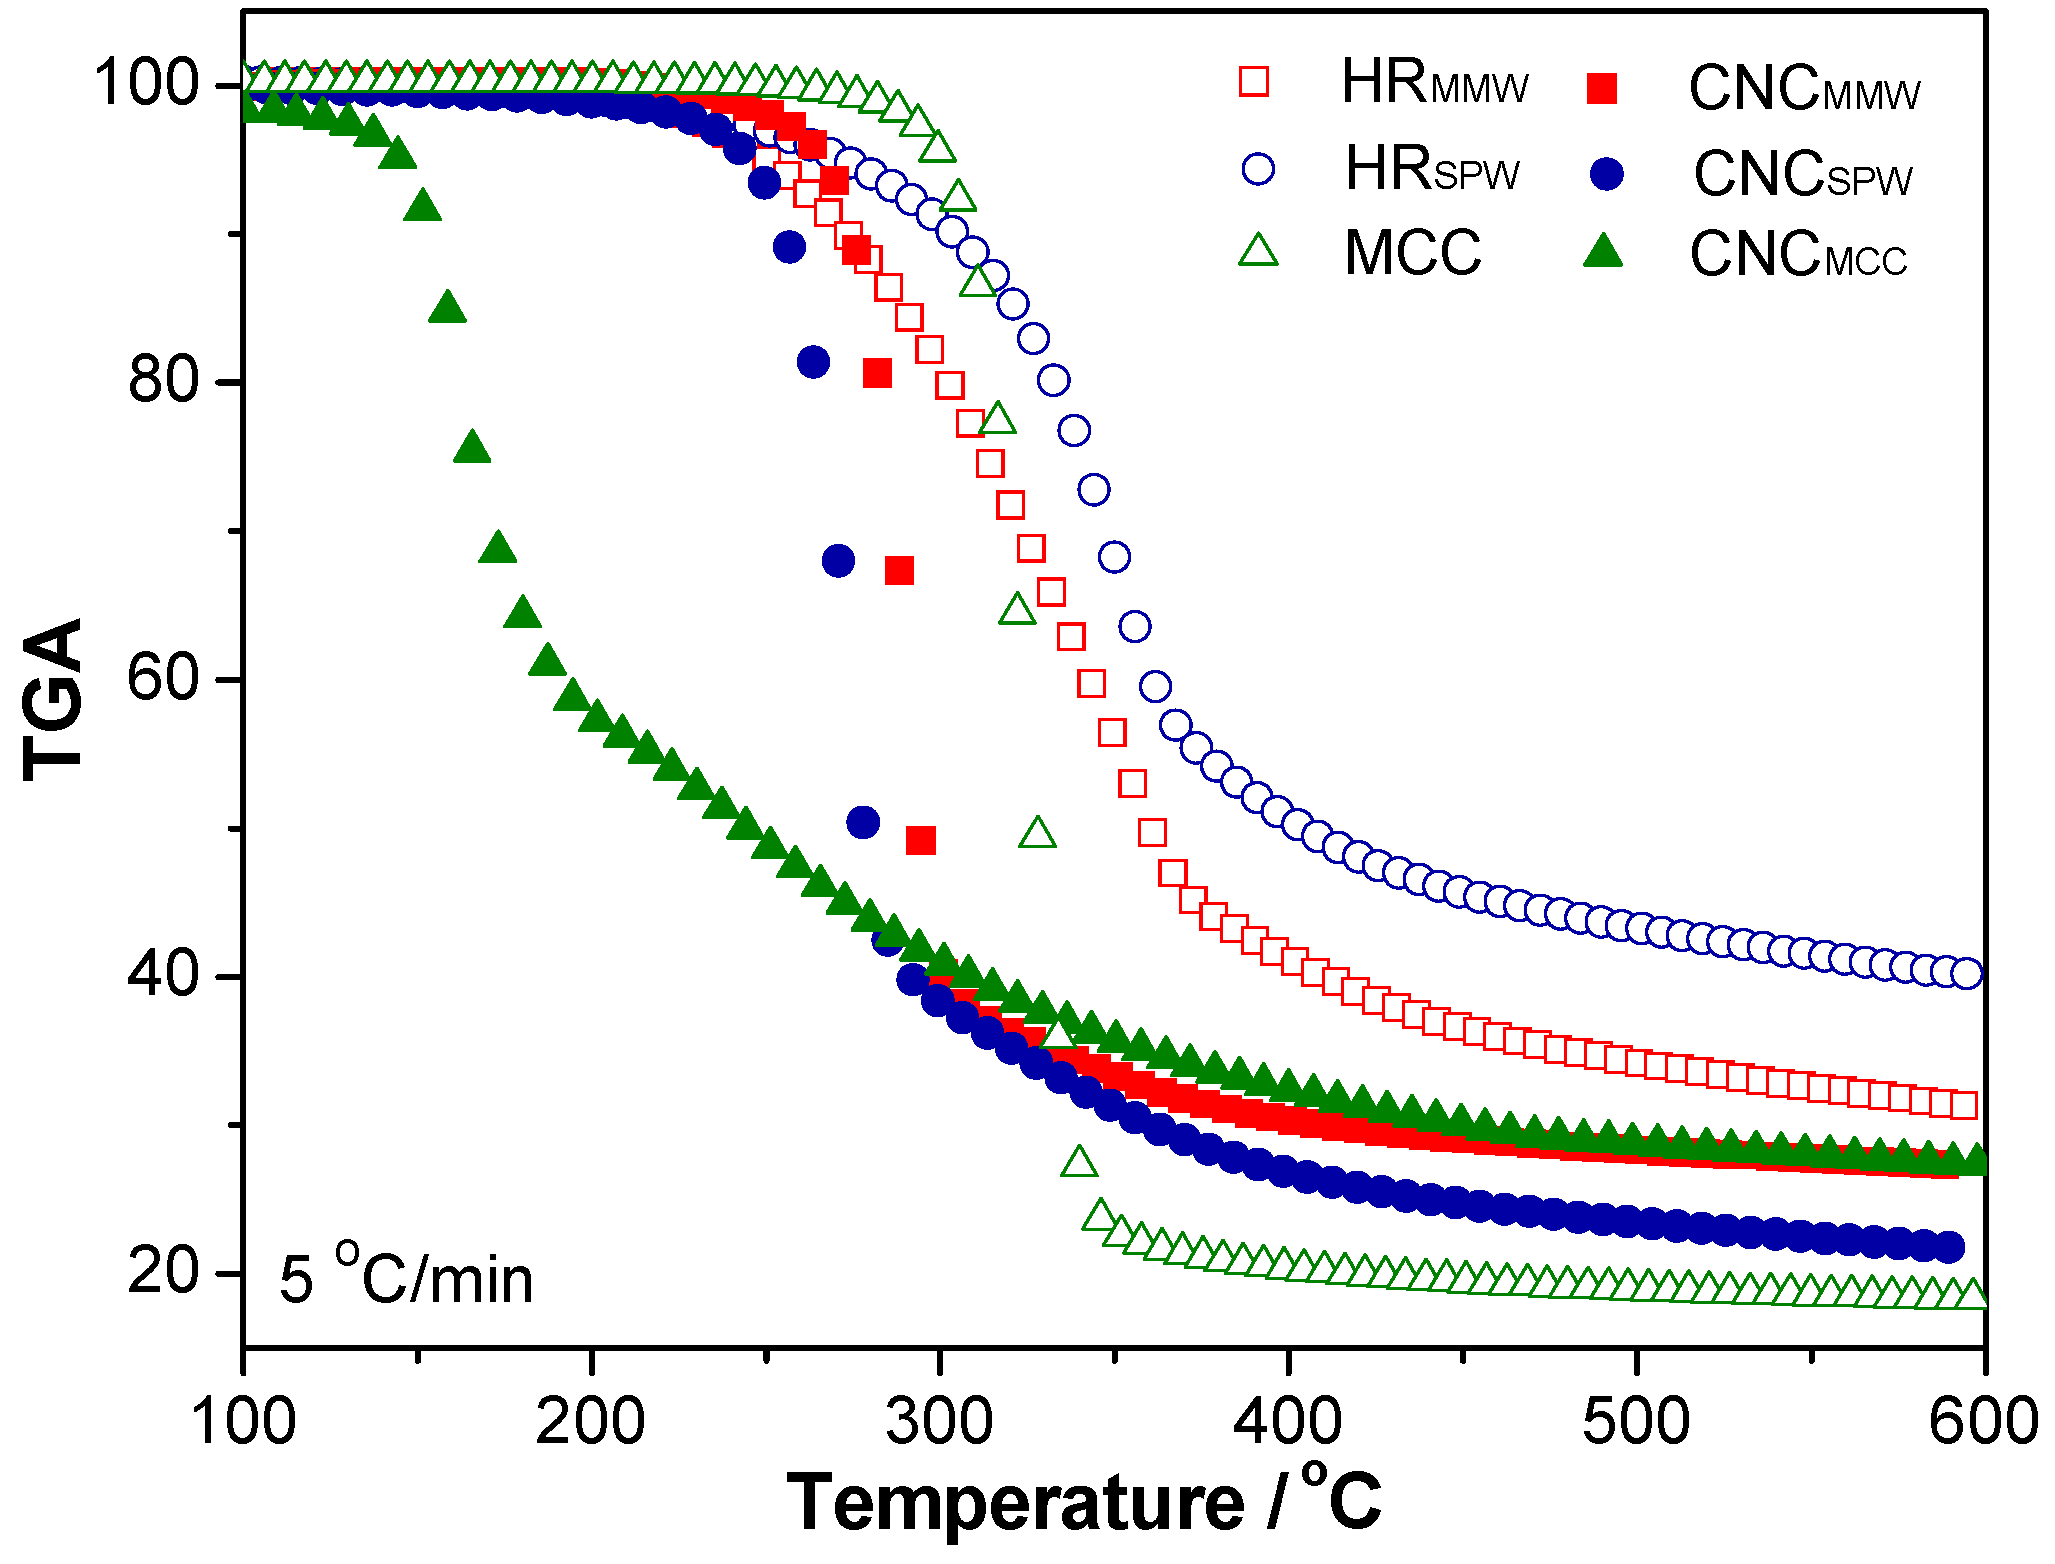
2.5. Thermal Stability
3. Experimental
3.1. Raw Materials
3.2. Cellulose Extraction from Hydrolyzed Residuals
3.3. Cellulose Nanocrystals Preparation
3.4. Characterization
3.4.1. Chemical Analysis
3.4.2. FTIR Spectroscopy
3.4.3. Imaging
3.4.4. Crystallinity
3.4.5. Zeta Potential
3.4.6. Thermal Stability
4. Conclusions
Acknowledgments
Author Contributions
Conflicts of Interest
References
- Koh, M.Y.; Ghazi, T.I.M. A review of biodiesel production from jatropha curcas L. oil. Renew. Sustain. Energy Rev. 2011, 15, 2240–2251. [Google Scholar] [CrossRef]
- Kumar, P.; Barrett, D.M.; Delwiche, M.J.; Stroeve, P. Methods for pretreatment of lignocellulosic biomass for efficient hydrolysis and biofuel production. Ind. Eng. Chem. Res. 2009, 48, 3713–3729. [Google Scholar] [CrossRef]
- Huber, G.W. Breaking the Chemical and Engineering Barriers to Lignocellulosic Biofuels: Next Generation Hydrocarbon Biorefineries; National Science Foundation, Chemical, Biogengineering, Environmental and Transport Systems Division: Washington, DC, USA, 2008; pp. 44–59. [Google Scholar]
- Hamelinck, C.N.; van Hooijdonk, G.; Faaij, A.P.C. Ethanol from lignocellulosic biomass: Techno-economic performance in short, middle and long-term. Biomass Bioenergy 2005, 28, 384–410. [Google Scholar] [CrossRef]
- Demirbas, A. Bioethanol from cellulose materials: A renewable motor fuel from biomass. Energy Sourc. 2005, 27, 327–337. [Google Scholar] [CrossRef]
- Sun, Y.; Cheng, J. Hydrolysis of lignocellulosic materials for ethanol production: A review. Bioresour. Technol. 2002, 83, 1–11. [Google Scholar] [CrossRef]
- Oksman, K.; Etang, J.A.; Mathew, A.P.; Jonoobi, M. Cellulose nanowhiskers separated from a bio-residual from wood bioethanol production. Biomass Bioenergy 2011, 35, 146–152. [Google Scholar] [CrossRef]
- Woodings, C. Regenerated Cellulose Fibres; Woodhead Publishing Ltd., Cambridge, England, Ed.; CRC Press: Boca Raton, FL, USA, 2001; pp. 273–289. [Google Scholar]
- Herrera, M.A.; Mathew, A.P.; Oksman, K. Characterization of cellulose nanowhiskers: A comparison of two industrial bio-residues. Mater. Lett. 2012, 31, 28–31. [Google Scholar] [CrossRef]
- Chen, N.; Zhu, J.Y.; Tong, Z. Fabrication of microfibrillated cellulose gel from waste pulp sludge via mild maceration combined with mechanical shearing. Cellulose 2016, 23, 2573–2583. [Google Scholar] [CrossRef]
- Kargarzadeh, H.; Ahmad, I.; Abdullah, I.; Dufresne, A.; Zainudin, S.Y.; Sheltami, R.M. Effects of hydrolysis conditions on the morphology, crystallinity, and thermal stability of cellulose nanocrystals extracted from kenaf bast fibers. Cellulose 2012, 19, 855–866. [Google Scholar] [CrossRef]
- Li, X.; Chen, S.; Hu, W.; Shi, S.; Shen, W.; Zhang, X.; Wang, H. In situ synthesis of CdS nanoparticles on bacterial cellulose nanofibers. Carbohydr. Polym. 2009, 76, 509–512. [Google Scholar] [CrossRef]
- Fortunati, E.; Armentano, I.; Zhou, Q.; Puglia, D.; Terenzi, A.; Berglund, L.A.; Kenny, J.M. Microstructure and nonisothermal cold crystallization of PLA composites based on silver nanoparticles and nanocrystalline cellulose. Polym. Degrad. Stab. 2012, 97, 2027–2036. [Google Scholar] [CrossRef]
- Ten, E.; Turtle, J.; Bahr, D.; Jiang, L.; Wolcott, M. Thermal and mechanical properties of poly(3-hydroxybutyrate-co-3-hydroxyvalerate)/cellulose nanowhiskers composites. Polymer 2010, 51, 2652–2660. [Google Scholar] [CrossRef]
- De Menezes, A.J.; Siqueira, G.; Curvelo, A.A.; Dufresne, A. Extrusion and characterization of functionalized cellulose whiskers reinforced polyethylene nanocomposites. Polymer 2009, 50, 4552–4563. [Google Scholar] [CrossRef]
- Babel, S.; Kurniawan, T.A. Low-cost adsorbents for heavy metals uptake from contaminated water: A review. J. Hazard. Mater. 2003, 97, 219–243. [Google Scholar] [CrossRef]
- Cha, R.; He, Z.; Ni, Y. Preparation and characterization of thermal/pH-sensitive hydrogel from carboxylated nanocrystalline cellulose. Carbohydr. Polym. 2012, 88, 713–718. [Google Scholar] [CrossRef]
- Diaz, J.A.; Wu, X.; Martini, A.; Youngblood, J.P.; Moon, R.J. Thermal expansion of self-organized and shear-oriented cellulose nanocrystal films. Biomacromolecules 2013, 14, 2900–2908. [Google Scholar] [CrossRef] [PubMed]
- Trache, D.; Hazwan Hussin, M.; Mohamad Haafiz, M.K.; Kumar Thakur, V. Recent progress in cellulose nanocrystals: sources and production. Nanoscale 2017, 9, 1763–1786. [Google Scholar] [CrossRef] [PubMed]
- Trache, D.; Hussin, M.H.; Chuin, C.T.H.; Sabar, S.; Fazita, M.N.; Taiwo, O.F.; Hassan, T.M.; Haafiz, M.M. Microcrystalline cellulose: Isolation, characterization and bio-composites application—A review. Int. J. Biol. Macromol. 2016, 93, 789–804. [Google Scholar] [CrossRef] [PubMed]
- Abdul Khalil, H.P.S.; Bhat, A.H.; Ireana Yusra, A.F. Green composites from sustainable cellulose nanofibrils: A review. Carbohydr. Polym. 2012, 87, 963–979. [Google Scholar] [CrossRef]
- Bassett, K.H.; Liang, C.Y.; Marchessault, R.H. The infrared spectrum of crystalline polysaccharides. IX. The near infrared spectrum of cellulose. J. Polym. Sci. Part A 1963, 1, 1687–1692. [Google Scholar] [CrossRef]
- Alemdar, A.; Sain, M. Isolation and characterization of nanofibers from agricultural residues-wheat straw and soy hulls. Bioresour. Technol. 2008, 99, 1664–1671. [Google Scholar] [CrossRef] [PubMed]
- Pan, H.; Shupe, T.F.; Hse, C.Y. Characterization of liquefied wood residues from different liquefaction conditions. J. Appl. Polym. Sci. 2007, 105, 3740–3746. [Google Scholar] [CrossRef]
- Li, M.C.; Wu, Q.; Song, K.; Lee, S.; Qing, Y.; Wu, Y. Cellulose nanoparticles: Structure-morphology-rheology relationships. ACS Sustain. Chem. Eng. 2015, 3, 821–832. [Google Scholar] [CrossRef]
- Ten, E.; Long, J.; Wolcott, M.P. Preparation and properties of aligned poly(3-hydroxybutyrate-co-3-hydroxyvalerate)/cellulose nanowhiskers composites. Carbohydr. Polym. 2013, 92, 206–213. [Google Scholar] [CrossRef] [PubMed]
- Han, J.; Zhou, C.; French, A.D.; Han, G.; Wu, Q. Characterization of cellulose II nanoparticles regenerated from 1-butyl-3-methylimidazolium chloride. Carbohydr. Polym. 2013, 94, 773–781. [Google Scholar] [CrossRef] [PubMed]
- Henry, D.C. The cataphoresis of suspended particles. Part I. The equation of cataphoresis. Proc. R. Soc. Lond. 1931, 133, 106–129. [Google Scholar] [CrossRef]
- Ohshima, H. Modified henry function for the electrophoretic mobility of a charged spherical colloidal particle covered with an ion-penetrable uncharged polymer layer. J. Colloid Interface Sci. 2002, 252, 119–125. [Google Scholar] [CrossRef] [PubMed]
- Hunter, R.J. Zeta Potential in Colloids Science; Academic Press: New York, NY, USA, 1981. [Google Scholar]
- Sadeghifar, H.; Filpponen, I.; Clarke, S.P.; Brougham, D.F.; Argyropoulos, D.S. Production of cellulose nanocrystals using hydrobromic acid and click reactions on their surface. J. Mater. Sci. 2011, 46, 7344–7355. [Google Scholar] [CrossRef]
- Beck-Candanedo, S.; Roman, M.; Gray, D.G. Effect of reaction conditions on the properties and behavior of wood cellulose nanocrystal suspensions. Biomacromolecules 2005, 6, 1048–1054. [Google Scholar] [CrossRef] [PubMed]
- Li, Y.; Du, L.; Kai, C.; Huang, R.; Wu, Q. Bamboo and high density polyethylene composite with heat-treated bamboo fiber: thermal decomposition properties. Bioresources 2013, 8, 900–912. [Google Scholar] [CrossRef]
- Chao, Z.; Lei, X.C.; Scott, C.T.; Zhu, J.Y.; Li, K.C. Comparison of dilute acid and sulfite pretreatment for enzymatic saccharification of earlywood and latewood of douglas fir. Bioenergy Res. 2014, 7, 362–370. [Google Scholar]
- Rafieian, F.; Simonsen, J. The effect of carboxylated nanocrystalline cellulose on the mechanical, thermal and barrier properties of cysteine cross-linked gliadin nanocomposite. Cellulose 2015, 22, 1175–1188. [Google Scholar] [CrossRef]
- Roman, M.; Winter, T.W. Effect of sulfate groups from sulfuric acid hydrolysis on the thermal degradation behavior of bacterial cellulose. Biomacromolecules 2004, 5, 1671–1677. [Google Scholar] [CrossRef] [PubMed]
- Sluiter, A.; Hames, B.; Ruiz, R.; Scarlata, C.; Sluiter, J.; Templeton, D.; Crocker, D. Determination of Structural Carbohydrates and Lignin in Biomass; NREL/TP-510-42618 NREL Laboratory Analytical Procedure; National Renewable Energy Laboratory: Golden, CO, USA, 2008. [Google Scholar]


| Samples | Lignin Analysis | Carbohydrate Analysis | ||||
|---|---|---|---|---|---|---|
| Acid-Insoluble Lignin | Acid-Soluble Lignin | Glucan | Mannan/Xylan | Arabinan | Galactan | |
| % | % | % | % | % | % | |
| HRMMW | 54.10 | 3.64 | 25.37 | 9.08 | 1.01 | 3.41 |
| HRSPW | 68.38 | 4.62 | 21.35 | 2.10 | -- | -- |
| MCC | -- | 3.39 | 80.20 | -- | -- | -- |
| Samples | Length | Width | Samples | Length | Width | Samples | Length | Width |
|---|---|---|---|---|---|---|---|---|
| HRMMW | 13 (5) μm | 7 (4) μm | HRSPW | 34 (19) μm | 9 (7) μm | MCC | 74 (42) μm | 20 (10) μm |
| CNCMMW | 202 (78) nm | 16 (9) nm | CNCSPW | 268 (118) nm | 16 (8) nm | CNCMCC | 270 (122) nm | 17 (8) nm |
| Samples | Cr | Z Potential | Tonsetβ→0 | TPβ→0 | Ea |
|---|---|---|---|---|---|
| % | mV | °C | °C | kJ/mol | |
| HRMMW | 27.4 | — | 225.4 | 350.9 | 172.8 |
| HRSPW | 31.4 | — | 293.1 | 338.4 | 165.7 |
| MCC | 81.0 | — | 297.8 | 323.2 | 155.4 |
| CNCMMW | 73.7 | −63.5 | 271.1 | 289.9 | 162.8 |
| CNCSPW | 74.0 | −64.3 | 252.4 | 271.7 | 168.9 |
| CNCMCC | 85.5 | −66.4 | 167.5 | 270.5 | 144.5 |
© 2017 by the authors. Licensee MDPI, Basel, Switzerland. This article is an open access article distributed under the terms and conditions of the Creative Commons Attribution (CC BY) license ( http://creativecommons.org/licenses/by/4.0/).
Share and Cite
Du, L.; Wang, J.; Zhang, Y.; Qi, C.; Wolcott, M.P.; Yu, Z. Preparation and Characterization of Cellulose Nanocrystals from the Bio-ethanol Residuals. Nanomaterials 2017, 7, 51. https://doi.org/10.3390/nano7030051
Du L, Wang J, Zhang Y, Qi C, Wolcott MP, Yu Z. Preparation and Characterization of Cellulose Nanocrystals from the Bio-ethanol Residuals. Nanomaterials. 2017; 7(3):51. https://doi.org/10.3390/nano7030051
Chicago/Turabian StyleDu, Lanxing, Jinwu Wang, Yang Zhang, Chusheng Qi, Michael P. Wolcott, and Zhiming Yu. 2017. "Preparation and Characterization of Cellulose Nanocrystals from the Bio-ethanol Residuals" Nanomaterials 7, no. 3: 51. https://doi.org/10.3390/nano7030051