Article

Calcination Method Synthesis of SnO2/g-C3N4 Composites for a High-Performance Ethanol Gas Sensing Application

1
School of Chemistry and Chemical Engineering, Henan Polytechnic University, Jiaozuo 454000, China
2
School of Safety Science and Engineering, State Key Laboratory Cultivation Base for Gas Geology and Gas Control, Henan Polytechnic University, Jiaozuo 454000, China
*
Authors to whom correspondence should be addressed.
Nanomaterials 2017, 7(5), 98; https://doi.org/10.3390/nano7050098
Submission received: 7 February 2017 / Revised: 12 April 2017 / Accepted: 26 April 2017 / Published: 29 April 2017
(This article belongs to the Special Issue Nanomaterials for Sensing Applications)

Abstract

:
The SnO2/g-C3N4 composites were synthesized via a facile calcination method by using SnCl4·5H2O and urea as the precursor. The structure and morphology of the as-synthesized composites were characterized by the techniques of X-ray diffraction (XRD), the field-emission scanning electron microscopy and transmission electron microscopy (SEM and TEM), energy dispersive spectrometry (EDS), thermal gravity and differential thermal analysis (TG-DTA), and N2-sorption. The analysis results indicated that the as-synthesized samples possess the two dimensional structure. Additionally, the SnO2 nanoparticles were highly dispersed on the surface of the g-C3N4nanosheets. The gas-sensing performance of the as-synthesized composites for different gases was tested. Moreover, the composite with 7 wt % g-C3N4 content (SnO2/g-C3N4-7) SnO2/g-C3N4-7 exhibits an admirable gas-sensing property to ethanol, which possesses a higher response and better selectivity than that of the pure SnO2-based sensor. The high surface area of the SnO2/g-C3N4 composite and the good electronic characteristics of the two dimensional graphitic carbon nitride are in favor of the elevated gas-sensing property.

Graphical Abstract

1. Introduction

In recent years, poisonous and harmful gases of industrial production have frequently leaked. Meanwhile, organic poisonous gases, such as methylbenzene and formaldehyde, volatilize from furniture and newly-decorated houses. As a result, it severely threatens the health of mankind [1,2,3,4]. Therefore, there is the need for an effective and necessary method for detecting the vaporable substances. In the past several years, considerable attentions have been dedicated to metal-oxide semiconductor (MOS) material-based gas sensors. Various metal-oxide semiconductors (MOS), such as SnO2 [5], ZnO [6], CuO [7], α-Fe2O3 [8], Co3O4 [9], MnO2 [10], WO3 [11], In2O3 [12], and NiO [13], are widely used as gas sensors. These gas sensors exhibited unique performances, including a low-cost, small size, and fast response and recovery time. SnO2, a typical n-type metal-oxide semiconductor with a rutile crystalline structure, is widely used to detect different kinds of gases such as ethanol [14], formaldehyde [15], acetone [16], nitrogen dioxide [17], etc. These are all due to their remarkable characteristics such as their good chemical and physical stability, non-pollution property, low-energy feature, use of simple preparation, and so on.
The most remarkable characteristic of SnO2 is that the resistance varies when it is exposed to different types of target gases. As a rule, the resistance value of SnO2 decreases when it is exposed in reducing gases, and conversely, it increases under the oxidizing gases. As we all know, there are many oxygen vacancies of SnO2 which are in favor of the process of gas adsorption. In general, it has a better gas-sensing performance with a higher concentration of oxygen vacancies. Nonetheless, there are some significant defects which restricts its application in gas sensors. For instance, a high working temperature, long response and recovery time, high resistance, and easy agglomeration draw the attention of researchers. In order to overcome these shortcomings, it is necessary to explore an electroconductive intermediate to support SnO2 nanoparticles, in order to improve the electrical conductivity and dispersity. Therefore, many two-dimensional (2D) carbon materials are widely used as intermediates [18,19,20]. Graphene, a unilaminar sp2-hybridized carbon atoms configuration, exhibits an excellent performance, including a large specific surface area, better electronic conductivity, and superior stability. On account of these advantages, graphene and reduced graphene oxide are widely used as gas-sensing materials to detect different kinds of gases. Different metal-oxide decorated graphene nanocomposite gas sensors were reported and exhibited outstanding gas-sensing performances [21,22,23,24]. However, the process of preparing GO and r-GO is complicated and high-cost. Hence, it is necessary to explore a novel 2D structure material with graphene.
Recently, graphitic carbon nitride (g-C3N4) has attracted increasing attention due to its high photology and chemical stability, facile preparation, high specific surface area, and nontoxicity [25,26,27,28]. In general, g-C3N4 is readily synthesized by calcining abundant nitrogen-rich precursors such as melamine, dicyandiamide, and urea. It has been widely used in fields such as photocatalysis, degradation, and energy storage materials [29,30,31]. Until now, there are few reports on the application of g-C3N4 in the field of sensors. Zeng et al. have successfully prepared the α-Fe2O3/g-C3N4 nanocomposite through a facile refluxing method for the cataluminescence sensing of H2S [32]. Zhang et al. have developed a novel fluorescence sensor based on a g-C3N4/MnO2 sandwich nanocomposite for the rapid and selective sensing of glutathione [33]. Moreover, CeO2/g-C3N4 composites with high photocatalytic activity have been synthesized successfully [34]. To the best of the authors’ knowledge, SnO2/g-C3N4-based sensors have yet not been reported in the literature.
In this work, we report a facile calcination approach to synthesize different mass ratios of SnO2/g-C3N4 composites for ethanol sensing. The gas-sensing properties, including the selectivity, stability, and sensitivity, of SnO2/g-C3N4 to ethanol, were investigated. As a result, the SnO2/g-C3N4 composite-based sensor exhibited a higher response value and better selectivity to ethanol than that of the pure SnO2 nanoparticle-based sensor. The mechanism of the as-prepared sample gas-sensing to ethanol was discussed, in detail.

2. Results and Discussion

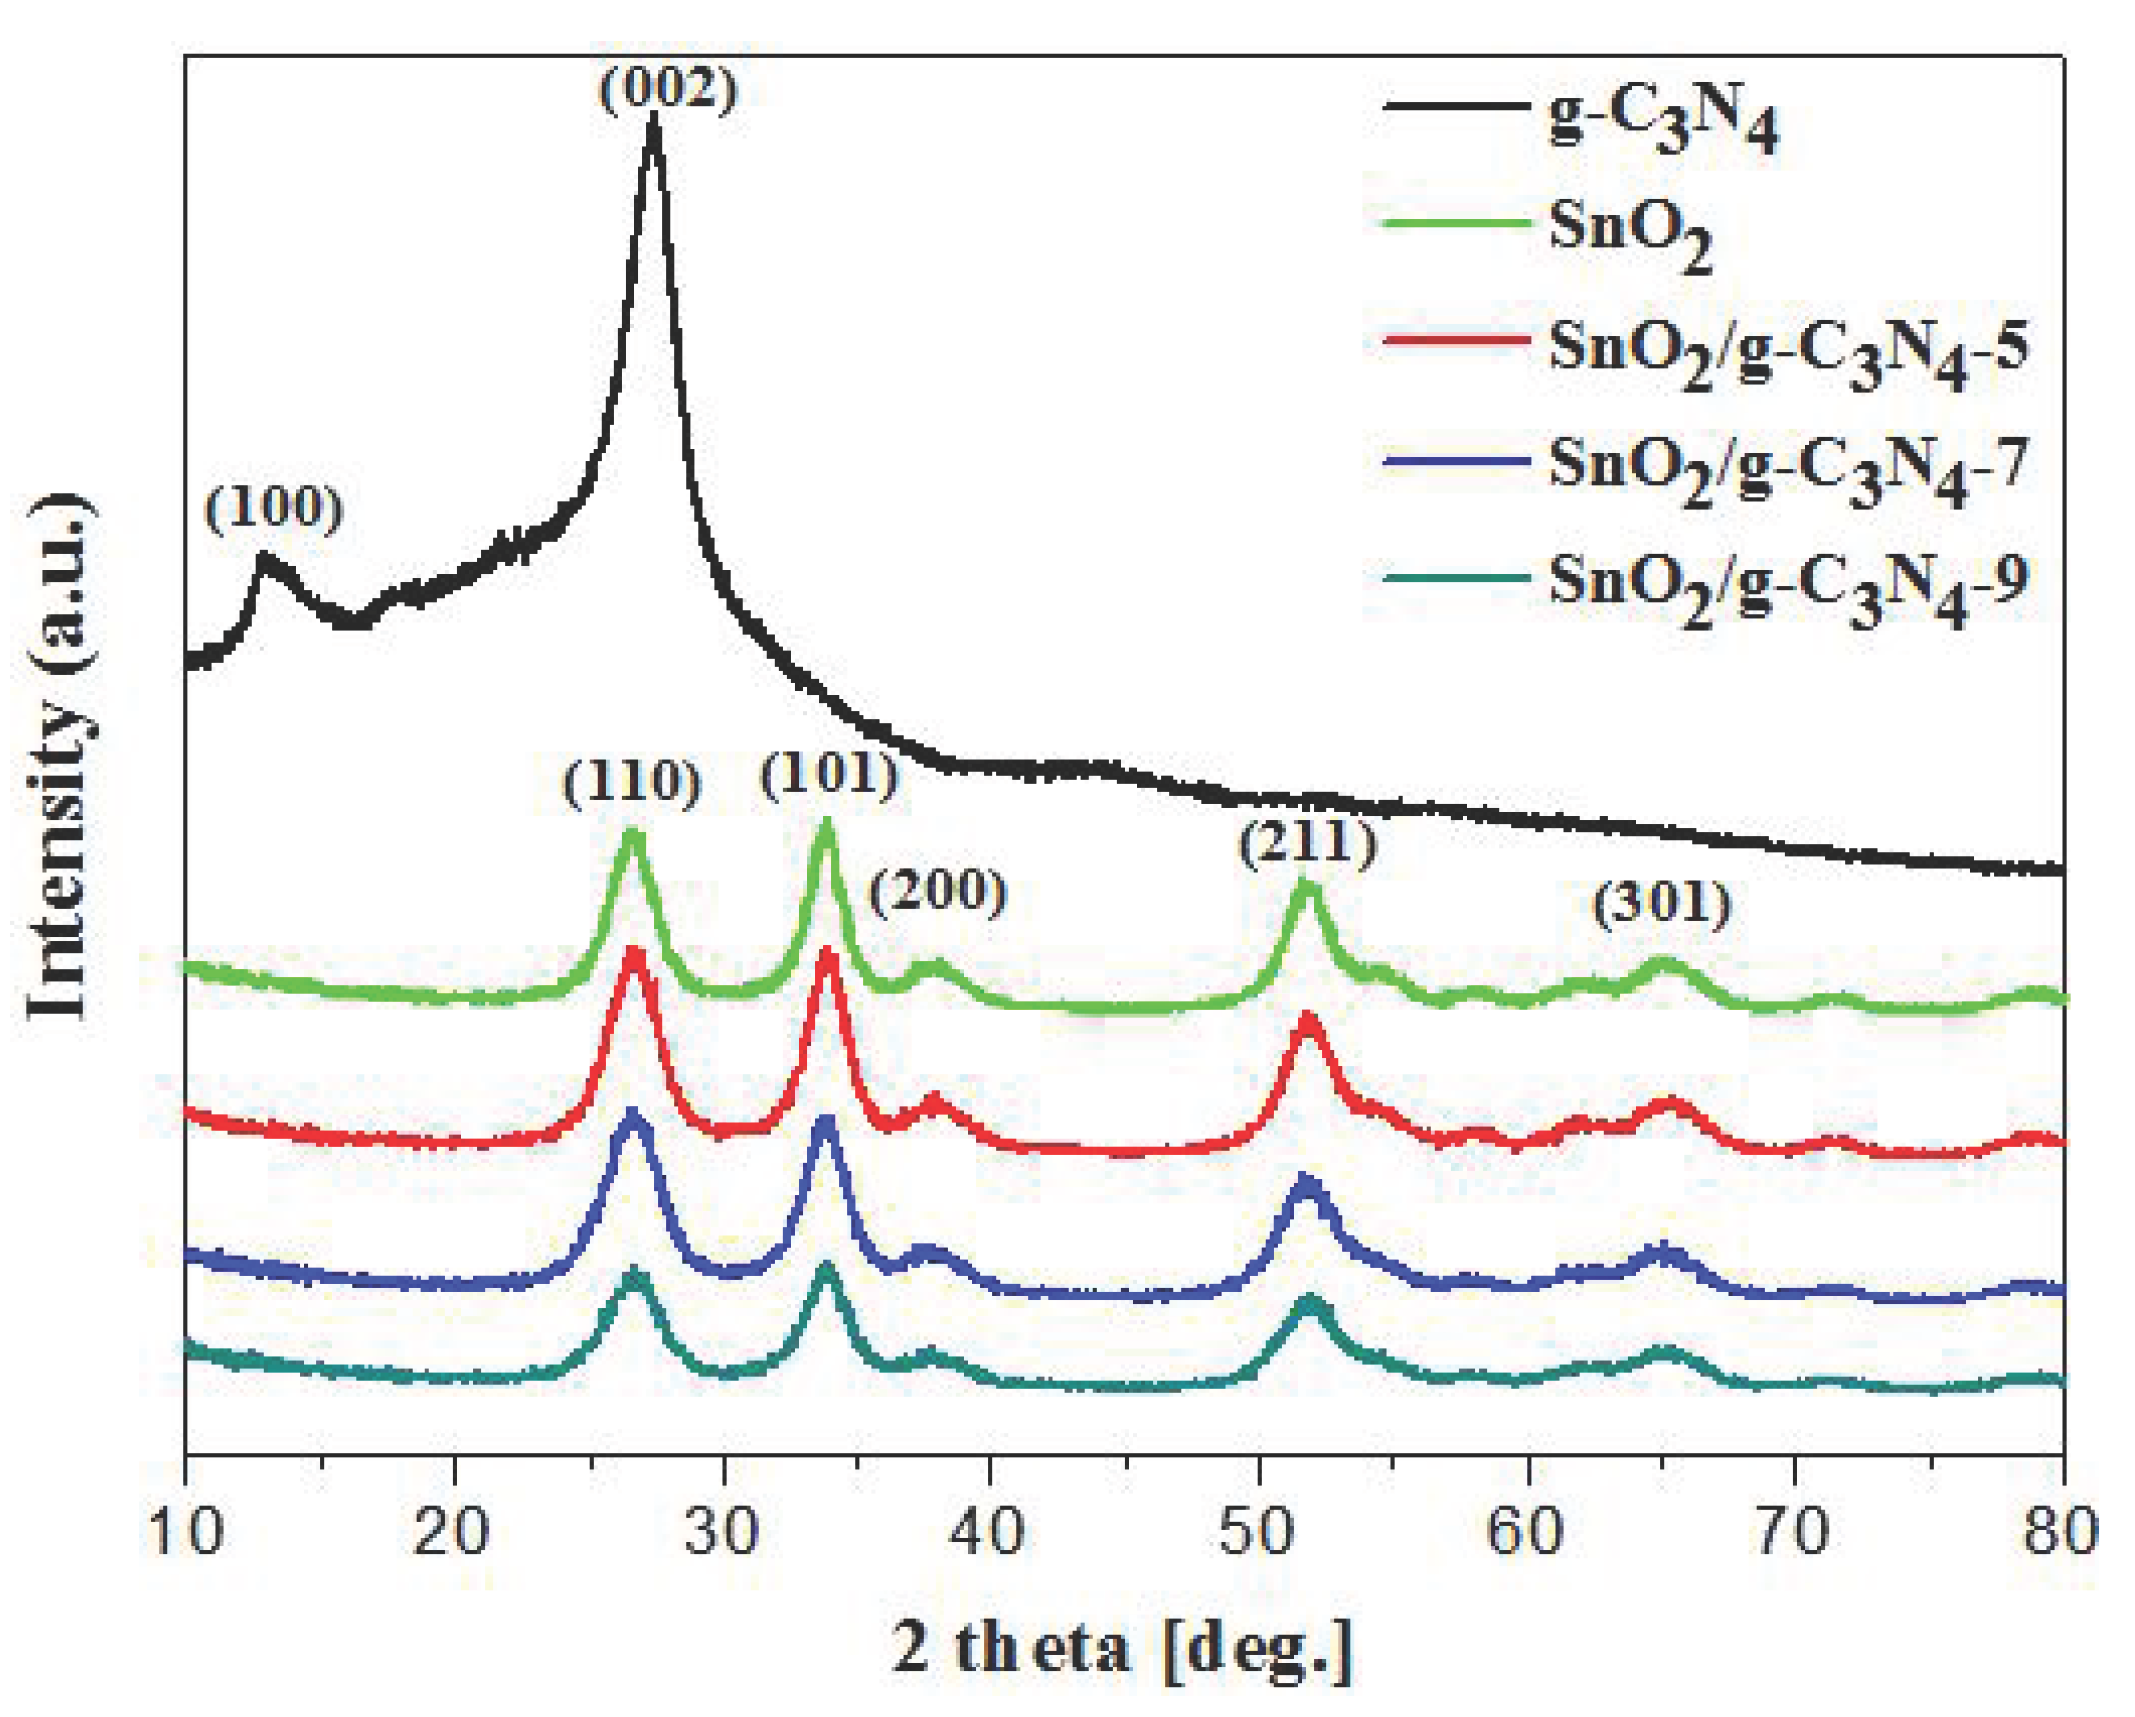
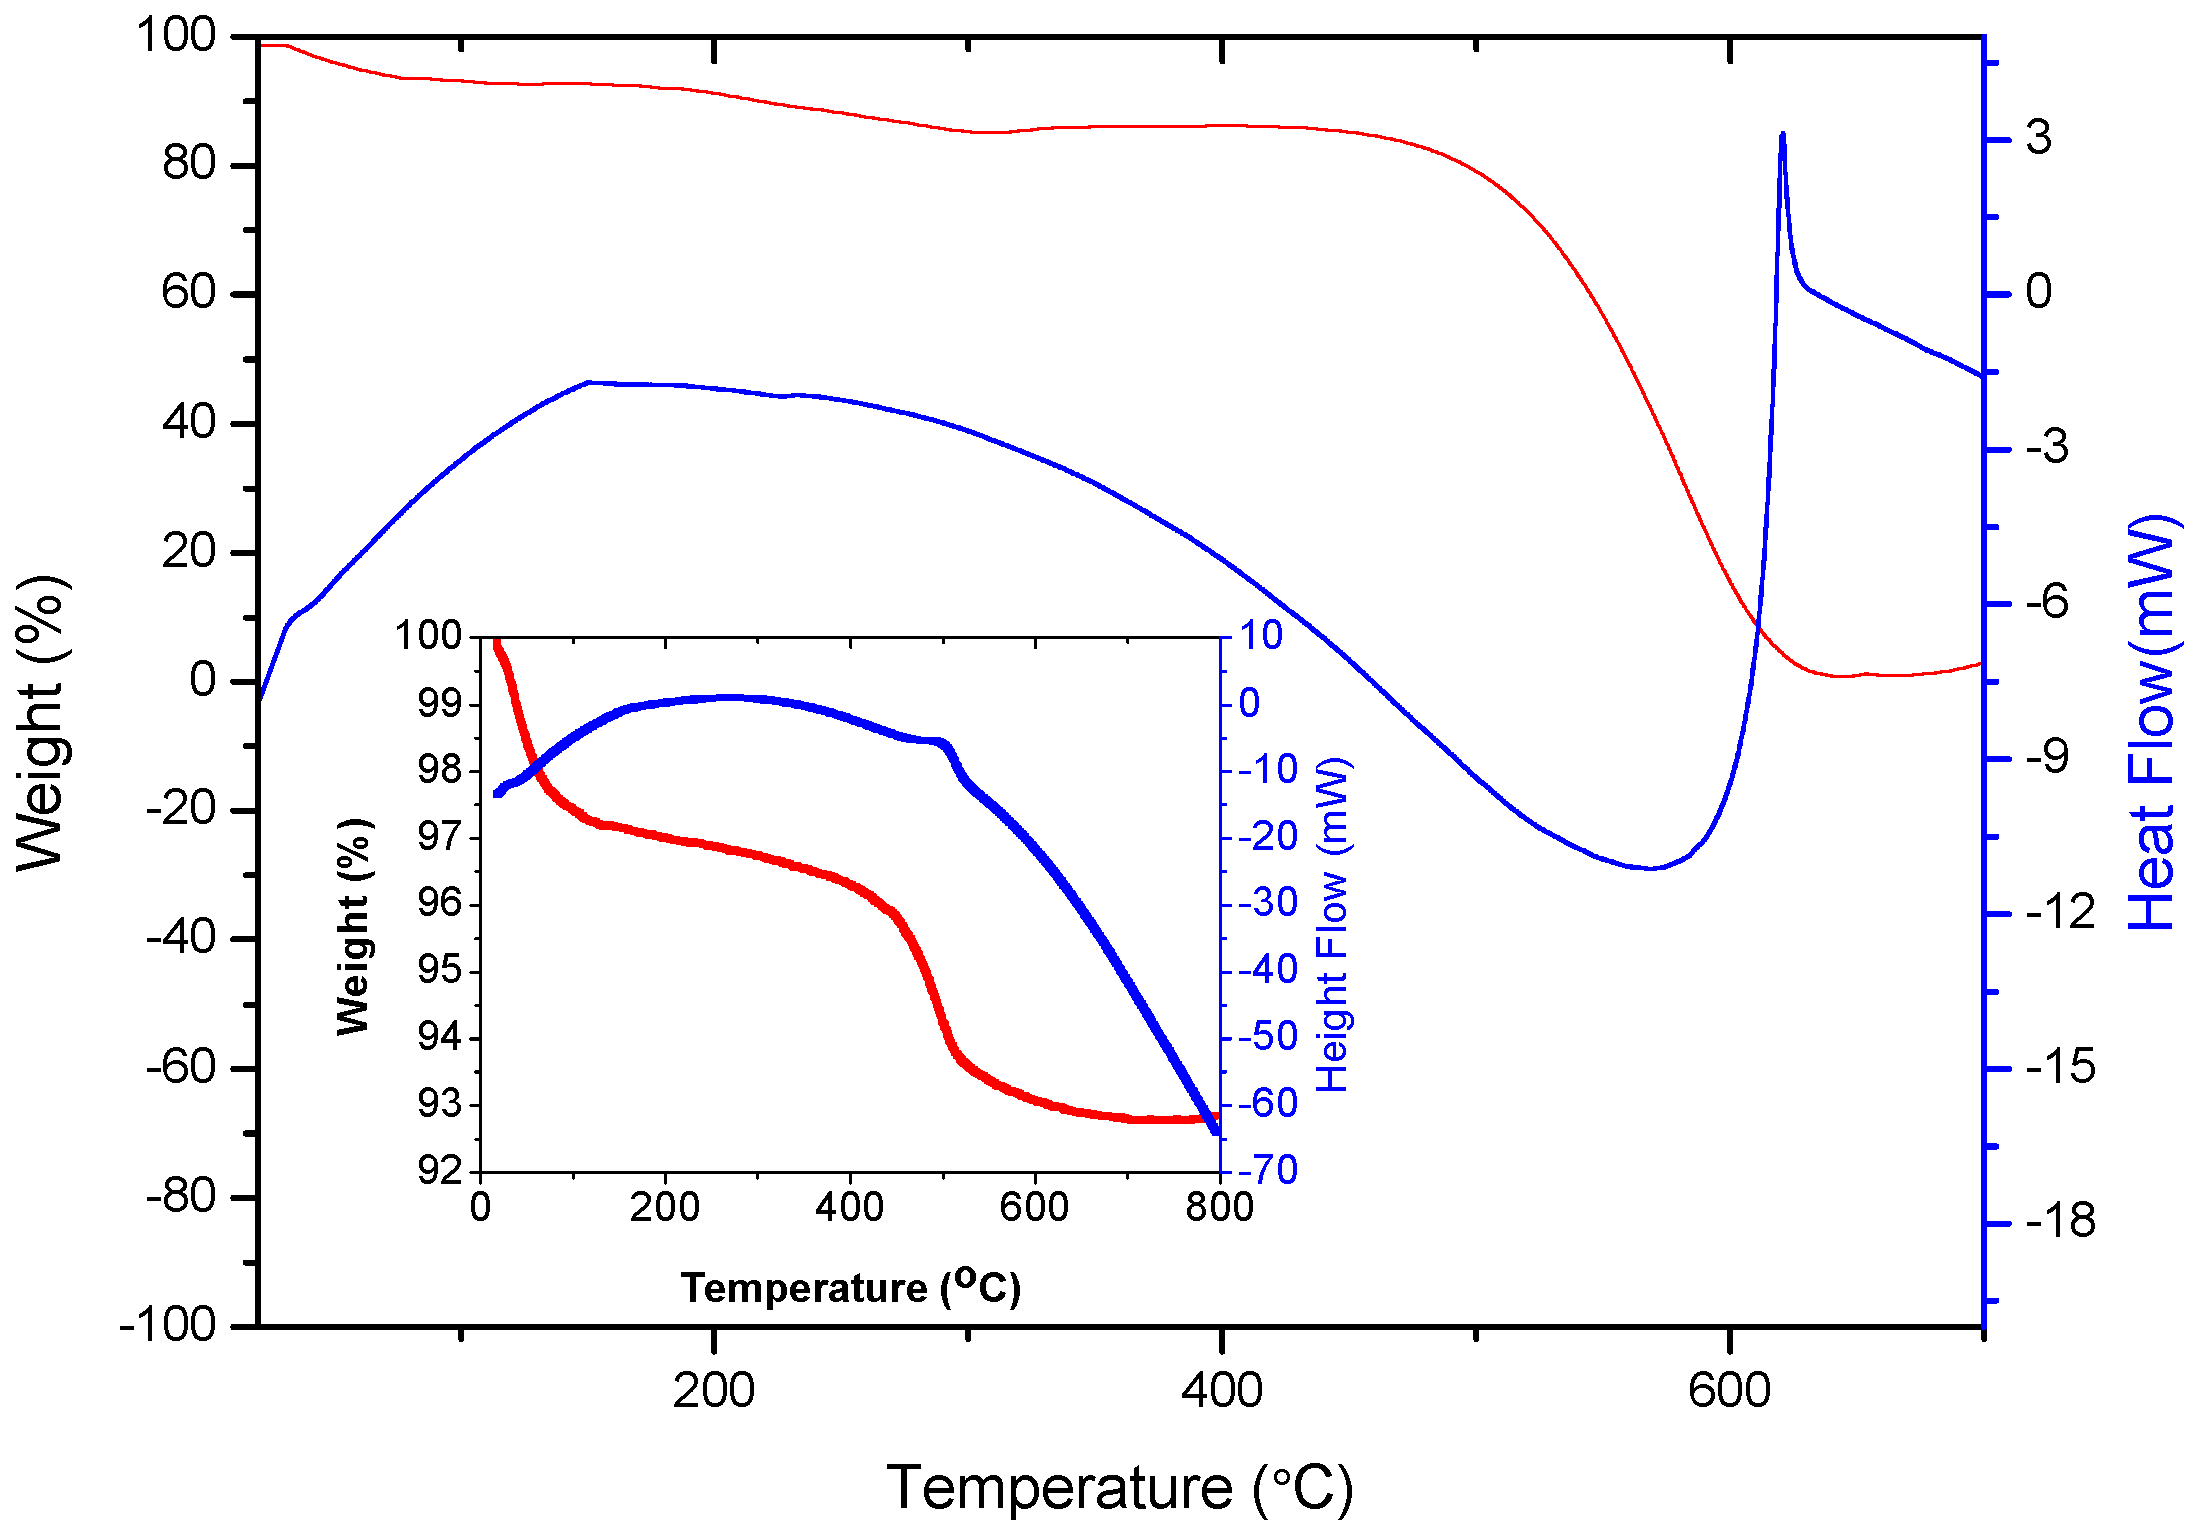
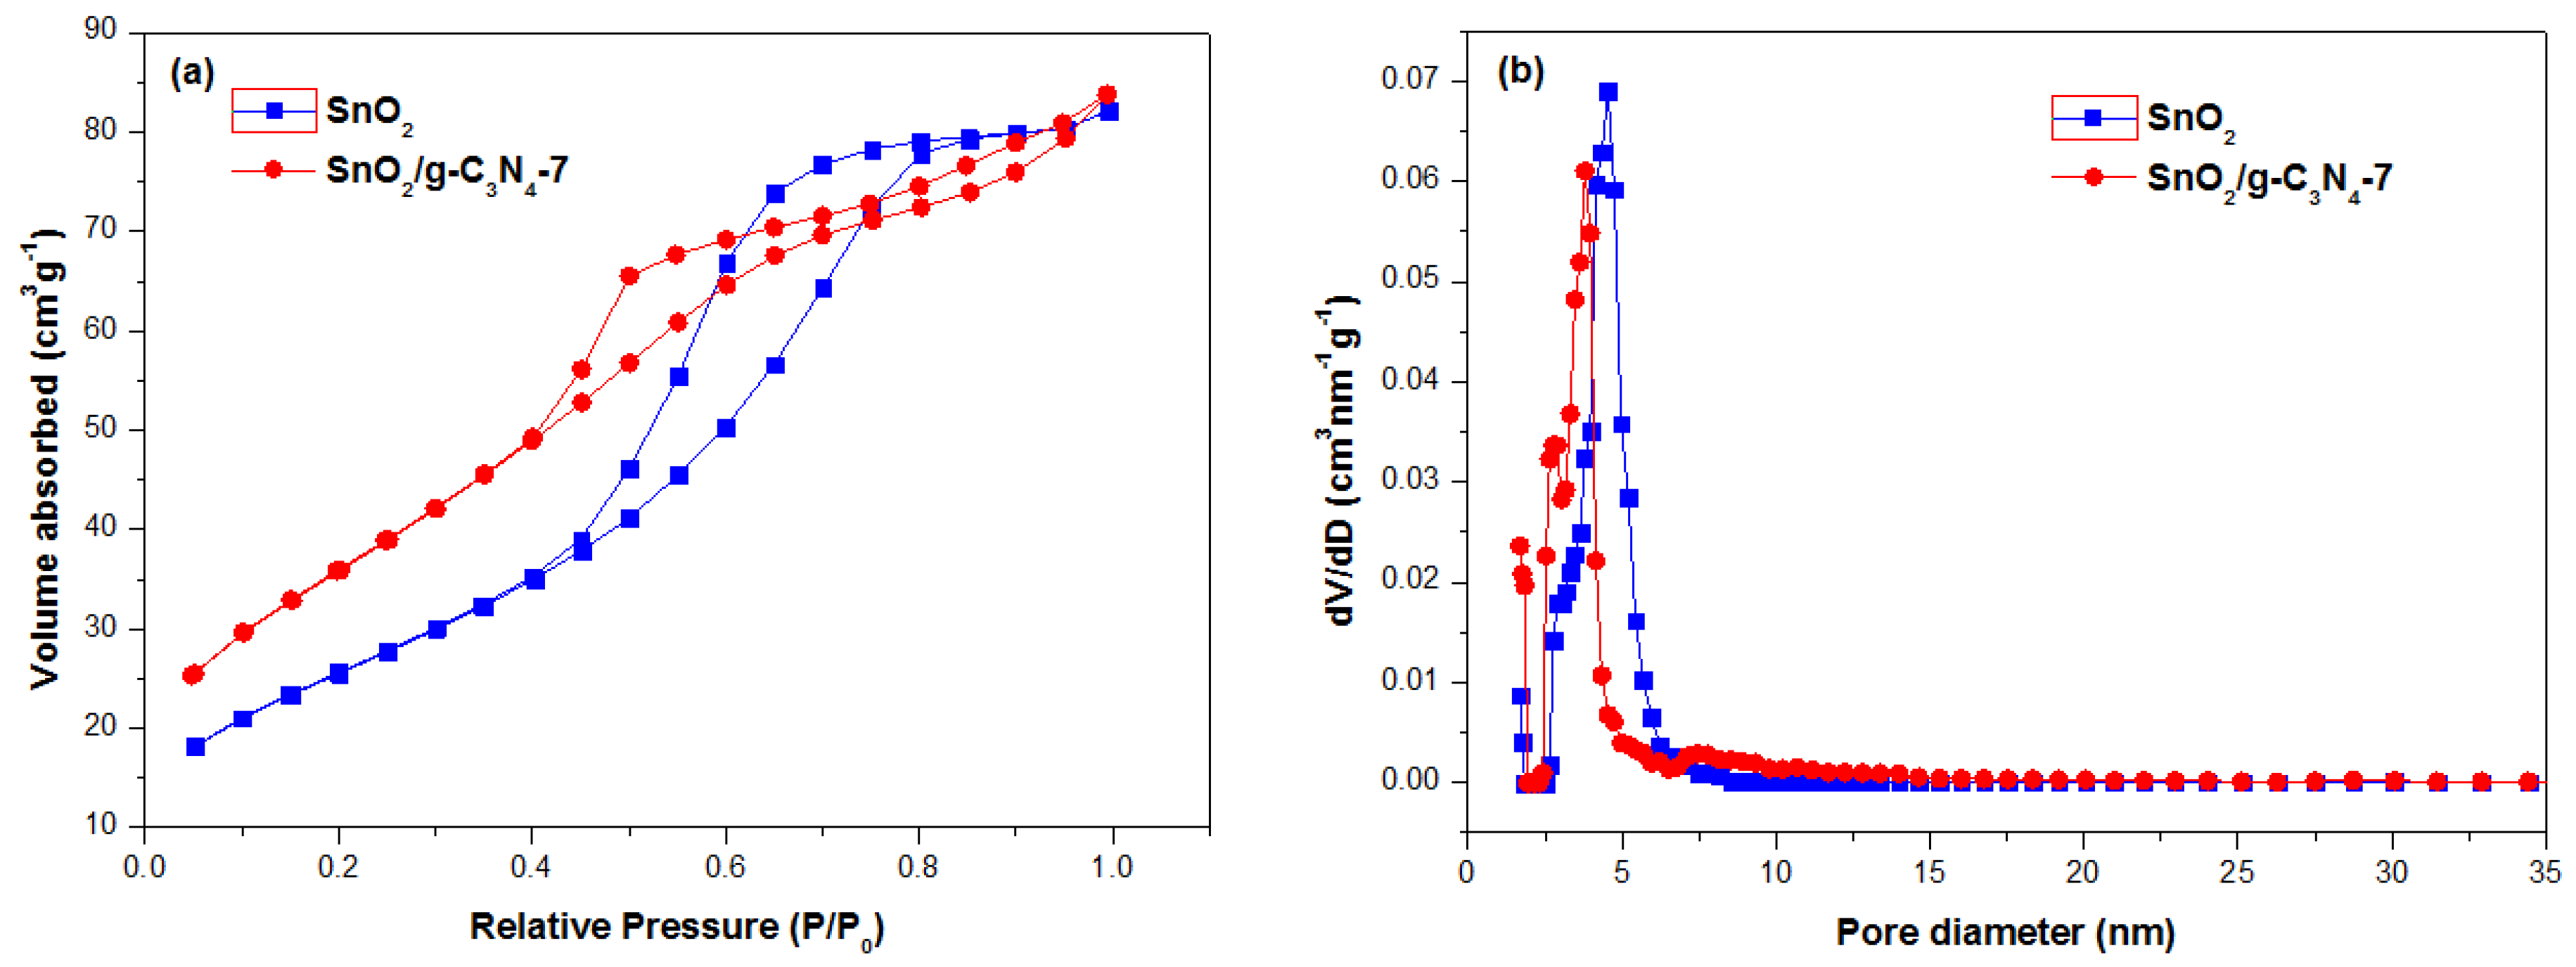
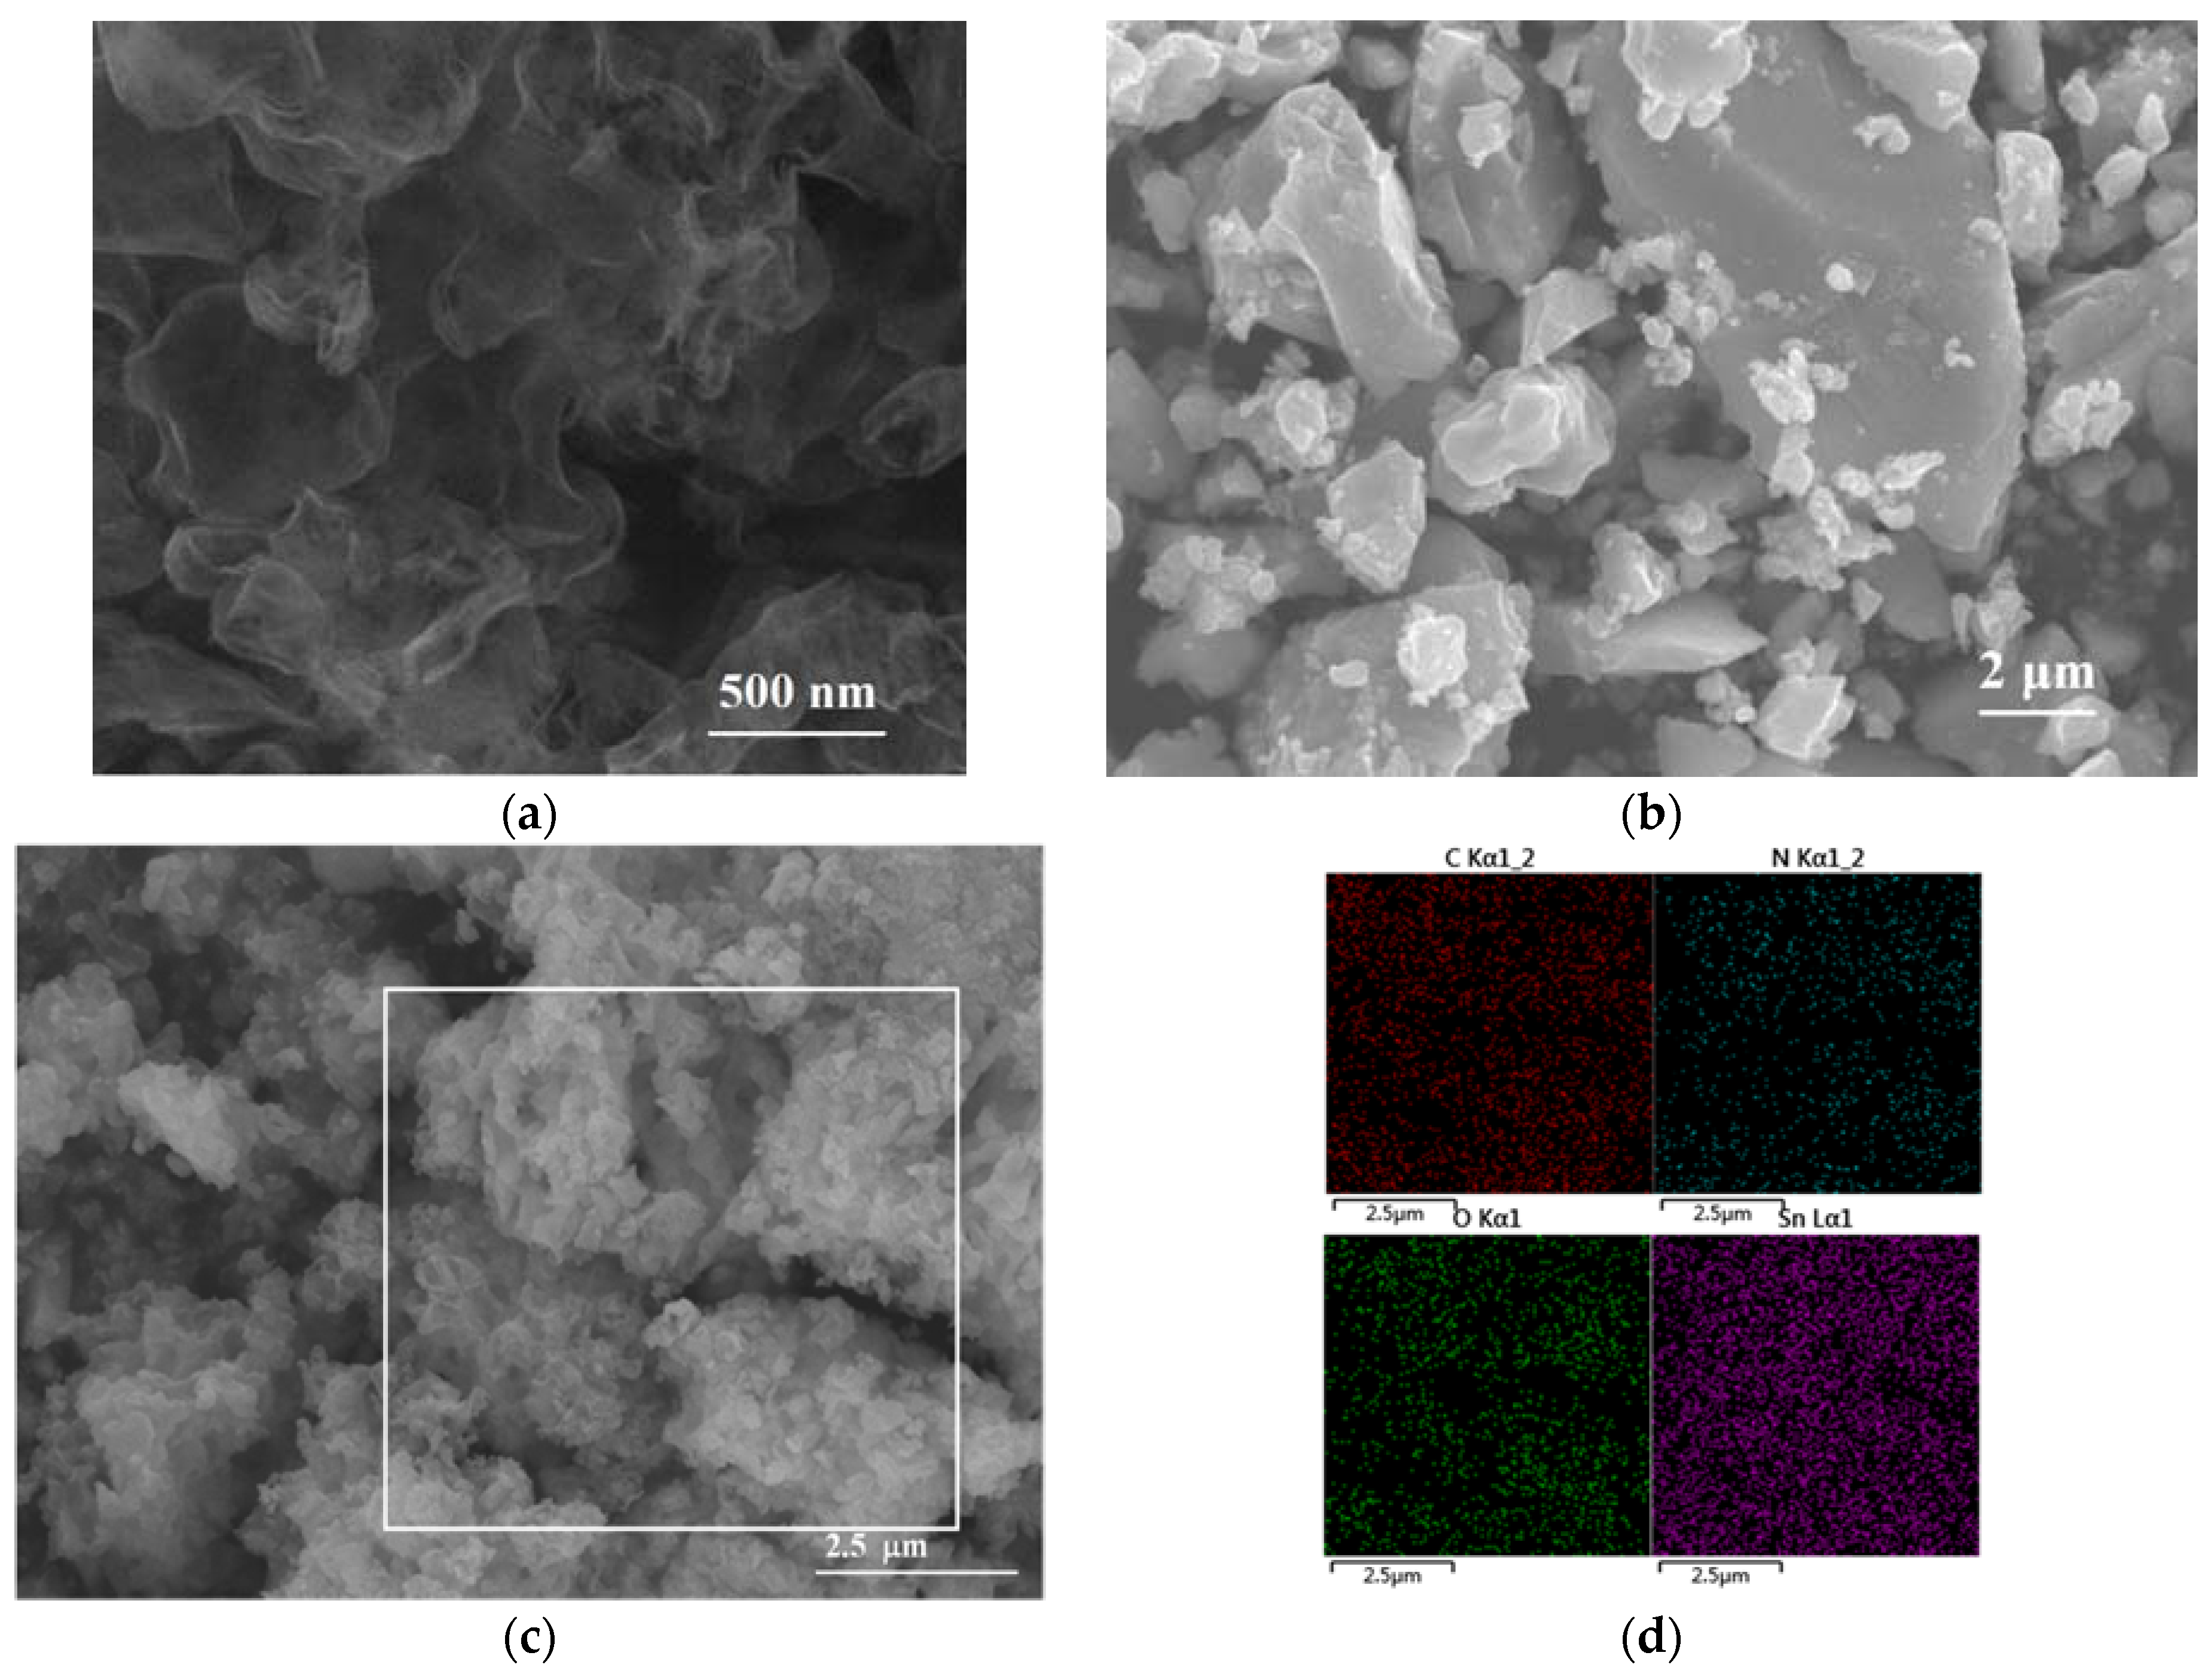
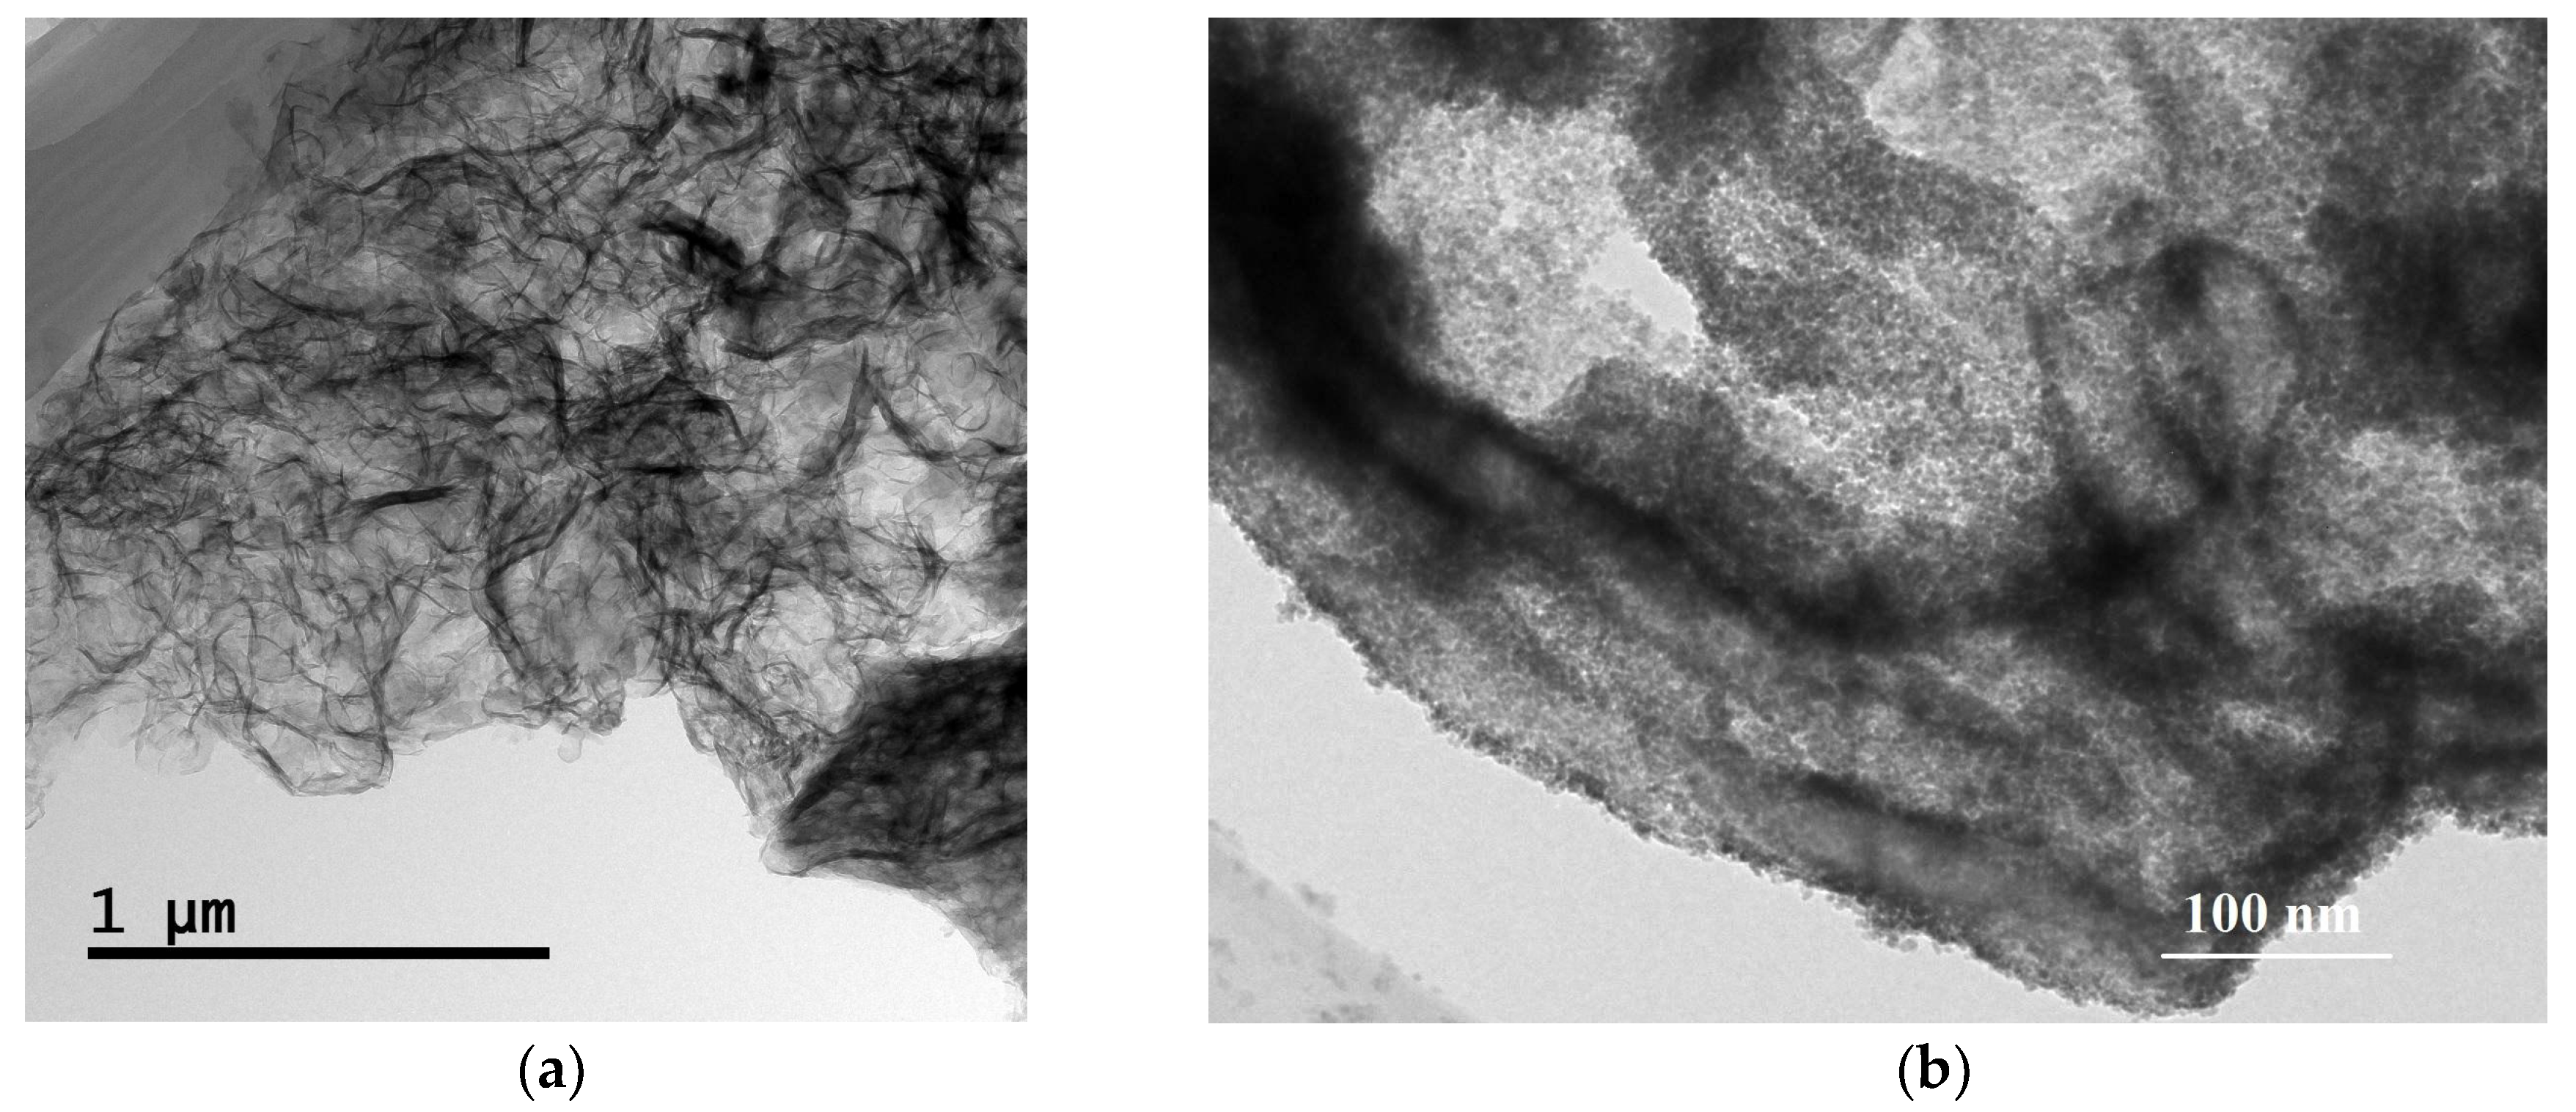
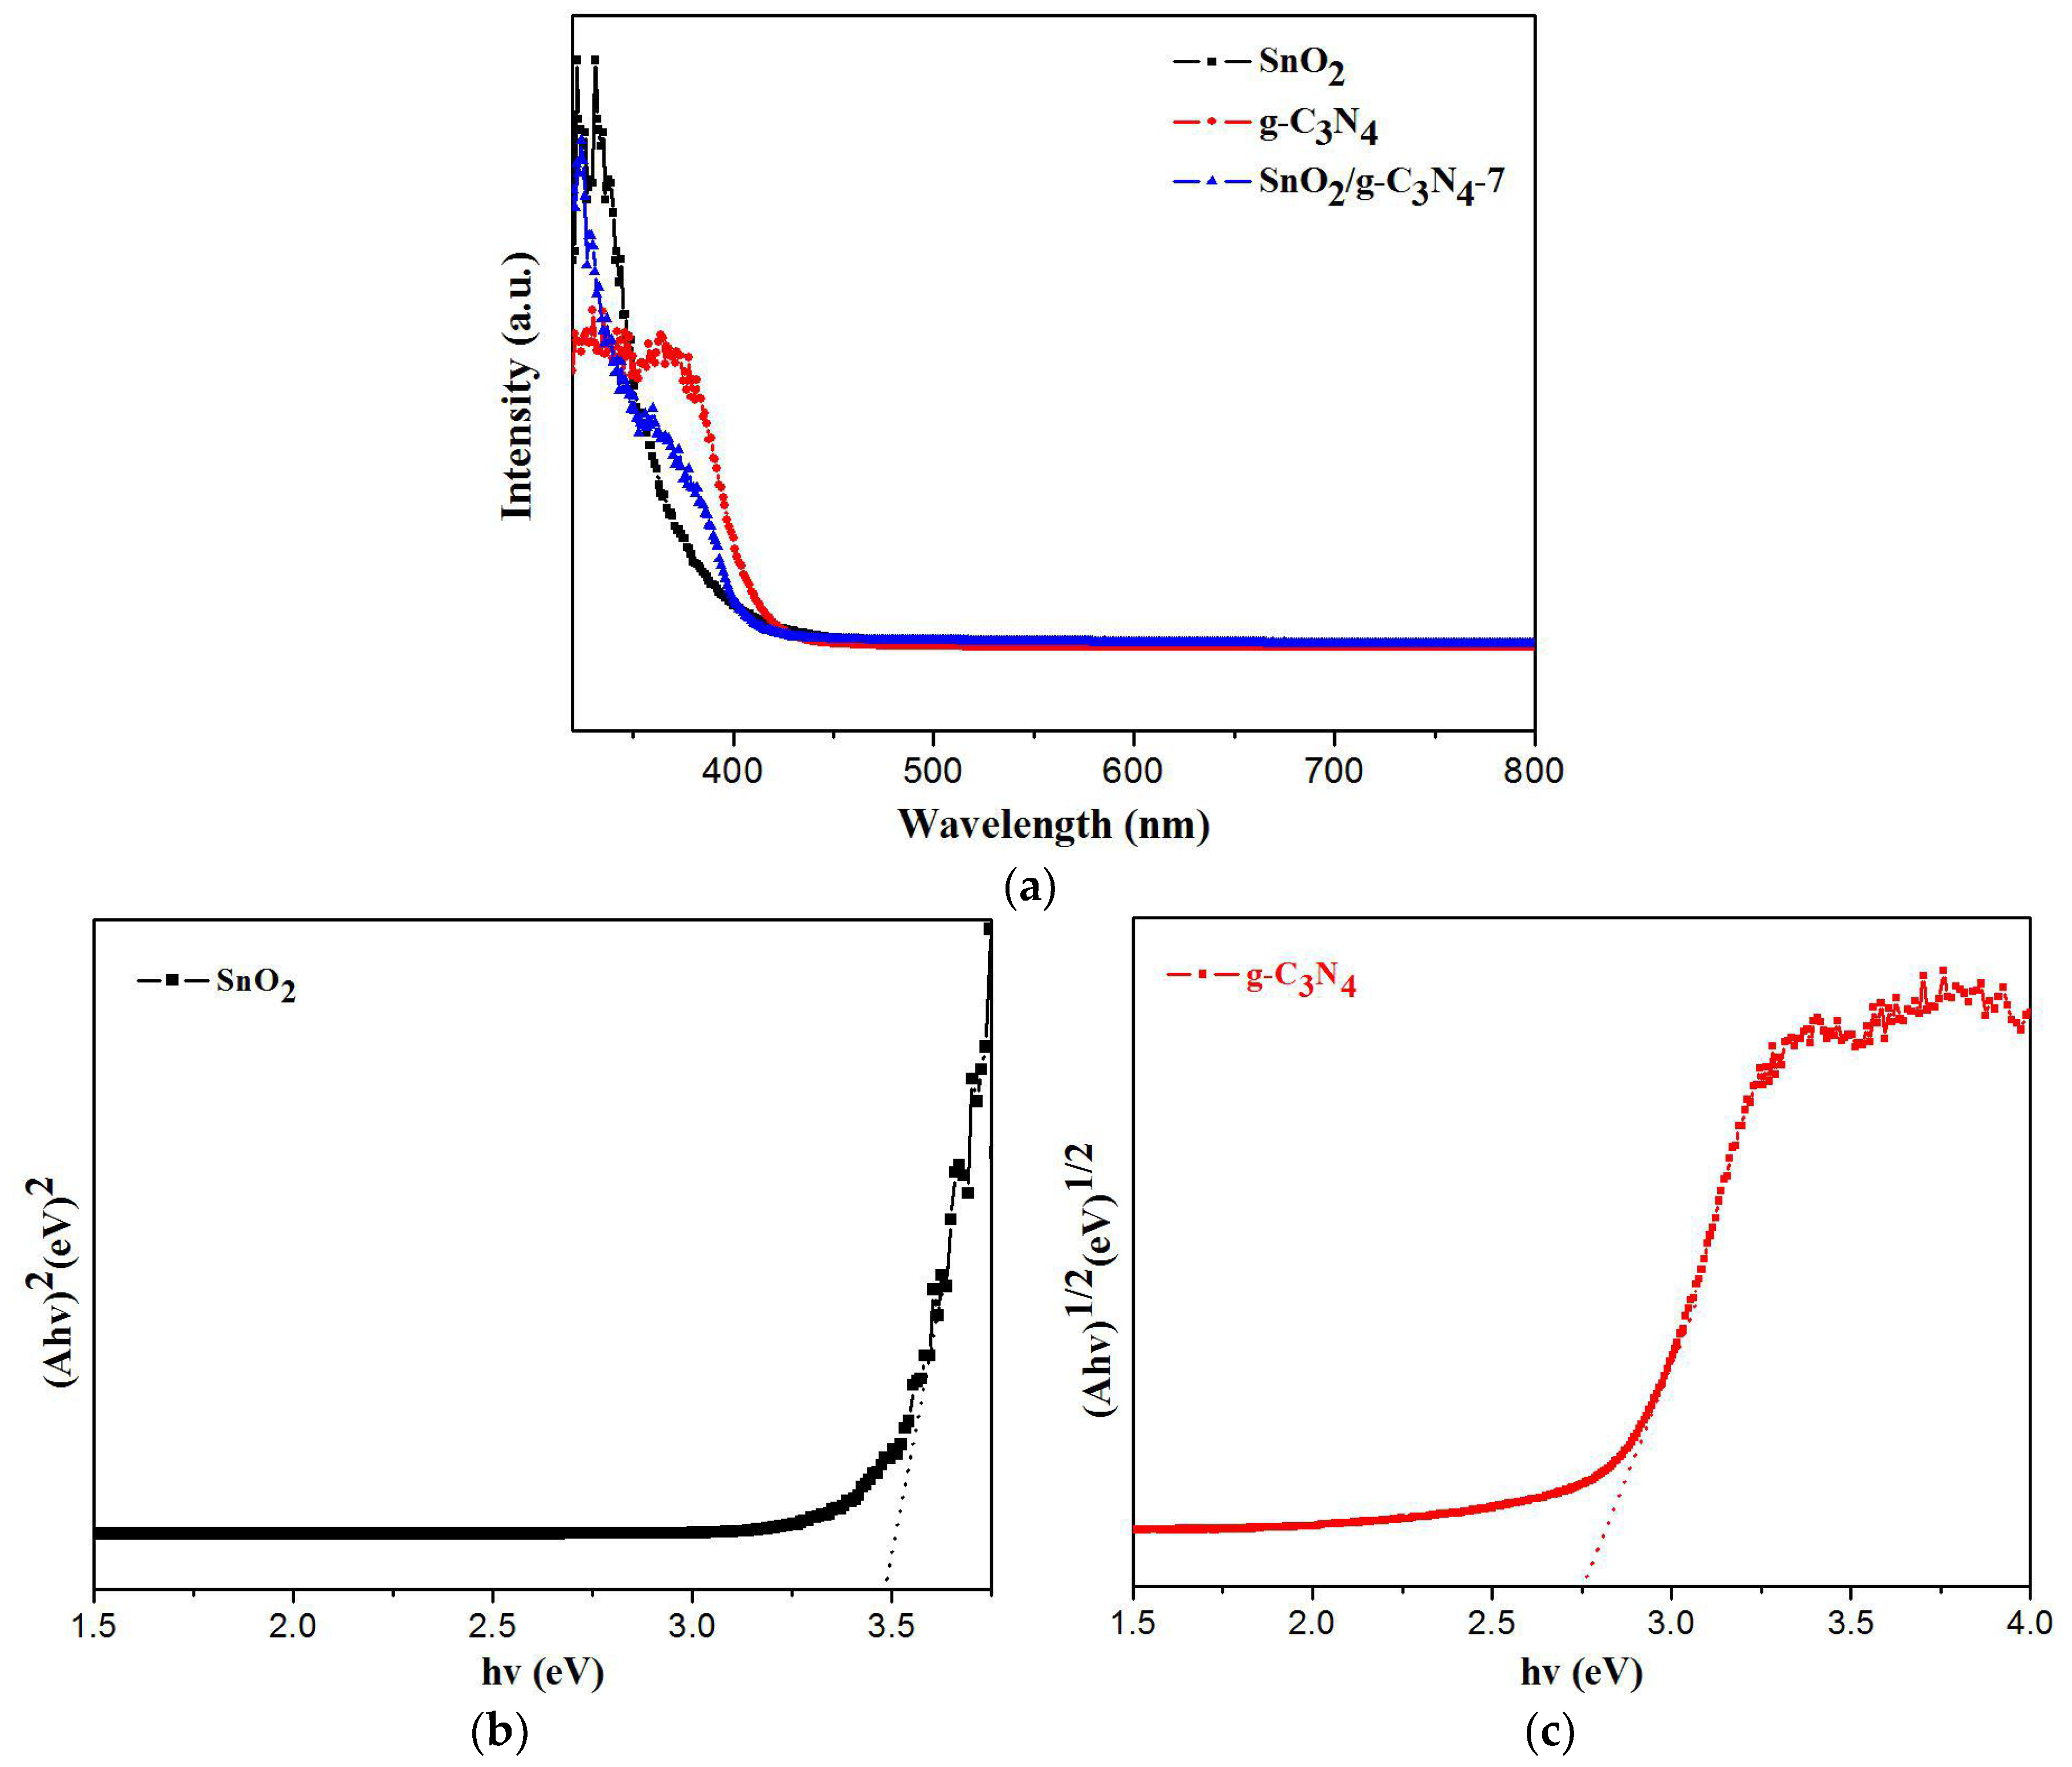
2.1. Sample Characterization

Figure 1 shows the XRD patterns of the as-prepared pure SnO2 particles and SnO2/g-C3N4 composites. As demonstrated by the curves, five distinct diffraction peaks around 26.6°, 33.8°, 37.9°, 51.7°, and 65.9° can be seen, which correspond to (110), (101), (200), (211), and (301) planes of the tetragonal rutile structure SnO2 (JCPDS Card No. 41-1445), respectively. However, the diffraction peaks of g-C3N4 in the SnO2/g-C3N4 composites are not observed in the curves. This may be due to the relatively small content of g-C3N4 in the composites. Another reason is that the peak around 27.5° of g-C3N4 is overlapped by the peak around 26.6° of SnO2.
The SEM images of the g-C3N4, SnO2, and SnO2/g-C3N4-7 composites are displayed in Figure 2. Figure 2a displays the SEM image of the g-C3N4 sample. We can see many wrinkles on the edge of the thin layers, which represents the nanosheet structure. Figure 2b shows many SnO2 particles agglomerated together with different sizes. This phenomenon indicates that pure SnO2 particles are easy to agglomerate, which is harmful to the process of gas adsorption. As shown in Figure 2c, many nanoparticles are attached to the g-C3N4 nanosheet. This could be beneficial to improving the gas-sensing properties. Figure 2d illustrates the typical EDS mappings of the SnO2/g-C3N4-7 composite recorded from the surface area that is observed in Figure 2c, in which four elements of C, N, Sn, and O are concurrently existent. It can be concluded that SnO2 and g-C3N4 are coexistent in the composite.
Figure 3 shows the TEM images of g-C3N4 and the SnO2/g-C3N4-7 composite. We can clearly see from Figure 3a that there are a lot of folds which seem like floccules, clearly demonstrating the existence of the g-C3N4 nanosheet. The lines represent the stacked rolled edges of the nanosheet structure. As seen from Figure 3b, the SnO2 particles are highly dispersed on the surface of the g-C3N4 nanosheet. This overcame the disadvantage of an easy agglomeration of SnO2 particles and further enhanced the specific surface area. Therefore, this test identifies it as an excellent candidate for gas-sensing materials.
TG-DTA was carried out to reveal the weight change situation of g-C3N4 and SnO2/g-C3N4-7. The temperature range is from room temperature to 700 °C, and the heating rate is 10 °C·min−1. As is shown in Figure 4, the red and blue lines correspond to weight and heat flow curves, respectively. The first agravity peak is between 100 °C and 300 °C, which is due to the desorption of moisture and the solvent. The second agravity peak is between 400°C and 600°C, which is due to the combustion of g-C3N4 in air. The inset in Figure 4 is the TG-DTA profiles of SnO2/g-C3N4-7. The agravic peak below 400°C is due to the desorption of solvent, and the remanent content of the composite is 92% after the combustion of g-C3N4. This result demonstrated that g-C3N4 was not decomposed at the optimum temperature of 300°C in the process of testing the gas-sensing properties.
Figure 5 depicts the N2 adsorption-desorption isotherms and the corresponding pore size distribution of the as-prepared SnO2 and SnO2/g-C3N4-7 samples. It can be seen from Figure 5a that the isotherms of the two samples show type IV, which are the typical characteristics of mesoporous materials according to the IUPAC. The well-defined hysteresis loop belonging to the H3-type clearly indicates the existence of an aggregation of the laminated structure with a narrow slit formed by the g-C3N4 and SnO2 nanoparticles. Figure 5b displays the corresponding pore size distribution of the two samples. It can be clearly seen that the pore diameter of SnO2 and SnO2/g-C3N4 are relatively small and that the majority concentrate upon 4.54 nm and 3.79 nm, respectively, according to the DFT method. The BET calculated results show that the specific surface area of the SnO2 and SnO2/g-C3N4-7 samples are 94.3 m2·g−1 and 132.5 m2·g−1, respectively. The specific surface area of the as-prepared composite has been significantly improved, which could be in favor of enhancing the gas-sensing properties.

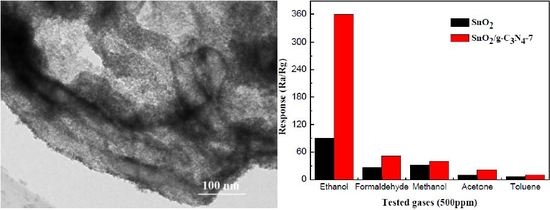
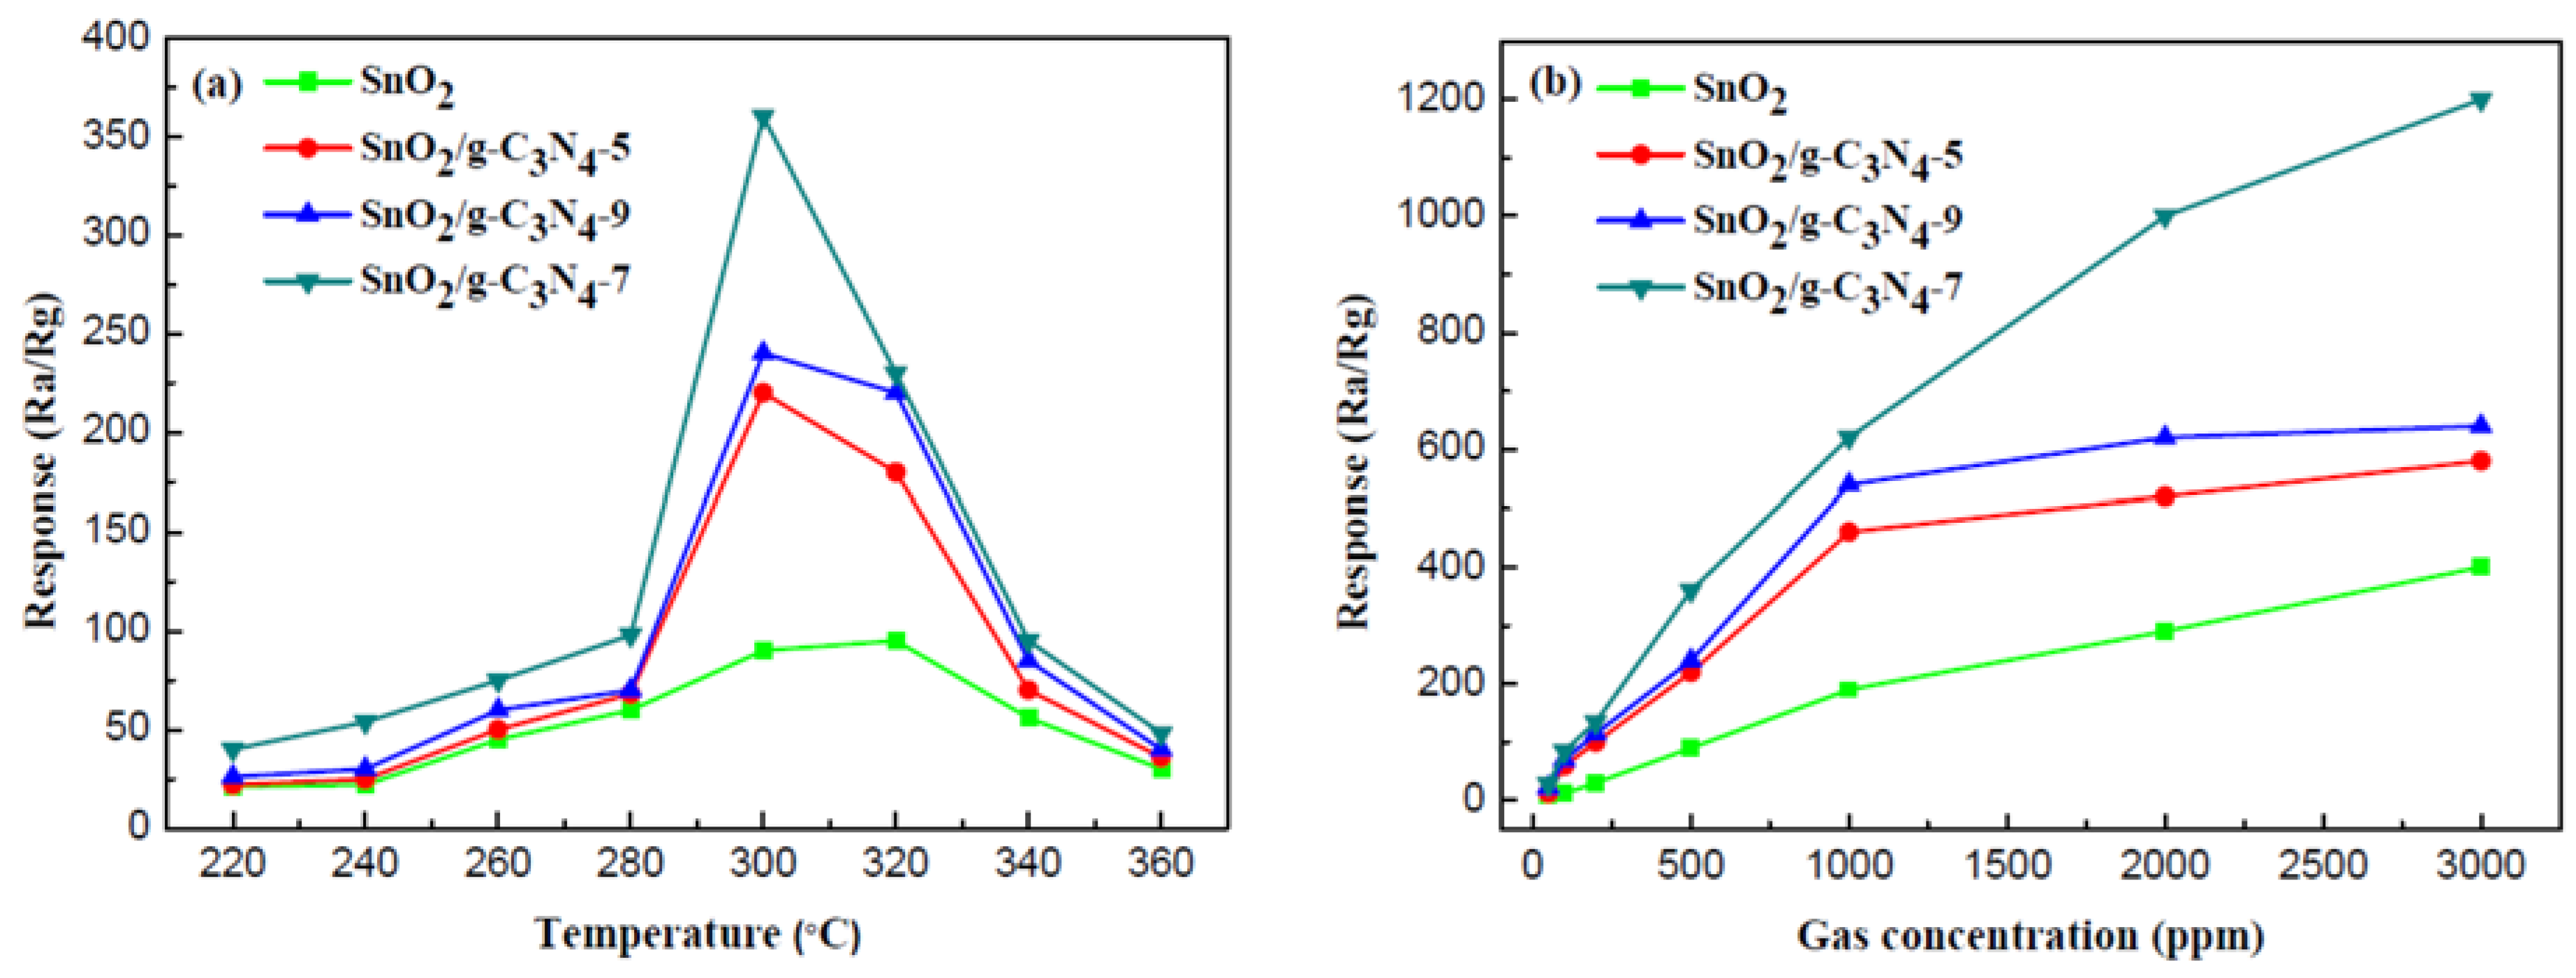
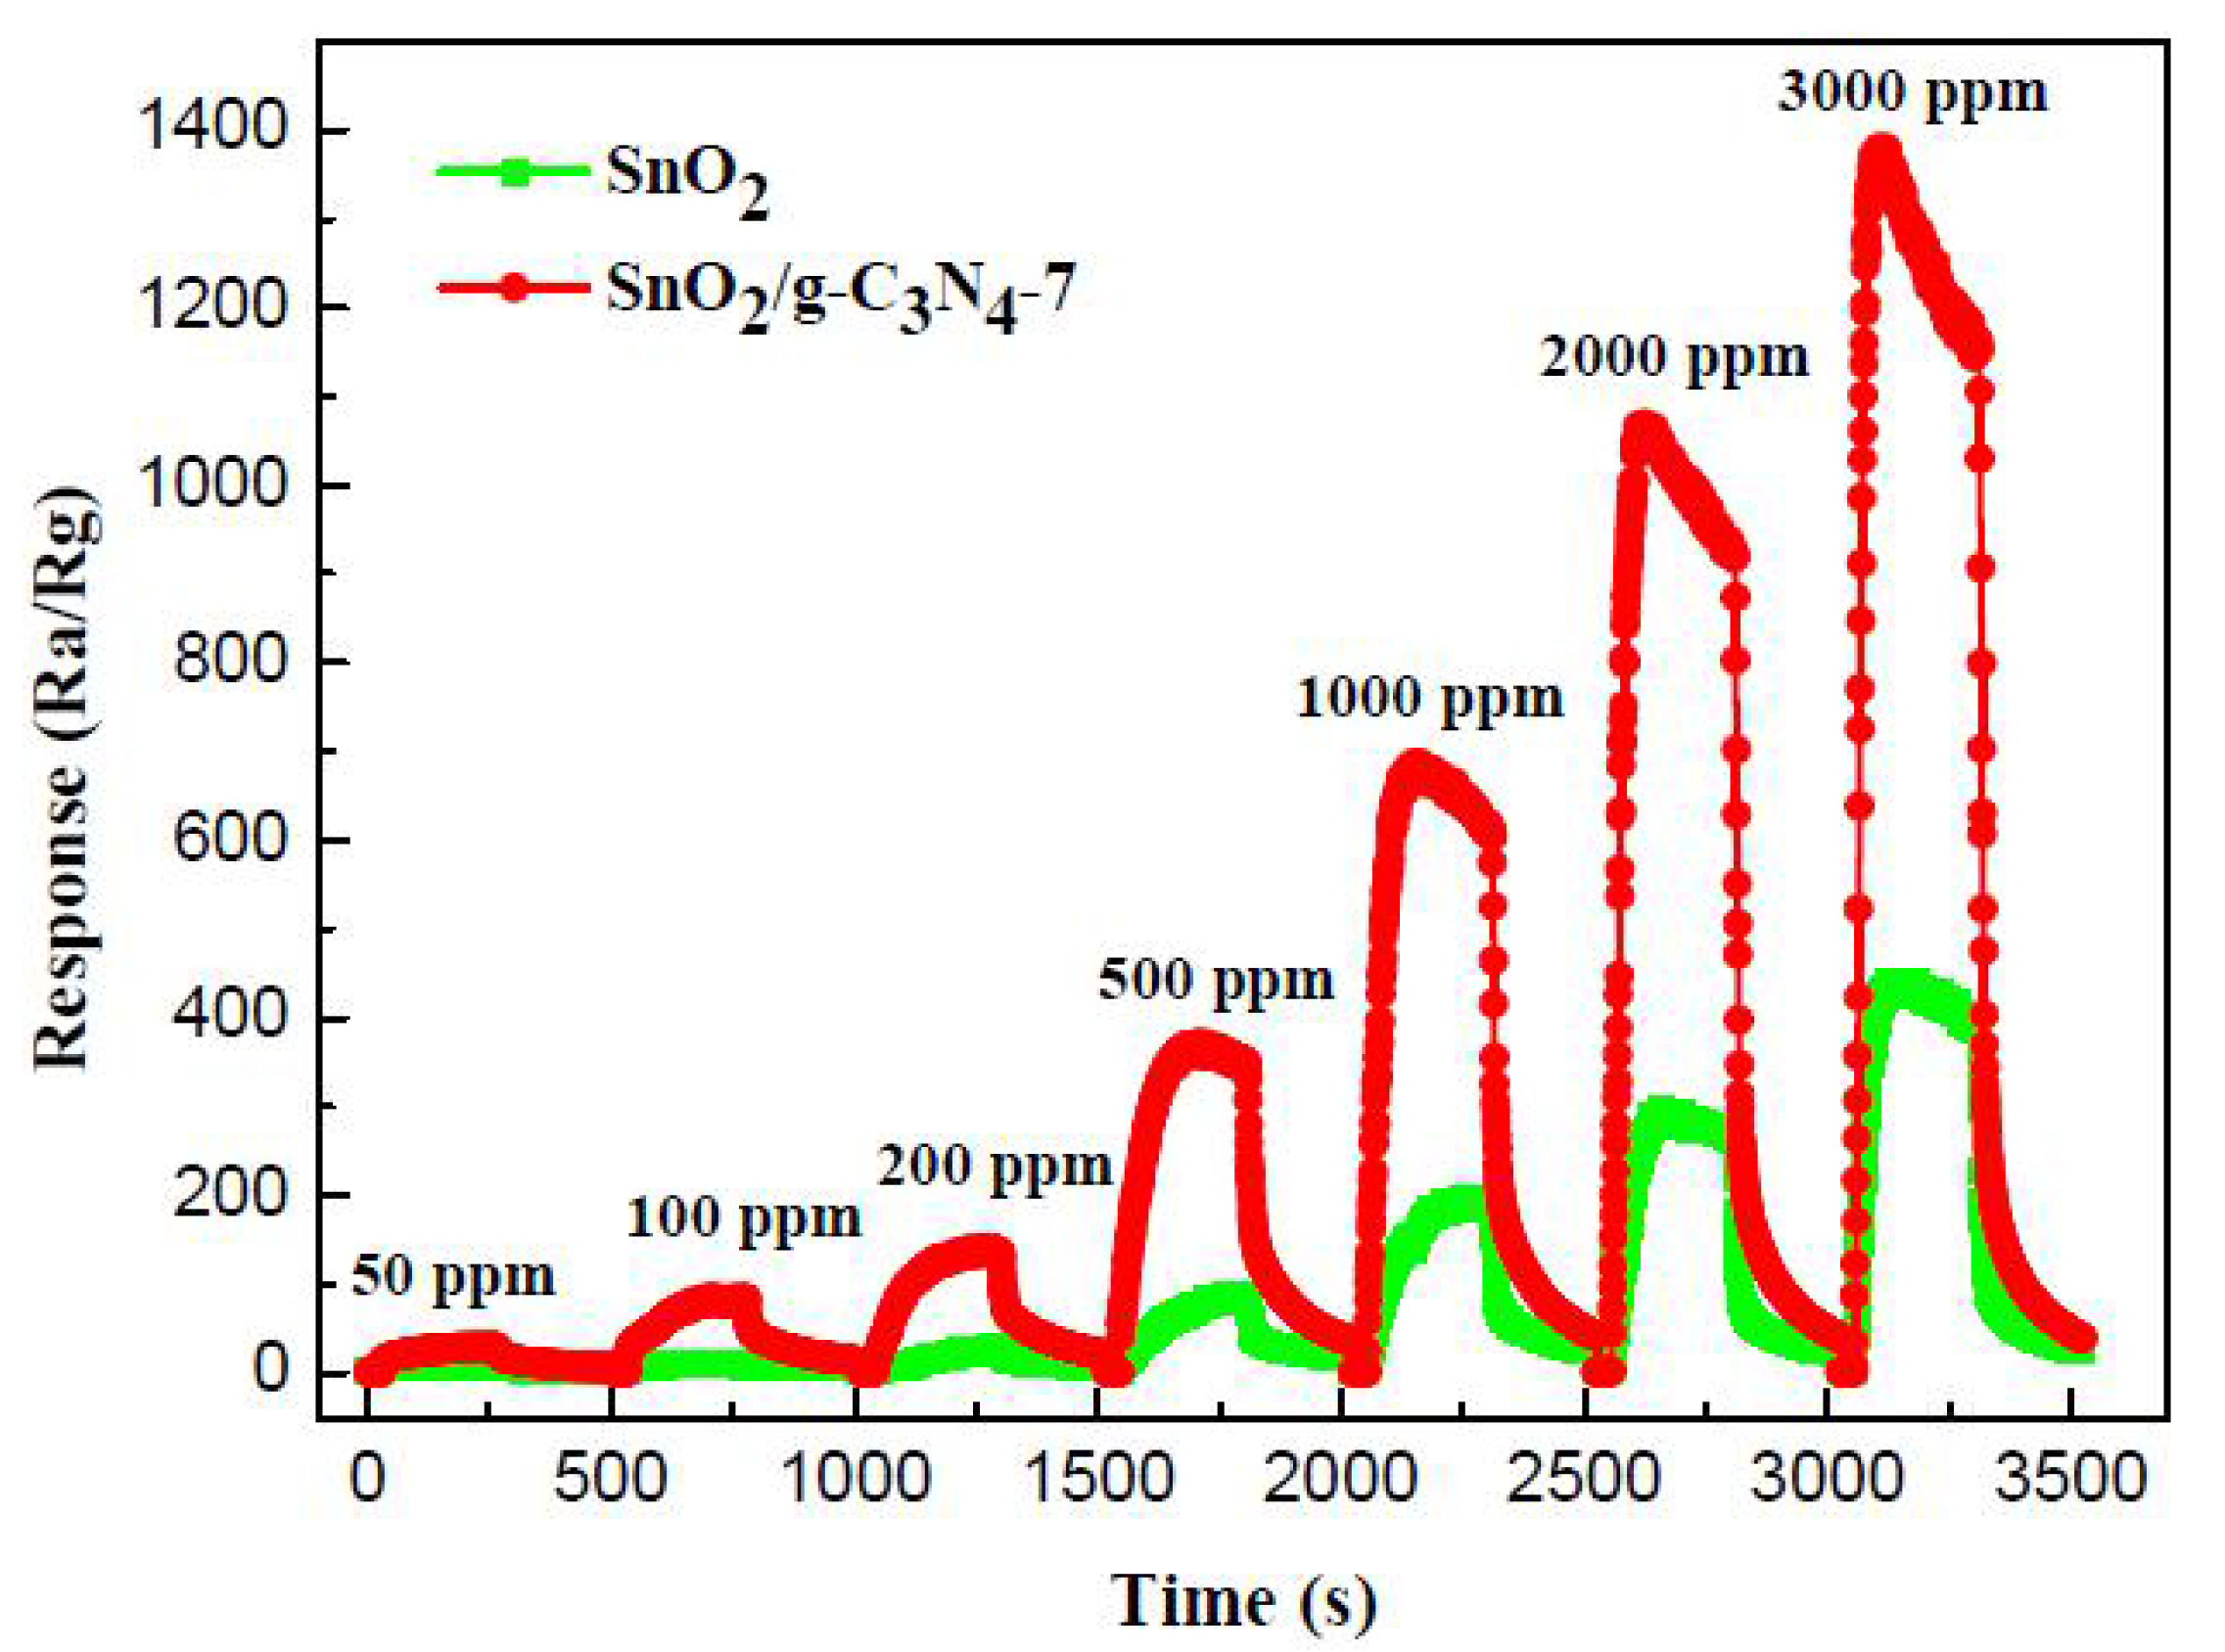
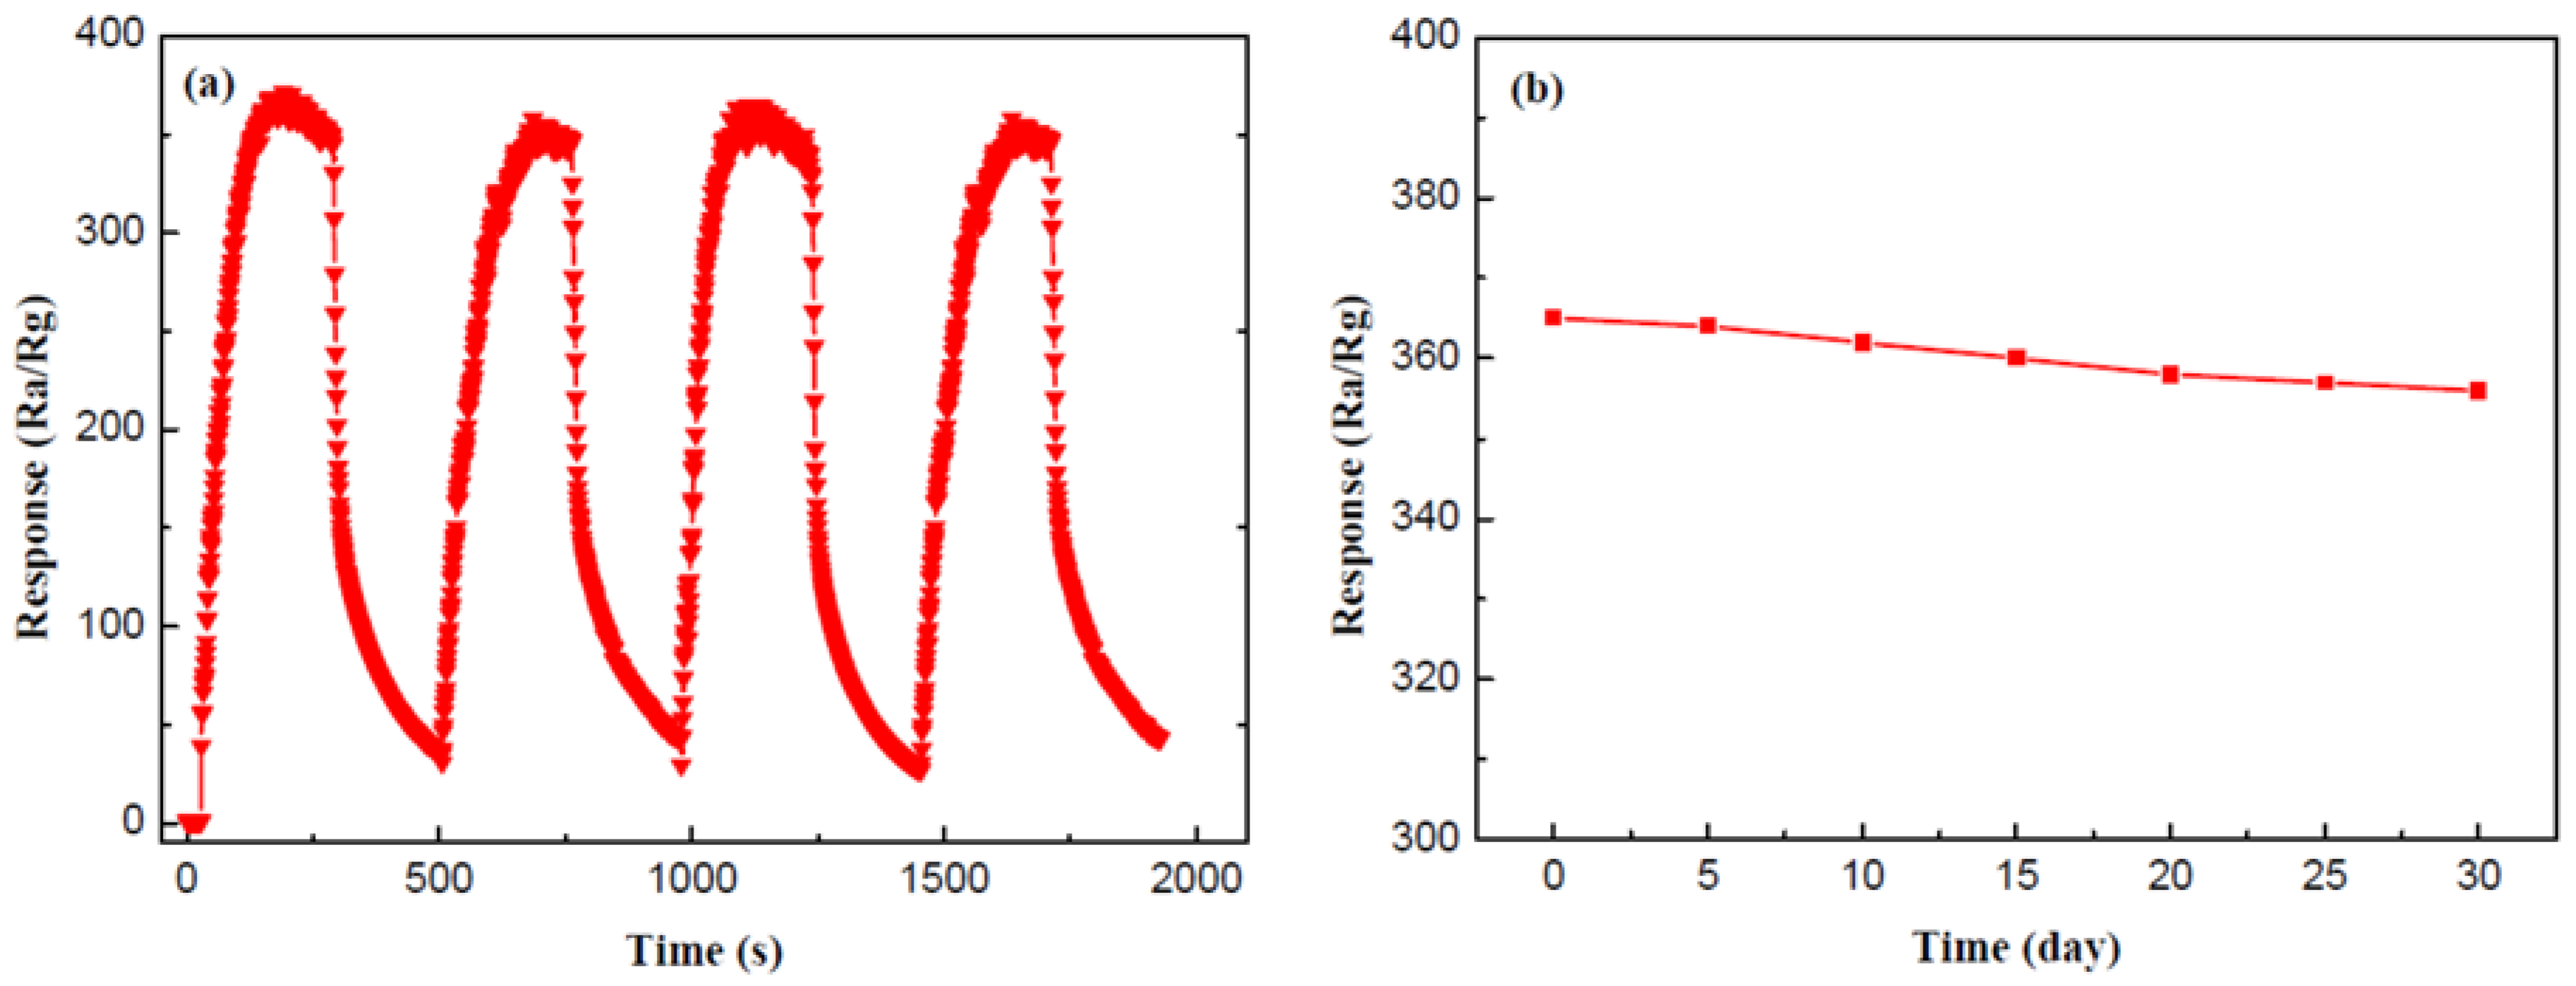
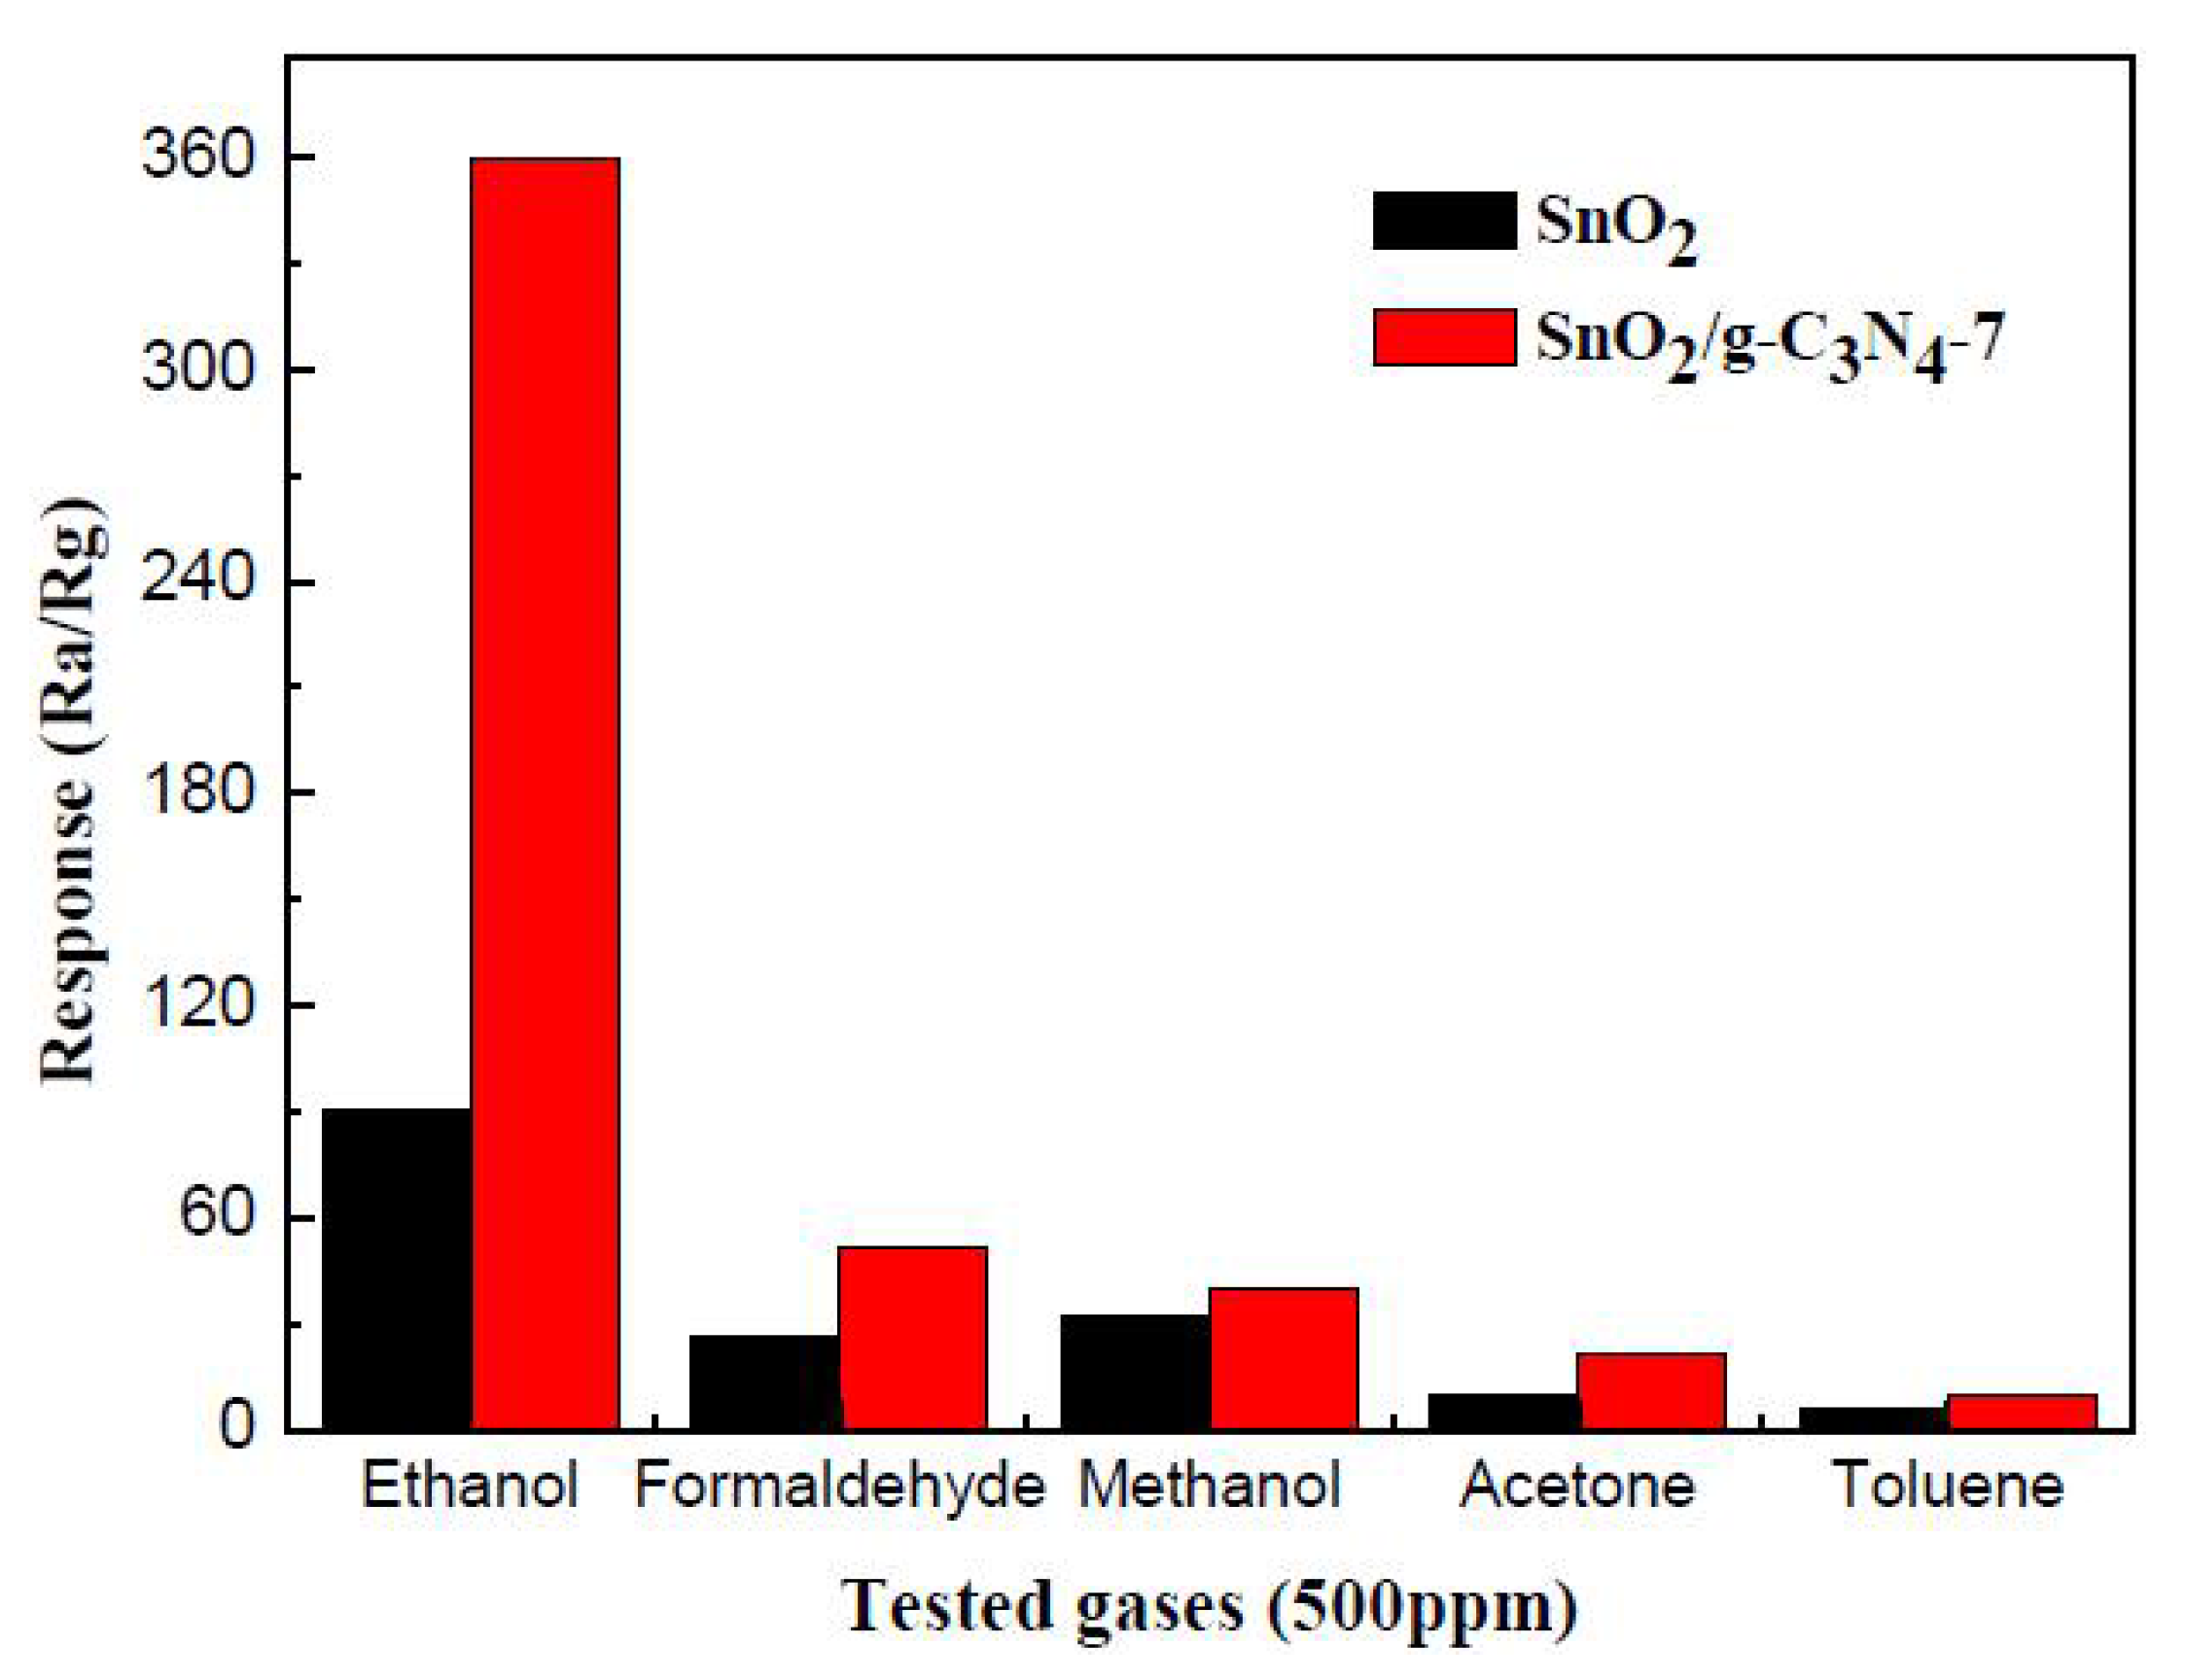
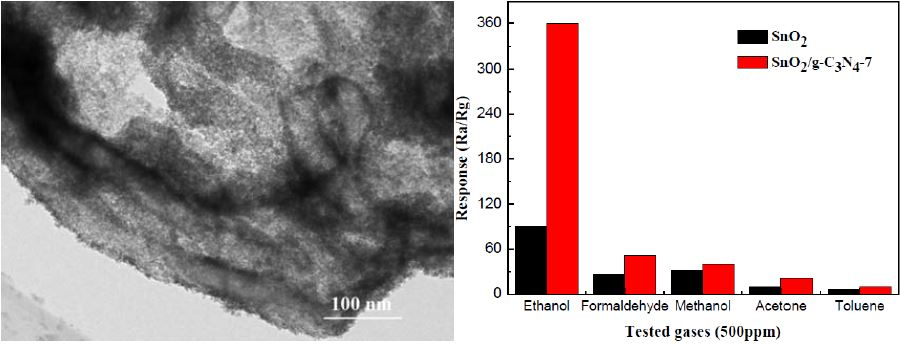
2.2. Gas-Sensing Performance

The gas-sensing properties of the as-prepared samples in relation ethanol were investigated, in detail. Figure 6a shows the response values of pure SnO2 and SnO2/g-C3N4-based sensors to 500 ppm ethanol at different operating temperatures. It can be clearly observed from the line chart of the three SnO2/g-C3N4 samples that the response values increase with the increase of the operating temperature under 300 °C. However, the response values decrease when the temperature is above 300 °C. The maximum response of SnO2/g-C3N4-7 is 360 at 300 °C. In stark contrast, the maximum response of the pure SnO2 is only 95 at 320°C. This phenomenon can be explained by the fact that the SnO2/g-C3N4-7-based sensor can tend to the balance between the speeds of chemical adsorption and desorption at a lower temperature, and reach a higher response than that of the pure SnO2 sensor. This result indicates that the SnO2/g-C3N4-based sensor has a great influence and enhances the gas-sensing properties for ethanol. It reaches the maximum response when the mass percentage of g-C3N4 in the composites is 7%. The specific surface area of the SnO2, SnO2/g-C3N4-5, SnO2/g-C3N4-7, and SnO2/g-C3N4-9 composites is 94.3 m2·g−1, 113.8 m2·g−1, 132.5 m2·g−1, and 122.2 m2·g−1, respectively. When the g-C3N4 content in the composites exceeds a certain value (e.g., 7 wt % in this work), it may form the connection of bulk. As a result, the specific surface area of the composite will decrease and there will be a reduced number of active sites for the adsorption of oxygen and ethanol gas, leading to the degradation of gas-sensing properties. Consequently, the gas sensor performance increases at first and decreases when the g-C3N4 content in the composites increases. A suitable amount of g-C3N4 in the composite is beneficial to the dispersity, and a preferable heterojunctional structure can be formed in the interface region between 2D g-C3N4 and SnO2. A high content of 2D g-C3N4 may lead to the connection of the g-C3N4 nanosheets, which could form micro electric bridges on the surface. The micro electric bridges may result in the semiconductor’s resistance being reduced, causing a reduction in the gas sensor performance. Figure 6b displays the response values of the four samples at 300 °C to different concentrations of ethanol. As shown in the line chart, the response values increase with the increasing ethanol concentrations. The slope of the curves increases rapidly when the concentration range of ethanol is from 50 ppm to 500 ppm. However, it increases slowly gradually with an increasing concentration in the range of 500–3000 ppm. Furthermore, the responses of the SnO2/g-C3N4 sensors are much higher than that of pure SnO2. It can be concluded that the adsorption of ethanol has approached the saturation value when the concentration reaches 3000 ppm.
Figure 7 displays the real time successive response-recover curves of the pure SnO2 and SnO2/g-C3N4-7 to 500 ppm ethanol in the range of 50–3000 ppm at 300 °C. As shown by the curves, the response values of both sensors increase with the increasing concentration. The response value of the SnO2/g-C3N4-7-based sensor is much higher than that of the pure SnO2-based sensor to the same concentration of ethanol. The gas-sensing properties of the composites enhanced a lot, which is consistent with the expected.
The repeatability and stability are both crucial criteria to measure the gas-sensing properties. Figure 8a reveals the repeatability of the SnO2/g-C3N4-7 sensor to 500 ppm ethanol at 300 °C. As shown by the curves, the response values of the four response-recovery cycles are almost maintained at about 360. It can be concluded that the composite sensor has an admirable repeatability for ethanol gas sensing. A durable response value was measured to explore the stability of the SnO2/g-C3N4-7 sensor. Figure 8b displays the test result every five days, and the response values to 500 ppm ethanol at 300 °C are maintained at around 360. Therefore, we may safely draw the conclusion that the SnO2/g-C3N4-7-based sensor has an unexceptionable stability for ethanol gas sensing.
It is generally known that selectivity is another key criterion of gas sensors. Figure 9 summarizes the selectivity test results of the pure SnO2 and SnO2/g-C3N4-7 sensors to five different gases of 500 ppm, including methanol, ethanol, toluene, formaldehyde, and acetone. It can be seen that the SnO2/g-C3N4-7 sensor exhibits a higher response to ethanol than to other gases compared to the pure SnO2 sensor. The higher responses to ethanol may be because ethanol is more likely to lose electrons in the process of the redox reaction with the absorbed oxygen and hydroxyl group (−OH) and is much easier to oxidize at the optimum operating temperature [35].
The gas-sensing performance of different sensing materials when using ethanol is listed in Table 1. As can be seen from Table 1, the response values of Fe2O3 nanoparticles coated with SnO2 nanowires [14], α-Fe2O3/g-C3N4 [35], RGO-SnO2 [36], and Au/SnO2 [37] were 31.18, 7.76, 70.4, and 18, respectively. In this work, the response value of SnO2/g-C3N4-7 to 100 ppm of ethanol vapor was 85 at 300 °C. Therefore, the SnO2/g-C3N4 composites show an excellent sensing property to ethanol vapor, and thus have a great potential application.
As displayed in Figure 10a, the absorption edge of SnO2, SnO2/g-C3N4-7 and g-C3N4 are around 377 nm, 441 nm, and 455 nm, respectively. This result can be ascribed to the heterojunction structure between SnO2 and g-C3N4. The band gap energies of SnO2 and g-C3N4 can be estimated according to the equation (Ahν = k(-Eg)n/2). In this equation, n is determined by the type of optical transition of a semiconductor. The value for g-C3N4 and SnO2 is 4 and 1, respectively. A, ν, Eg, k and h are the absorption coefficient, light frequency, Planck constant, band gap and a constant, respectively. The diagrams are shown in Figure 10b,c. The Eg of SnO2/g-C3N4-7 should be roughly calculated according to the equation (Eg = 1240/λ) because of the uncertain type of optical transition. As a result, the Eg of SnO2, g-C3N4, and SnO2/g-C3N4-7 are 3.49 eV, 2.75 eV, and 2.81 eV, respectively.
The sensing mechanism of the SnO2/g-C3N4 composite towards ethanol gas need to be further investigated. When the sensor was exposed in air, oxygen molecules were adsorbed on the surface of SnO2 and capture electrons from the conduction band of SnO2. Then oxygen molecules were ionized to O2−, O, and O2, and the formation of depletion layers led to the increase in the resistance of the composite sensor. However, when the sensor was exposed to the ethanol gas, the ethanol molecules proceeded oxidation and the reduction reaction with oxygen ions absorbed on the surface of the sensor. Concurrently, the ethanol molecules were oxidized into acetaldehyde and eventually turned into carbon dioxide and water [24]. As a result, the trapped electrons were released back to the depletion layer of the sensing film, resulting in the decrease in the resistance of the composite-based sensor. The SnO2/g-C3N4 composite exhibited more preferable gas-sensing properties than that of pure SnO2. This is mainly due to the high specific surface area and the interaction between g-C3N4 and SnO2. The presence of g-C3N4 can prevent the aggregation of SnO2 particles to form a high surface approachability structure, leading to the promotion of the adsorption and diffusion process of ethanol molecules. In this composite, the s-triazine structure g-C3N4 sheet substrate can provide more active sites to adsorb O2 molecules. The elevated gas-sensing properties may also be due to the interactions between Sn and g-C3N4, and the heterojunction of the interface region between g-C3N4 and SnO2. The electrical property at the heterojunction changes when ethanol gas molecules pass through the interface region between g-C3N4 and SnO2. Both SnO2 and g-C3N4 are n-type semiconductors. The band gaps are 3.71 eV and 2.7 eV, respectively. The conduction band level of g-C3N4 is more negative than SnO2. When SnO2 and g-C3N4 were combined, they formed a heterojunction structure. The electrons will thus inflow from the conduction band of g-C3N4 to the conduction band of SnO2, leading to a higher potential barrier. As a result, the electrons and holes are separated [38]. Meanwhile, the heterojunction structure may suppress the recombination of the electron-hole and urge electrons to quickly transfer from the ethanol vapor to the surface of SnO2/g-C3N4. Therefore, this leads to a higher response because of the increased conductivity of the heterojunction structure [35]. This co-adjacent retiform structure could provide more accesses for the gas adsorption and diffusion between SnO2 and ethanol molecules.
O 2   + e O 2
2 CH 3 CH 2 OH + O 2 2 CH 3 CHO + 2 H 2 O + e
2 CH 3 CHO + 5 O 2 4 CO 2 + 4 H 2 O + 5 e

3. Materials and Methods

3.1. Chemicals

Urea and Tin (IV) chloride pentahydrate (SnCl4·5H2O, 99.0%) were purchased from Macklin Biochemical Co., Ltd. (Shanghai, China). All chemicals were used as received, without further purification.

3.2. Preparation of g-C3N4

Graphitic carbon nitride (g-C3N4) wasdirectly synthesized by the pyrolysis of urea in the muffle furnace (Luoyang Shenjia Kiln Co., Ltd., Luoyang, Henan, China). A total of 20 g urea was put into an alumina crucible with a cover and then warmed to a temperature of 250 °C within 110 min, before being kept at 250 °C for 1 h. Then, the temperature was increased to 350 °C within 50 min and kept at 350 °C for 2 h. Finally, temperature rose to 550 °C within 100 min and was kept at 550 °C for another 2 h. The heating rate of the whole reaction was 2 °C·min−1. The resulting yellow powder was collected.

3.3. Synthesis of the SnO2/g-C3N4Composite

SnO2/g-C3N4 composites were synthesized through a facile calcination method. In a typical preparation process, a certain amount g-C3N4 was dissolved in 100 mL H2O and 2.09 g SnCl4·5H2O was added into the dispersed suspension with ultrasonic treatment for 2 h. Then, the mixed solution was transferred into an alumina crucible and put it into the muffle furnace. It was heated to 400 °C for 2 h. Finally, the resulting product was ground to powder. According to this method, the different mass ratios of the SnO2/g-C3N4 composites were synthesized and marked as SnO2/g-C3N4-5, SnO2/g-C3N4-7, and SnO2/g-C3N4-9. For comparison, the same method was used to synthesize the pure SnO2 particles with the absence of g-C3N4.

3.4. Characterizations

The samples were characterized by X-ray diffraction (XRD, Bruker-AXS D8, Bruker, Madison, WI, USA) with Cu Kα radiation at 40 kV and 25 mA. The structure and morphology of the samples were observed by field-emission scanning electron microscopy (FESEM, Quanta™ 250 FEG) (FEI, Eindhoven, The Netherlands). Transmission electron microscopy (TEM) analysis was performed on a JEOL JEM-2100 microscope (JEOL, Tokyo, Japan) operating at 200 kV. The thermal gravity and differential thermal analysis (TG-DTA) was carried on TA-SDT Q600 (TA, New Castle, DE, USA) at a heating rate 10 °C·min1 under an air atmosphere. Nitrogen adsorption-desorption isotherms were obtained on a Quantachrome Autosorb-iQ sorption analyzer (Quantachrome, Boynton Beach, FL, USA). Before carrying out the measurement, the samples were degassed for more than 6 h at 300 °C.

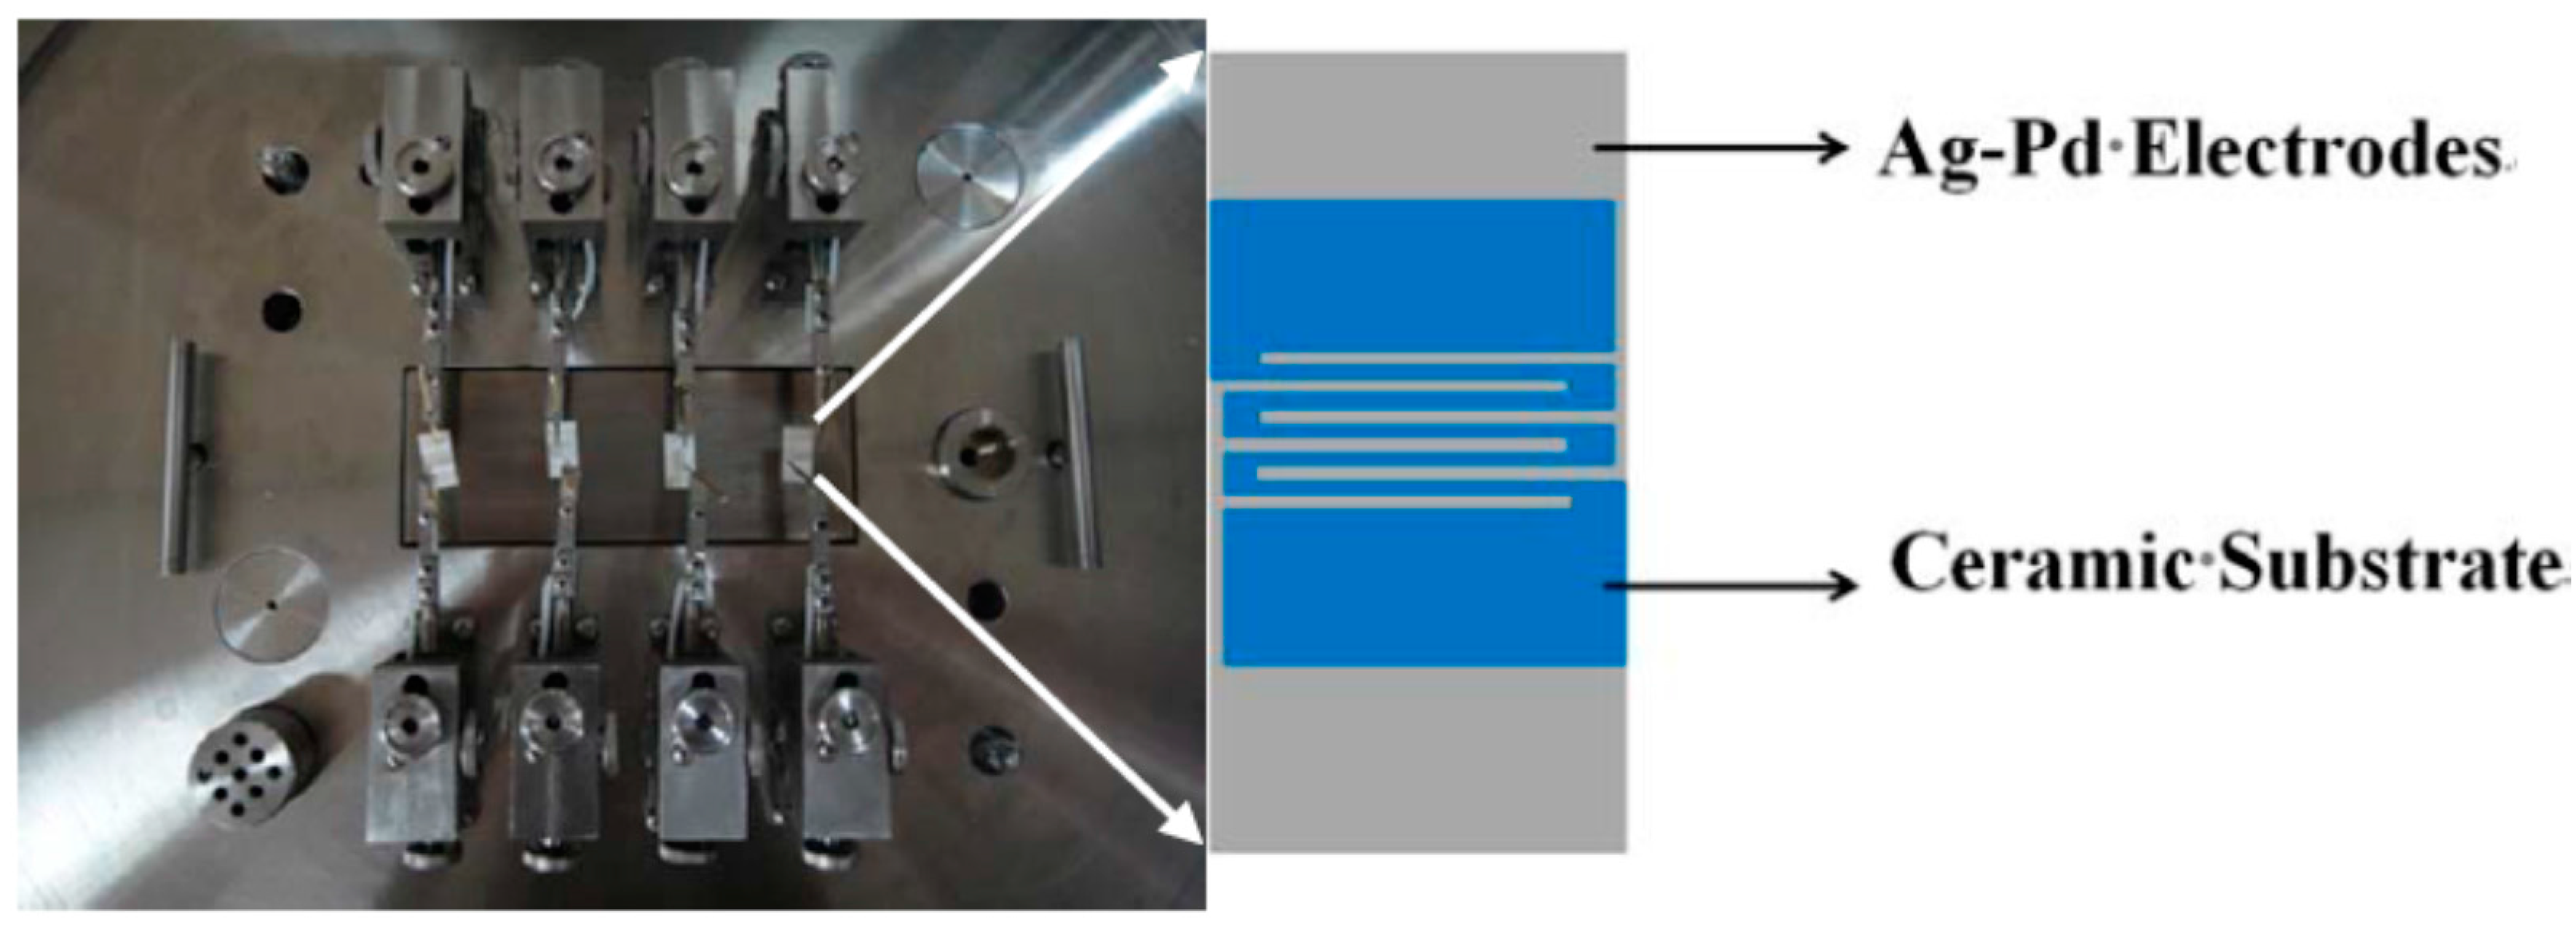
3.5. Gas-Sensing Test

The gas-sensing performance of the as-synthesized samples when using ethanol was tested by using the intelligent gas-sensing analysis system of CGS-4TPS (Beijing Elite Co., Ltd., Beijing, China). Figure 11 shows a brief schematic diagram of the device. The gas sensors were prepared according to the usual way. A small amount of the as-prepared sample was fully ground in agate mortar with a few drops ethanol, which served as the agglomerant to form starchiness. Afterwards, the pastes were equably spread on the ceramic substrate (13.4 mm × 7 mm) with interdigitated Ag-Pd electrodes to form the thin film. Before carrying out the test, the substrate was aged at 180 °C for 24 h to improve the stability and repeatability of the gas sensors. The response of the sensors was defined as the ratio of Ra/Rg, where Ra and Rg were the resistance of sensor in air and in the target gas, respectively.

4. Conclusions

In this study, the SnO2/g-C3N4 composites with a high surface area (132.5 m2·g−1) were synthesized via a facile calcination method by using SnCl4·5H2O and urea as the precursor. The SnO2 particles were highly distributed on the g-C3N4 nanosheets. The gas-sensing properties of the SnO2/g-C3N4-7 composite-based sensor exhibited preferable results when compared to the pure SnO2, including the sensitivity and selectivity. Considering the easy-preparation process, the SnO2/g-C3N4 composite could be a promising candidate for high-performance ethanol gas-sensing applications.

Acknowledgments

This work was supported by the National Natural Science Foundation of China (51404097, 51504083, U1404613), Program for Science&Technology Innovation Talents in Universities of Henan Province (17HASTIT029), Natural Science Foundation of Henan Province of China (162300410113), Project funded by China Postdoctoral Science Foundation (2016M592290), the Research Foundation for Youth Scholars of Higher Education of Henan Province (2016GGJS-040), the Fundamental Research Funds for the Universities of Henan Province (NSFRF1606, NSFRF1614); Program for Innovative Research Team (in Science and Technology) in the University of Henan Province (16IRTSTHN005), and Foundation for Distinguished Young Scientists of Henan Polytechnic University (J2016-2, J2017-3).

Author Contributions

Jianliang Cao conceived and designed the experiments; Cong Qin, Bo Zhang, Yuxiao Gong, Huoli Zhang, Guang Sun, and Hari Bala performed the experiments and analyzed the data; Yan Wang and Zhanying Zhang provided the concept of this research and managed all the experimental and writing process as the corresponding authors; all authors discussed the results and commented on the manuscript.

Conflicts of Interest

The authors declare no conflict of interest.

References

  1. Hou, C.; Li, J.; Huo, D.; Luo, X.; Dong, J.; Yang, M.; Shi, X. A portable embedded toxic gas detection device based on a cross-responsive sensor array. Sens. Actuators B 2012, 161, 244–250. [Google Scholar] [CrossRef]
  2. Schedin, F.; Geim, A.K.; Morozov, S.V.; Hill, E.W.; Blake, P.; Katsnelson, M.I.; Novoselov, K.S. Detection of individual gas molecules adsorbed on graphene. Nat. Mater. 2007, 6, 652–655. [Google Scholar] [CrossRef] [PubMed]
  3. Ariyageadsakul, P.; Vchirawongkwin, V.; Kritayakornupong, C. Determination of toxic carbonyl species including acetone, formaldehyde, and phosgene by polyaniline emeraldine gas sensor using DFT calculation. Sens. Actuators B 2016, 232, 165–174. [Google Scholar] [CrossRef]
  4. Hui, G.H. Detection of Sulfur Hexafluoride Based on Stochastic Resonance and Miniaturized Sensor Array. Chin. J. Anal. Chem. 2010, 38, 984–988. [Google Scholar]
  5. Kaneti, Y.V.; Yue, J.; Moriceau, J.; Chen, C.; Liu, M.; Yuan, Y.; Jiang, X.; Yu, A. Experimental and theoretical studies on noble metal decorated tin oxide flower-like nanorods with high ethanol sensing performance. Sens. Actuators B 2015, 219, 83–93. [Google Scholar] [CrossRef]
  6. Kumar, N.; Srivastava, A.K.; Patel, H.S.; Gupta, B.K.; Varma, G.D. Facile Synthesis of ZnO–Reduced Graphene Oxide Nanocomposites for NO2 Gas Sensing Applications. Eur. J. Inorg. Chem. 2015, 2015, 1912–1923. [Google Scholar] [CrossRef]
  7. Bhuvaneshwari, S.; Gopalakrishnan, N. Hydrothermally synthesized Copper Oxide (CuO) superstructures for ammonia sensing. J. Colloid Interface Sci. 2016, 480, 76–84. [Google Scholar] [CrossRef] [PubMed]
  8. Mirzaei, A.; Janghorban, K.; Hashemi, B.; Bonavita, A.; Bonyani, M.; Leonardi, S.G.; Neri, G. Synthesis, Characterization and Gas Sensing Properties of Ag@alpha-Fe2O3 Core-Shell Nanocomposites. Nanomaterials 2015, 5, 737–749. [Google Scholar] [CrossRef] [PubMed]
  9. Deng, S.; Liu, X.; Chen, N.; Deng, D.; Xiao, X.; Wang, Y. A highly sensitive VOC gas sensor using p-type mesoporous Co3O4 nanosheets prepared by a facile chemical coprecipitation method. Sens. Actuators B 2016, 233, 615–623. [Google Scholar] [CrossRef]
  10. Yang, C.; Deng, W.; Liu, H.; Ge, S.; Yan, M. Turn-on fluorescence sensor for glutathione in aqueous solutions using carbon dots-MnO2 nanocomposites. Sens. Actuators B 2015, 216, 286–292. [Google Scholar] [CrossRef]
  11. An, X.; Yu, J.C.; Wang, Y.; Hu, Y.; Yu, X.; Zhang, G. WO3 nanorods/graphene nanocomposites for high-efficiency visible-light-driven photocatalysis and NO2 gas sensing. J. Mater. Chem. 2012, 22, 8525–8531. [Google Scholar] [CrossRef]
  12. Xue, P.; Yang, X.; Lai, X.; Xia, W.; Li, P.; Fang, J. Controlling synthesis and gas-sensing properties of ordered mesoporous In2O3-reduced graphene oxide (rGO) nanocomposite. Sci. Bull. 2015, 60, 1348–1354. [Google Scholar] [CrossRef]
  13. Lin, L.; Liu, T.; Yu, W.; Guo, Z.; Zeng, W. Synthesis of multifarious hierarchical flower-like NiO and their gas-sensing properties. Mater. Res. Bull. 2013, 48, 2730–2736. [Google Scholar] [CrossRef]
  14. Choi, K.S.; Park, S.; Chang, S.-P. Enhanced ethanol sensing properties based on SnO2 nanowires coated with Fe2O3 nanoparticles. Sens. Actuators B 2017, 238, 871–879. [Google Scholar] [CrossRef]
  15. Li, Y.; Chen, N.; Deng, D.; Xing, X.; Xiao, X.; Wang, Y. Formaldehyde detection: SnO2 microspheres for formaldehyde gas sensor with high sensitivity, fast response/recovery and good selectivity. Sens. Actuators B 2017, 238, 264–273. [Google Scholar] [CrossRef]
  16. Zhang, D.; Liu, A.; Chang, H.; Xia, B. Room-temperature high-performance acetone gas sensor based on hydrothermal synthesized SnO2-reduced graphene oxide hybrid composite. RSC Adv. 2015, 5, 3016–3022. [Google Scholar] [CrossRef]
  17. Srivastava, V.; Jain, K. At room temperature graphene/SnO2 is better than MWCNT/SnO2 as NO2 gas sensor. Mater. Lett. 2016, 169, 28–32. [Google Scholar] [CrossRef]
  18. Guo, D.; Cai, P.; Sun, J.; He, W.; Wu, X.; Zhang, T.; Wang, X.; Zhang, X. Reduced-graphene-oxide/metal-oxide p-n heterojunction aerogels as efficient 3D sensing frameworks for phenol detection. Carbon 2016, 99, 571–578. [Google Scholar] [CrossRef]
  19. Latif, U.; Dickert, F.L. Graphene Hybrid Materials in Gas Sensing Applications. Sensors 2015, 15, 30504–30524. [Google Scholar] [CrossRef] [PubMed]
  20. Yi, Y.; Zhu, G.; Sun, H.; Sun, J.; Wu, X. Nitrogen-doped hollow carbon spheres wrapped with graphene nanostructure for highly sensitive electrochemical sensing of parachlorophenol. Biosens. Bioelectron. 2016, 86, 62–67. [Google Scholar] [CrossRef] [PubMed]
  21. Song, Z.; Wei, Z.; Wang, B.; Luo, Z.; Xu, S.; Zhang, W.; Yu, H.; Li, M.; Huang, Z.; Zang, J.; et al. Sensitive Room-Temperature H2S Gas Sensors Employing SnO2 Quantum Wire/Reduced Graphene Oxide Nanocomposites. Chem. Mater. 2016, 28, 1205–1212. [Google Scholar] [CrossRef]
  22. Mao, S.; Cui, S.; Lu, G.; Yu, K.; Wen, Z.; Chen, J. Tuning gas-sensing properties of reduced graphene oxide using tin oxide nanocrystals. J. Mater. Chem. 2012, 22, 11009–11013. [Google Scholar] [CrossRef]
  23. Zhang, H.; Feng, J.; Fei, T.; Liu, S.; Zhang, T. SnO2 nanoparticles-reduced graphene oxide nanocomposites for NO2 sensing at low operating temperature. Sens. Actuators B 2014, 190, 472–478. [Google Scholar] [CrossRef]
  24. Zhang, D.; Liu, J.; Chang, H.; Liu, A.; Xia, B. Characterization of a hybrid composite of SnO2 nanocrystal-decorated reduced graphene oxide for ppm-level ethanol gas sensing application. RSC Adv. 2015, 5, 18666–18672. [Google Scholar] [CrossRef]
  25. Mamba, G.; Mishra, A.K. Graphitic carbon nitride (g-C3N4) nanocomposites: A new and exciting generation of visible light driven photocatalysts for environmental pollution remediation. Appl. Catal. B 2016, 198, 347–377. [Google Scholar] [CrossRef]
  26. Shao, L.; Jiang, D.; Xiao, P.; Zhu, L.; Meng, S.; Chen, M. Enhancement of g-C3N4 nanosheets photocatalysis by synergistic interaction of ZnS microsphere and RGO inducing multistep charge transfer. Appl. Catal. B 2016, 198, 200–210. [Google Scholar] [CrossRef]
  27. Hu, Y.; Li, L.; Zhang, L.; Lv, Y. Dielectric barrier discharge plasma-assisted fabrication of g-C3N4-Mn3O4 composite for high-performance cataluminescence H2S gas sensor. Sens. Actuators B 2017, 239, 1177–1184. [Google Scholar] [CrossRef]
  28. Dai, H.; Zhang, S.; Xu, G.; Peng, Y.; Gong, L.; Li, X.; Li, Y.; Lin, Y.; Chen, G. Highly photoactive heterojunction based on g-C3N4 nanosheets decorated with dendritic zinc(II) phthalocyanine through axial coordination and its ultrasensitive enzyme-free sensing of choline. RSC Adv. 2014, 4, 58226–58230. [Google Scholar] [CrossRef]
  29. Chen, P.W.; Li, K.; Yu, Y.X.; Zhang, W.D. Cobalt-doped graphitic carbon nitride photocatalysts with high activity for hydrogen evolution. Appl. Surf. Sci. 2017, 392, 608–615. [Google Scholar] [CrossRef]
  30. Wei, J.; Huang, C.; Wu, H.; Kan, E. High-capacity hydrogen storage in Li-adsorbed g-C3N4. Mater. Chem. Phys. 2016, 180, 440–444. [Google Scholar] [CrossRef]
  31. Carvalho, K.T.G.; Nogueira, A.E.; Lopes, O.F.; Byzynski, G.; Ribeiro, C. Synthesis of g-C3N4/Nb2O5 heterostructures and their application in the removal of organic pollutants under visible and ultraviolet irradiation. Ceram. Int. 2017, 43, 3521–3530. [Google Scholar] [CrossRef]
  32. Zeng, B.; Zhang, L.; Wan, X.; Song, H.; Lv, Y. Fabrication of α-Fe2O3/g-C3N4, composites for cataluminescence sensing of H2S. Sens. Actuators B 2015, 211, 370–376. [Google Scholar] [CrossRef]
  33. Zhang, X.L.; Zheng, C.; Guo, S.S.; Li, J.; Yang, H.H.; Chen, G. Turn-on fluorescence sensor for intracellular imaging of glutathione using g-C3N4 nanosheet-MnO2 sandwich nanocomposite. Anal. Chem. 2014, 86, 3426–3434. [Google Scholar] [CrossRef] [PubMed]
  34. She, X.; Xu, H.; Wang, H.; Xia, J.; Song, Y.; Yan, J.; Xu, Y.; Zhang, Q.; Du, D.; Li, H. Controllable synthesis of CeO2/g-C3N4 composites and their applications in the environment. Dalton Trans. 2015, 44, 7021–7031. [Google Scholar] [CrossRef] [PubMed]
  35. Zhang, Y.; Zhang, D.; Guo, W.; Chen, S. The α-Fe2O3/g-C3N4 heterostructural nanaocomposites with enhanced ethanol gas sensing performance. J. Alloy. Compd. 2016, 685, 84–90. [Google Scholar] [CrossRef]
  36. Zito, C.A.; Perfecto, T.M.; Volanti, D.P. Impact of reduced graphene oxide on the ethanol sensing performance of hollow SnO2 nanoparticles under humid atmosphere. Sens. Actuators B 2017, 244, 466–474. [Google Scholar] [CrossRef]
  37. Guo, J.; Zhang, J.; Gong, H.; Ju, D.; Cao, B. Au nanoparticle-functionalized 3D SnO2, microstructures for high performance gas sensor. Sens. Actuators B 2016, 226, 266–272. [Google Scholar] [CrossRef]
  38. Zang, Y.; Li, L.; Li, X.; Lin, R.; Li, G. Synergistic collaboration of g-C3N4/SnO2 composites for enhanced visible-light photocatalytic activity. Chem. Eng. J. 2014, 246, 277–286. [Google Scholar] [CrossRef]
Figure 1. XRD patterns of the g-C3N4, SnO2, SnO2/g-C3N4-5, SnO2/g-C3N4-7, and SnO2/g-C3N4-9 composites.
Nanomaterials 07 00098 g001
Figure 2. SEM images of (a) g-C3N4, (b) SnO2 and (c) SnO2/g-C3N4-7 composite, (d) the EDS mappings of C, N, O, and Sn elements related to the selected area in (c).
Nanomaterials 07 00098 g002
Figure 3. TEM images of (a) g-C3N4 and (b) SnO2/g-C3N4-7 composite.
Nanomaterials 07 00098 g003
Figure 4. TG-DTA profiles of the g-C3N4 and SnO2/g-C3N4-7 composite.
Nanomaterials 07 00098 g004
Figure 5. (a) N2 adsorption-desorption isotherms and (b) the corresponding pore size distribution curves of the SnO2 and SnO2/g-C3N4-7 composite.
Nanomaterials 07 00098 g005
Figure 6. (a) Response values of the sensors based on SnO2, SnO2/g-C3N4-5, SnO2/g-C3N4-7, and SnO2/g-C3N4-9 to 500 ppm ethanol as a function of the operating temperature; (b) the responses of sensors (SnO2, SnO2/g-C3N4-5, SnO2/g-C3N4-7, and SnO2/g-C3N4-9) operated at 300 °C versus different concentrations of ethanol.
Nanomaterials 07 00098 g006
Figure 7. Real time response curves of the pure SnO2 and SnO2/g-C3N4-7 to ethanol in the range of 50–3000 ppm.
Nanomaterials 07 00098 g007
Figure 8. (a) Repeatability and (b) stability measurements of the SnO2/g-C3N4-7-based sensor to 500 ppm ethanol at 300 °C.
Nanomaterials 07 00098 g008
Figure 9. Responses of SnO2 and SnO2/g-C3N4-7-based sensors to 500 ppm different reducing gases at 300 °C.
Nanomaterials 07 00098 g009
Figure 10. (a) UV-vis diffuse reflectance spectra of SnO2, g-C3N4, and SnO2/g-C3N4-7 composites, (b) plot of (Ahv)2 versus energy (hv) for the band gap energy of SnO2, (c) plot of (Ahν)1/2 versus energy () for the band gap energy of g-C3N4.
Nanomaterials 07 00098 g010
Figure 11. The internal structure diagram of the CGS-4TPS gas-sensing test system and the structure of the substrate.
Nanomaterials 07 00098 g011
Table 1. Gas-sensing performance comparison of various gas sensors toward ethanol.
Sensing MaterialsEthanol Concentration (ppm)Temperature (°C)Response (Ra/Rg)Ref.
Fe2O3-SnO210030031.18[14]
α-Fe2O3/g-C3N41003407.76[35]
RGO-SnO210030070.4[36]
Au/SnO210034018[37]
SnO2/g-C3N410030085this work

