Ultra-Thin Platinum Deposits by Surface-Limited Redox Replacement of Tellurium

 and
and 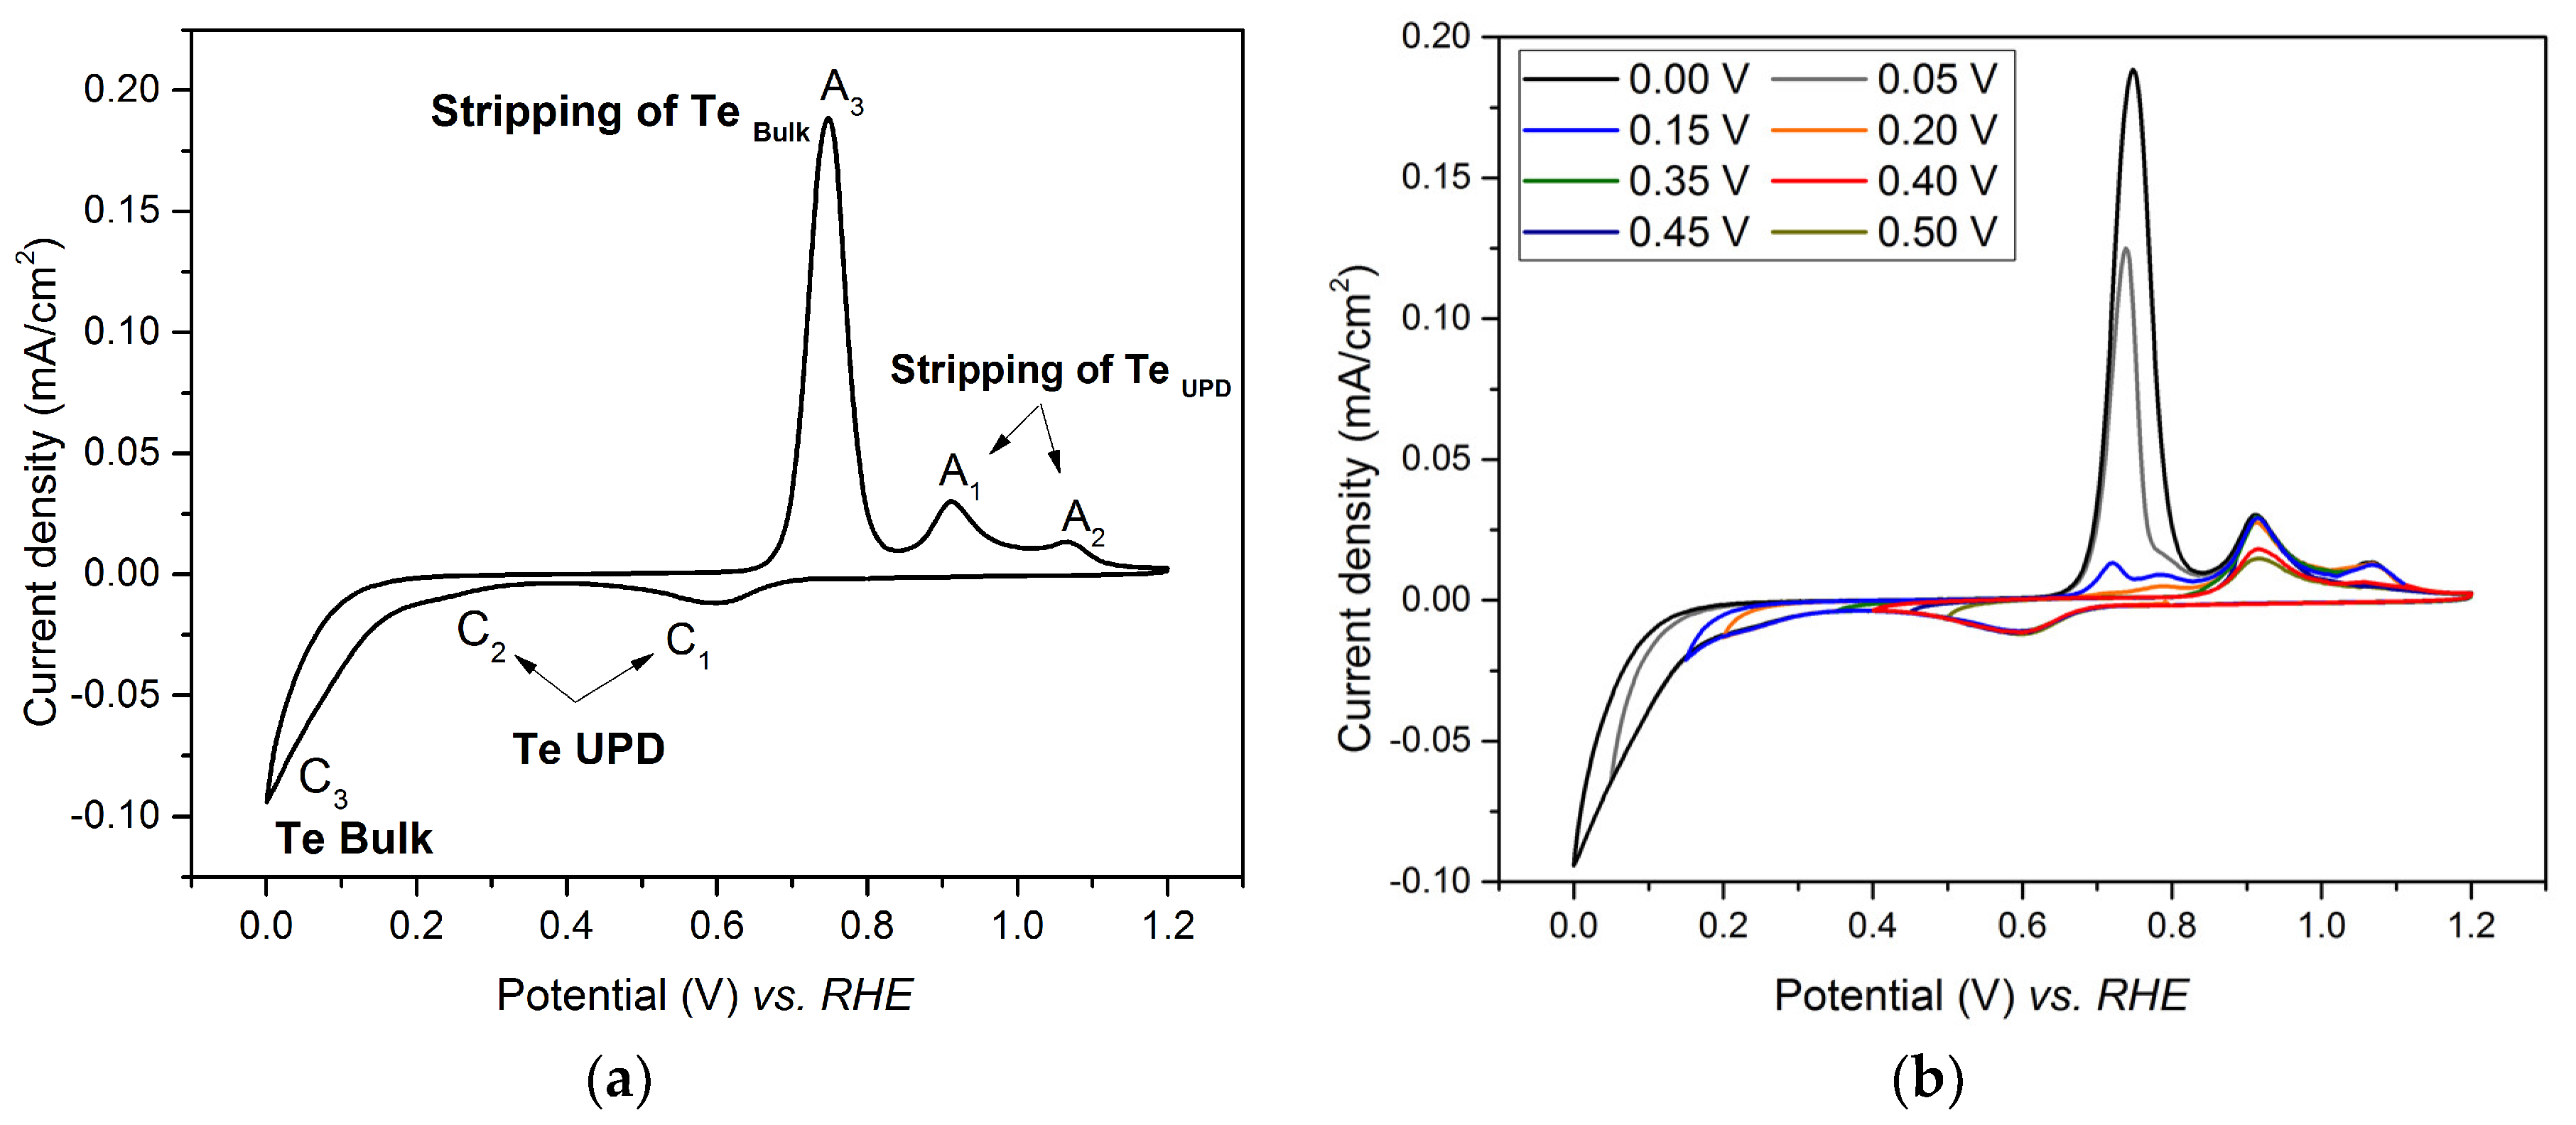
Abstract
:1. Introduction
2. Materials and Methods
2.1. Solutions and Chemicals
2.2. Electrochemical Studies
2.2.1. Preparation of the Gold Electrode
2.2.2. Underpotential Deposition (UPD) of Te and Te Replacement by Pt
2.3. Characterization of the Pt Deposits
3. Results and Discussion
3.1. Underpotential Deposition of Tellurium on Gold
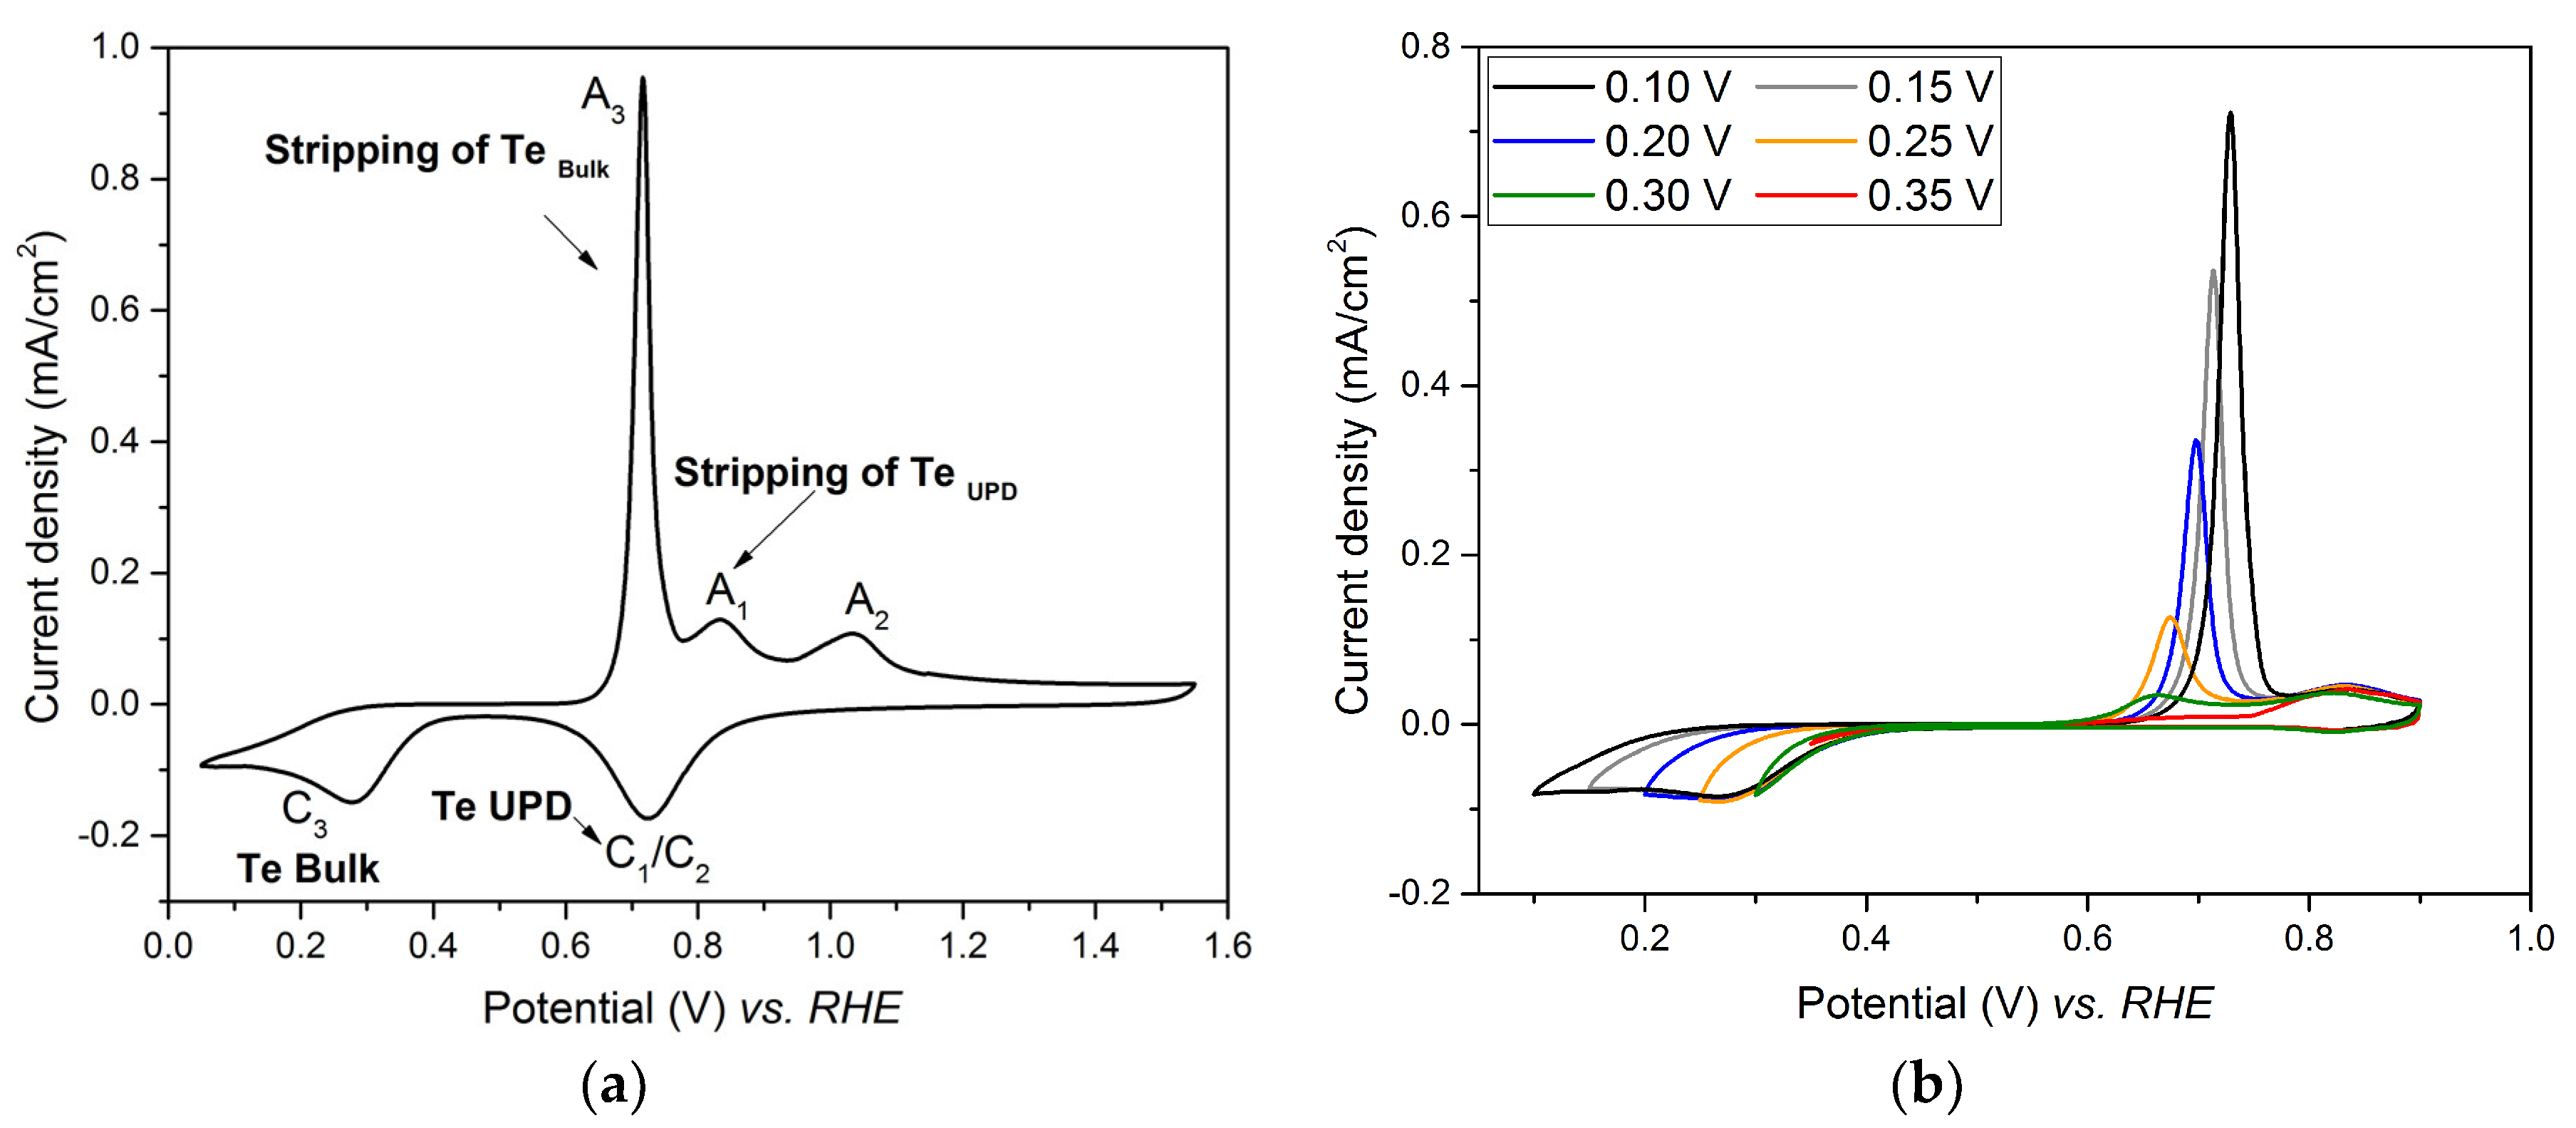
3.2. Investigation of Te UPD on Platinum Electrode
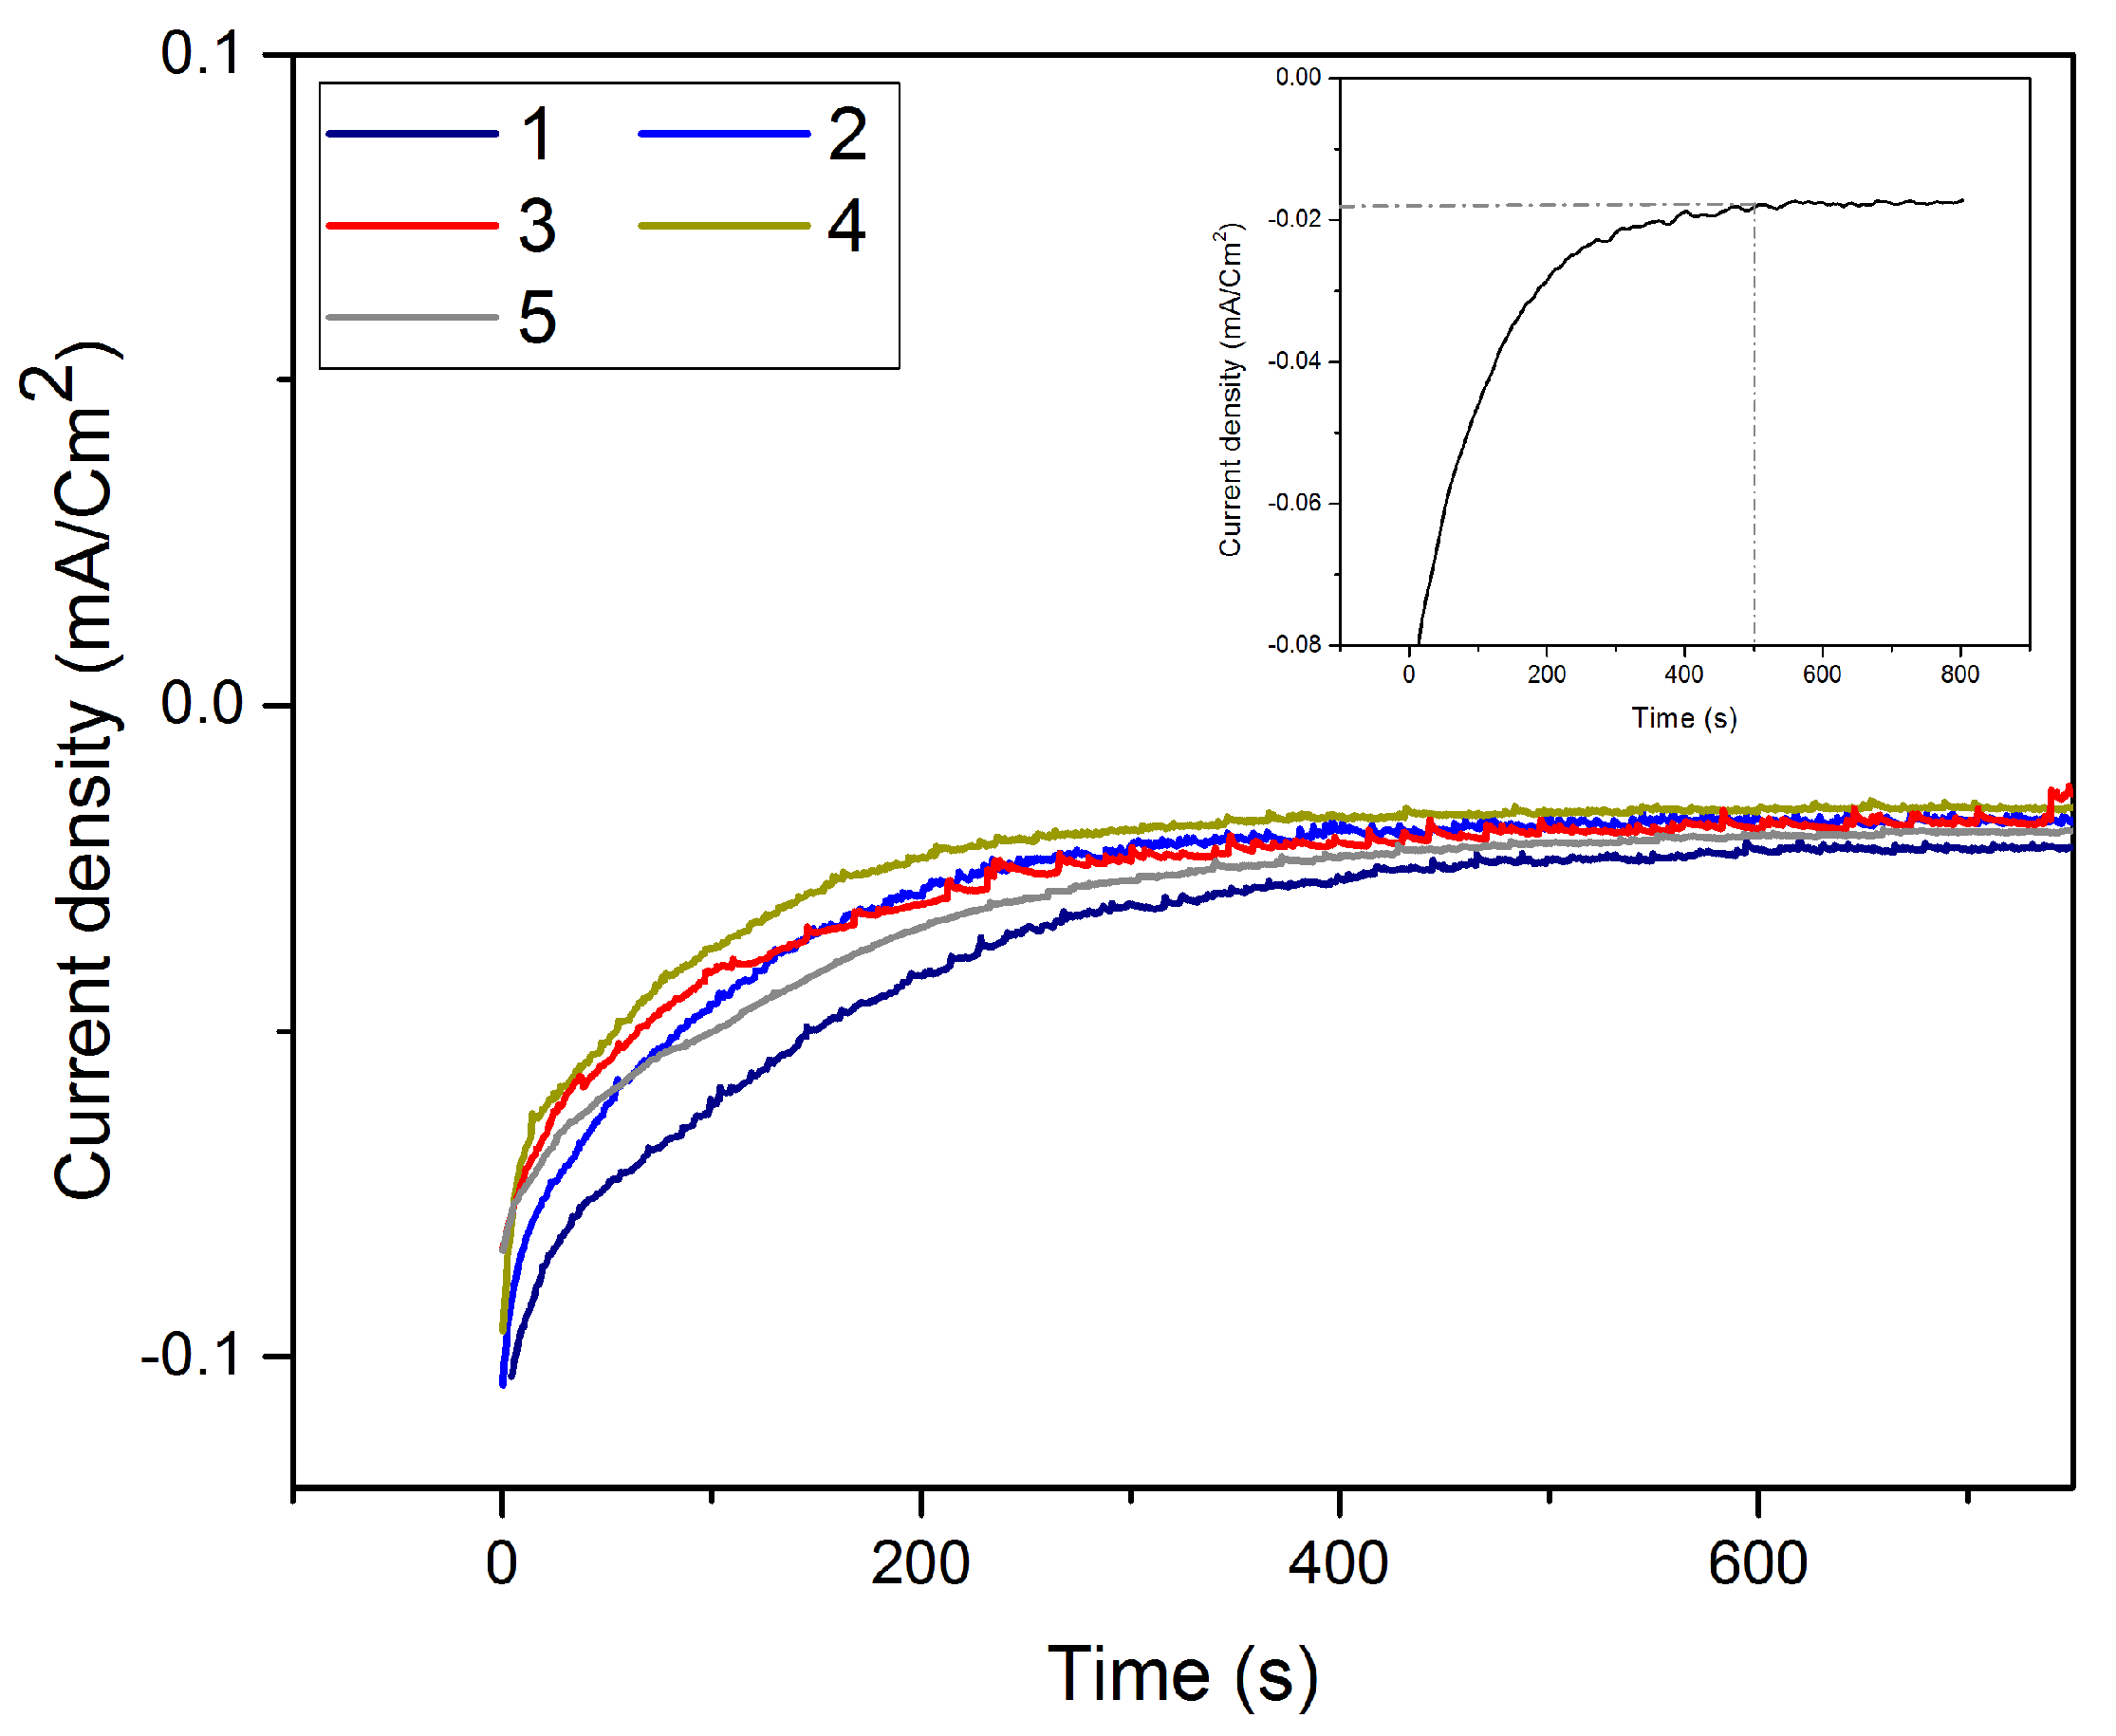
3.3. Te Replacement by Pt
3.4. Underpotential Deposition of Te onto Pt-Covered Gold Electrode and Subsequent Te Replacements by Pt
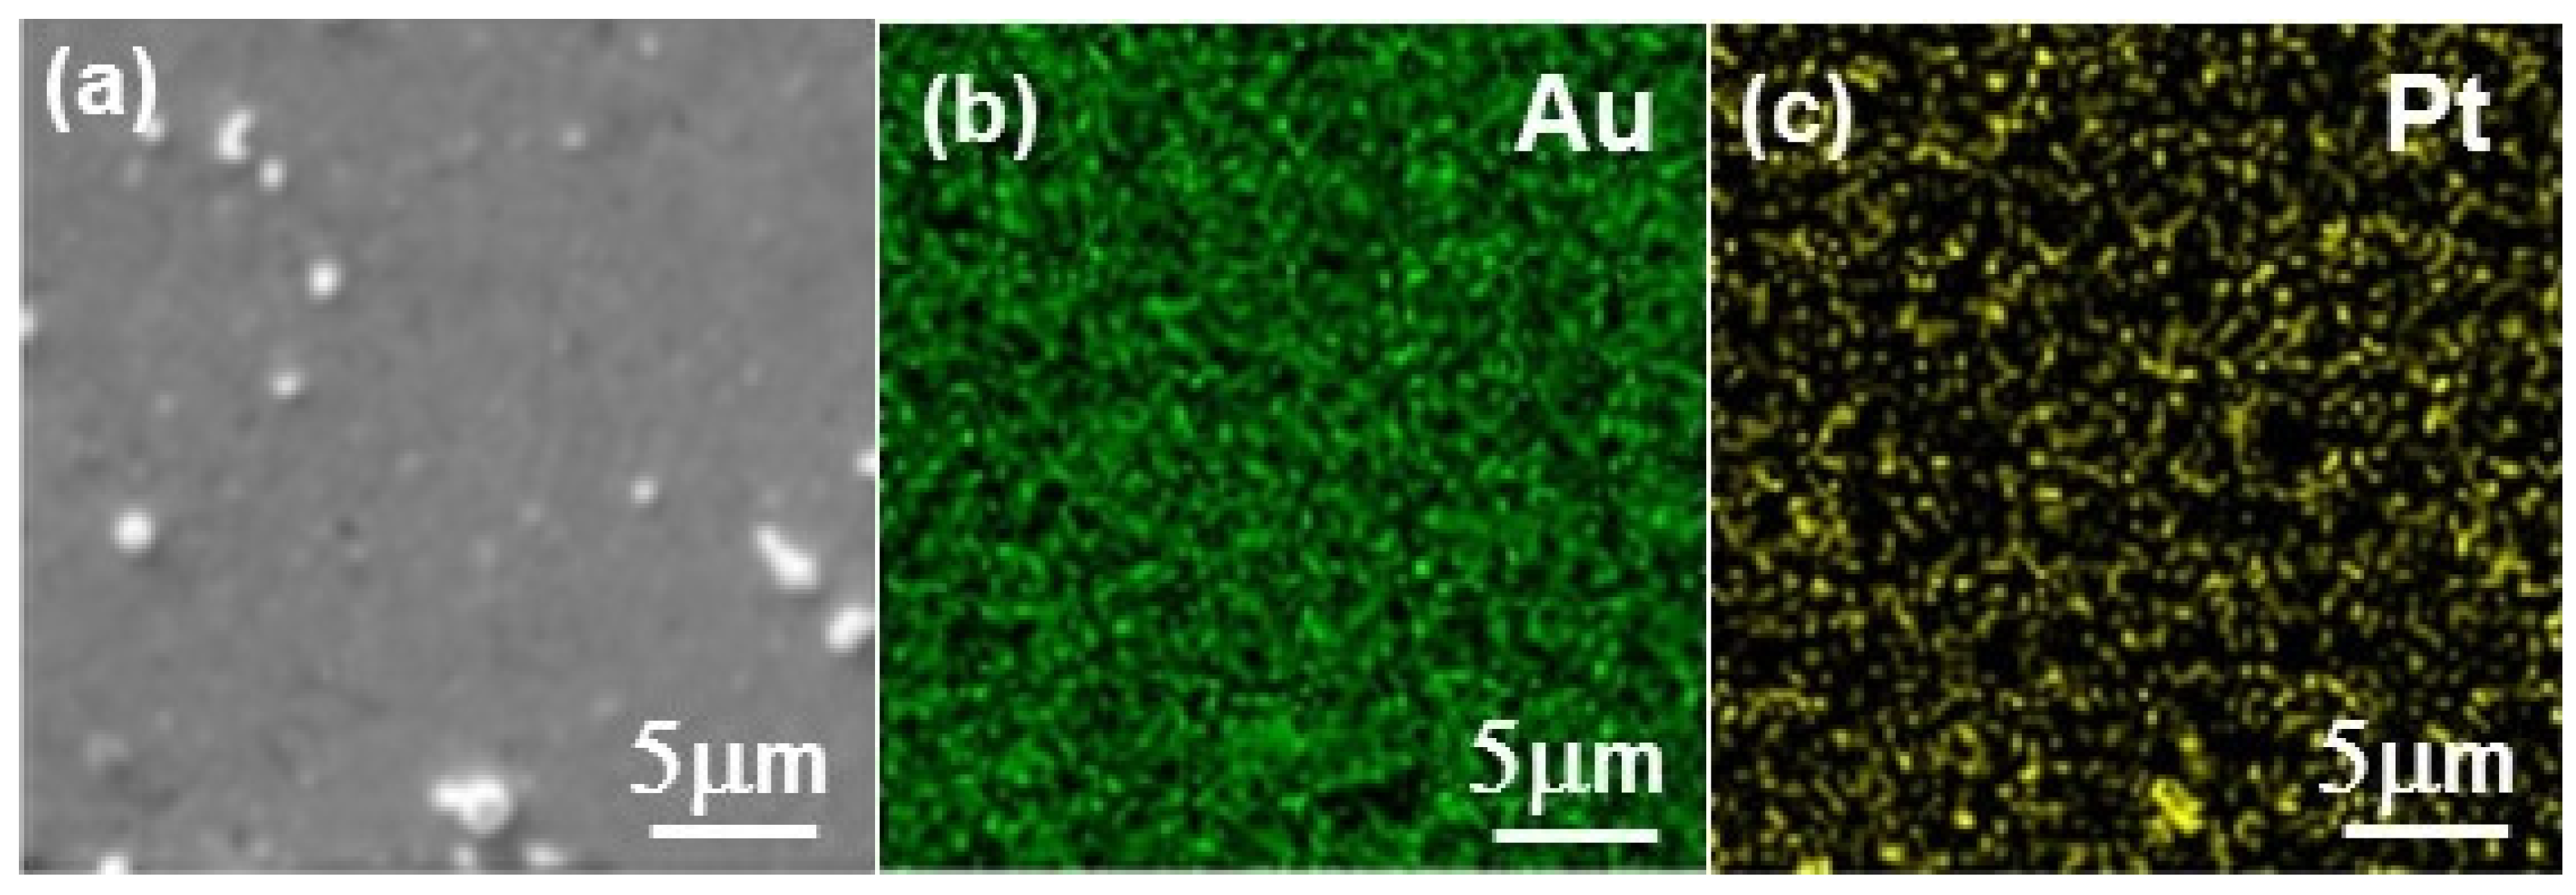
3.5. Characterization of the Pt Film
4. Conclusions
Supplementary Materials
Author Contributions
Funding
Acknowledgments
Conflicts of Interest
References
- Adzic, R.R.; Zhang, J.; Sasaki, K.; Vukmirovic, M.B.; Shao, M.; Wang, J.X.; Nilekar, A.U.; Mavrikakis, M.; Valerio, J.A.; Uribe, F. Platinum monolayer fuel cell electrocatalysts. Top. Catal. 2007, 46, 249–262. [Google Scholar] [CrossRef]
- Van Der Vliet, D.; Wang, C.; Debe, M.; Atanasoski, R.; Markovic, N.M.; Stamenkovic, V.R. Platinum-alloy nanostructured thin film catalysts for the oxygen reduction reaction. Electrochim. Acta 2011, 56, 8695–8699. [Google Scholar] [CrossRef]
- Zhang, J.; Mo, Y.; Vukmirovic, M.B.; Klie, R.; Sasaki, K.; Adzic, R.R. Platinum Monolayer Electrocatalysts for O2 Reduction: Pt Monolayer on Pd(111) and on Carbon-Supported Pd Nanoparticles. J. Phys. Chem. B 2004, 108, 10955–10964. [Google Scholar] [CrossRef]
- Adzic, R.R. Platinum monolayer electrocatalysts: Tunable activity, stability, and self-healing properties. Electrocatalysis 2012, 3, 163–169. [Google Scholar] [CrossRef]
- Ercolano, G.; Cavaliere, S.; Rozière, J.; Jones, D.J. Recent developments in electrocatalyst design thrifting noble metals in fuel cells. Curr. Opin. Electrochem. 2018, 9, 271–277. [Google Scholar] [CrossRef]
- Lv, H.; Li, D.; Strmcnik, D.; Paulikas, A.P.; Markovic, N.M.; Stamenkovic, V.R. Recent advances in the design of tailored nanomaterials for efficient oxygen reduction reaction. Nano Energy 2016, 29, 149–165. [Google Scholar] [CrossRef]
- Hartl, K.; Hanzlik, M.; Arenz, M. IL-TEM investigations on the degradation mechanism of Pt/C electrocatalysts with different carbon supports. Energy Environ. Sci. 2011, 4, 234–238. [Google Scholar] [CrossRef]
- Debe, M.K. Electrocatalyst approaches and challenges for automotive fuel cells. Nature 2012, 486, 43–51. [Google Scholar] [CrossRef] [PubMed]
- Papandrew, A.B.; Atkinson, R.W.; Goenaga, G.A.; Wilson, D.L.; Kocha, S.S.; Neyerlin, K.C.; Zack, J.W.; Pivovar, B.S.; Zawodzinski, T.A. Oxygen reduction activity of vapor-grown platinum nanotubes. ECS Trans. 2013, 50, 1397–1403. [Google Scholar] [CrossRef]
- Stephens, I.E.L.; Bondarenko, A.S.; Grønbjerg, U.; Rossmeisl, J.; Chorkendorff, I. Understanding the electrocatalysis of oxygen reduction on platinum and its alloys. Energy Environ. Sci. 2012, 5, 6744–6762. [Google Scholar] [CrossRef] [Green Version]
- Du, Q.; Wu, J.; Yang, H. Pt@Nb-TiO2 catalyst membranes fabricated by electrospinning and atomic layer deposition. ACS Catal. 2014, 4, 144–151. [Google Scholar] [CrossRef]
- Dilonardo, E.; Milella, A.; Cosma, P.; d’Agostino, R.; Palumbo, F. Plasma deposited electrocatalytic films with controlled content of Pt nanoclusters. Plasma Process. Polym. 2011, 8, 452–458. [Google Scholar] [CrossRef]
- Hammer, B.; Norskov, J.K. Theoretical Surface Science and Catalysis—Calculations and Concepts. Adv. Catal. 2000, 45, 71–129. [Google Scholar] [CrossRef]
- Ercolano, G.; Farina, F.; Cavaliere, S.; Jones, D.J.; Rozière, J. Towards ultrathin Pt films on nanofibres by surface-limited electrodeposition for electrocatalytic applications. J. Mater. Chem. A 2017, 5, 3974–3980. [Google Scholar] [CrossRef]
- Alpuche-Aviles, M.A.; Farina, F.; Ercolano, G.; Subedi, P.; Cavaliere, S.; Jones, D.J.; Rozière, J. Electrodeposition of two-dimensional Pt nanostructures on highly oriented pyrolytic graphite (HOPG): The effect of evolved hydrogen and chloride ions. Nanomaterials 2018, 8, 668. [Google Scholar] [CrossRef]
- Farina, F.; Ercolano, G.; Cavaliere, S.; Jones, D.J.; Rozi, J. Surface-Limited Electrodeposition of Continuous Platinum Networks on Highly Ordered Pyrolytic Graphite. Nanomaterials 2018, 8, 721. [Google Scholar] [CrossRef] [PubMed]
- Batina, N.; Kolb, D.M.; Nichols, R.J. In Situ Scanning Tunneling Microscopy Study of the Initial Stages of Bulk Copper Deposition on Au(100): The Rim Effect. Langmuir 1992, 8, 2572–2576. [Google Scholar] [CrossRef]
- Waibel, H.F.; Kleinert, M.; Kibler, L.A.; Kolb, D.M. Initial stages of Pt deposition on Au(111) and Au(100). Electrochim. Acta 2002, 47, 1461–1467. [Google Scholar] [CrossRef]
- Brankovic, S.R.; Wang, J.X.; Adžić, R.R. Metal monolayer deposition by replacement of metal adlayers on electrode surfaces. Surf. Sci. 2001, 474, L173–L179. [Google Scholar] [CrossRef]
- Mrozek, M.F.; Xie, Y.; Weaver, M.J. Surface-enhanced raman scattering on uniform platinum-group overlayers: Preparation by redox replacement of underpotential-deposited metals on gold. Anal. Chem. 2001, 73, 5953–5960. [Google Scholar] [CrossRef] [PubMed]
- Kim, Y.; Kim, J.Y.; Vairavapandian, D.; Stickney, J.L. Platinum Nanofilm Formation by EC-ALE via Redox Replacement of UPD Copper: Studies Using in-Situ Scanning Tunneling Microscopy. J. Phys. Chem. B 2006, 110, 17998–18006. [Google Scholar] [CrossRef] [PubMed]
- Ambrozik, S.; Dimitrov, N. The Deposition of Pt via Electroless Surface Limited Redox Replacement. Electrochim. Acta 2015, 169, 248–255. [Google Scholar] [CrossRef]
- Podlovchenko, B.I.; Maksimov, Y.M.; Maslakov, K.I. Electrocatalytic properties of Au electrodes decorated with Pt submonolayers by galvanic displacement of copper adatoms. Electrochim. Acta 2014, 130, 351–360. [Google Scholar] [CrossRef]
- Gokcen, D.; Bae, S.-E.; Brankovic, S.R. Reaction kinetics of metal deposition via surface limited red-ox replacement of underpotentially deposited metal monolayers. Electrochim. Acta 2011, 56, 5545–5553. [Google Scholar] [CrossRef]
- Papaderakis, A.; Mintsouli, I.; Georgieva, J.; Sotiropoulos, S. Electrocatalysts Prepared by Galvanic Replacement. Catalysts 2017, 7, 80. [Google Scholar] [CrossRef]
- Xu, L.; Liang, H.; Li, H.; Wang, K.; Yang, Y.; Song, L.; Wang, X.; Yu, S. Understanding the stability and reactivity of ultrathin tellurium nanowires in solution: An emerging platform for chemical transformation and material design. Nano Res. 2014, 8, 1081–1097. [Google Scholar] [CrossRef]
- Liu, J.; Huang, W.; Gong, M.; Zhang, M.; Wang, J.; Zheng, J. Ultrathin Hetero-Nanowire-Based Flexible Electronics with Tunable Conductivity. Adv. Mater. 2013, 25, 5910–5915. [Google Scholar] [CrossRef] [PubMed]
- Zuo, Y.; Wu, L.; Cai, K.; Li, T.; Yin, W.; Li, D.; Li, N.; Liu, J.; Han, H. Platinum Dendritic-Flowers Prepared by Tellurium Nanowires Exhibit High Electrocatalytic Activity for Glycerol Oxidation. ACS Appl. Mater. Interfaces 2015, 7, 17725–17730. [Google Scholar] [CrossRef] [PubMed]
- Trasatti, S.; Petrii, O.A. Real surface area measurements in electrochemistry. J. Electroanal. Chem. 1992, 327, 353–376. [Google Scholar] [CrossRef]
- Suggs, D.W.; Stickney, J.L. Studies of the structures formed by the alternated electrodeposition of atomic layers of Cd and Te on the low-index planes of Au. Surf. Sci. 1993, 290, 362–374. [Google Scholar] [CrossRef]
- Andrews, R.W. Determination of tellurium(IV) in perchloric acid by stripping voltammetry with collection. Anal. Chim. Acta 1980, 119, 47–54. [Google Scholar] [CrossRef]
- Mori, E.; Baker, C.K.; Reynolds, J.R.; Rajeshwar, K. Aqueous electrochemistry of tellurium at glassy carbon and gold. A combined voltammetry-oscillating quartz crystal microgravimetry study. J. Electroanal. Chem. 1988, 252, 441–451. [Google Scholar] [CrossRef]
- Bravo, B.G.; Michelhaugh, S.L.; Soriaga, M.P.; Villegas, I.; Suggs, D.W.; Stickney, J.L. Anodic underpotential deposition and cathodic stripping of iodine at polycrystalline and single-crystal gold. Studies by LEED, AES, XPS, and electrochemistry. J. Phys. Chem. 1991, 95, 5245–5249. [Google Scholar] [CrossRef]
- Posey, R.S.; Andrews, R.W. Stripping voltammetry of Tellurium (IV) in 0.1 M perchloric acid at rotating gold disk electrodes. Anal. Chim. Acta 1980, 119, 55–66. [Google Scholar] [CrossRef]
- Solomun, T.; Schardt, B.C.; Rosasco, A.; Wieckoski, J.L.; Stickney, A.T.H. Studies of electrodeposition of Silver in an iodine-pretreated stepped surface: Pt(S)[6 (11 1) × (111)]. J. Electroanal. Chem. 1984, 176, 309–323. [Google Scholar] [CrossRef]
- Gregory, B.W.; Norton, M.L.; Stickney, J.L. Thin-layer electrochemical studies of the underpotential deposition of cadmium and tellurium on polycrystalline Au, Pt and Cu electrodes. J. Electroanal. Chem. 1990, 293, 85–101. [Google Scholar] [CrossRef]
- Stickney, J.L.; Rosasco, S.D.; Schardt, B.C.; Hubbard, A.T. Electrodeposition of silver onto platinum(100) surfaces containing iodineadlattices. Studies by low-energy electron diffraction, Auger spectroscopy, and thermal desorption. J. Phys. Chem. 1984, 88, 251–258. [Google Scholar] [CrossRef]
- Zhu, W.; Yang, J.Y.; Zhou, D.X.; Bao, S.Q.; Fan, X.A.; Duan, X.K. Electrochemical characterization of the underpotential deposition of tellurium on Au electrode. Electrochim. Acta 2007, 52, 3660–3666. [Google Scholar] [CrossRef]
- Sella, C.; Boncorps, P.; Vedel, J. The Electrodeposition Mechanism of CdTe from Acidic Aqueous Solutions. J. Electrochem. Soc. 1986, 133, 2043–2047. [Google Scholar] [CrossRef]
- Zhou, W.P.; Kibler, L.A.; Kolb, D.M. Evidence for a change in valence state for tellurium adsorbed on a Pt (111) electrode. Electrochim. Acta 2002, 47, 4501–4510. [Google Scholar] [CrossRef]
- Zhan, D.; Velmurugan, J.; Mirkin, M.V. Adsorption/Desorption of Hydrogen on Pt Nanoelectrodes: Evidence of Surface Diffusion and Spillover. J. Am. Chem. Soc. 2009, 131, 14756–14760. [Google Scholar] [CrossRef] [PubMed]
- Alia, S.M.; Yan, Y.S.; Pivovar, B.S. Galvanic displacement as a route to highly active and durable extended surface electrocatalysts. Catal. Sci. Technol. 2014, 4, 3589–3600. [Google Scholar] [CrossRef]
- Heremans, P.; Tripathi, A.K.; de Meux, A.d.J.; Smits, E.C.P.; Hou, B.; Pourtois, G.; Gelinck, G.H. Mechanical and Electronic Properties of Thin-Film Transistors on Plastic, and Their Integration in Flexible Electronic Applications. Adv. Mater. 2016, 28, 4266–4282. [Google Scholar] [CrossRef] [PubMed]
- Ghidelli, M.; Sebastiani, M.; Collet, C.; Guillemet, R. Determination of the elastic moduli and residual stresses of freestanding Au-TiW bilayer thin fi lms by nanoindentation. Mater. Des. 2016, 106, 436–445. [Google Scholar] [CrossRef]


© 2018 by the authors. Licensee MDPI, Basel, Switzerland. This article is an open access article distributed under the terms and conditions of the Creative Commons Attribution (CC BY) license (http://creativecommons.org/licenses/by/4.0/).
Share and Cite
Haidar, F.; Maas, M.; Piarristeguy, A.; Pradel, A.; Cavaliere, S.; Record, M.-C. Ultra-Thin Platinum Deposits by Surface-Limited Redox Replacement of Tellurium. Nanomaterials 2018, 8, 836. https://doi.org/10.3390/nano8100836
Haidar F, Maas M, Piarristeguy A, Pradel A, Cavaliere S, Record M-C. Ultra-Thin Platinum Deposits by Surface-Limited Redox Replacement of Tellurium. Nanomaterials. 2018; 8(10):836. https://doi.org/10.3390/nano8100836
Chicago/Turabian StyleHaidar, Fatima, Mathieu Maas, Andrea Piarristeguy, Annie Pradel, Sara Cavaliere, and Marie-Christine Record. 2018. "Ultra-Thin Platinum Deposits by Surface-Limited Redox Replacement of Tellurium" Nanomaterials 8, no. 10: 836. https://doi.org/10.3390/nano8100836