Nanoscale Morphology, Interfacial Hydrogen Bonding, Confined Crystallization and Greatly Improved Toughness of Polyamide 12/Polyketone Blends


Abstract
:1. Introduction
2. Materials and Methods
2.1. Materials and Sample Preparation
2.2. Characterization
2.2.1. Morphological Observation
2.2.2. Fourier Transform Infrared Spectroscopy (FTIR)
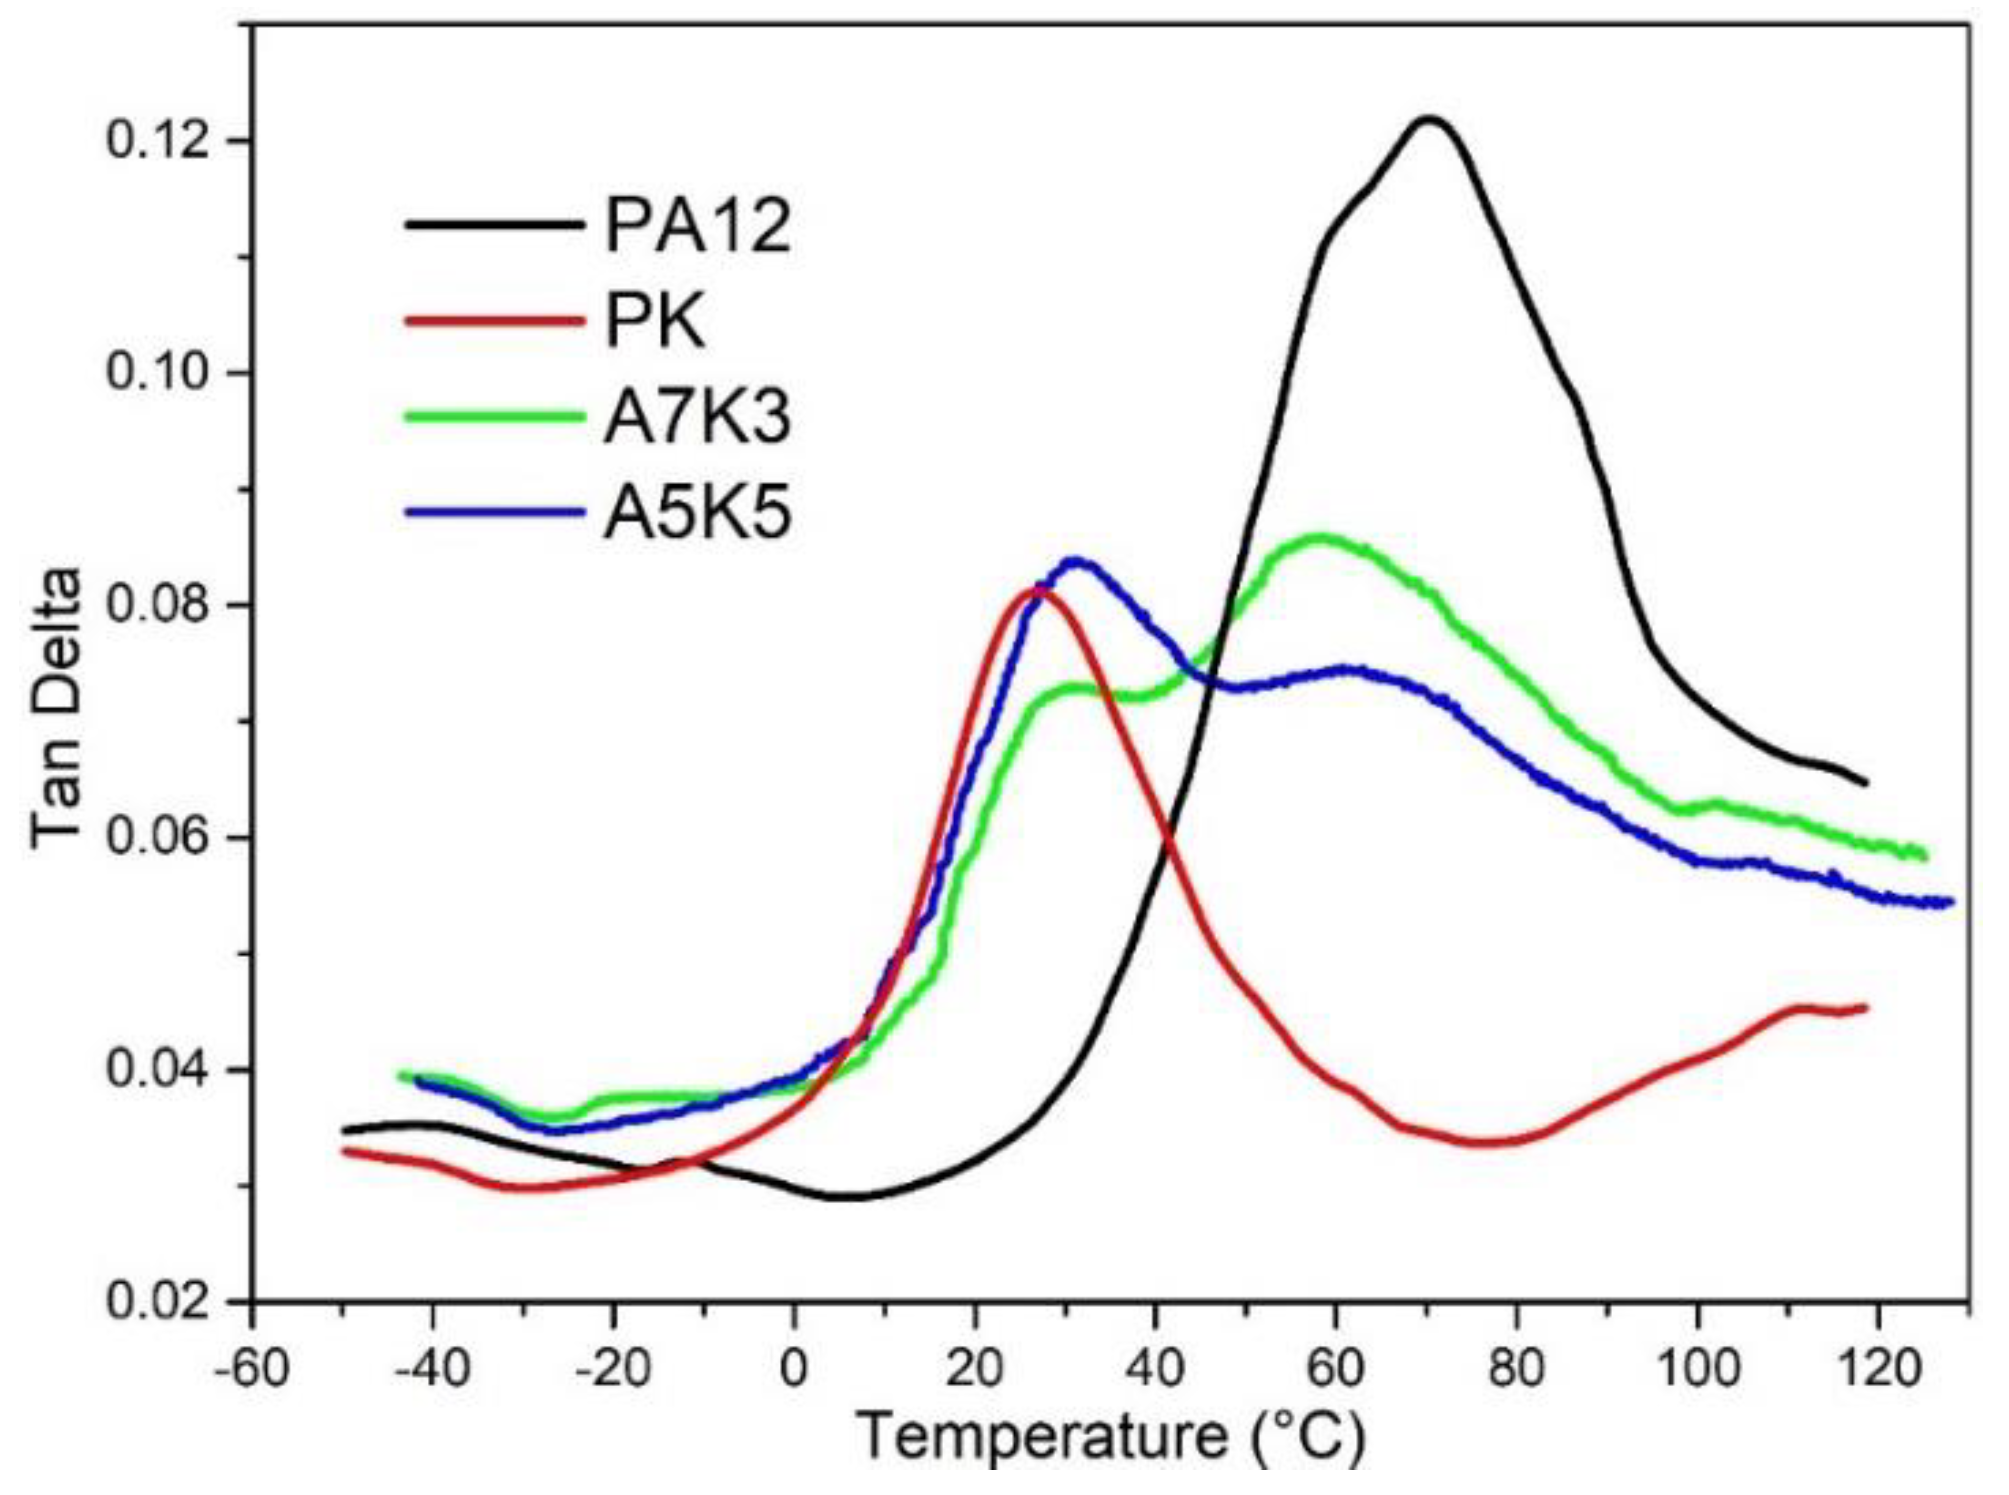
2.2.3. Dynamical Mechanical Analysis (DMA)
2.2.4. Contact Angle Measurements
2.2.5. Differential Scanning Calorimetry (DSC)
2.2.6. Polarized Optical Microscopy (POM)
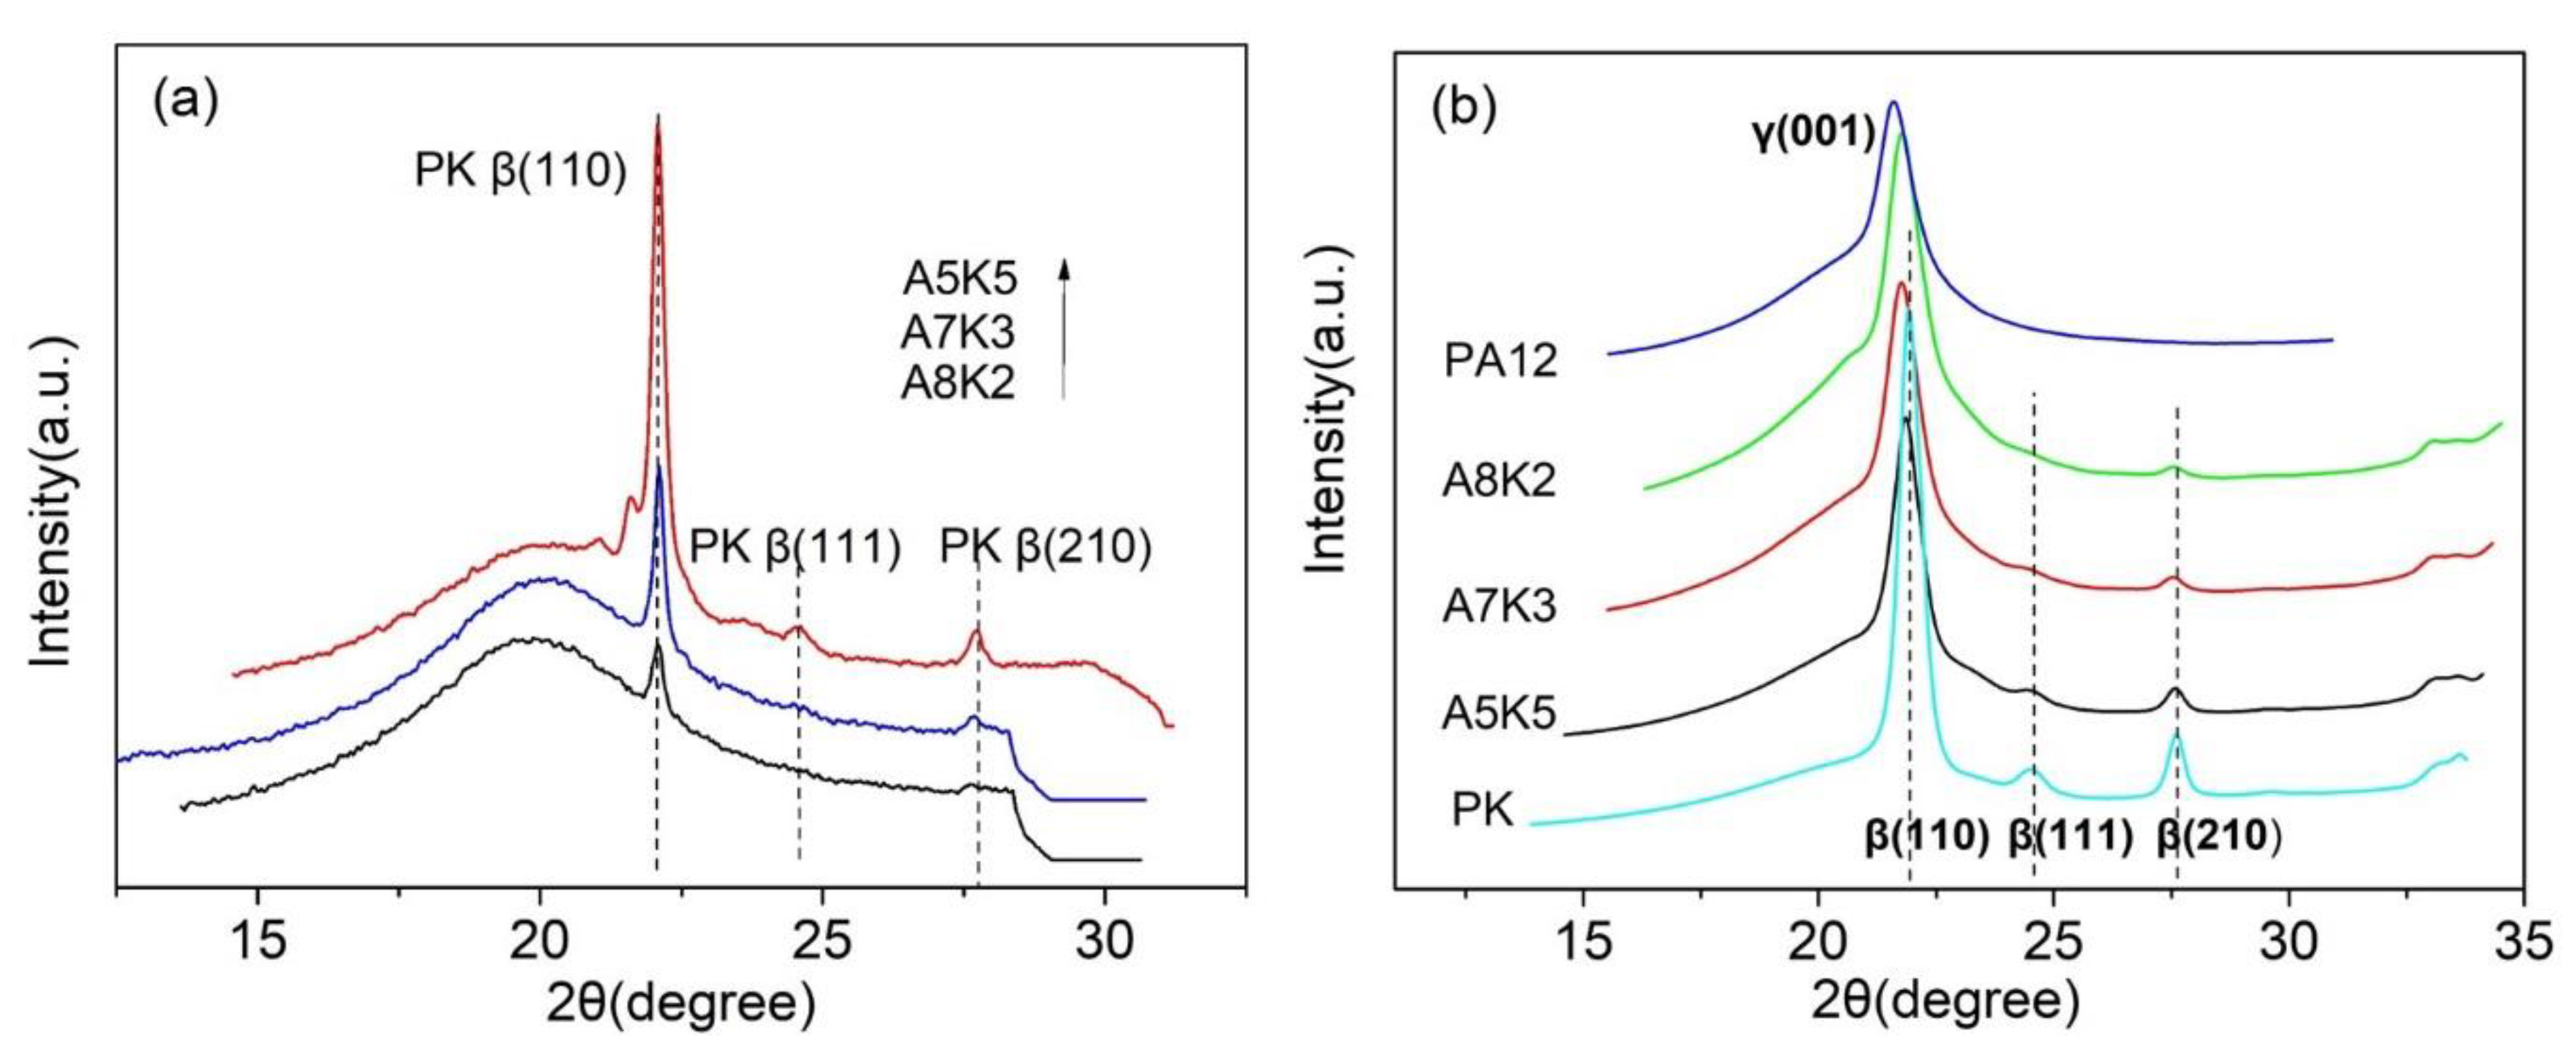
2.2.7. In Situ Wide Angle X-ray Diffraction (WAXD)
2.2.8. Impact Toughness
3. Results and Discussion
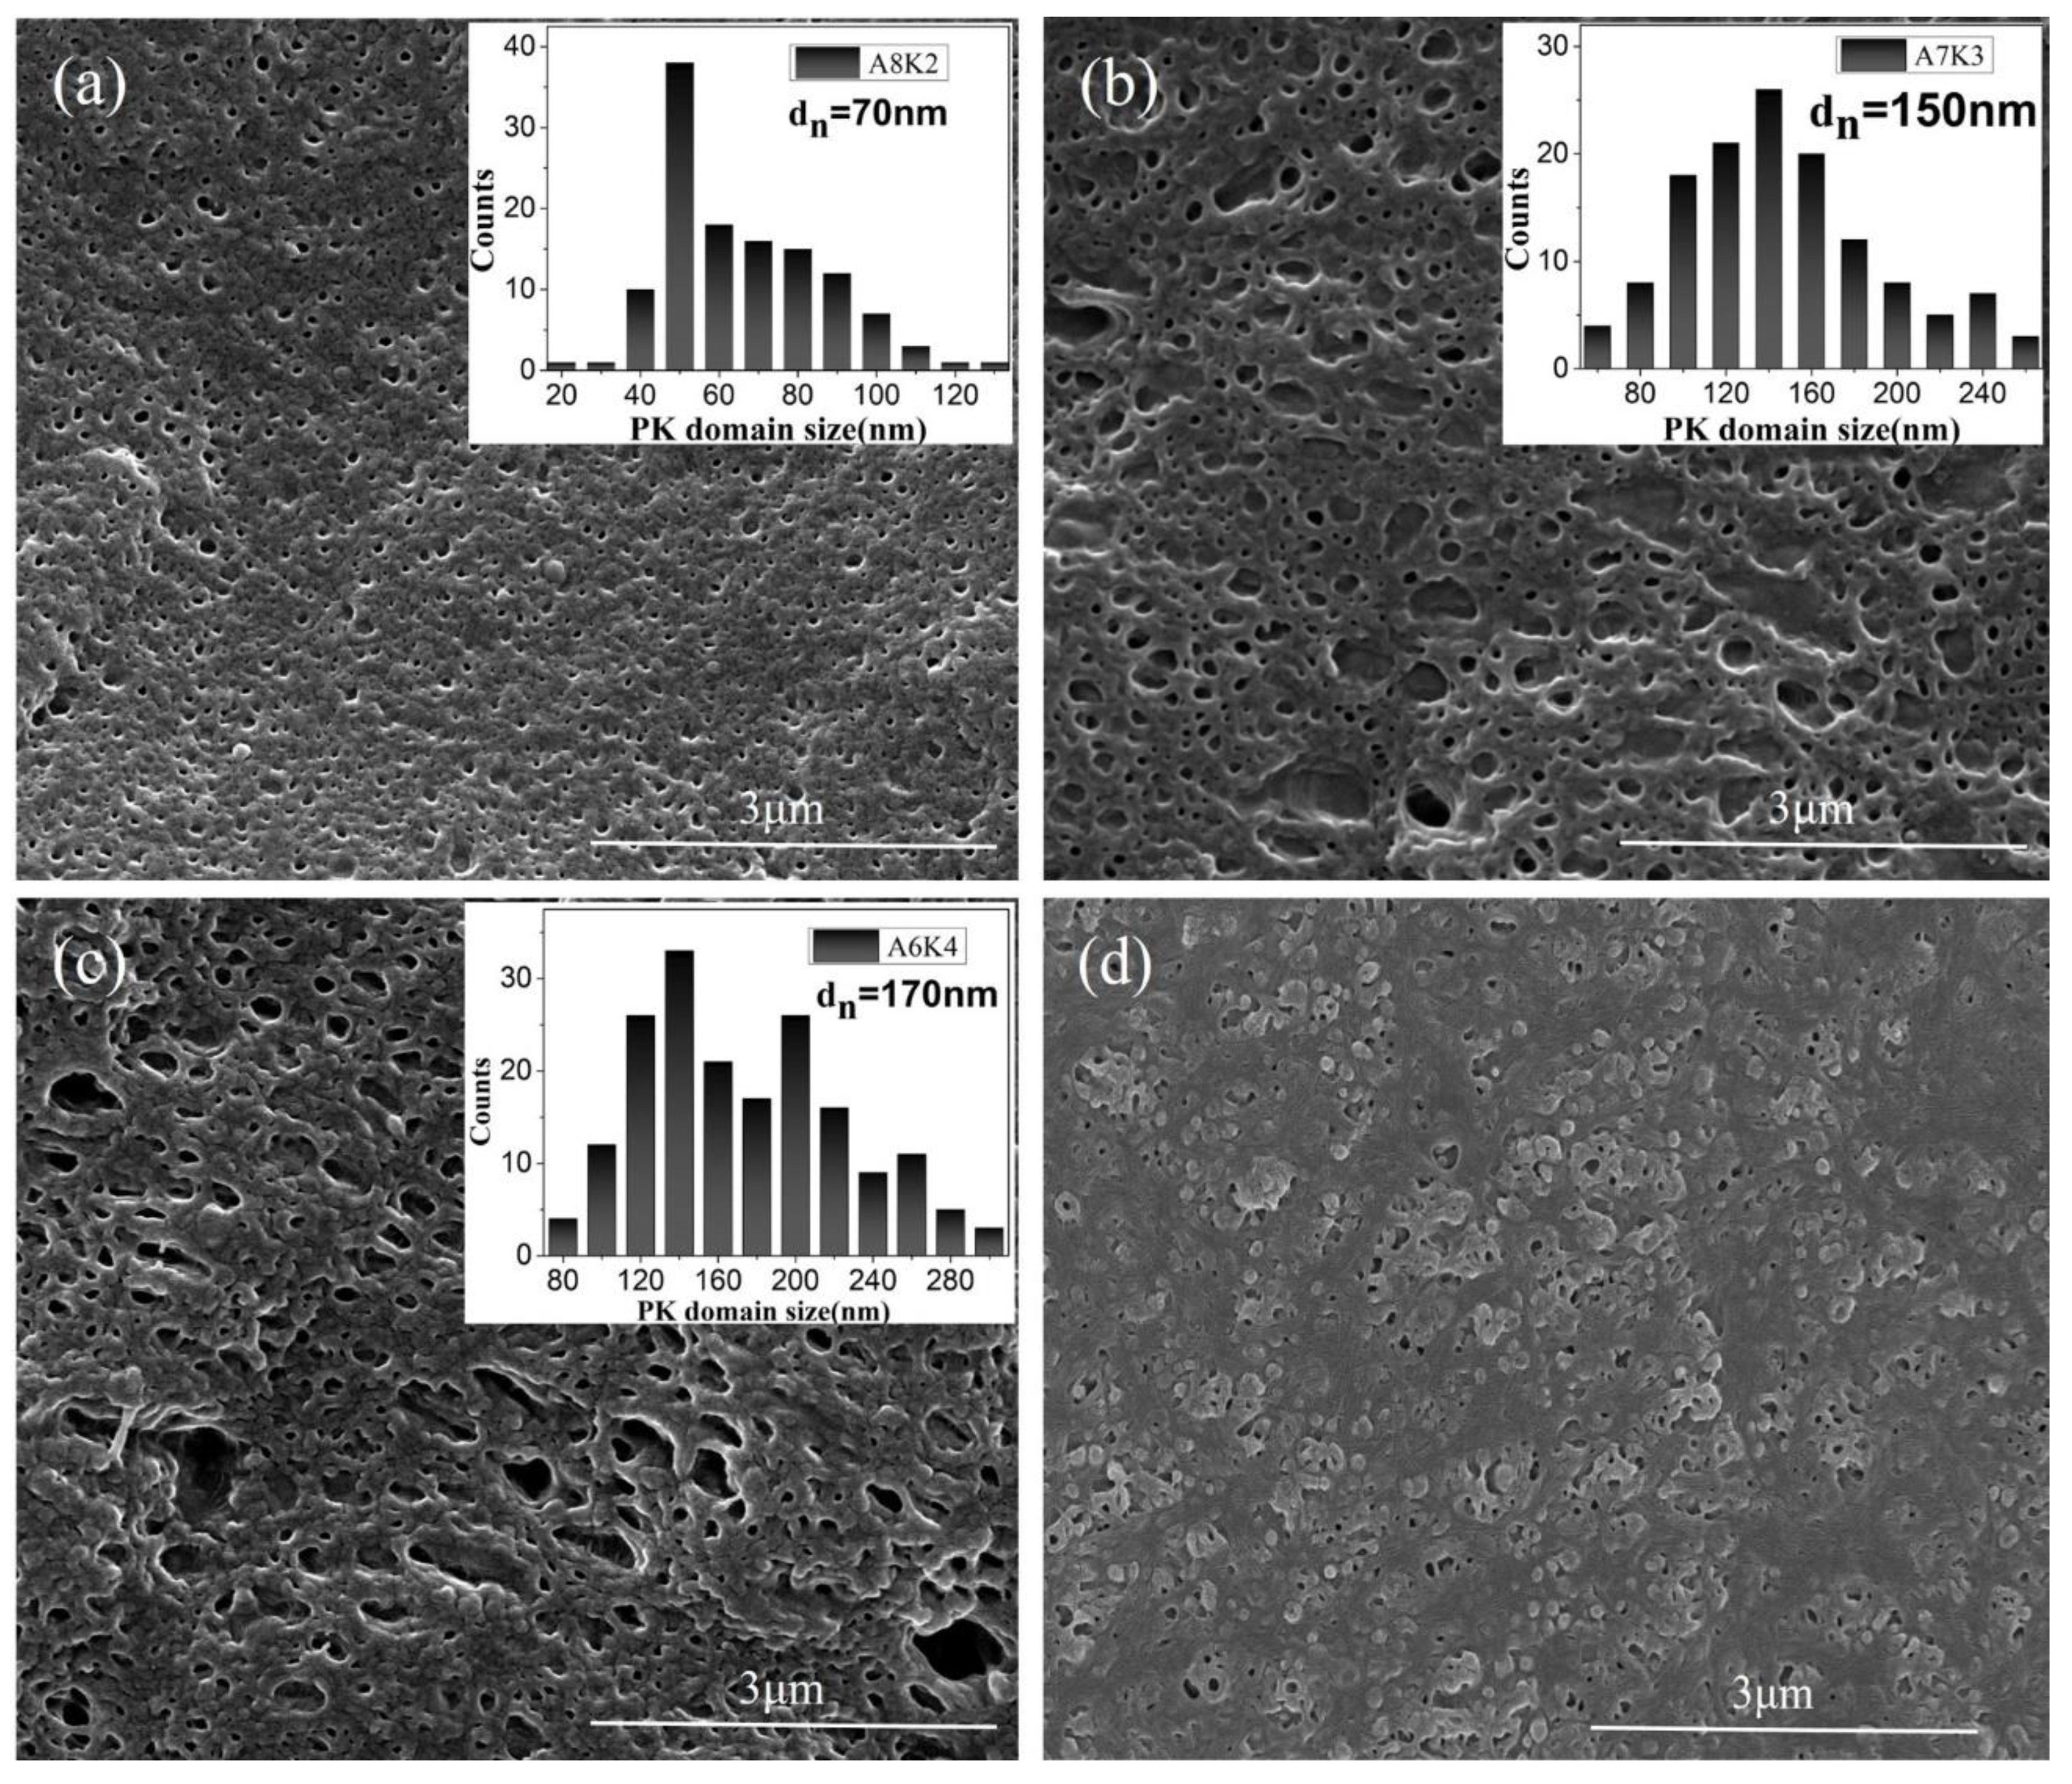
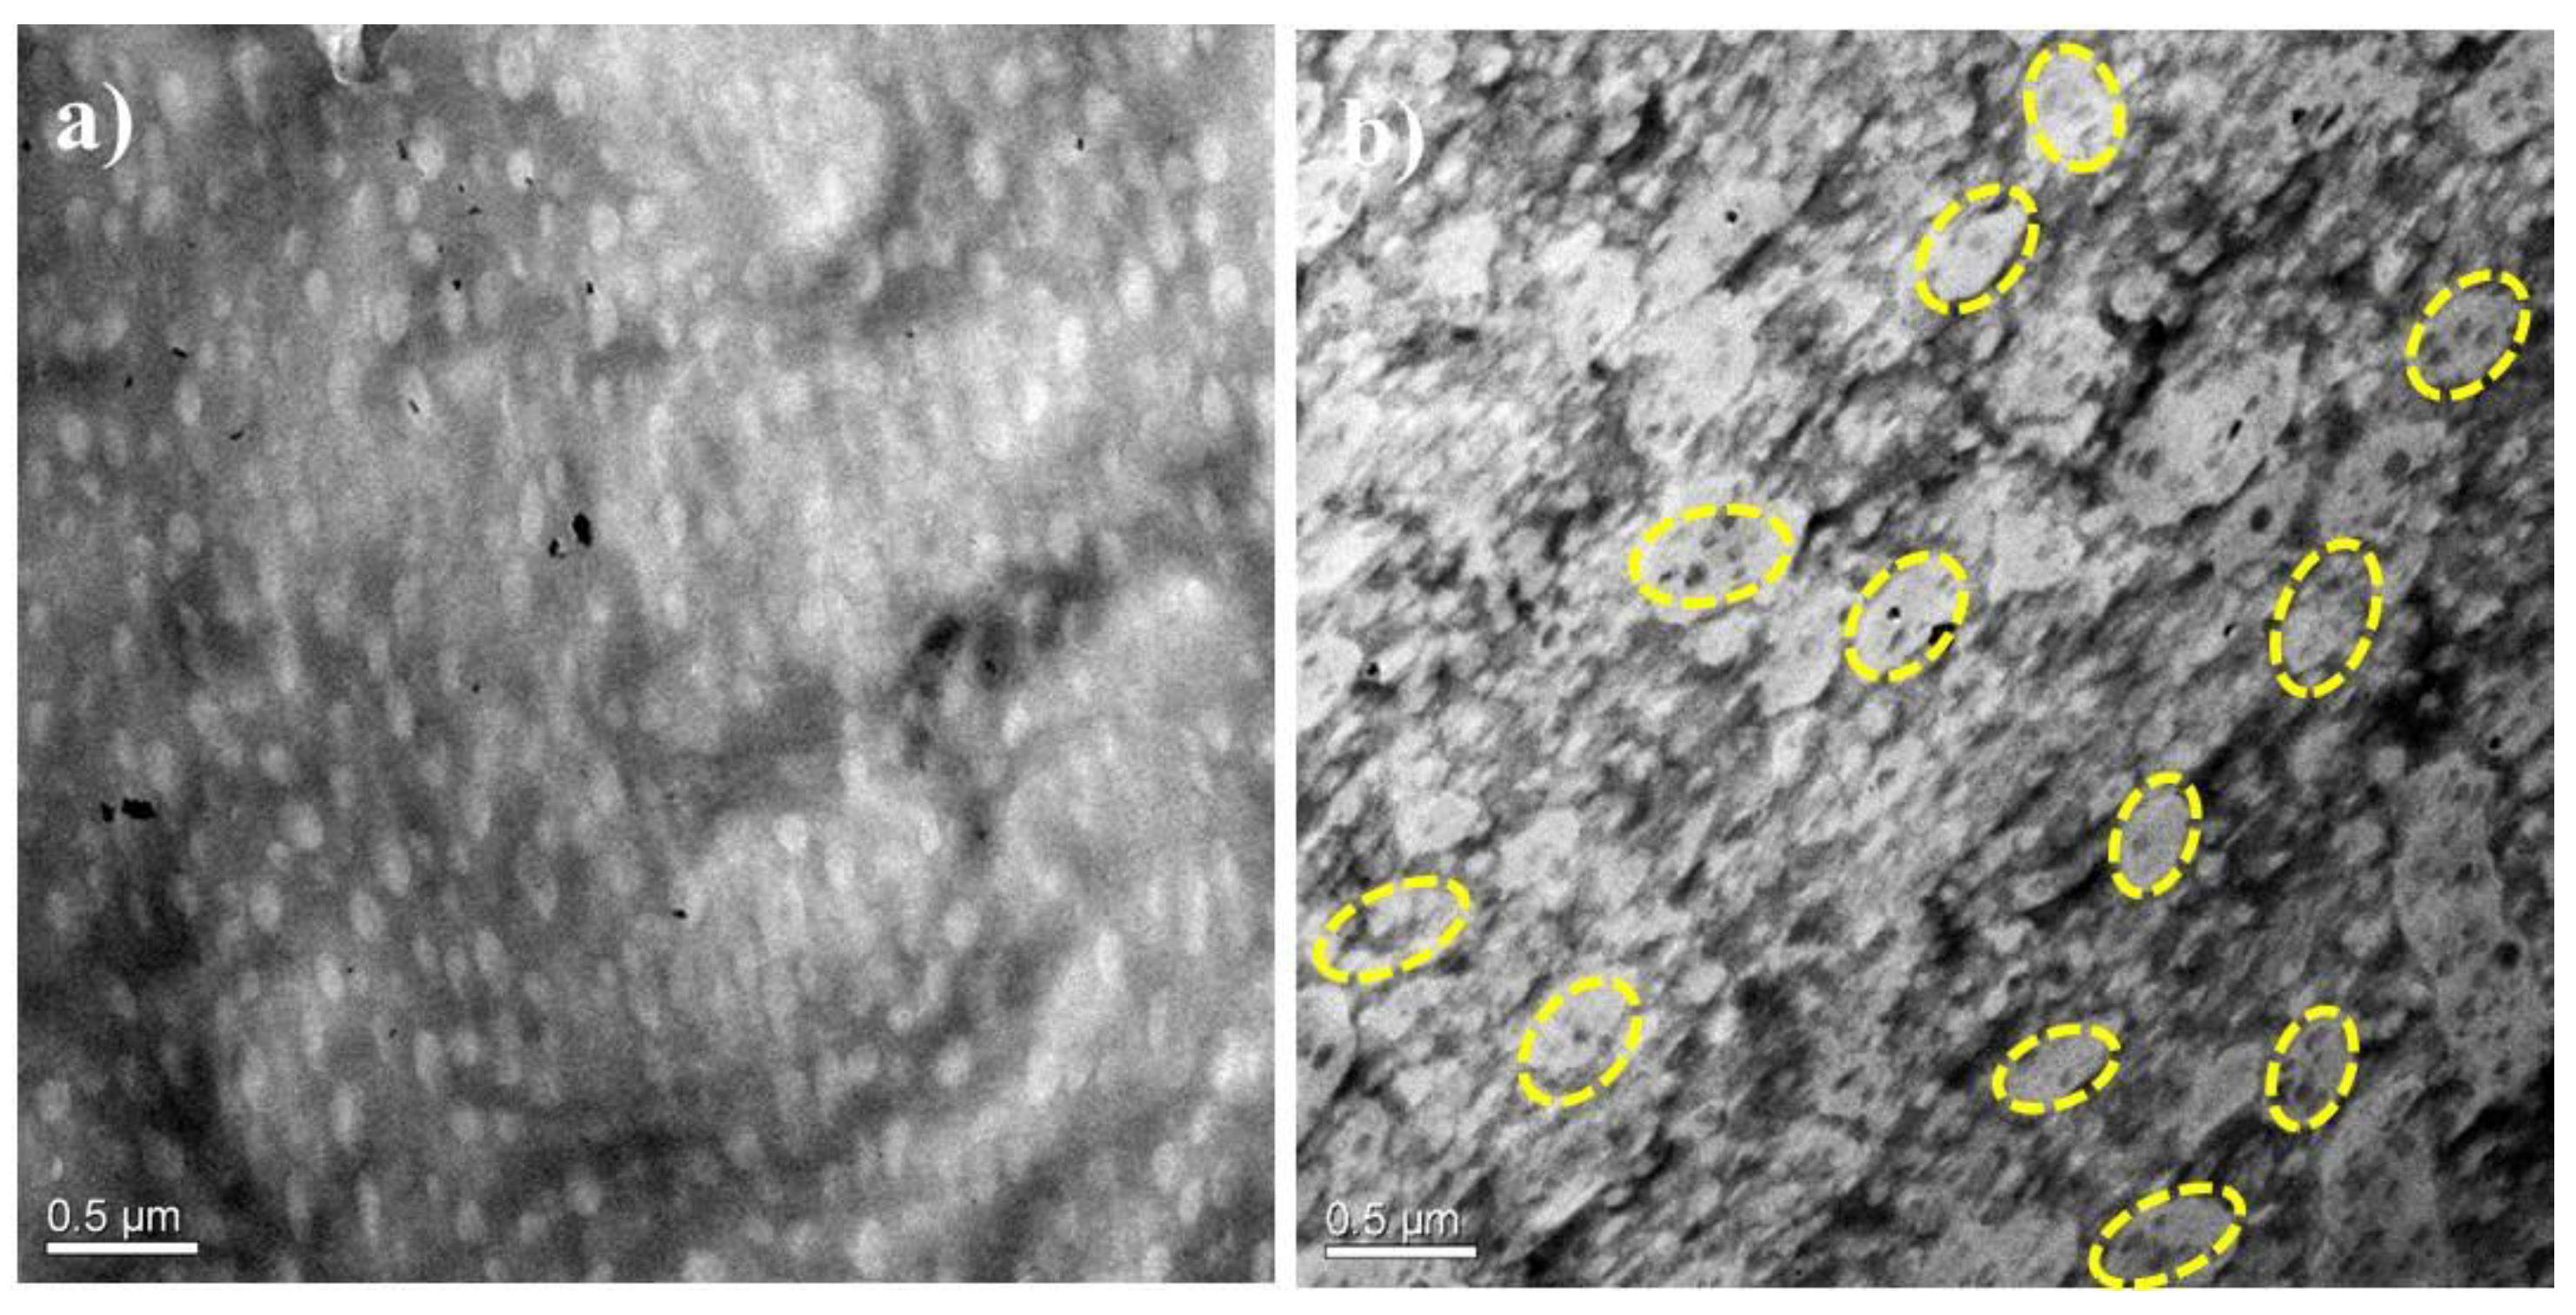
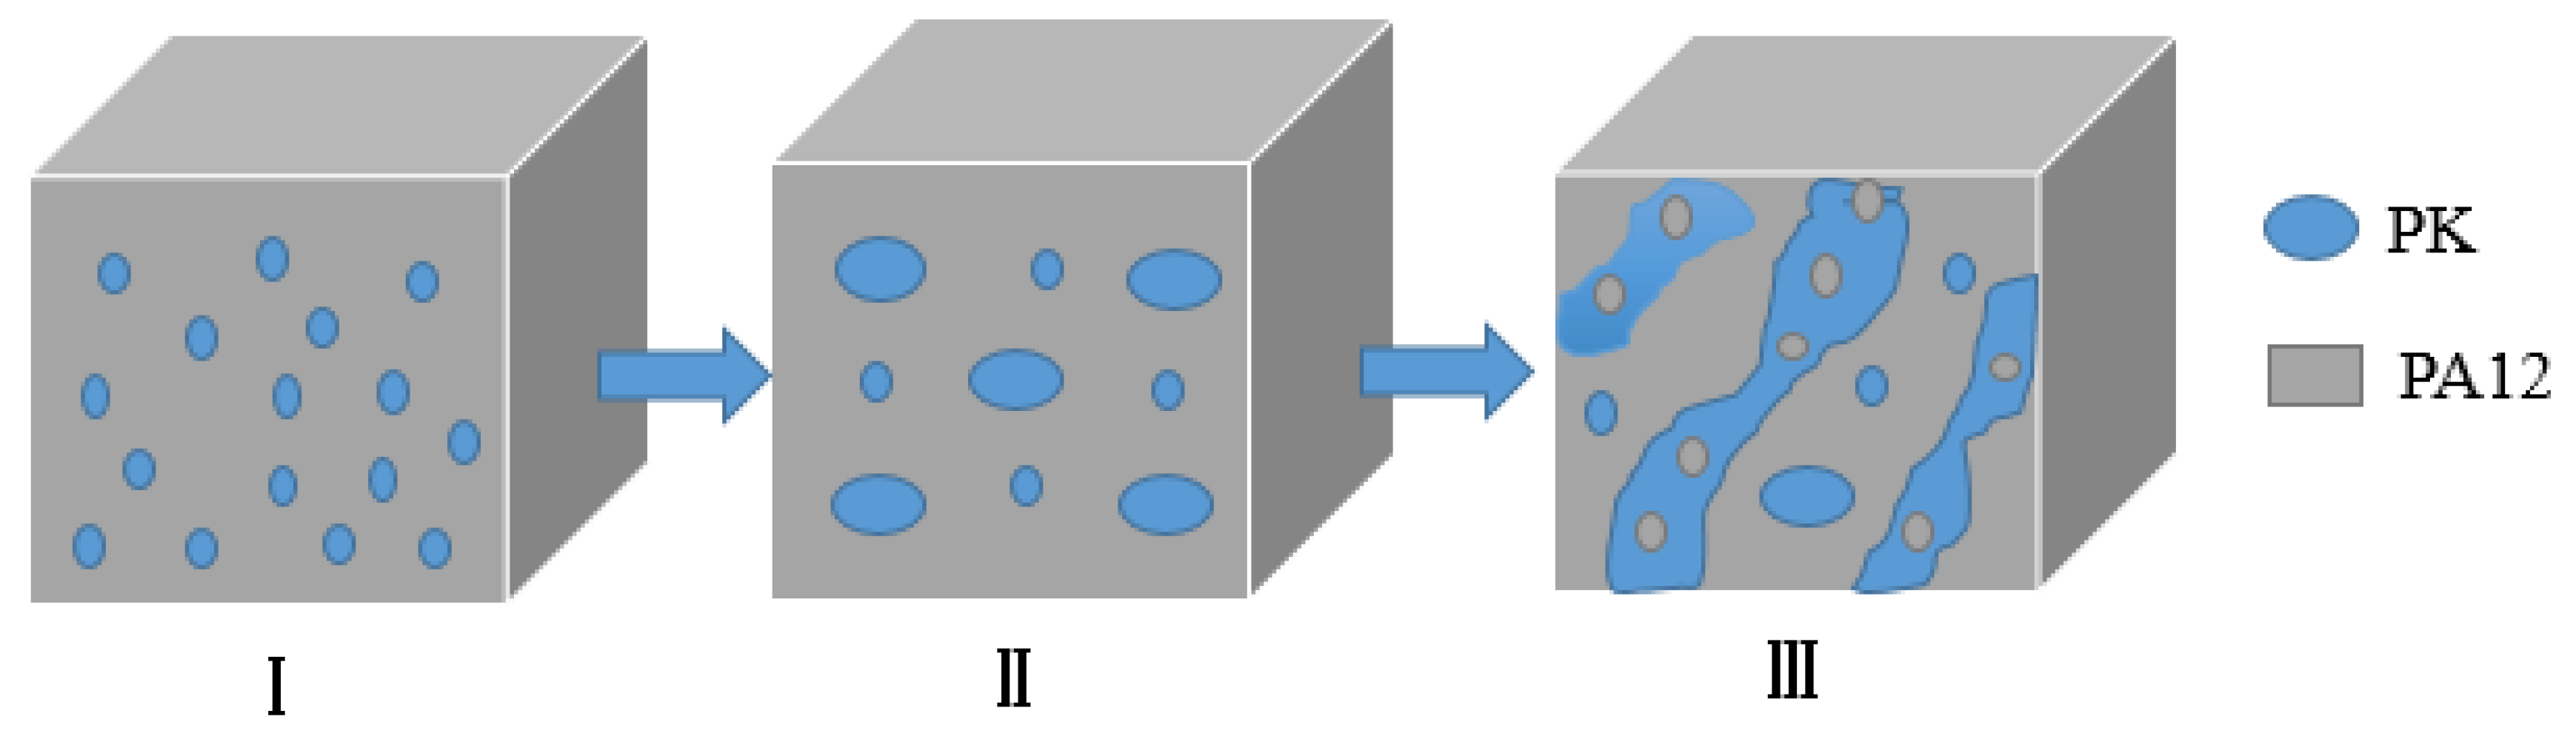
3.1. Morphology
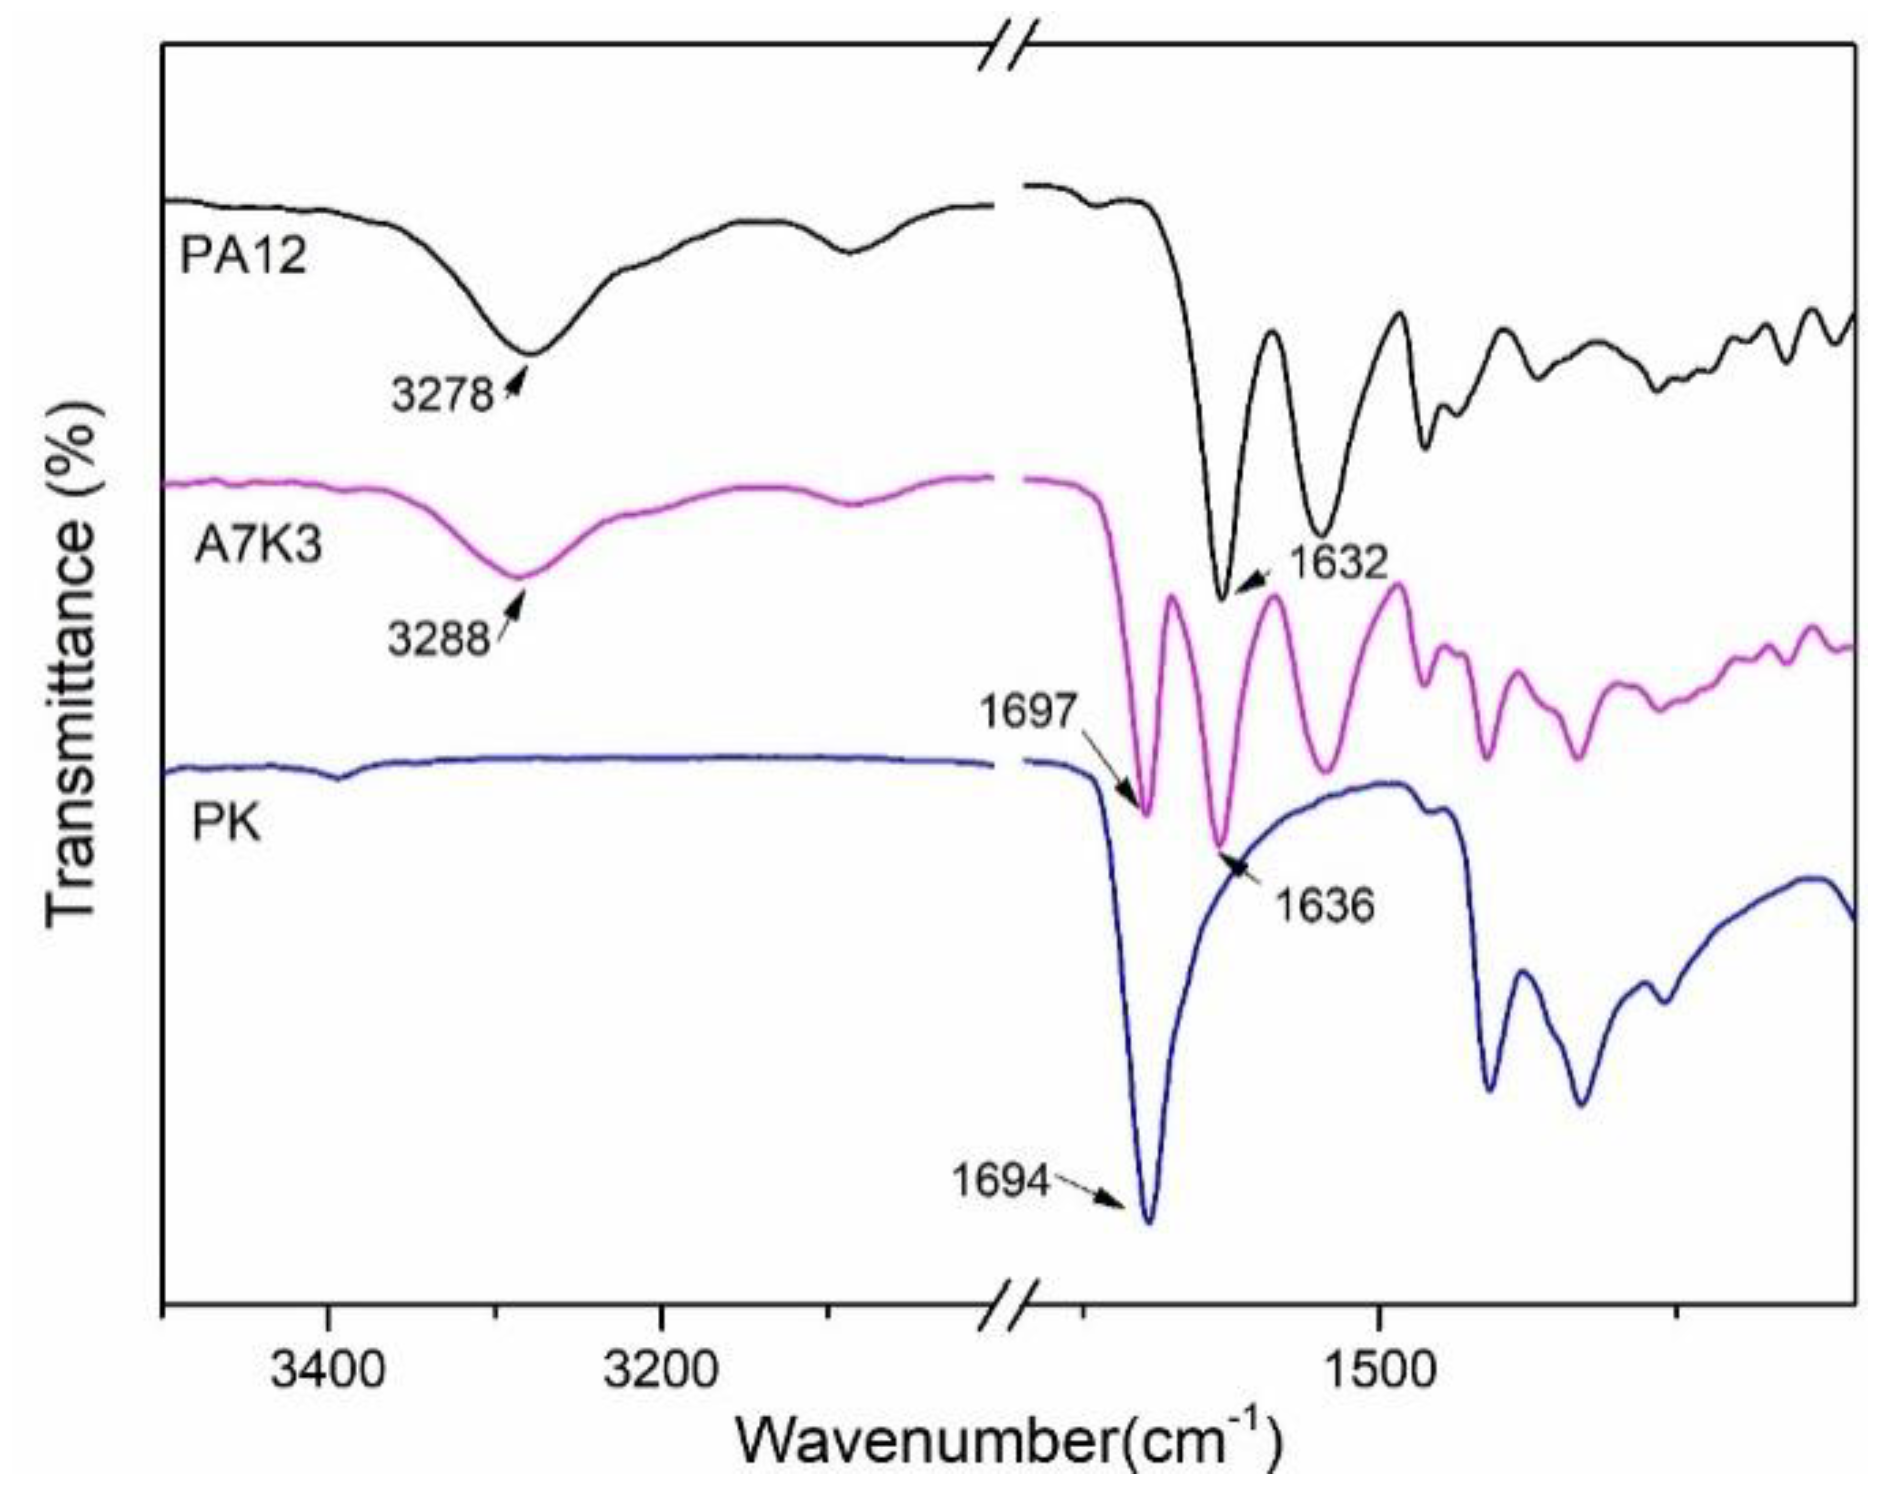
3.2. Miscibility
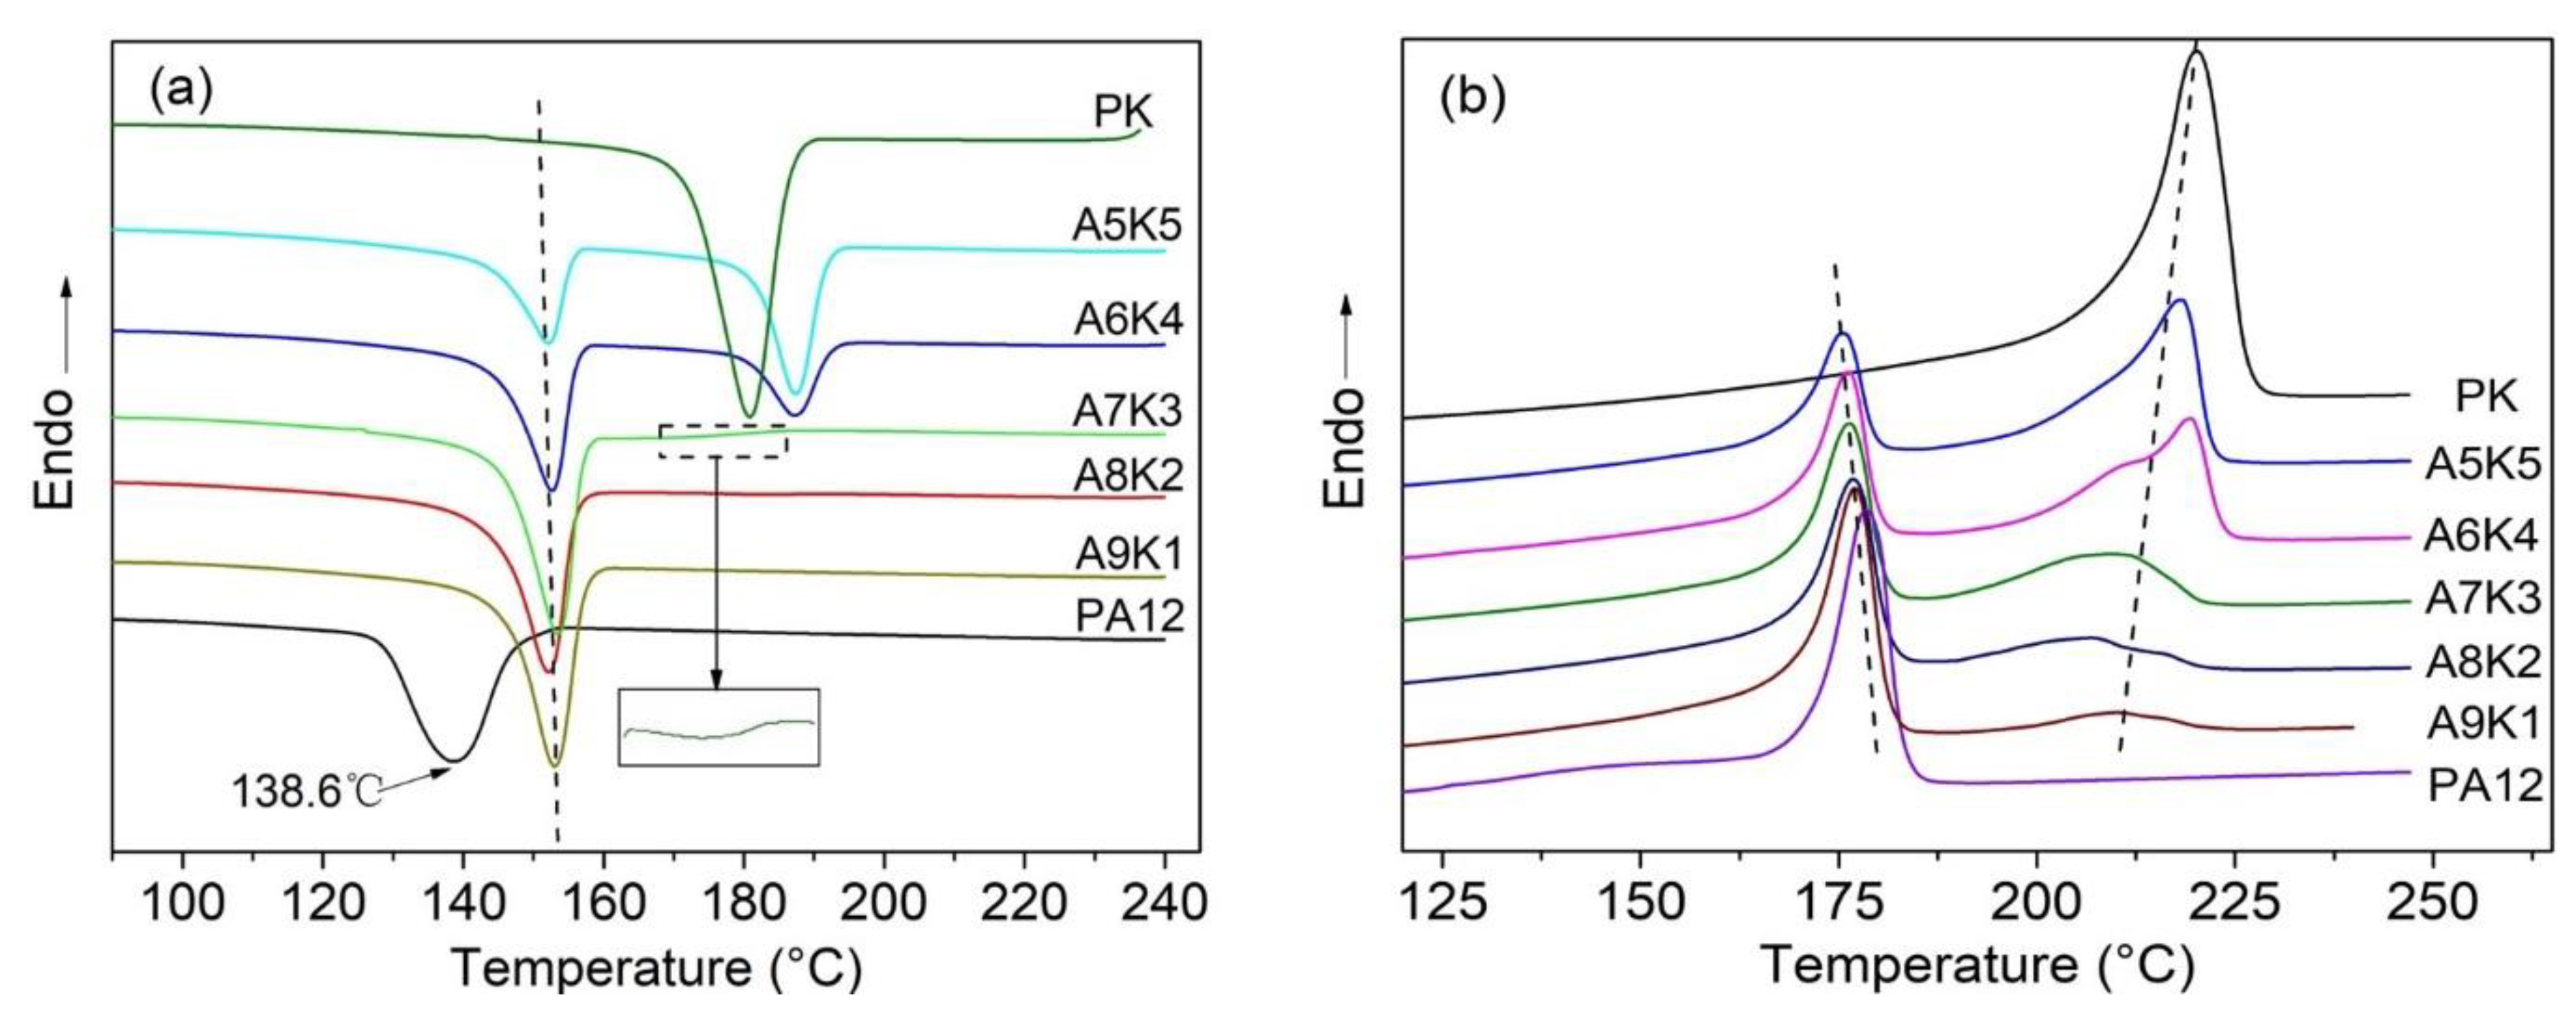
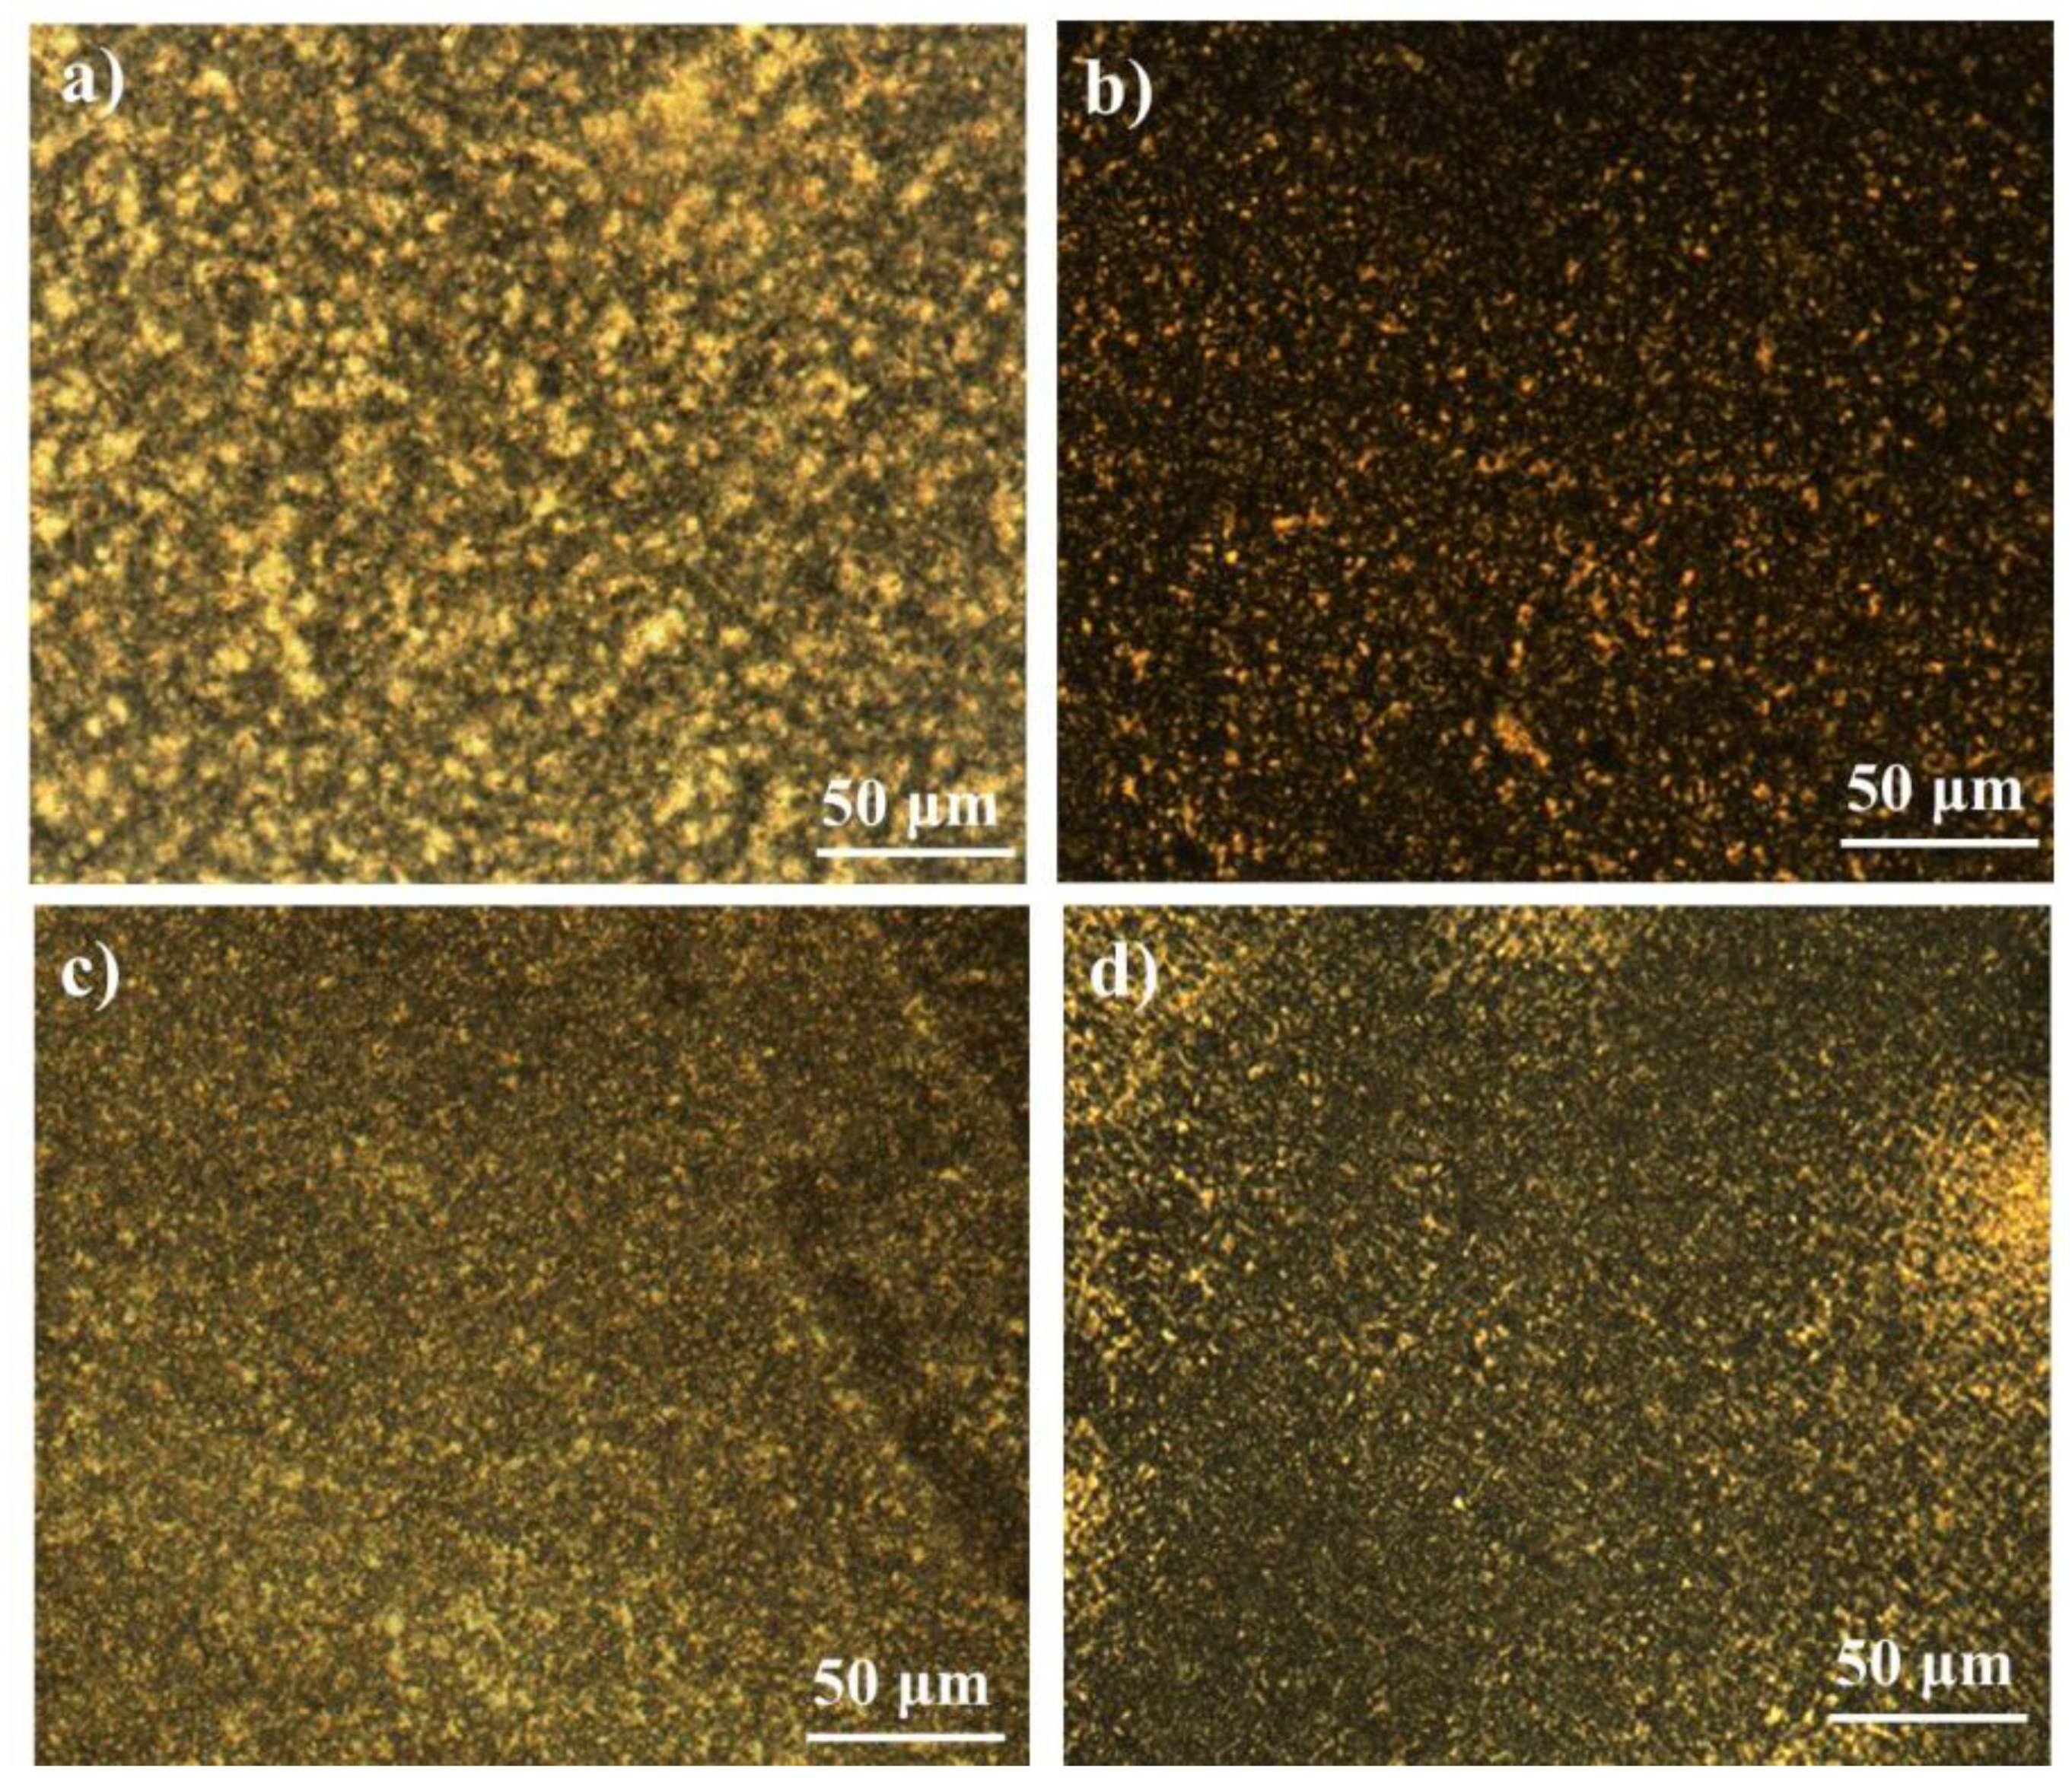
3.3. Crystallization and Melting Behavior
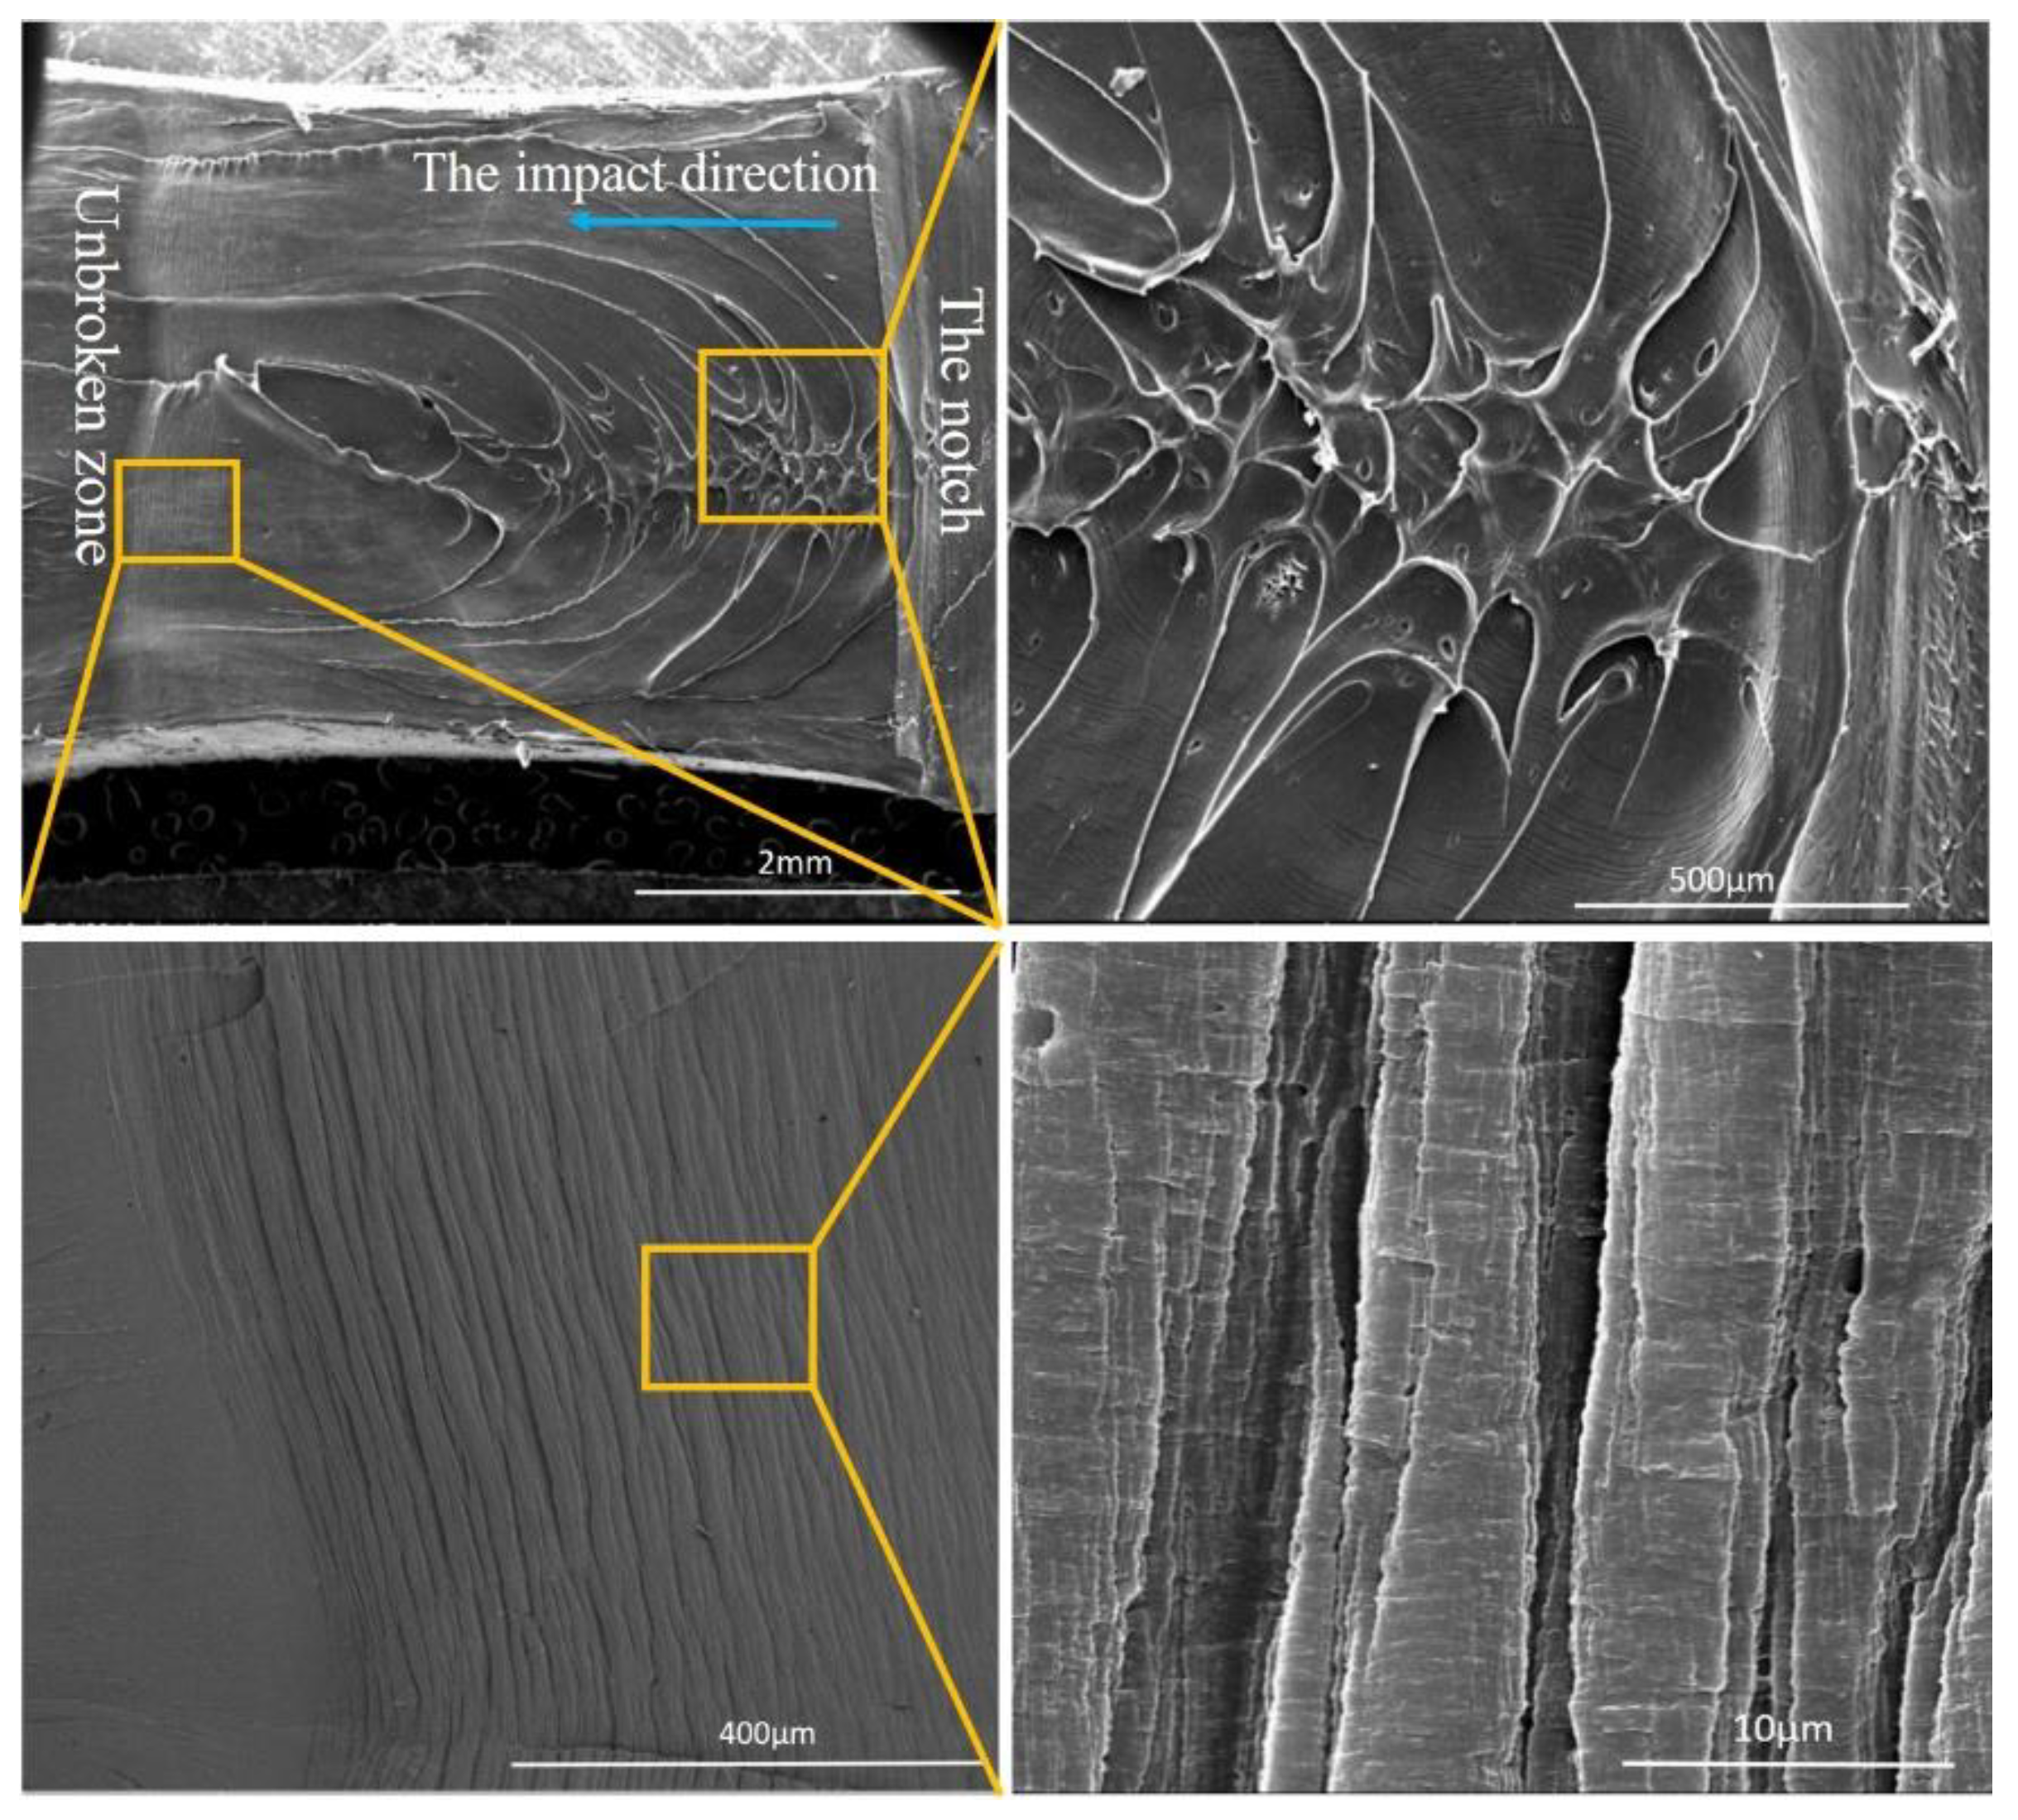
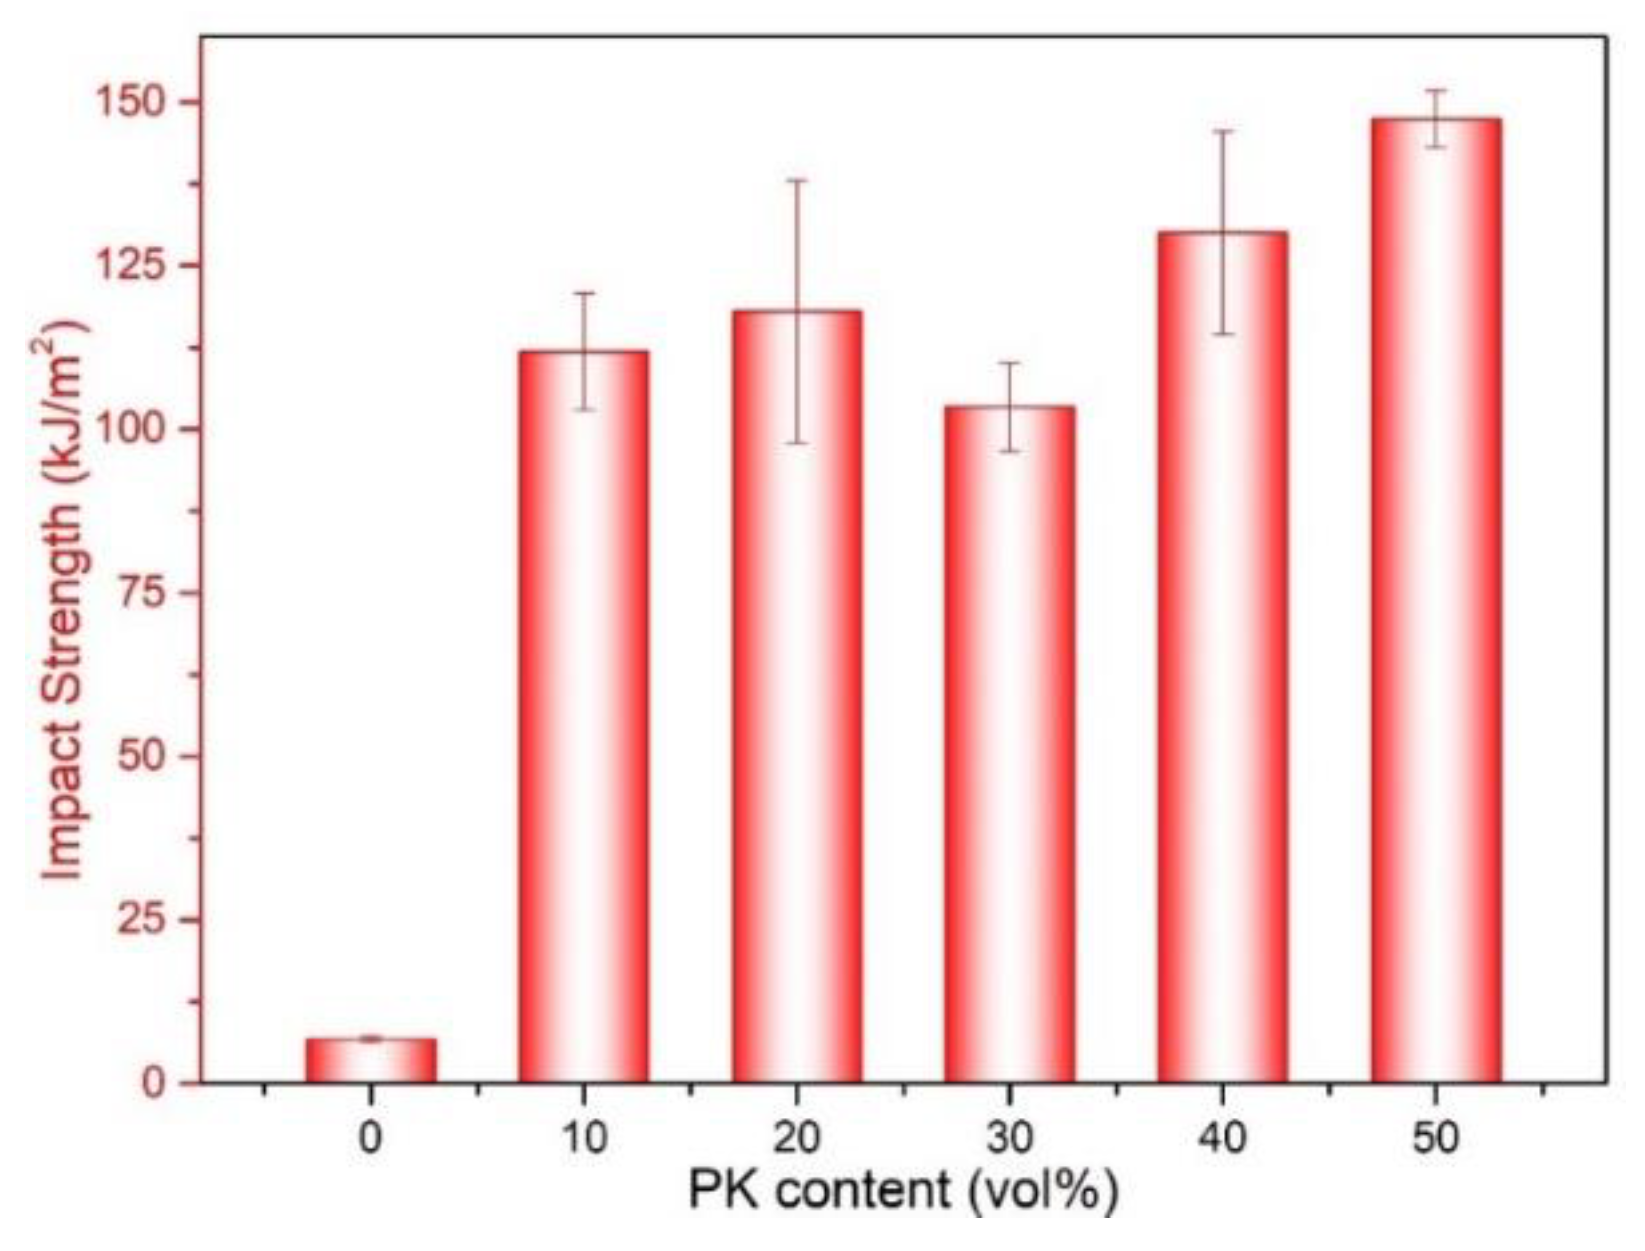
3.4. Toughness
4. Conclusions
Author Contributions
Funding
Conflicts of Interest
References
- Luo, J.J.; Daniel, I.M. Characterization and modeling of mechanical behavior of polymer/clay nanocomposites. Compos. Sci. Technol. 2003, 11, 1607–1616. [Google Scholar] [CrossRef]
- Hussain, F.; Hojjati, M.; Okamoto, M.; Gorga, R.E. Polymer-matrix nanocomposites, processing, manufacturing, and application: An overview. J. Compos. Mater. 2006, 17, 1511–1575. [Google Scholar] [CrossRef]
- Yoonessi, M.; Gaier, J.R. Highly conductive multifunctional graphene polycarbonate nanocomposites. ACS Nano 2010, 12, 7211–7220. [Google Scholar] [CrossRef] [PubMed]
- Aliev, A.E.; Oh, J.; Kozlov, M.E.; Kuznetsov, A.A.; Fang, S.; Fonseca, A.F.; Ovalle, R.; Lima, M.D.; Haque, M.H.; Gartstein, Y.N.; et al. Giant-stroke, superelastic carbon nanotube aerogel muscles. Science 2009, 323, 1575–1578. [Google Scholar] [CrossRef] [PubMed]
- Tan, Y.; Fang, L.; Xiao, J.; Song, Y.; Zheng, Q. Grafting of copolymers onto graphene by miniemulsion polymerization for conductive polymer composites: Improved electrical conductivity and compatibility induced by interfacial distribution of graphene. Polym. Chem. 2013, 4, 2939–2944. [Google Scholar] [CrossRef]
- Ma, D.; Hugener, T.A.; Siegel, R.W.; Christerson, A.; Martensson, E.; Onneby, C.; Schadler, L.S. Influence of nanoparticle surface modification on the electrical behavior of polyethylene nanocomposites. Nanotechnology 2005, 16, 724–731. [Google Scholar] [CrossRef]
- Jiang, L.; Lam, Y.C.; Tam, K.C.; Chua, T.H.; Sim, G.W.; Ang, L.S. Strengthening acrylonitrile-butadiene-styrene (ABS) with nano-sized and micro-sized calcium carbonate. Polymer 2005, 46, 243–252. [Google Scholar] [CrossRef]
- Yong, V.; Hahn, H.T. Processing and properties of SiC/Vinyl ester nanocomposites. Nanotechnology 2004, 15, 1338. [Google Scholar] [CrossRef]
- Eswaraiah, V.; Balasubramaniam, K.; Ramaprabhu, S. Functionalized graphene reinforced thermoplastic nanocomposites as strain sensors in structural health monitoring. J. Mater. Chem. 2011, 34, 12626–12628. [Google Scholar] [CrossRef]
- Gao, S.L.; Zhuang, R.C.; Zhang, J.; Liu, J.W.; Mäder, E. Glass fibers with carbon nanotube networks as multifunctional sensors. Adv. Funct. Mater. 2010, 20, 1885–1893. [Google Scholar] [CrossRef]
- Chen, J.; Shi, Y.Y.; Yang, J.H.; Zhang, N.; Huang, T.; Wang, Y. Improving interfacial adhesion between immiscible polymers by carbon nanotubes. Polymer 2013, 54, 464–471. [Google Scholar] [CrossRef]
- Hillmyer, M.A.; Lipic, P.M.; Hajduk, D.A.; Almdal, K.; Bates, F.S. Self-assembly and polymerization of epoxy resin-amphiphilic block copolymer nanocomposites. J. Am. Chem. Soc. 1997, 11, 2749–2750. [Google Scholar] [CrossRef]
- Lipic, P.M.; Bates, F.S.; Hillmyer, M.A. Nanostructured thermosets from self-assembled amphiphilic block copolymer/epoxy resin mixtures. J. Am. Chem. Soc. 1998, 35, 8963–8970. [Google Scholar] [CrossRef]
- Yang, X.T.; Yi, F.P.; Xin, Z.R.; Zheng, S.X. Morphology and mechanical properties of nanostructured blends of epoxy resin with poly(ε-caprolactone)-block-poly(butadiene-co-acrylonitrile)-block-poly(ε-caprolactone) triblock copolymer. Polymer 2009, 50, 4089–4100. [Google Scholar] [CrossRef]
- Alam, T.M.; Otaigbe, J.U.; Rhoades, D.; Holland, G.P.; Cherry, B.R.; Kotula, P.G. Nanostructured polymer blends: Synthesis and structure. Polymer 2005, 46, 12468–12479. [Google Scholar] [CrossRef]
- Pernot, H.; Baumert, M.; Court, F.; Leibler, L. Design and properties of co-continuous nanostructured polymers by reactive blending. Nat. Mater. 2002, 1, 54–58. [Google Scholar] [CrossRef] [PubMed]
- Manna, S.; Mandal, A.; Nandi, A.K. Fabrication of nanostructured poly(3-thiophene methyl acetate) within poly(vinylidene fluoride) matrix: New physical and conducting properties. J. Phys. Chem. B 2010, 114, 2342–2352. [Google Scholar] [CrossRef] [PubMed]
- Shimizu, H.; Li, Y.J.; Kaito, A.; Sano, H. Formation of nanostructured PVDF/PA11 blends using high-sheer processing. Macromolecules 2005, 38, 7880–7883. [Google Scholar] [CrossRef]
- Li, Y.J.; Shimizu, H. Fabrication of nanostructured polycarbonate/poly(methyl methacrylate)blends with improved optical and mechanical properties by high-shear processing. Polym. Eng. Sci. 2011, 51, 1437–1445. [Google Scholar] [CrossRef]
- Kim, J.K.; Sandoval, R.W.; Dettmer, C.M.; Nguyen, S.T.; Torkelson, J.M. Compatibilized polymer blends with nanoscale or sub-micro dispersed phases achieved by hydrogen-bonding effects:block copolymer vs block gradient copolymer addition. Polymer 2008, 49, 2686–2697. [Google Scholar] [CrossRef]
- Tol, R.T.; Mathot, V.B.F.; Groeninckx, G. Confined crystallization phenomena in immiscible polymer blends with dispersed micro- and nanometer sized PA6 droplets, part 2: Reactively compatibilized PS/PA6 and (PPE/PS)/PA6 blends. Polymer 2005, 46, 383–396. [Google Scholar] [CrossRef]
- Li, Y.J.; Iwakura, Y.; Zhao, L.; Shimizu, H. Nanostructured poly(vinylidene fluoride) materials by melt blending with several percent of acrylic rubber. Macromolecules 2008, 41, 3120–3124. [Google Scholar] [CrossRef]
- Banerjee, S.S.; Bhowmick, A.K. Novel nanostructured polyamide 6/fluoroelastomer thermoplastic elastomeric blends: Influence of interaction and morphology on physical properties. Polymer 2013, 54, 6561–6571. [Google Scholar] [CrossRef]
- Asano, A.; Nishioka, M.; Takahashi, Y.; Kato, A.; Hikasa, S.; Iwabuki, H.; Nagata, K.; Sato, H.; Hasegawa, T.; Sawabe, H.; et al. High impact properties of polyketon/polyamide-6 alloys induced by characteristic morphology and water absorption. Macromolecules 2009, 42, 9506–9514. [Google Scholar] [CrossRef]
- Kato, A.; Nishioka, M.; Takahashi, Y.; Suda, T.; Sawabe, H.; Isoda, A.; Drozdova, O.; Hasegawa, T.; Izumi, T.; Nagata, K.; et al. Phase separation and mechanical properties of polyketon/polyamide polymer alloys. J. Appl. Polym. Sci. 2010, 116, 3056–3069. [Google Scholar] [CrossRef]
- Chen, N.; Yao, X.; Zheng, C.; Tang, Y.J.; Ren, M.Q.; Guo, M.F.; Zhang, S.J.; Liu, L.Z. Study on the miscibility, crystallization and crystalline morphology of polyamide-6/polyvinylidene fluoride blends. Polymer 2017, 124, 30–40. [Google Scholar] [CrossRef]
- Jana, S.C.; Madhusudan, S. Effect of viscosity ratio and composition on development of morphology in chaotic mixing polymers. Polymer 2004, 45, 1665–1678. [Google Scholar] [CrossRef]
- Margolina, A.; Wu, S.H. Percolation model for brittle-tough transition in nylon/rubber blends. Polymer 1988, 29, 2170–2173. [Google Scholar] [CrossRef]
- Dalal, E.N. Calculation of solid surface tensions. Langmuir 1987, 3, 1009–1015. [Google Scholar] [CrossRef]
- McNally, T.; Murphy, W.R.; Lew, C.Y.; Turner, R.J.; Brennan, G.P. Polyamide-12 layered silicate nanocomposites by melt blending. Polymer 2003, 44, 2761–2772. [Google Scholar] [CrossRef]
- Gupta, P.; Schulte, J.T.; Flood, J.E.; Spruiell, J.E. Development of high strength fibers from aliphatic polyketones by melt spinning and drawing. J. Appl. Polym. Sci. 2001, 82, 1794–1815. [Google Scholar] [CrossRef]
- Zhou, C.J.; Wang, K.; Fu, Q. Toughening of polyamide 11 via addition of crystallizable polyethylene derivatives. Polym. Int. 2009, 58, 538–544. [Google Scholar] [CrossRef]
- Li, Y.J.; Shimizu, H. Morphological investigations on the nanostructured poly(vinylidene fluoride)/polyamide 11 blends by high-shear processing. Eur. Polym. J. 2006, 42, 3202–3211. [Google Scholar] [CrossRef]
- Qiu, Z.B.; Ikehara, T.; Nishi, T. Miscibility and crystallization in crystalline/crystalline blends of poly(butylene succinate)/poly(ethylene oxide). Polymer 2003, 44, 2799–2806. [Google Scholar] [CrossRef]
- He, Y.S.; Zeng, J.B.; Li, S.L.; Wang, Y.Z. Crystallization behavior of partially miscible biodegradable poly(butylene succinate)/poly(ethylene succinate) blends. Therm. Acta 2012, 529, 80–86. [Google Scholar] [CrossRef]
- Chien, R.H.; Lai, C.T.; Hong, J.L. Restricted molecular rotation and enhanced emission in polymer blends of poly(fluorine-alt-naphthol) and poly(vinyl pyrrolidone) with mutual hydrogen-bond interactions. J. Phys. Chem. C 2011, 115, 20732–20739. [Google Scholar] [CrossRef]
- Zhang, H.X.; Huh, S.R.; Ko, E.B.; Park, B.S.; Yoon, K.B. Isothermal-crystallization kinetics and spherulite growth of aliphatic polyketone/polyamide-6 blends. Chin. J. Polym. Sci. 2017, 35, 782–792. [Google Scholar] [CrossRef]
- Ryu, S.C.; Kim, J.Y.; Kim, W.N. Relationship between the interfacial tension and compatibility of polycarbonate and poly(acrylonitrile-butadiene-styrene) blends with reactive compatibilizers. J. Appl. Polym. Sci. 2018, 135, 46418. [Google Scholar] [CrossRef]
- Asl, F.H.; Saeb, M.R.; Jafari, S.H.; Khonakdar, H.A.; Rastin, H.; Potschke, P.; Vogel, R.; Stadler, F.J. Looking back to interfacial tension prediction in the compatibilized polymer blends: Discrepancies between theories and experiments. J. Appl. Polym. Sci. 2018, 135, 46144. [Google Scholar] [CrossRef]
- Ma, L.F.; Bao, R.Y.; Huang, S.L.; Liu, Z.Y.; Yang, W.; Xie, B.H.; Yang, M.B. Electrical properties and morphology of carbon black filled PP/EPDM blends: Effect of selective distribution of fillers induced by dynamic vulcanization. J. Mater. Sci. 2013, 48, 4942–4951. [Google Scholar] [CrossRef]
- Li, L.P.; Yin, B.; Zhou, Y.; Gong, L.; Yang, M.B.; Xie, B.H.; Chen, C. Characterization of PA6/EPDM-g-MA/HDPE ternary blends: The role of core-shell structure. Polymer 2012, 53, 3043–3051. [Google Scholar] [CrossRef]
- Chen, J.; Chen, J.W.; Chen, H.M.; Yang, J.H.; Chen, C.; Wang, Y. Effect of compatibilizer and clay on morphology and fracture resistance of immiscible high density polyethylene/polyamide 6 blend. Compos. Part B Eng. 2013, 54, 422–430. [Google Scholar] [CrossRef]
- Pan, P.J.; Zhao, L.; Zhu, B.; He, Y.; Inoue, Y. Fractionated crystallization and self-nucleation behavior of poly(ethylene oxide) in its miscible blends with poly(3-hydroxybutyrate). J. Appl. Polym. Sci. 2010, 117, 3013–3022. [Google Scholar] [CrossRef]
- Zhang, H.X.; Park, M.J.; Moon, Y.K.; Ko, E.B.; Zhang, X.Q.; Yoon, K.B. An efficient organic additive to control the crystallization rate of aliphatic polyketone: A non-isothermal crystallization kinetics study. Chin. J. Polym. Sci. 2017, 35, 547–557. [Google Scholar] [CrossRef]
- Waddon, A.J.; Karttunen, N.R. Poly(olefin ketone)s: Comparison of the effects of CH3 and CH3CH2 side group on the crystal structure. Macromolecules 2002, 35, 4003–4008. [Google Scholar] [CrossRef]
- Chen, L.; Chen, W.; Zhou, W.M.; Li, J.; Liu, Y.P.; Qi, Z.M.; Li, L.B. In situ microscopic infrared imaging study on deformation-induced spatial orientation and phase transition distributions of PA12. J. Appl. Polym. Sci. 2014, 131, 40703. [Google Scholar] [CrossRef]
- Mao, Y.M.; Bucknall, D.G.; Kriegel, R.M. Synchrotron X-ray scattering study on amorphous poly(ethylene furanoate) under uniaxial deformation. Polymer 2018, 139, 60–67. [Google Scholar] [CrossRef]
- Kurauchi, T.; Ohta, T. Energy absorption in blends of polycarbonate with ABS and SAN. J. Mater. Sci. 1984, 19, 1699–1709. [Google Scholar] [CrossRef]
- Oliveira, M.J.; Cramez, M.C. Rotational molding of polyolefins: Processing, morphology, and properties. J. Macromol. Sci. Part B 2001, 40, 457–471. [Google Scholar] [CrossRef]
- McGenity, P.M.; Hooper, J.J.; Paynter, C.D.; Riley, A.M.; Nutbeem, C.; Elton, N.J.; Adams, J.M. Nucleation and crystallization of polypropylene by mineral fillers: Relationship to impact strength. Polymer 1992, 33, 5215–5224. [Google Scholar] [CrossRef]
- Wu, S.H. A generalized criterion for rubber toughening: The critical matrix ligament thickness. J. Appl. Polym. Sci. 1988, 35, 549–561. [Google Scholar] [CrossRef]
- Wu, S.H. Phase structure and adhesion in polymer blends: A criterion for rubber toughening. Polymer 1985, 26, 1855–1863. [Google Scholar] [CrossRef]


| Sample | Contact Angle (°) | Surface Tension (mN/m) | |||
|---|---|---|---|---|---|
| Water | Diiodomethane | Total (γ) | Dispersion Component (γd) | Polar Component (γp) | |
| PA12 | 81.1 | 41.2 | 39.96 | 36.14 | 3.83 |
| PK | 73.8 | 23.7 | 47.94 | 42.96 | 4.99 |
| Samples | PA12 | PK | ||||||
|---|---|---|---|---|---|---|---|---|
| Tc (°C) | Tonset (°C) | ΔW (°C) | ΔHc (J/g) | Tc (°C) | Tonset (°C) | ΔW (°C) | ΔHc (J/g) | |
| PK | - | - | - | - | 180.9 | 186.5 | 8.4 | 78.5 |
| A5K5 | 152.1 | 155.6 | 6.6 | 21.2 | 187.4 | 191.7 | 6.1 | 32.7 |
| A6K4 | 152.6 | 156.1 | 6.5 | 33.0 | 187.3 | 192.3 | 7.2 | 18.2 |
| A7K3 | 153.5 | 157.1 | 6.6 | 43.3 | 175.8 | 187.3 | 17.7 | 3.8 |
| A8K2 | 152.2 | 157.0 | 6.8 | 46.0 | - | - | - | - |
| A9K1 | 153.1 | 157.3 | 6.7 | 47.8 | - | - | - | - |
| PA12 | 138.6 | 147.3 | 12.0 | 49.7 | - | - | - | - |
| Samples | PA12 | PK | ||||
|---|---|---|---|---|---|---|
| Tm (°C) | ΔHm (J/g) | Xc (%) | Tm (°C) | ΔHm (J/g) | Xc (%) | |
| PK | - | - | - | 220.2 | 86.85 | 39.1 |
| A5K5 | 175.6 | 13.58 | 14.8 | 218.3 | 34.16 | 27.3 |
| A6K4 | 176.2 | 18.09 | 15.7 | 219.4 | 26.91 | 26.3 |
| A7K3 | 177.2 | 21.82 | 15.9 | 209.7 | 14.75 | 18.8 |
| A8K2 | 176.8 | 30.24 | 18.9 | 207.0 | 7.74 | 14.5 |
| A9K1 | 177.1 | 40.5 | 21.9 | 210.0 | 4.24 | 15.6 |
| PA12 | 178.4 | 45.66 | 21.8 | - | - | - |
© 2018 by the authors. Licensee MDPI, Basel, Switzerland. This article is an open access article distributed under the terms and conditions of the Creative Commons Attribution (CC BY) license (http://creativecommons.org/licenses/by/4.0/).
Share and Cite
Li, S.; Yang, Y.; Zha, X.; Zhou, Y.; Yang, W.; Yang, M. Nanoscale Morphology, Interfacial Hydrogen Bonding, Confined Crystallization and Greatly Improved Toughness of Polyamide 12/Polyketone Blends. Nanomaterials 2018, 8, 932. https://doi.org/10.3390/nano8110932
Li S, Yang Y, Zha X, Zhou Y, Yang W, Yang M. Nanoscale Morphology, Interfacial Hydrogen Bonding, Confined Crystallization and Greatly Improved Toughness of Polyamide 12/Polyketone Blends. Nanomaterials. 2018; 8(11):932. https://doi.org/10.3390/nano8110932
Chicago/Turabian StyleLi, Siyuan, Yan Yang, Xiangjun Zha, Yicun Zhou, Wei Yang, and Mingbo Yang. 2018. "Nanoscale Morphology, Interfacial Hydrogen Bonding, Confined Crystallization and Greatly Improved Toughness of Polyamide 12/Polyketone Blends" Nanomaterials 8, no. 11: 932. https://doi.org/10.3390/nano8110932