Green Synthesis of High Temperature Stable Anatase Titanium Dioxide Nanoparticles Using Gum Kondagogu: Characterization and Solar Driven Photocatalytic Degradation of Organic Dye

 ,
,  and
and 
Abstract
:
1. Introduction
2. Materials and Methods
2.1. Materials
2.2. Fabrication of TiO2 Nanoparticles
2.3. Characterization of TiO2 Nanoparticles
2.3.1. X-Ray Diffraction (XRD) Analysis
2.3.2. FTIR Analysis
2.3.3. Raman Spectra
2.3.4. Scanning electron microscope- Energy-dispersive X-ray spectroscopy (SEM-EDX) Analysis
2.3.5. TEM and High-resolution transmission electron microscopy (HR-TEM) Analysis
2.3.6. Particle Size Analysis
2.3.7. BET Surface Area
2.3.8. Thermal Stability
2.3.9. Optical Properties
2.4. Photocatalytic Degradation of Methylene Blue
2.4.1. Photocatalytic Studies Based on Catalyst Concentration
2.4.2. Photocatalytic Studies Based on Time
2.4.3. Photocatalytic Studies Based on pH
2.4.4. Photocatalytic Studies Based on Temperature
3. Results and Discussion
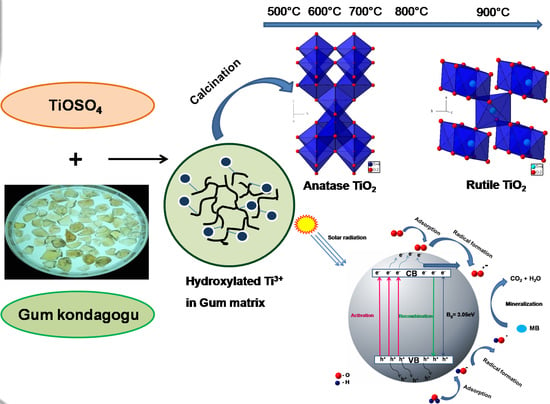
3.1. Mechanism of TiO2 NPs Formation Via Green Synthesis
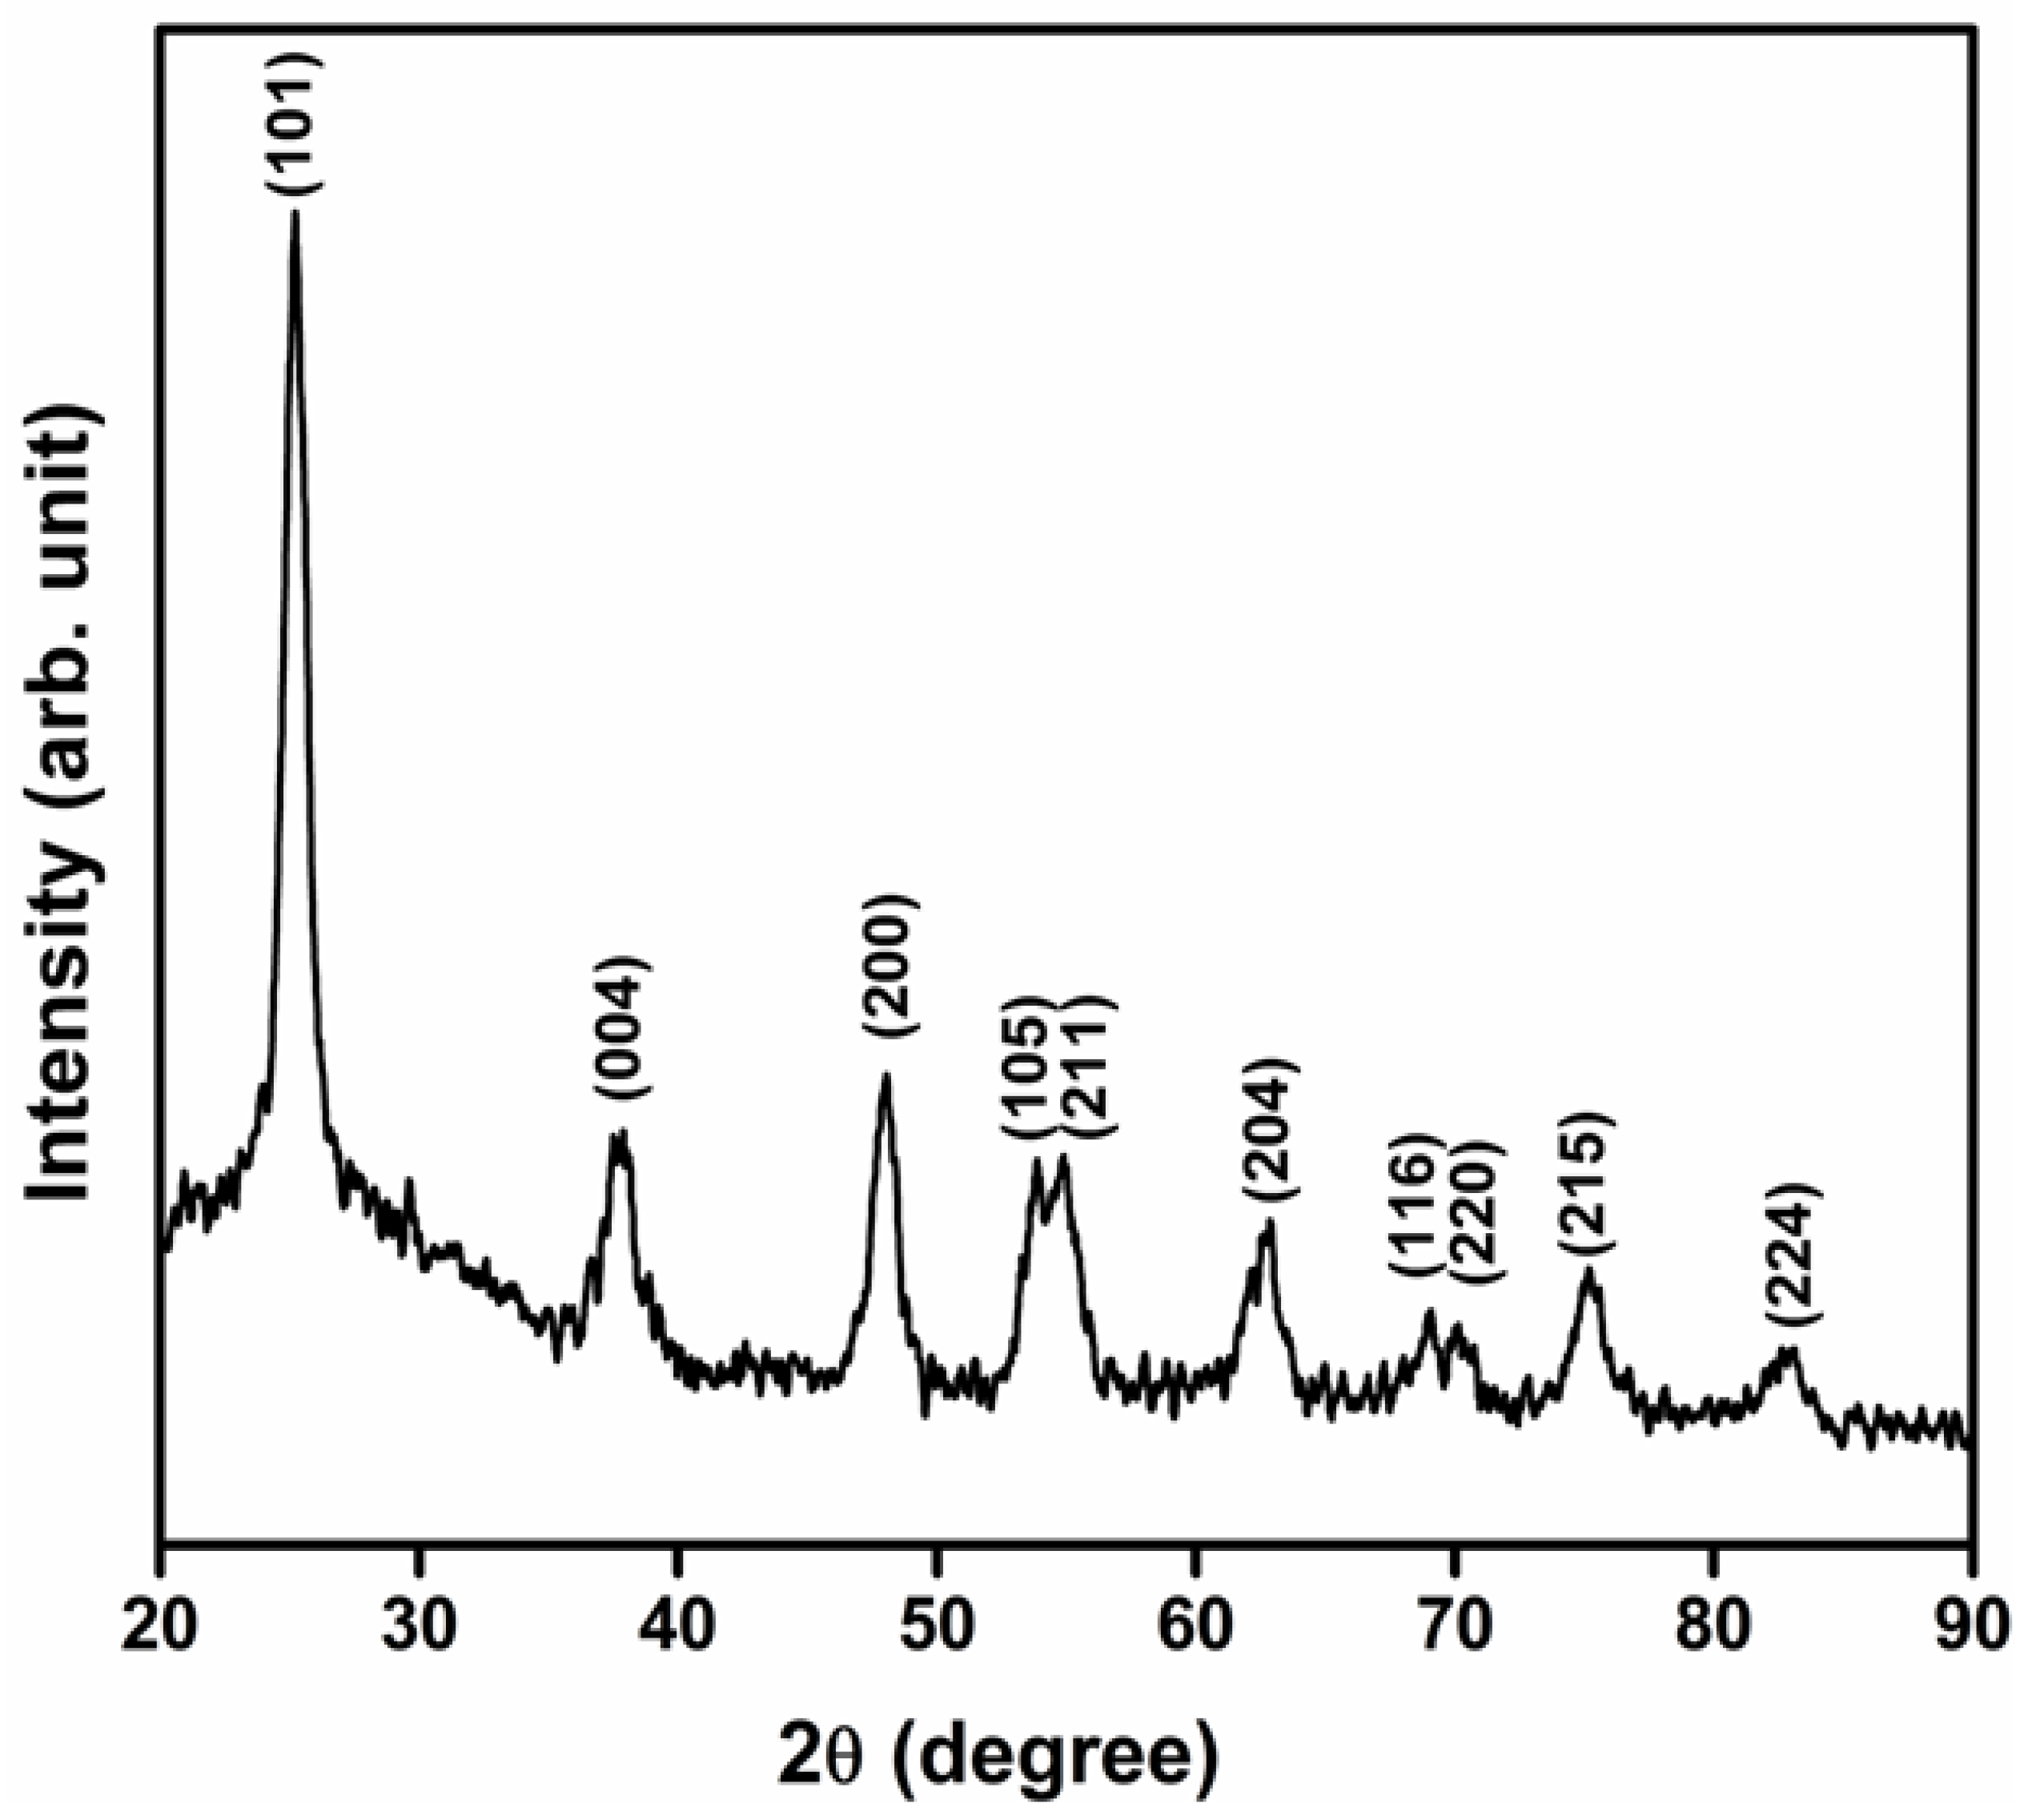
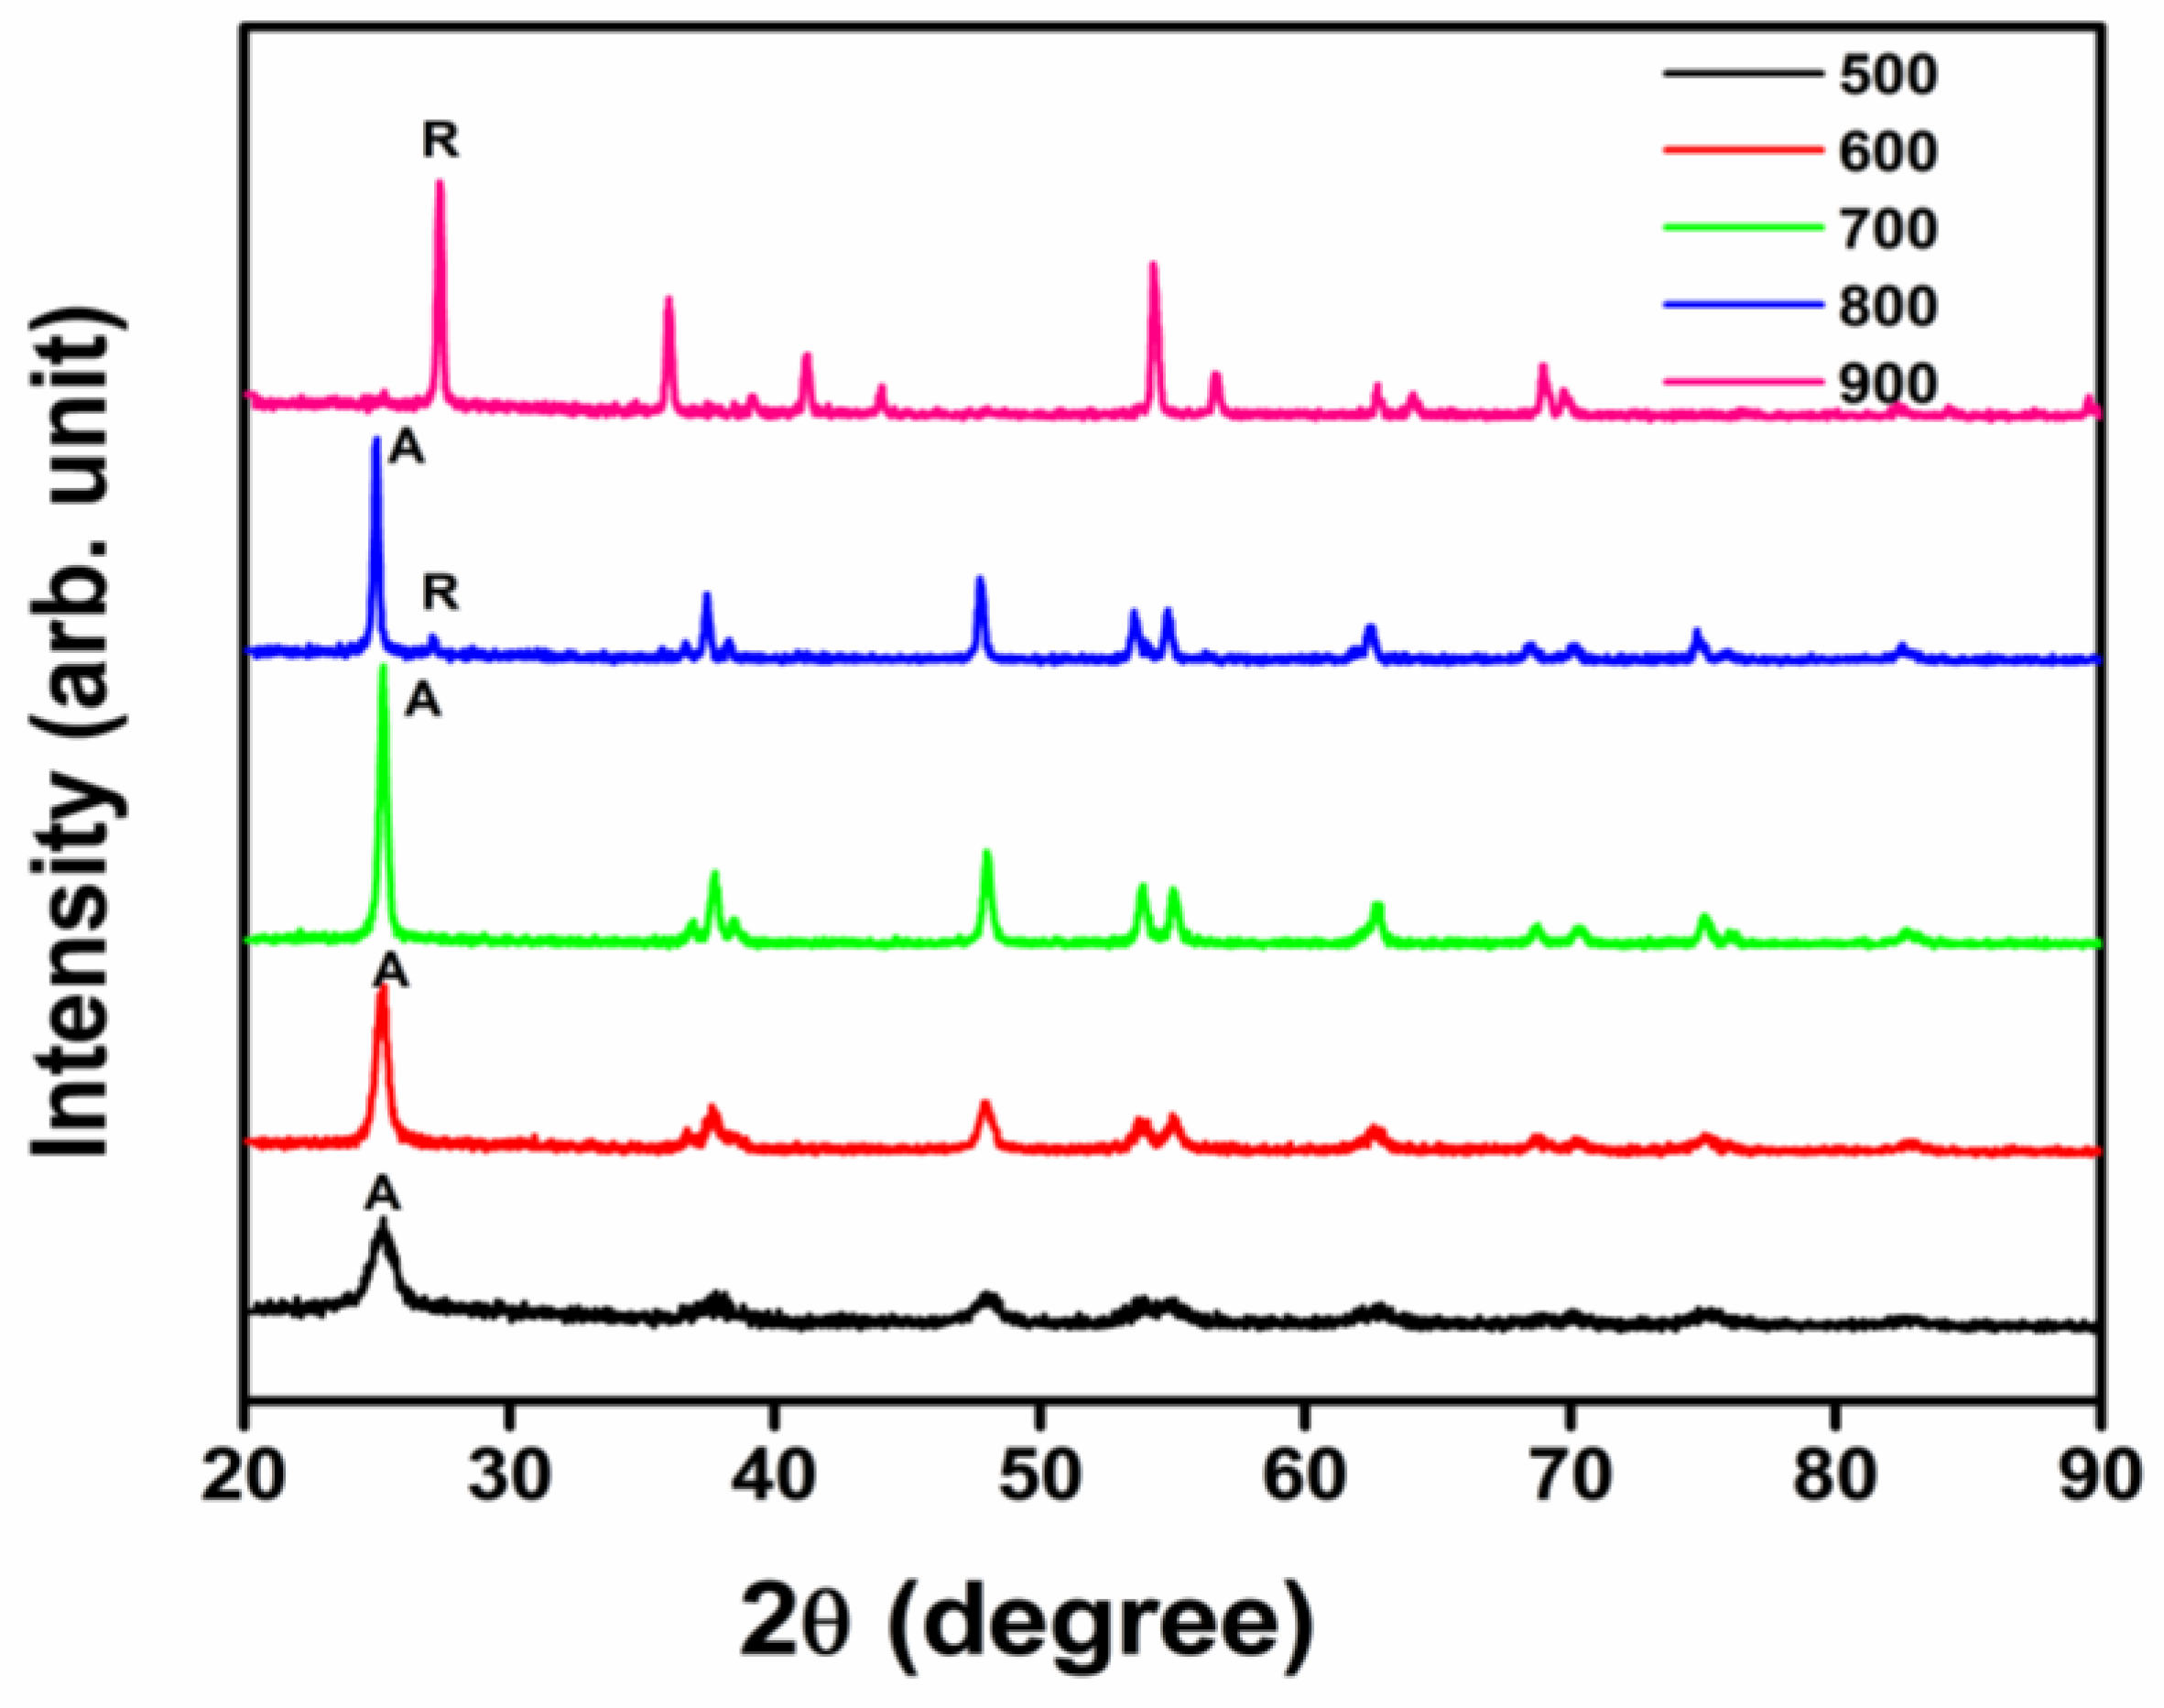
3.2. XRD Analysis
3.3. Fourier Transform Infrared Spectroscopy Analysis
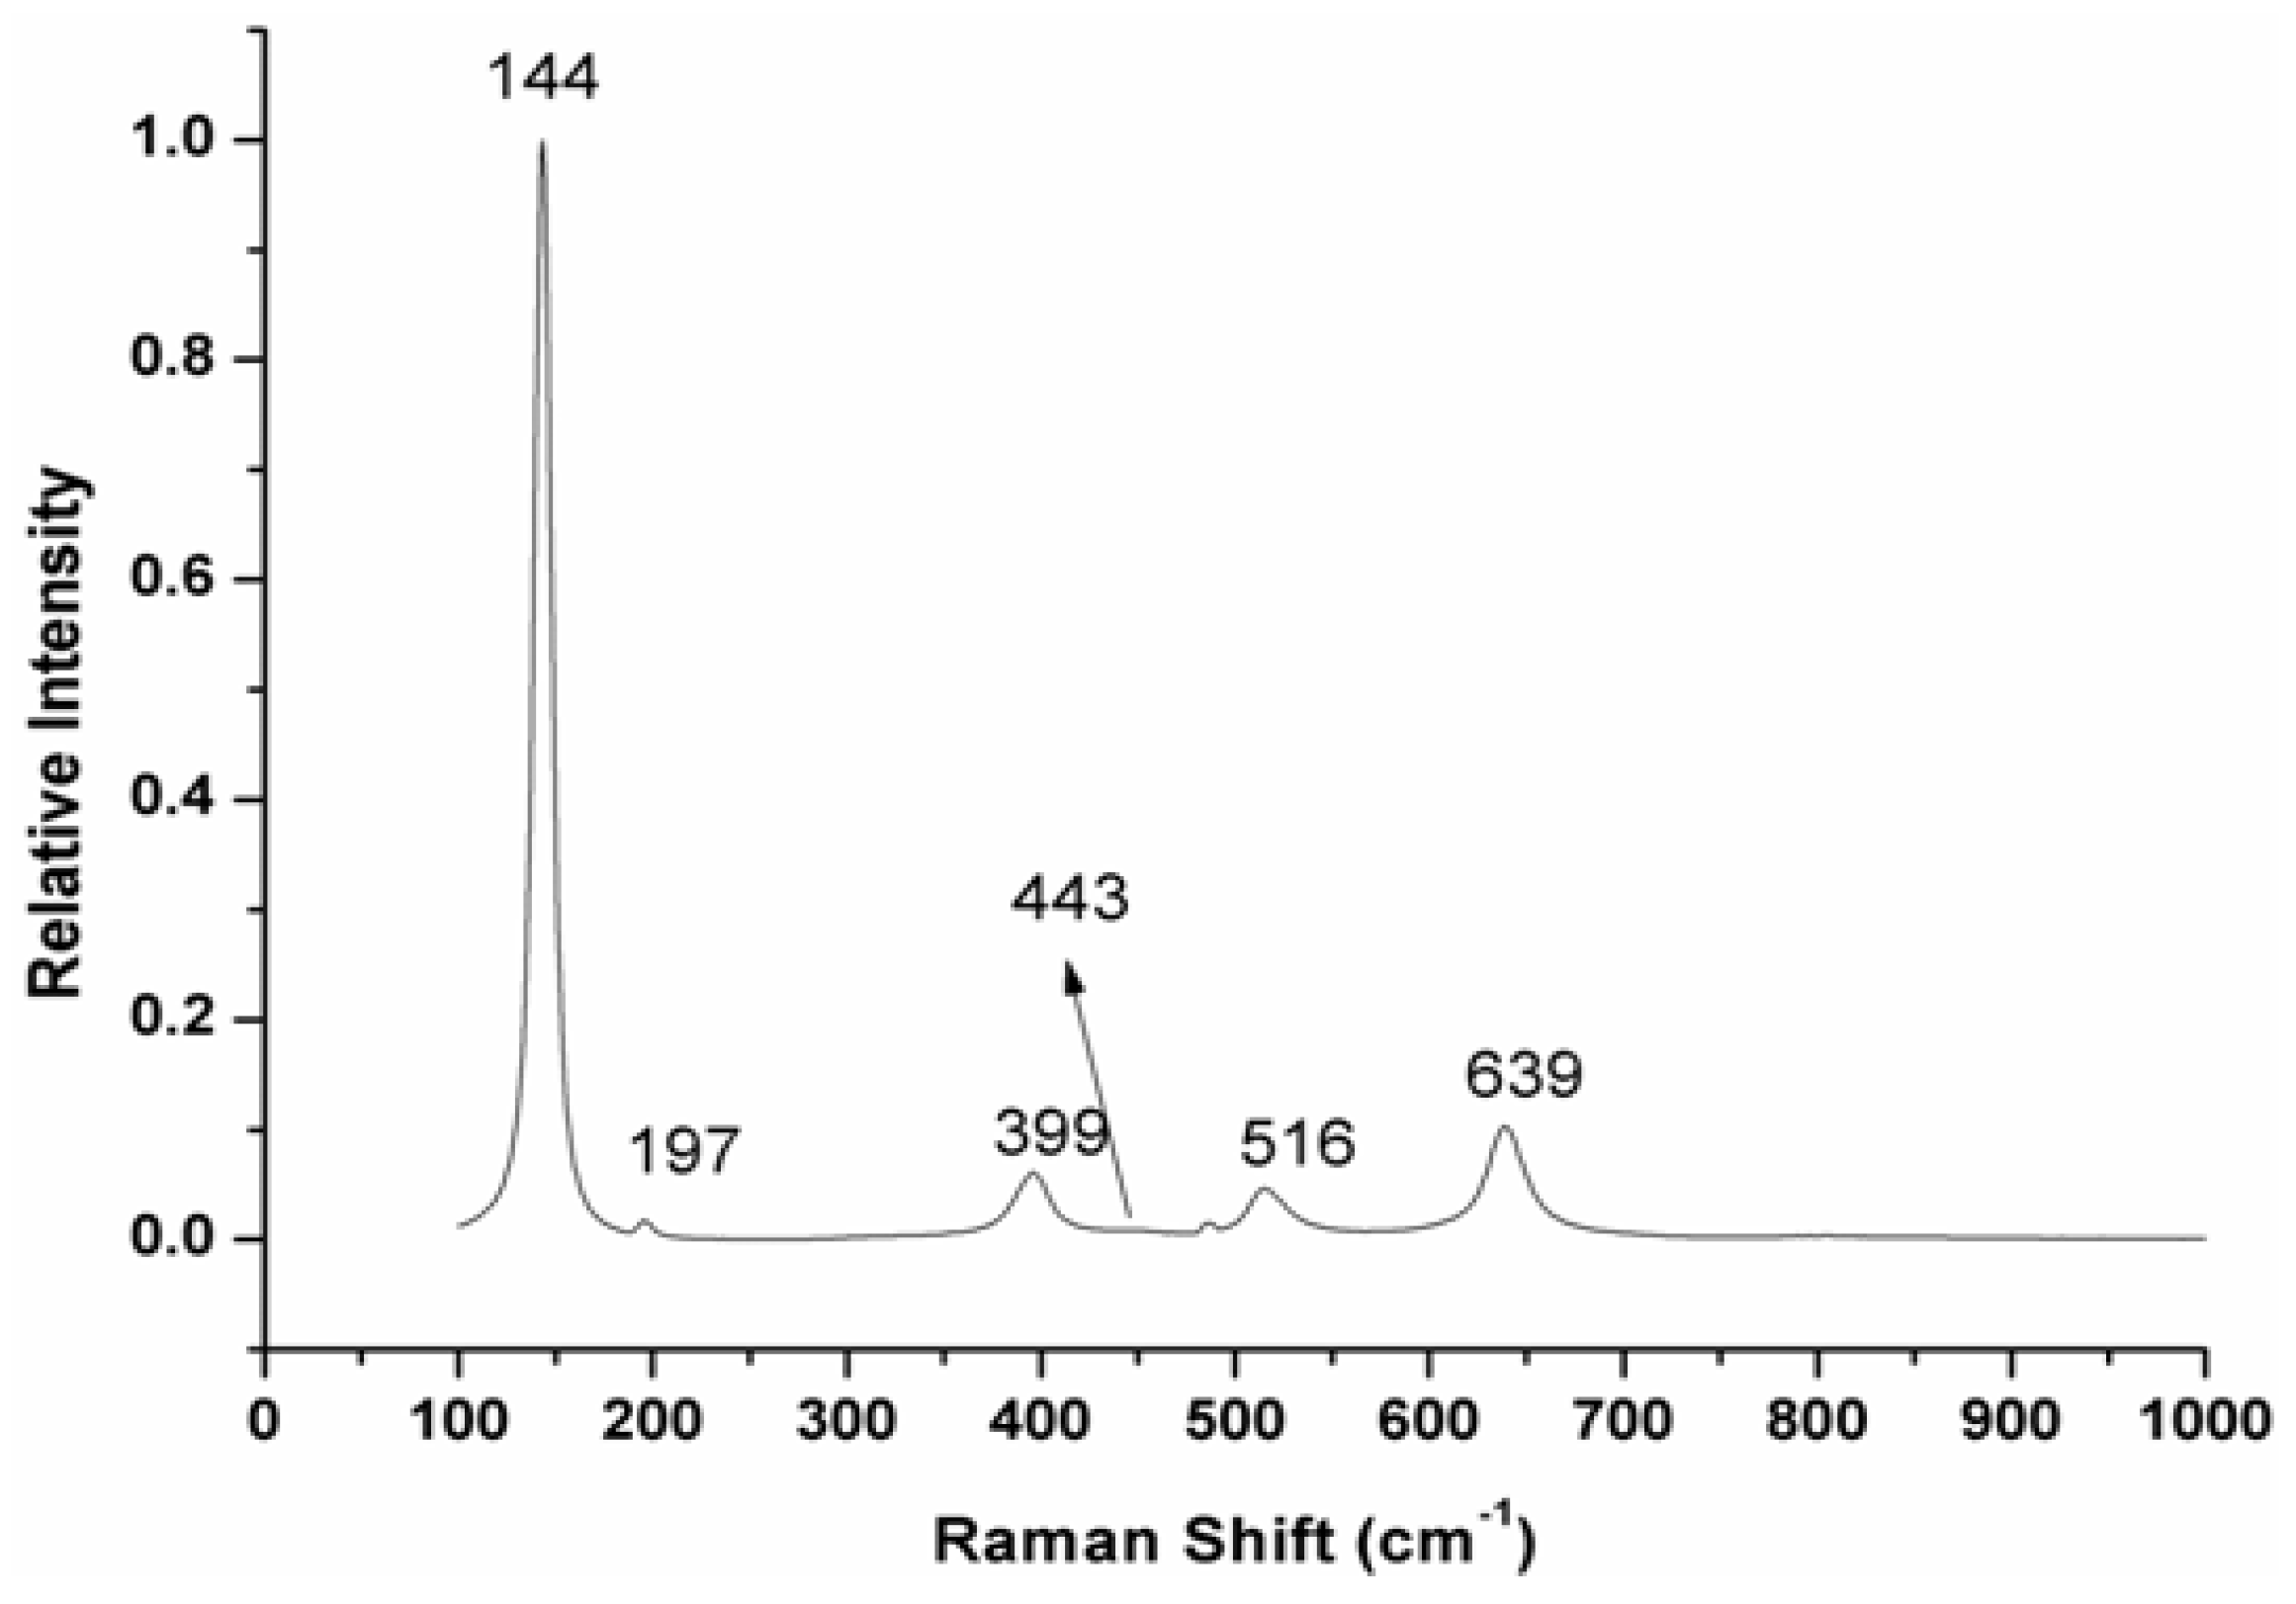
3.4. Raman Spectroscopy
3.5. Scanning Electron Microscopy (SEM)
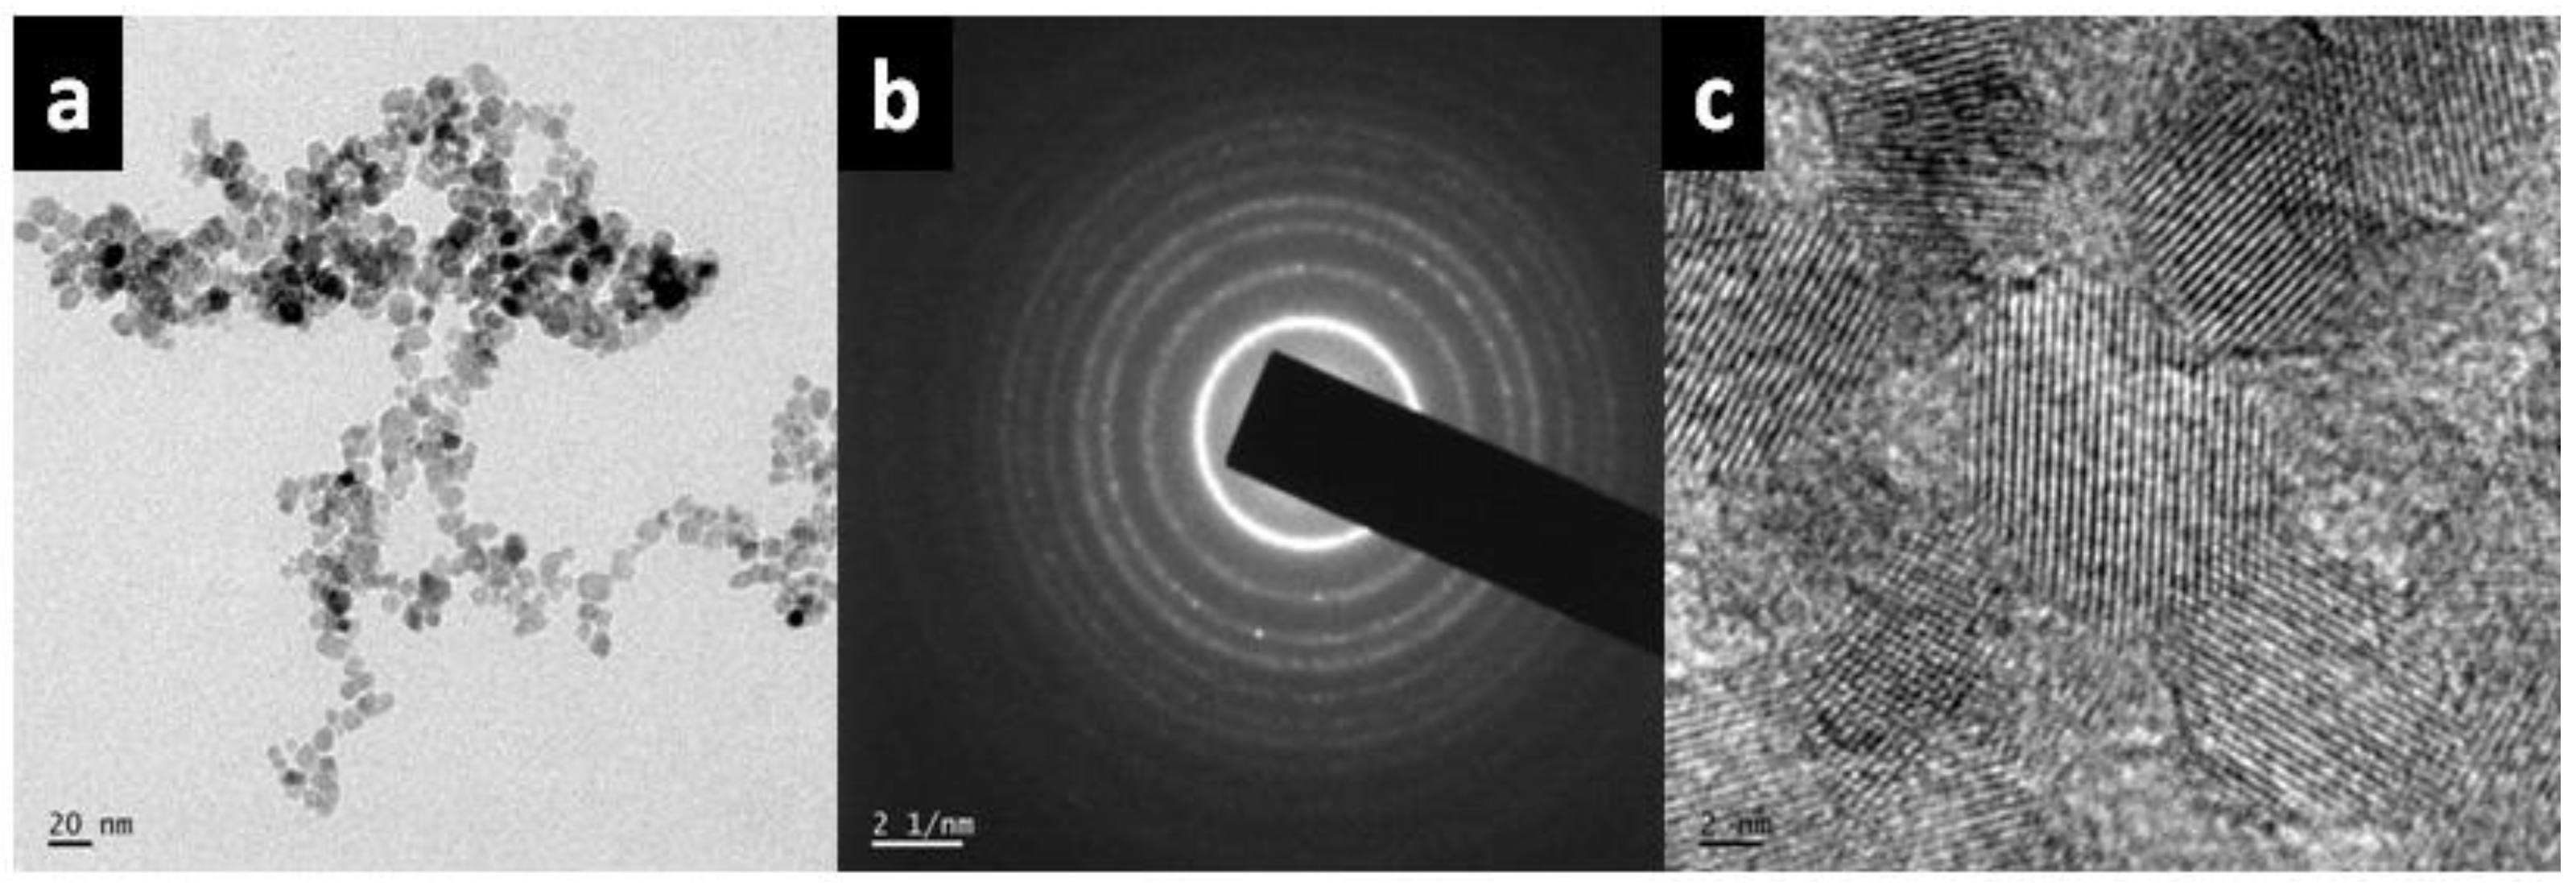
3.6. TEM and HR-TEM Analysis
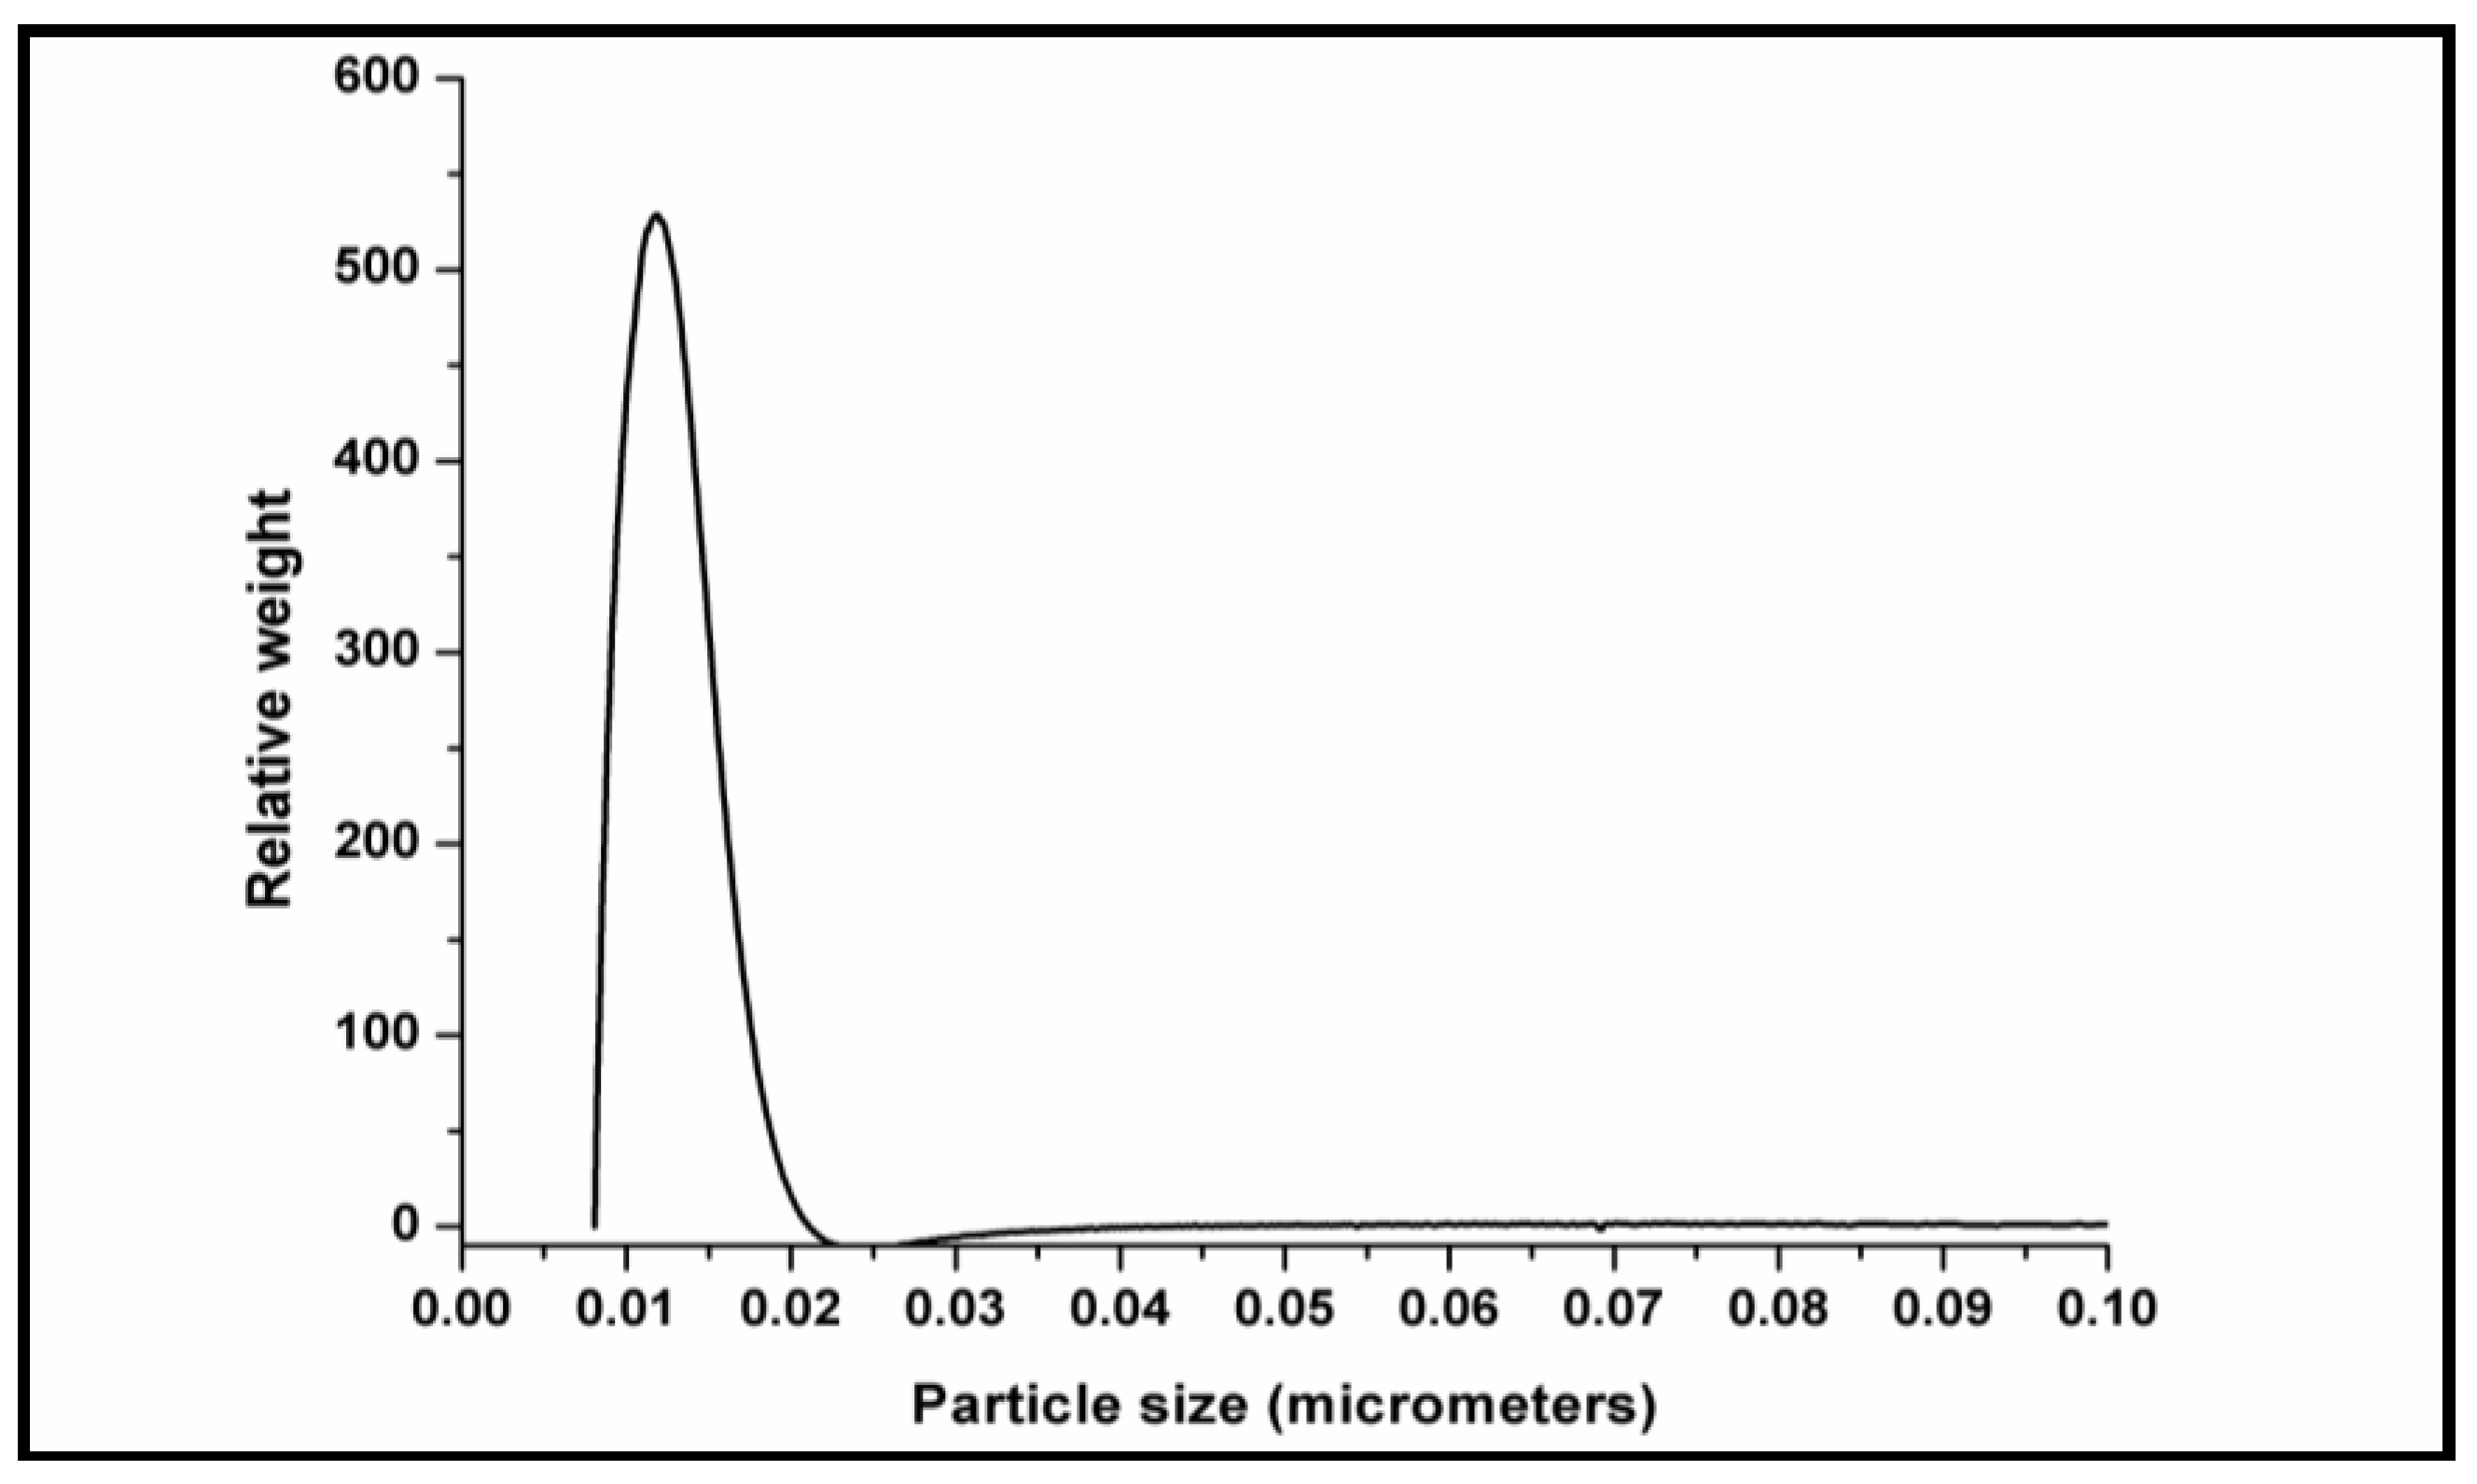
3.7. Particle Size & BET Analysis
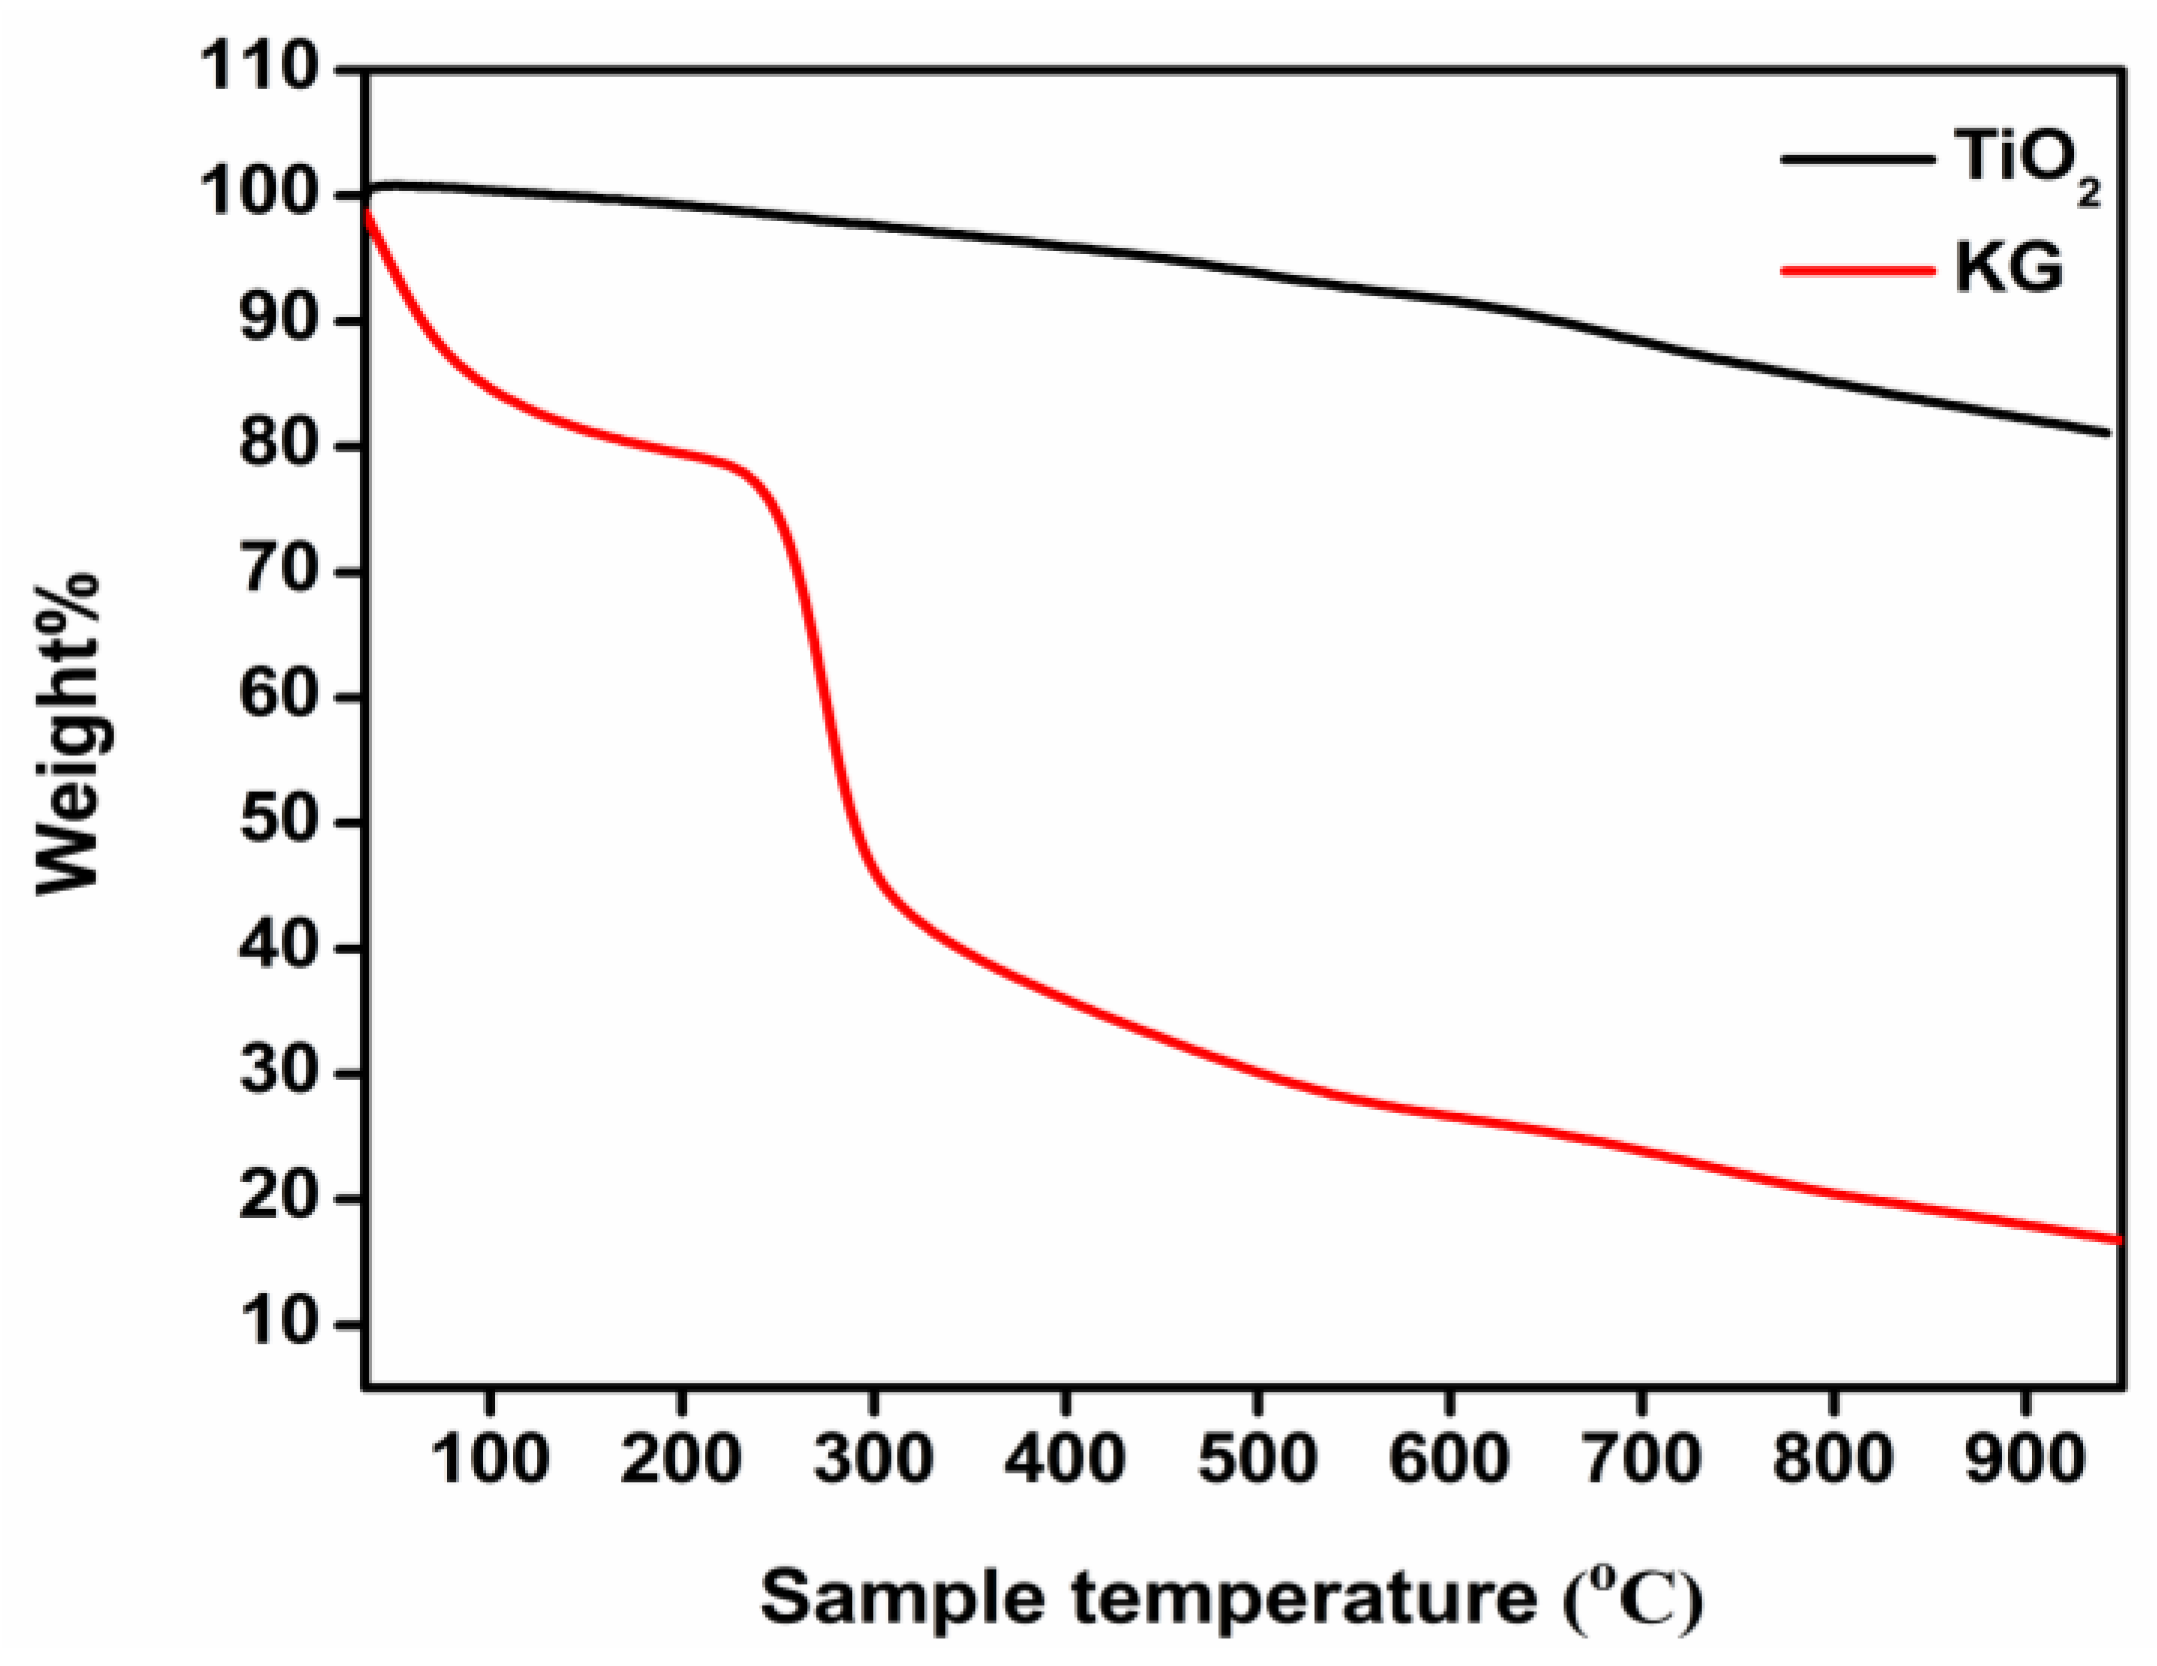
3.8. Thermal Studies
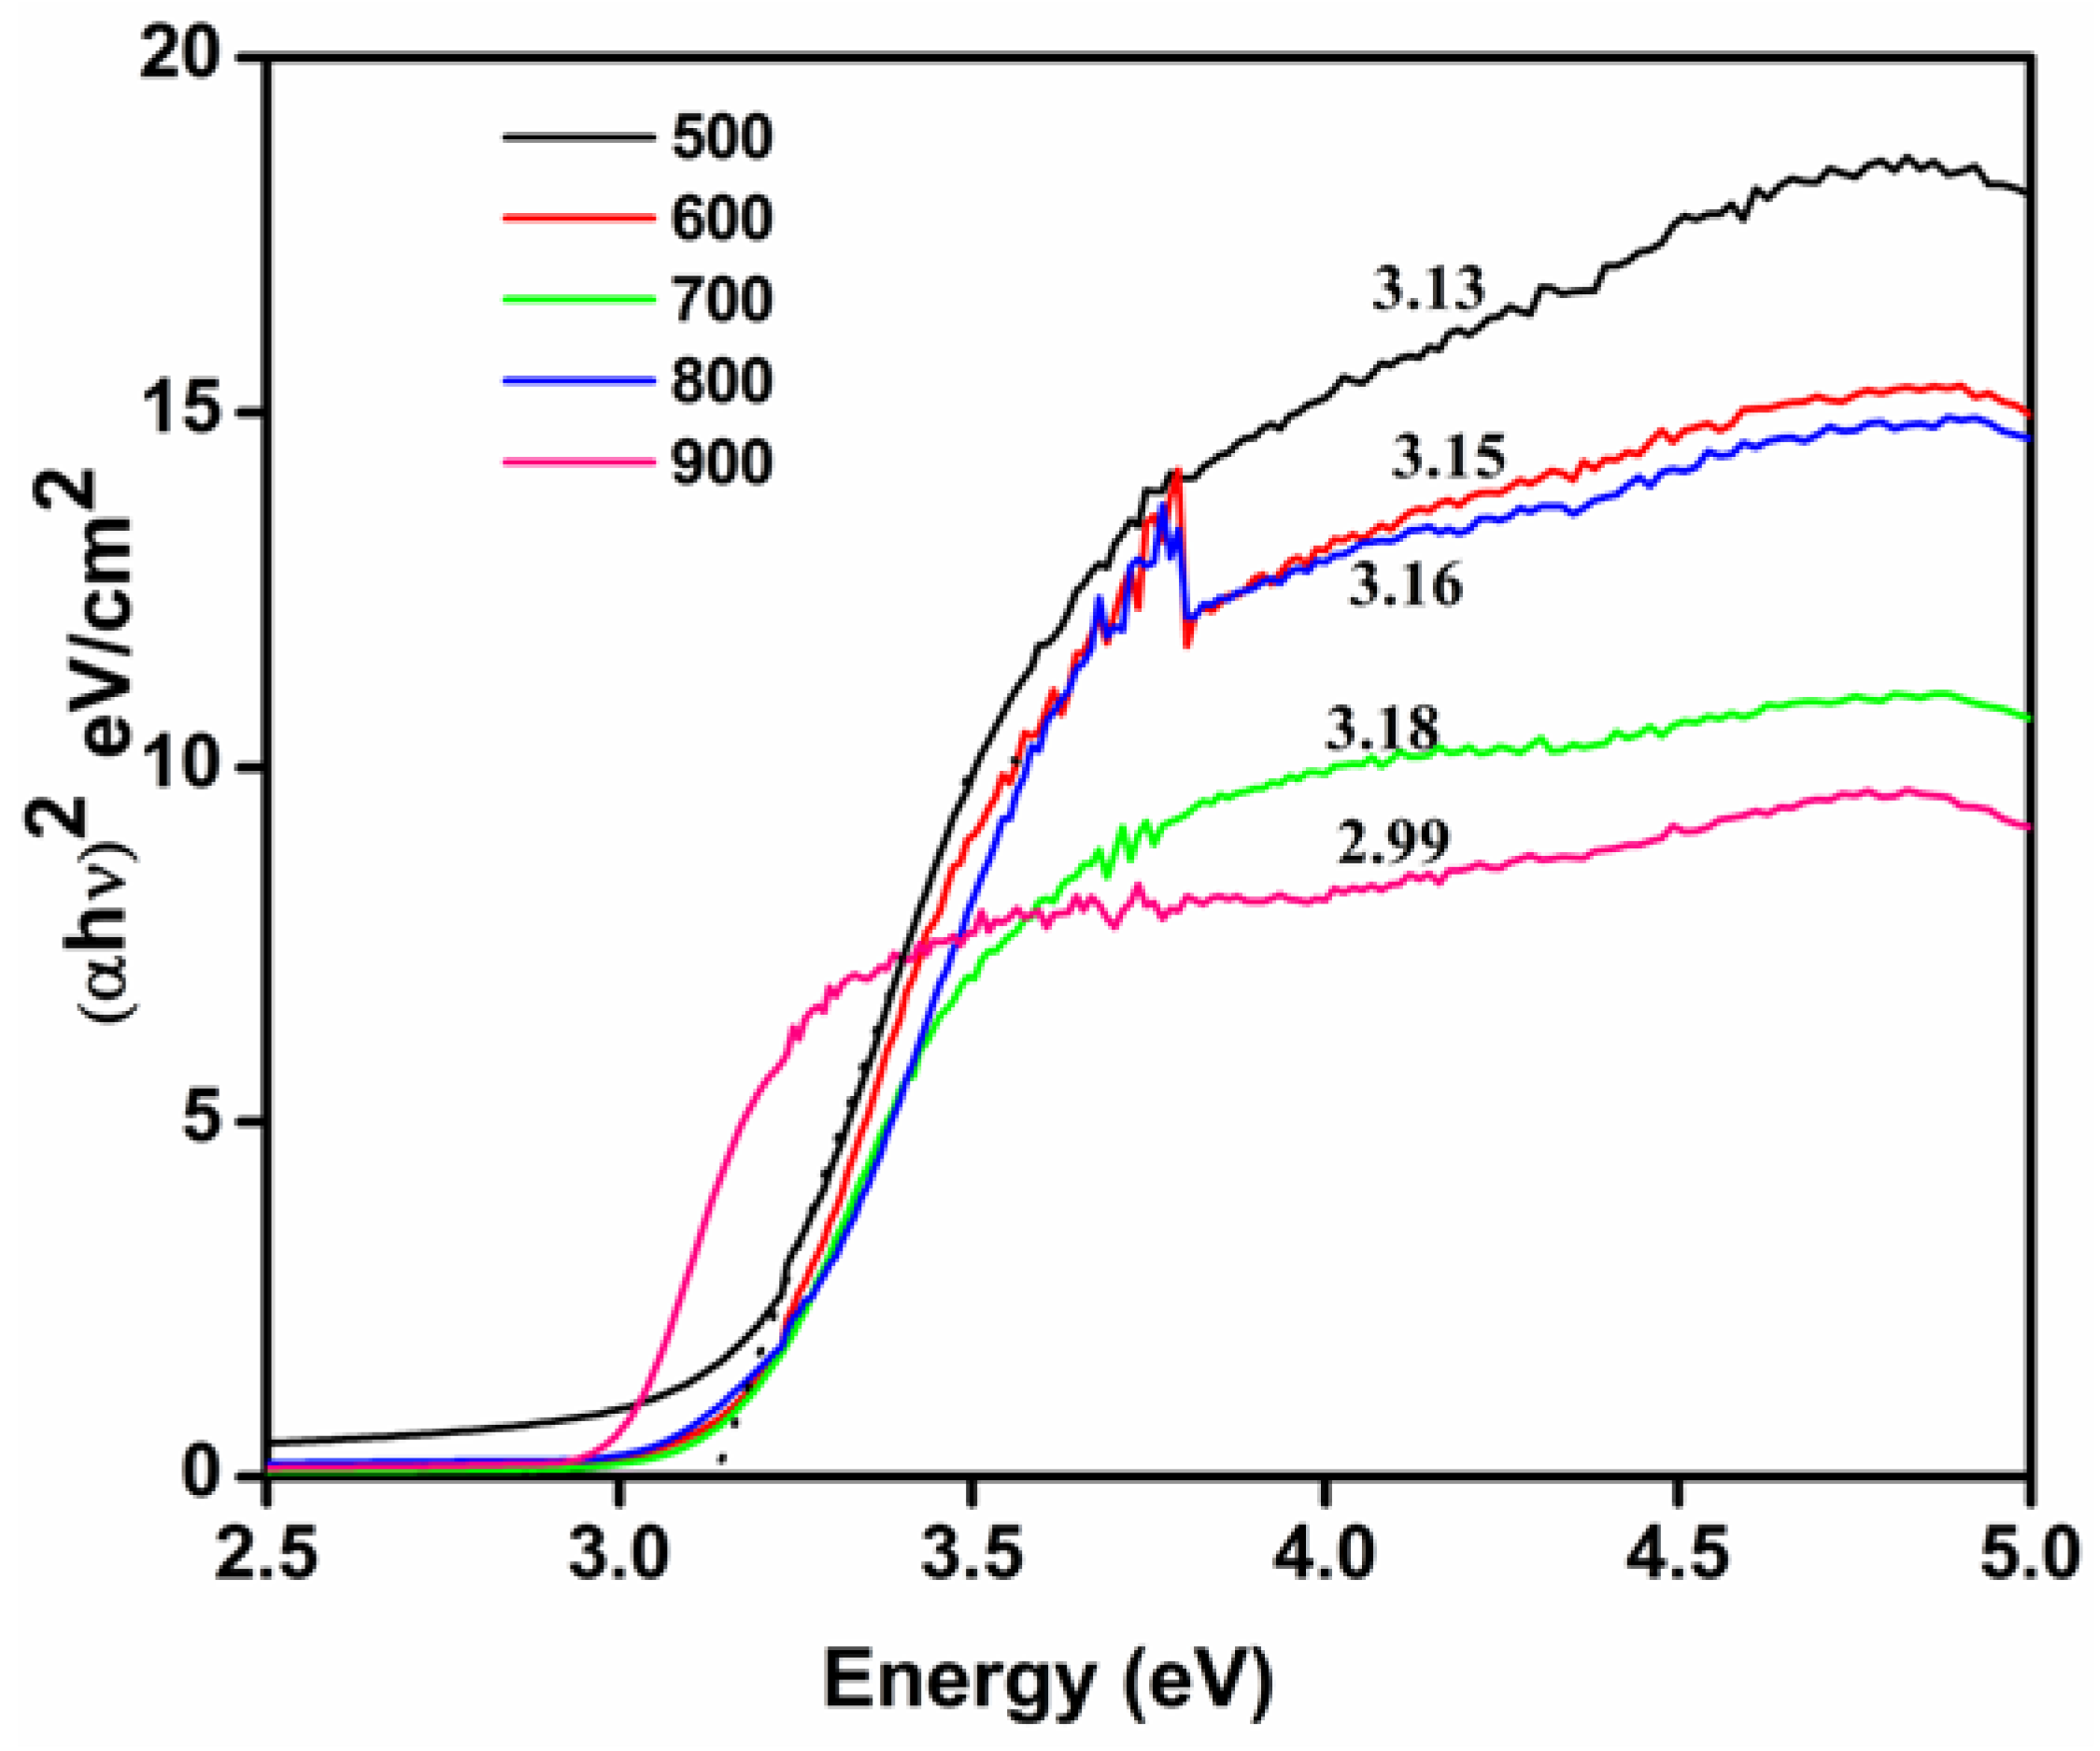
3.9. Optical Properties
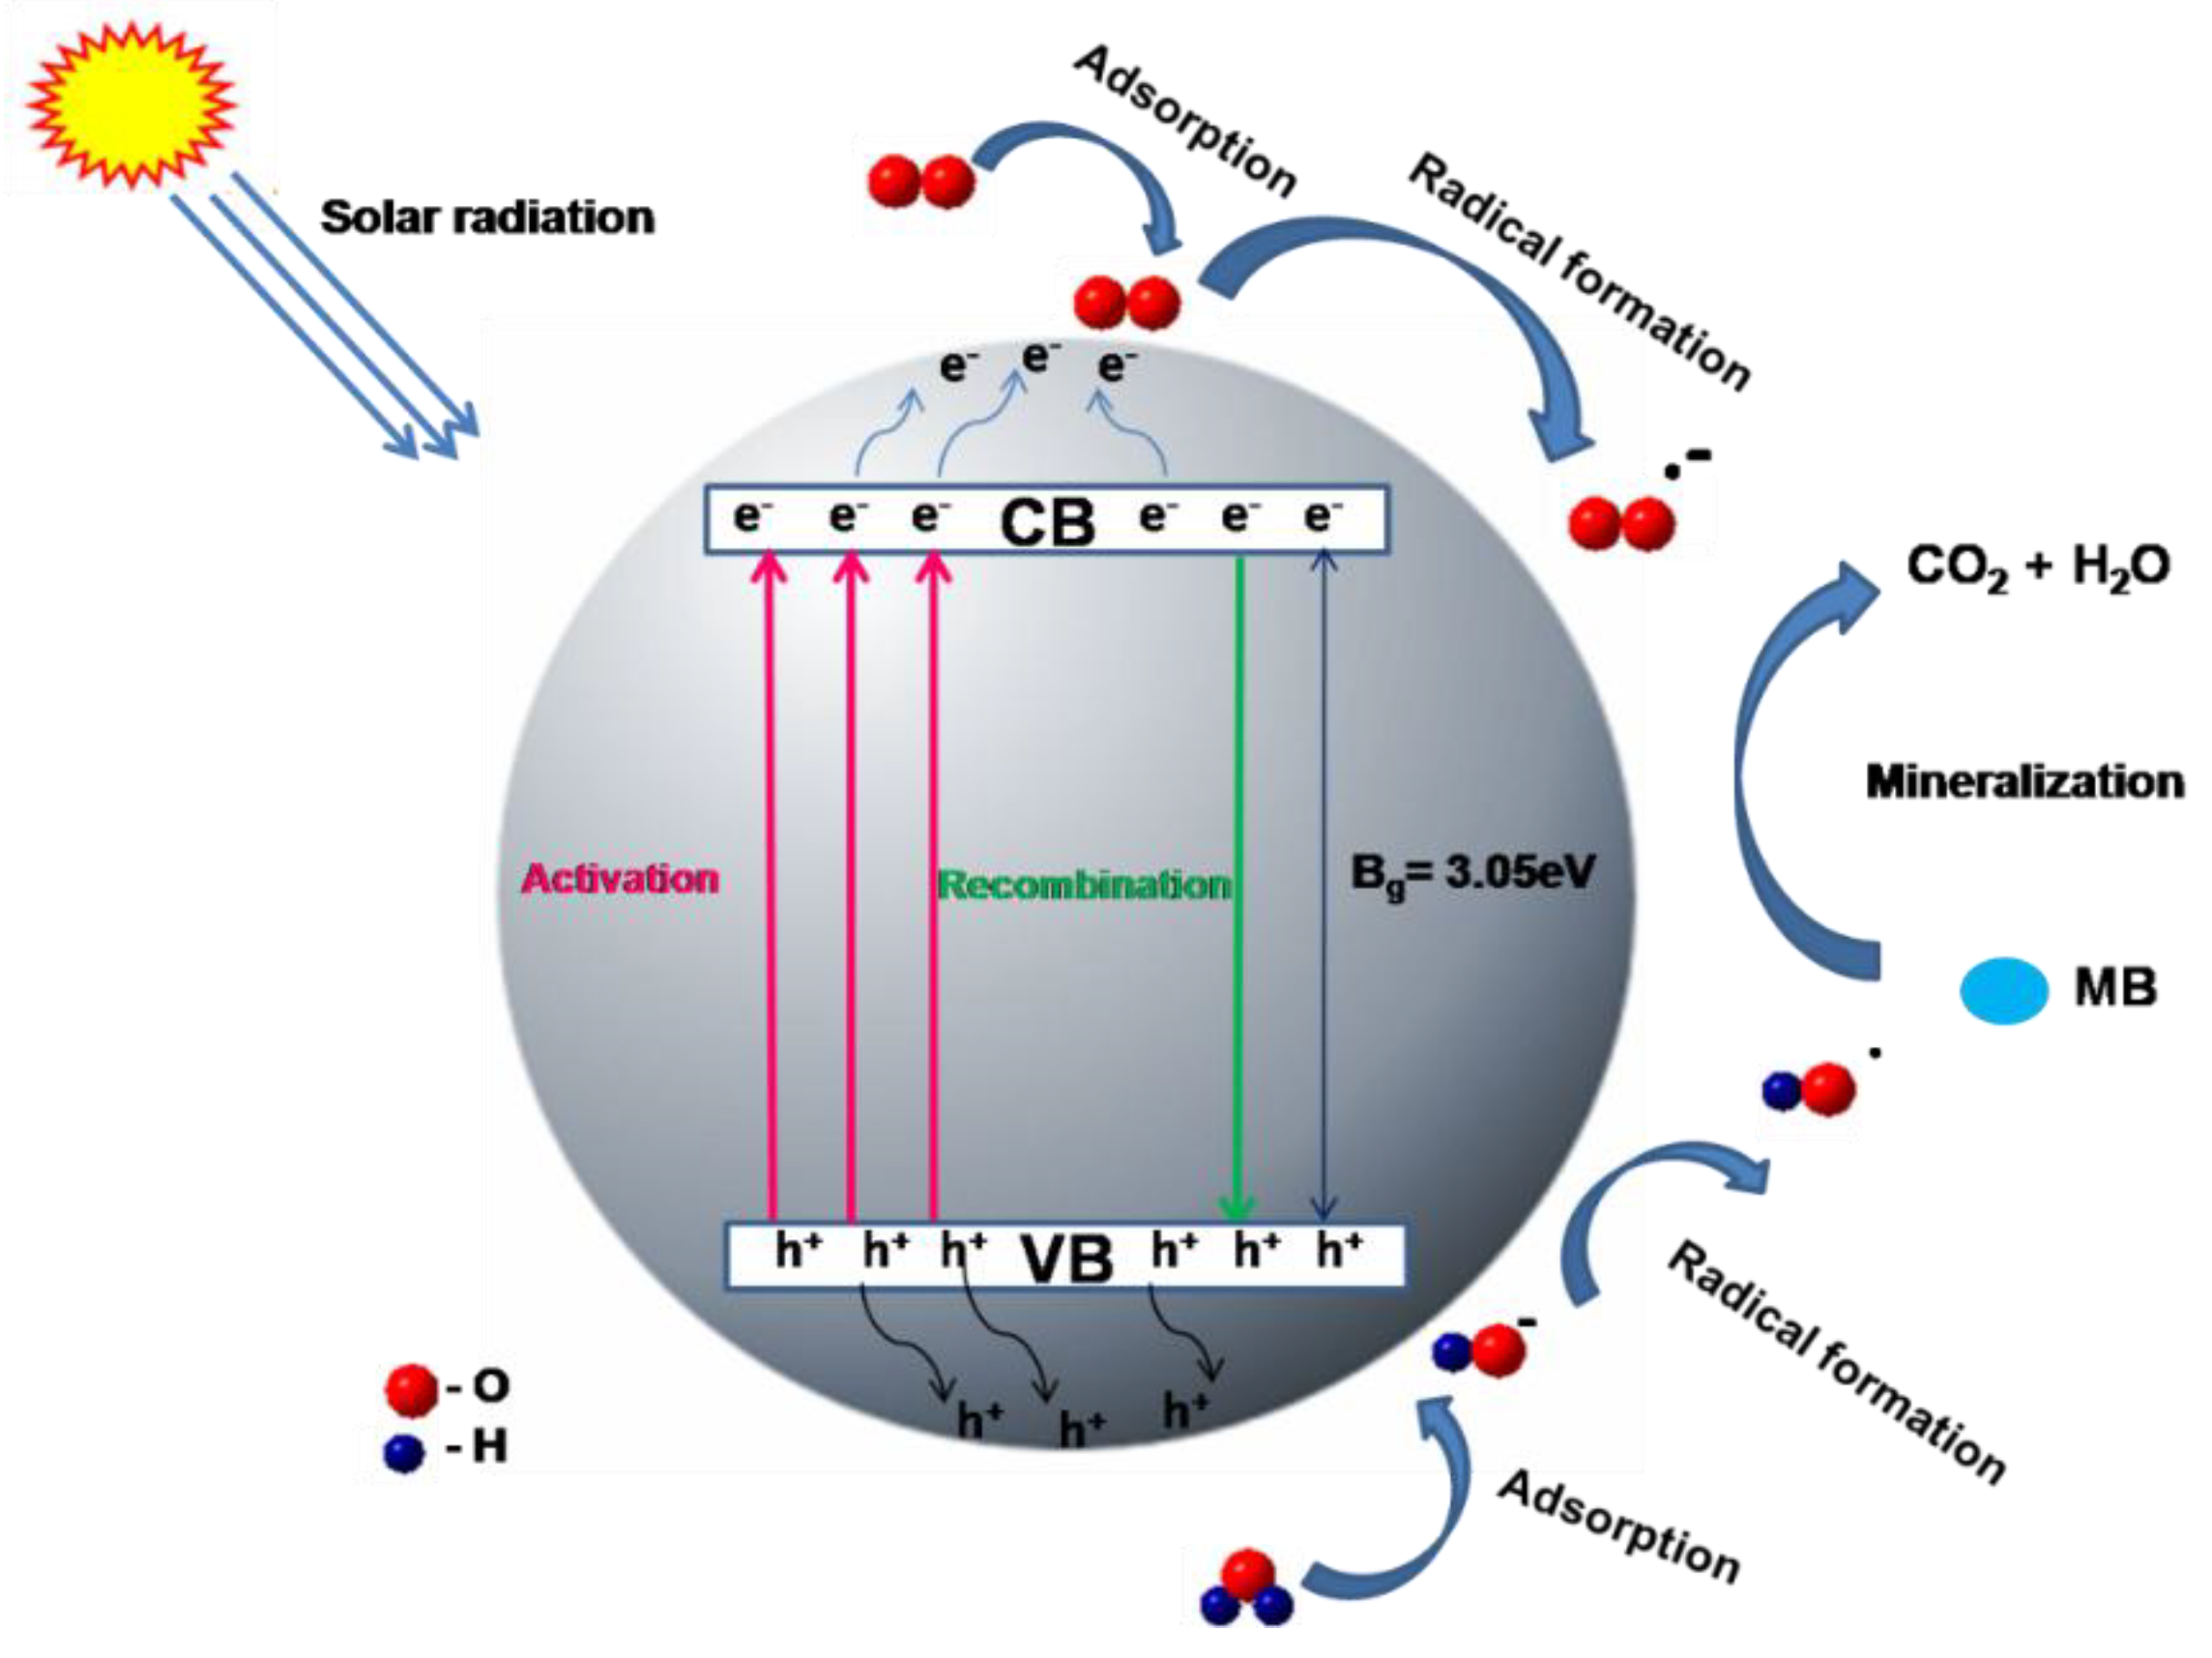
3.10. Photocatalytic Activity
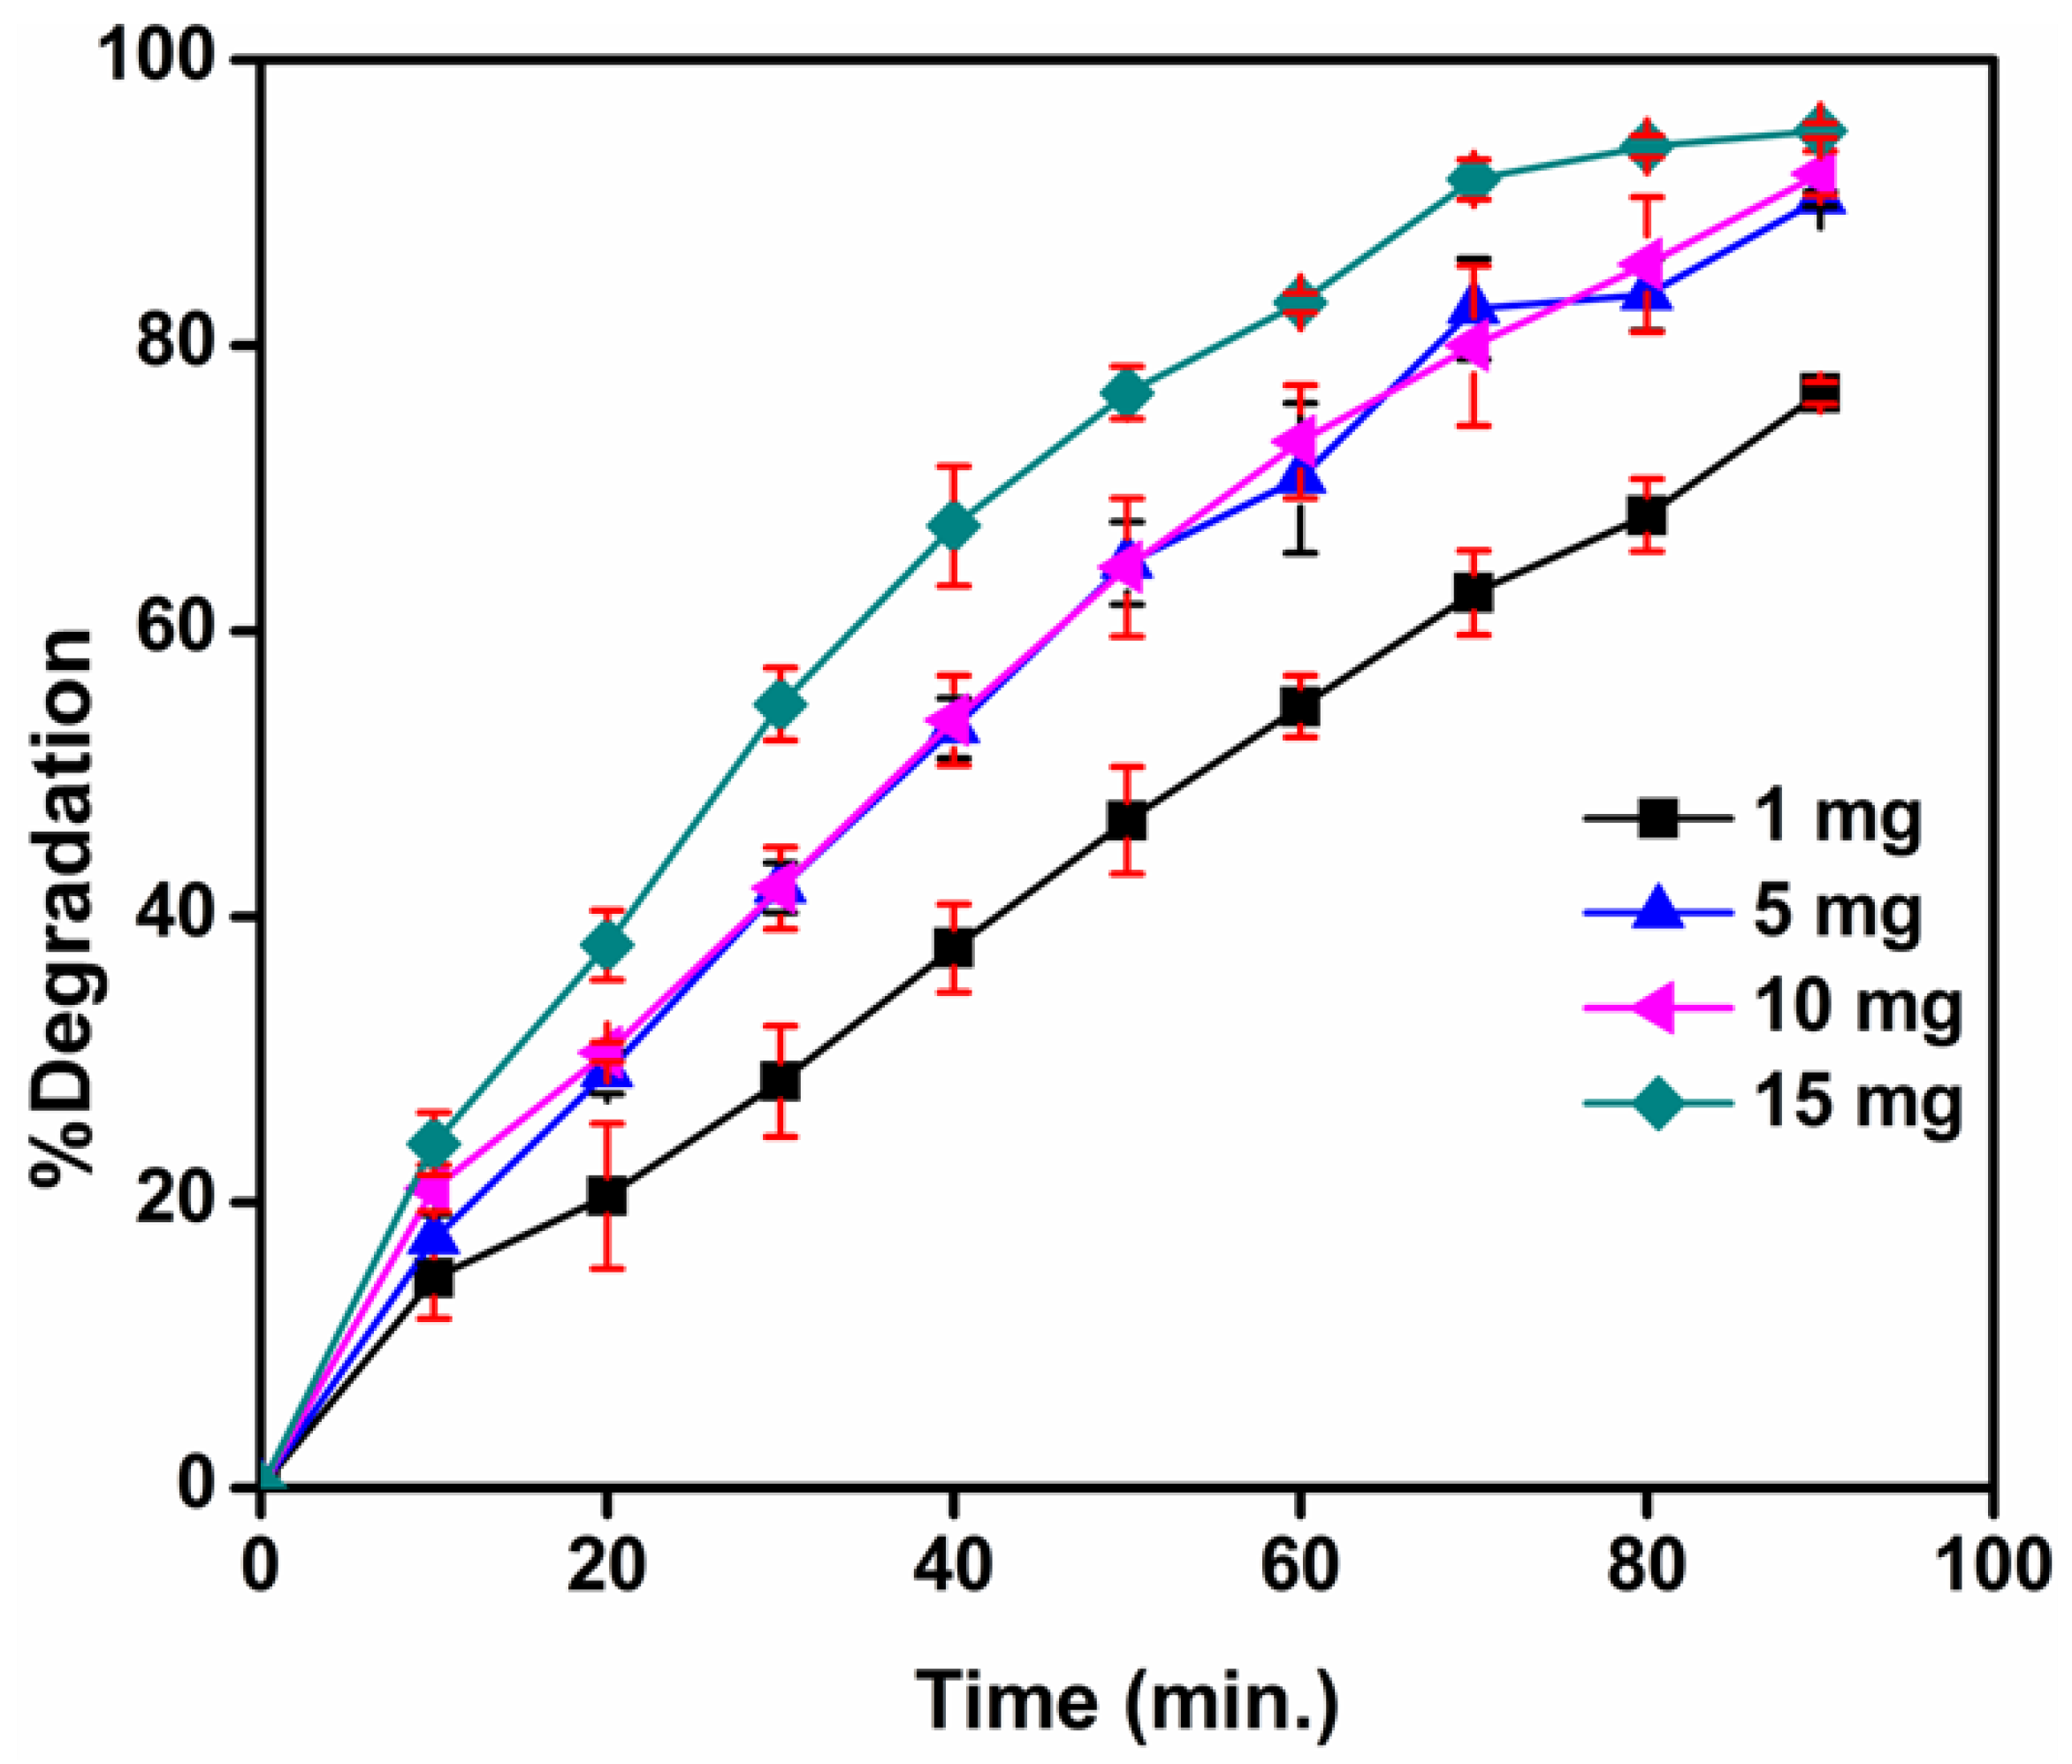
3.10.1. Effect of Catalyst Concentration on Photocatalytic Activity of TiO2 Nanoparticles
3.10.2. Effect of pH on Photocatalytic Activity of TiO2 Nanoparticles

3.10.3. Effect of Calcination Temperature on Photocatalytic Activity of TiO2 Nanoparticles
4. Conclusions
Supplementary Materials
Author Contributions
Funding
Acknowledgments
Conflicts of Interest
References
- Makarov, V.V.; Love, A.J.; Sinitsyna, O.V.; Makarova, S.S.; Yaminsky, I.V.; Taliansky, M.E.; Kalinina, N.O. “Green” Nanotechnologies: synthesis of metal nanoparticles using plants. Acta Naturae 2014, 6, 35–44. [Google Scholar] [PubMed]
- Jana, A.; Scheer, E.; Polarz, S. Synthesis of graphene–transition metal oxide hybrid nanoparticles and their application in various fields. Beilstein J. Nanotechnol. 2017, 8, 688–714. [Google Scholar] [CrossRef] [PubMed] [Green Version]
- Kim, C.S.; Moon, B.K.; Park, J.H.; Choi, B.C.; Seo, H.J. Solvothermal synthesis of nanocrystalline TiO2 in toluene with surfactant. J. Cryst. Growth 2003, 257, 309–315. [Google Scholar] [CrossRef]
- Gotić, M.; Musić, S. Synthesis of nanocrystalline Iron oxide particles in the Iron(iii) acetate/alcohol/acetic acid system. Eur. J. Inorg. Chem. 2008, 6, 966–973. [Google Scholar] [CrossRef]
- Hayashi, H.; Hakuta, Y. Hydrothermal synthesis of metal oxide nanoparticles in supercritical water. Materials 2010, 3, 3794–3817. [Google Scholar] [CrossRef] [PubMed]
- Sharma, D.; Kanchi, S.; Bisetty, K. Biogenic synthesis of nanoparticles: A review. Arab. J. Chem. 2015. [CrossRef]
- Lin, H.; Li, L.; Zhao, M.; Huang, X.; Chen, X.; Li, G.; Yu, R. Synthesis of high-quality brookite TiO2 single-crystalline nanosheets with specific facets exposed: tuning catalysts from inert to highly reactive. J. Am. Chem. Soc. 2012, 134, 8328–8331. [Google Scholar] [CrossRef] [PubMed]
- Diebold, U. The surface science of titanium dioxide. Surf. Sci. Rep. 2003, 48, 53–229. [Google Scholar] [CrossRef]
- Fernandez-Garcia, M.; Belver, C.; Hanson, J.C.; Wang, X.; Rodriguez, J.A. Anatase-TiO2 nanomaterials: analysis of key parameters controlling crystallization. J. Am. Chem. Soc. 2007, 129, 13604–13612. [Google Scholar] [CrossRef]
- Fernandez-Garcia, M.; Rodriguez, J.A. Metal Oxide Nanoparticles; Brookhaven National Laboratory: Upton, NY, USA, 2007.
- Bao, S.J.; Lei, C.; Xu, M.W.; Cai, C.J.; Cheng, C.J.; Li, C.M. Environmentally-friendly biomimicking synthesis of TiO2 nanomaterials using saccharides to tailor morphology, crystal phase and photocatalytic activity. CrystEngComm 2013, 15, 4694–4699. [Google Scholar] [CrossRef]
- Vinod, V.T.P.; Sashidhar, R.B.; Černík, M. Morphology and metal binding characteristics of a natural polymer-kondagogu (Cochlospermum gossypium) gum. Molecules 2013, 18, 8264–8274. [Google Scholar] [CrossRef] [PubMed]
- Vinod, V.T.P.; Wacławek, S.; Černík, M.; Varma, R.S. Tree gum-based renewable materials: Sustainable applications in nanotechnology, biomedical and environmental fields. Biotechnol. Adv. 2018, 36, 1984–2016. [Google Scholar]
- Vinod, V.T.P.; Sashidhar, R.B. Surface morphology, chemical and structural assignment of gum Kondagogu (Cochlospermum gossypium DC.): An exudate tree gum of India. Indian J. Nat. Prod. Resour. 2010, 1, 181–192. [Google Scholar]
- Vinod, V.T.P.; Sashidhar, R.B.; Sukumar, A.A. Competitive adsorption of toxic heavy metal contaminants by gum kondagogu (Cochlospermum gossypium): a natural hydrocolloid. Colloids Surf. B. 2010, 75, 490–495. [Google Scholar] [CrossRef] [PubMed]
- Vinod, V.T.P.; Saravanan, P.; Sreedhar, B.; Devi, D.K.; Sashidhar, R.B. A facile synthesis and characterization of Ag, Au and Pt nanoparticles using a natural hydrocolloid gum kondagogu (Cochlospermum gossypium). Colloids Surf. B. 2011, 83, 291–298. [Google Scholar] [CrossRef] [PubMed]
- Padil, V.V.T.; Cernik, M. Green synthesis of copper oxide nanoparticles using gum karaya as a biotemplate and their antibacterial application. Int. J. Nanomed. 2013, 8, 889–898. [Google Scholar] [CrossRef]
- Vinod, V.T.P.; Sashidhar, R.B.; Suresh, K.I.; Rao, B.R.; Vijaya Saradhi, U.V.R.; Rao, T.P. Morphological, physico-chemical and structural characterization of gum kondagogu (Cochlospermum gossypium): A tree gum from India. Food Hydrocoll. 2008, 22, 899–915. [Google Scholar] [CrossRef]
- Vinod, V.T.P.; Sashidhar, R.B.; Sarma, V.U.M.; Vijaya Saradhi, U.V.R. Compositional analysis and rheological properties of gum kondagogu (Cochlospermum gossypium): a tree gum from India. J. Agric. Food. Chem. 2008, 56, 2199–2207. [Google Scholar] [CrossRef]
- Naidu, V.G.M.; Madhusudhana, K.; Sashidhar, R.B.; Ramakrishna, S.; Khar, R.K.; Ahmed, F.J.; Diwan, P.V. Polyelectrolyte complexes of gum kondagogu and chitosan, as diclofenac carriers. Carbohydr. Polym. 2009, 76, 464–471. [Google Scholar] [CrossRef]
- Khade, G.V.; Suwarnkar, M.B.; Gavade, N.L.; Garadkar, K.M. Green synthesis of TiO2 and its photocatalytic activity. J. Mater. Sci. Mater. Electron. 2015, 26, 3309–3315. [Google Scholar] [CrossRef]
- Kant, R. Textile dyeing industry an environmental hazard. Nat. Sci. 2012, 4, 22–26. [Google Scholar] [CrossRef]
- Neyaz, N.; Siddiqui, W.A.; Nair, K.K. Application of surface functionalized Iron oxide nanomaterials as a nanosorbents in extraction of toxic heavy metals from ground water: a review. Int. J. Environ. Sci. 2014, 4, 472–483. [Google Scholar] [CrossRef]
- Byrne, C.; Fagan, R.; Hinder, S.; McCormack, D.E.; Pillai, S.C. New approach of modifying the anatase to rutile transition temperature in TiO2 photocatalysts. RSC Adv. 2016, 6, 95232–95238. [Google Scholar] [CrossRef]
- Carp, O.; Huisman, C.L.; Reller, A. Photoinduced reactivity of titanium dioxide. Prog. Solid State Chem. 2004, 32, 33–177. [Google Scholar] [CrossRef]
- Mahlambi, M.M.; Ngila, C.J.; Mamba, B.B. Recent developments in environmental photocatalytic degradation of organic pollutants: the case of titanium dioxide nanoparticles—A review. J Nanomater. 2015, 2015, 1–29. [Google Scholar] [CrossRef]
- Ahmed, M.A.; El-Katori, E.E.; Gharni, Z.H. Photocatalytic degradation of methylene blue dye using Fe2O3/TiO2 nanoparticles prepared by sol–gel method. J. Alloys Compd. 2013, 553, 19–29. [Google Scholar] [CrossRef]
- Boury, B.; Plumejeau, S. Metal oxides and polysaccharides: An efficient hybrid association for materials chemistry. Green Chem. 2015, 17, 72–88. [Google Scholar] [CrossRef]
- Dong, Y.; Wang, Y.; Cai, T.; Kou, L.; Yang, G.; Yan, Z. Preparation and nitrogen-doping of three-dimensionally ordered macroporous TiO2 with enhanced photocatalytic activity. Ceram. Int. 2014, 40, 11213–11219. [Google Scholar] [CrossRef]
- Filippo, E.; Carlucci, C.; Capodilupo, A.L.; Perulli, P.; Conciauro, F.; Corrente, G.A.; Gigli, G.; Ciccarella, G. Enhanced photocatalytic activity of pure anatase TiO2 and Pt-TiO2 nanoparticles synthesized by green microwave assisted route. Mater. Res. 2015, 18, 473–481. [Google Scholar] [CrossRef]
- Haque, F.Z.; Nandanwar, R.; Singh, P. Evaluating photodegradation properties of anatase and rutile TiO2 nanoparticles for organic compounds. Optik 2017, 128, 191–200. [Google Scholar] [CrossRef]
- Ba-Abbad, M.M.; Kadhum, A.A.H.; Mohamad, A.B.; Takriff, M.S.; Sopian, K. Synthesis and catalytic activity of TiO2 nanoparticles for photochemical oxidation of concentrated chlorophenols under direct solar radiation. Int. J. Electrochem. Sci. 2012, 7, 4871–4888. [Google Scholar]
- Periyat, P.; Pillai, S.C.; McCormack, D.E.; Colreavy, J.; Hinder, S.J. Improved high-temperature stability and sun-light-driven photocatalytic activity of sulfur-doped anatase TiO2. J. Phys. Chem. C 2008, 112, 7644–7652. [Google Scholar] [CrossRef] [Green Version]
- Reddy, G.B.; Madhusudhan, A.; Ramakrishna, D.; Ayodhya, D.; Venkatesham, M.; Veerabhadram, G. Green chemistry approach for the synthesis of gold nanoparticles with gum kondagogu: Characterization, catalytic and antibacterial activity. J. nanostructure chem. 2015, 5, 185–193. [Google Scholar] [CrossRef]
- Chellappa, M.; Anjaneyulu, U.; Manivasagam, G.; Vijayalakshmi, U. Preparation and evaluation of the cytotoxic nature of TiO2 nanoparticles by direct contact method. Int. J. Nanomed. 2015, 10, 31–41. [Google Scholar] [CrossRef]
- Ma, W.; Lu, Z.; Zhang, M. Investigation of structural transformations in nanophase titanium dioxide by Raman spectroscopy. Appl. Phys. A 1998, 66, 621–627. [Google Scholar] [CrossRef]
- Ohsaka, T. Temperature dependence of the raman spectrum in anatase TiO2. J. Phys. Soc. Jpn. 1980, 48, 1661–1668. [Google Scholar] [CrossRef]
- Li, Y.; Qin, Z.; Guo, H.; Yang, H.; Zhang, G.; Ji, S.; Zeng, T. Low-temperature synthesis of anatase TiO2 nanoparticles with tunable surface charges for enhancing photocatalytic activity. PloS one 2014, 9, 1–19. [Google Scholar] [CrossRef]
- Auvinen, S.; Alatalo, M.; Haario, H.; Jalava, J.P.; Lamminmäki, R.J. Size and shape dependence of the electronic and spectral properties in TiO2nanoparticles. J. Phys. Chem. C 2011, 115, 8484–8493. [Google Scholar] [CrossRef]
- Rauf, M.A.; Ashraf, S.S. Fundamental principles and application of heterogeneous photocatalytic degradation of dyes in solution. Chem. Eng. J. 2009, 151, 10–18. [Google Scholar] [CrossRef]
- Wang, C.C.; Lee, C.K.; Lyu, M.D.; Juang, L.C. Photocatalytic degradation of C.I. Basic Violet 10 using TiO2 catalysts supported by Y zeolite: An investigation of the effects of operational parameters. Dyes. Pigm. 2008, 76, 817–824. [Google Scholar] [CrossRef]
- Lakshmi, S.; Renganathan, R.; Fujita, S. Study on TiO2-mediated photocatalytic degradation of methylene blue. J. Photochem. Photobiol. A 1995, 88, 163–167. [Google Scholar] [CrossRef]


| Calcination Temperatures of TiO2 (°C) | Band Gap (eV) |
|---|---|
| 500 | 3.13 |
| 600 | 3.15 |
| 700 | 3.16 |
| 800 | 3.18 |
| 900 | 3 |
© 2018 by the authors. Licensee MDPI, Basel, Switzerland. This article is an open access article distributed under the terms and conditions of the Creative Commons Attribution (CC BY) license (http://creativecommons.org/licenses/by/4.0/).
Share and Cite
Saranya, K.S.; Vellora Thekkae Padil, V.; Senan, C.; Pilankatta, R.; Saranya, K.; George, B.; Wacławek, S.; Černík, M. Green Synthesis of High Temperature Stable Anatase Titanium Dioxide Nanoparticles Using Gum Kondagogu: Characterization and Solar Driven Photocatalytic Degradation of Organic Dye. Nanomaterials 2018, 8, 1002. https://doi.org/10.3390/nano8121002
Saranya KS, Vellora Thekkae Padil V, Senan C, Pilankatta R, Saranya K, George B, Wacławek S, Černík M. Green Synthesis of High Temperature Stable Anatase Titanium Dioxide Nanoparticles Using Gum Kondagogu: Characterization and Solar Driven Photocatalytic Degradation of Organic Dye. Nanomaterials. 2018; 8(12):1002. https://doi.org/10.3390/nano8121002
Chicago/Turabian StyleSaranya, Kothaplamoottil Sivan, Vinod Vellora Thekkae Padil, Chandra Senan, Rajendra Pilankatta, Kunjumon Saranya, Bini George, Stanisław Wacławek, and Miroslav Černík. 2018. "Green Synthesis of High Temperature Stable Anatase Titanium Dioxide Nanoparticles Using Gum Kondagogu: Characterization and Solar Driven Photocatalytic Degradation of Organic Dye" Nanomaterials 8, no. 12: 1002. https://doi.org/10.3390/nano8121002