Cyano-Bridged Cu-Ni Coordination Polymer Nanoflakes and Their Thermal Conversion to Mixed Cu-Ni Oxides

 ,
, 
Abstract
:
1. Introduction
2. Materials and Methods
3. Results
4. Conclusions
Supplementary Materials
Author Contributions
Funding
Conflicts of Interest
References
- Kaneti, Y.V.; Dutta, S.; Hossain, M.S.A.; Shiddiky, M.J.A.; Tung, K.L.; Shieh, F.K.; Tsung, C.K.; Wu, K.C.W.; Yamauchi, Y. Strategies for Improving the Functionality of Zeolitic Imidazolate Frameworks: Tailoring Nanoarchitectures for Functional Applications. Adv. Mater. 2017, 29, 1700213. [Google Scholar] [CrossRef] [PubMed]
- Kaneti, Y.V.; Tang, J.; Salunkhe, R.R.; Jiang, X.; Yu, A.; Wu, K.C.W.; Yamauchi, Y. Nanoarchitectured Design of Porous Materials and Nanocomposites from Metal-Organic Frameworks. Adv. Mater. 2017, 29, 1604898. [Google Scholar] [CrossRef] [PubMed]
- Qu, F.; Shi, A.; Yang, M.; Jiang, J.; Shen, G.; Yu, R. Preparation and characterization of Prussian blue nanowire array and bioapplication for glucose biosensing. Anal. Chim. Acta 2007, 605, 28–33. [Google Scholar] [CrossRef] [PubMed]
- Zakaria, M.B.; Hu, M.; Pramanik, M.; Li, C.; Tang, J.; Aldalbahi, A.; Alshehri, S.M.; Malgras, V.; Yamauchi, Y. Synthesis of Nanoporous Ni-Co Mixed Oxides by Thermal Decomposition of Metal-Cyanide Coordination Polymers. Chem. Asian J. 2015, 10, 1541–1545. [Google Scholar] [CrossRef] [PubMed]
- Zakaria, M.B.; Hu, M.; Imura, M.; Salunkhe, R.R.; Umezawa, N.; Hamoudi, H.; Belik, A.A.; Yamauchi, Y. Single-crystal-like nanoporous spinel oxides: A strategy for synthesis of nanoporous metal oxides utilizing metal-cyanide hybrid coordination polymers. Chem. Eur. J. 2014, 20, 17375–17384. [Google Scholar] [CrossRef] [PubMed]
- Alowasheeir, A.; Tominaka, S.; Ide, Y.; Yamauchi, Y.; Matsushita, Y. Two-dimensional cyano-bridged coordination polymer of Mn(H2O)2 [Ni(CN)4]: Structural analysis and proton conductivity measurements upon dehydration and rehydration. CrystEngComm 2018, 20, 6713–6720. [Google Scholar] [CrossRef]
- Ding, Y.; Chen, Y.P.; Zhang, X.; Chen, L.; Dong, Z.; Jiang, H.L.; Xu, H.; Zhou, H.C. Controlled Intercalation and Chemical Exfoliation of Layered Metal-Organic Frameworks Using a Chemically Labile Intercalating Agent. J. Am. Chem. Soc. 2017, 139, 9136–9139. [Google Scholar] [CrossRef] [PubMed]
- Tan, J.C.; Saines, P.J.; Bithell, E.G.; Cheetham, A.K. Hybrid nanosheets of an inorganic-organic framework material: Facile synthesis, structure, and elastic properties. ACS Nano 2012, 6, 615–621. [Google Scholar] [CrossRef] [PubMed]
- Bauer, T.; Zheng, Z.; Renn, A.; Enning, R.; Stemmer, A.; Sakamoto, J.; Schlüter, A.D. Synthesis of free-standing, monolayered organometallic sheets at the air/water interface. Angew. Chem. Int. Ed. 2011, 50, 7879–7884. [Google Scholar] [CrossRef] [PubMed]
- Amo-Ochoa, P.; Welte, L.; González-Prieto, R.; Sanz Miguel, P.J.; Gómez-García, C.J.; Mateo-Martí, E.; Delgado, S.; Gómez-Herrero, J.; Zamora, F. Single layers of a multifunctional laminar Cu(I,II) coordination polymer. Chem. Commun. 2010, 46, 3262–3264. [Google Scholar] [CrossRef] [PubMed]
- Nai, J.; Zhang, J.; Lou, X.W. Construction of Single-Crystalline Prussian Blue Analog Hollow Nanostructures with Tailorable Topologies. Chem 2018, 4, 1967–1982. [Google Scholar] [CrossRef]
- Wang, L.; Han, Y.; Feng, X.; Zhou, J.; Qi, P.; Wang, B. Metal-organic frameworks for energy storage: Batteries and supercapacitors. Coord. Chem. Rev. 2016, 307, 361–381. [Google Scholar] [CrossRef]
- Safarifard, V.; Morsali, A. Applications of ultrasound to the synthesis of nanoscale metal-organic coordination polymers. Coord. Chem. Rev. 2015, 292, 1–14. [Google Scholar] [CrossRef]
- Wang, B.; Han, Y.; Wang, X.; Bahlawane, N.; Pan, H.; Yan, M.; Jiang, Y. Prussian Blue Analogs for Rechargeable Batteries. iScience 2018, 3, 110–133. [Google Scholar] [CrossRef] [PubMed]
- Malgras, V.; Ji, Q.; Kamachi, Y.; Mori, T.; Shieh, F.K.; Wu, K.C.W.; Ariga, K.; Yamauchi, Y. Templated synthesis for nanoarchitectured porous materials. Bull. Chem. Soc. Jpn. 2015, 88, 1171–1200. [Google Scholar] [CrossRef]
- Liu, X.; Ma, R.; Bando, Y.; Sasaki, T. A general strategy to layered transition-metal hydroxide nanocones: Tuning the composition for high electrochemical performance. Adv. Mater. 2012, 24, 2148–2153. [Google Scholar] [CrossRef] [PubMed]
- Yan, J.; Fan, Z.; Sun, W.; Ning, G.; Wei, T.; Zhang, Q.; Zhang, R.; Zhi, L.; Wei, F. Advanced asymmetric supercapacitors based on Ni(OH)2/graphene and porous graphene electrodes with high energy density. Adv. Funct. Mater. 2012, 22, 2632–2641. [Google Scholar] [CrossRef]
- Yu, X.; Yun, S.; Yeon, J.S.; Bhattacharya, P.; Wang, L.; Lee, S.W.; Hu, X.; Park, H.S. Emergent Pseudocapacitance of 2D Nanomaterials. Adv. Energy Mater. 2018, 8, 1702930. [Google Scholar] [CrossRef]
- Diaz-Morales, O.; Ferrus-Suspedra, D.; Koper, M.T.M. The importance of nickel oxyhydroxide deprotonation on its activity towards electrochemical water oxidation. Chem. Sci. 2016, 7, 2639. [Google Scholar] [CrossRef] [PubMed]
- Hareli, C.; Caspary Toroker, M. Water Oxidation Catalysis for NiOOH by a Metropolis Monte Carlo Algorithm. J. Chem. Theory Comput. 2018, 14, 2380–2385. [Google Scholar] [CrossRef] [PubMed]
- Wang, R.; Yan, X. Superior asymmetric supercapacitor based on Ni-Co oxide nanosheets and carbon nanorods. Sci. Rep. 2014, 4, 3712. [Google Scholar] [CrossRef] [PubMed]
- Wei, T.Y.; Chen, C.H.; Chien, H.C.; Lu, S.Y.; Hu, C.C. A cost-effective supercapacitor material of ultrahigh specific capacitances: Spinel nickel cobaltite aerogels from an epoxide-driven sol-gel process. Adv. Mater. 2010, 22, 347–351. [Google Scholar] [CrossRef] [PubMed]
- Wang, Y.G.; Cheng, L.; Xia, Y.Y. Electrochemical profile of nano-particle CoAl double hydroxide/active carbon supercapacitor using KOH electrolyte solution. J. Power Sources 2006, 153, 191–196. [Google Scholar] [CrossRef]
- Mai, L.Q.; Yang, F.; Zhao, Y.L.; Xu, X.; Xu, L.; Luo, Y.Z. Hierarchical MnMoO4/CoMoO4 heterostructured nanowires with enhanced supercapacitor performance. Nat. Commun. 2011, 2, 381. [Google Scholar] [CrossRef] [PubMed]
- Yuan, C.; Li, J.; Hou, L.; Zhang, X.; Shen, L.; Lou, X.W. Ultrathin mesoporous NiCo2O4 nanosheets supported on Ni foam as advanced electrodes for supercapacitors. Adv. Funct. Mater. 2012, 22, 4592–4597. [Google Scholar] [CrossRef]
- Toby, B.H.; Von Dreele, R.B. GSAS-II: The genesis of a modern open-source all purpose crystallography software package. J. Appl. Crystallogr. 2013, 46, 544–549. [Google Scholar] [CrossRef]
- Li, N.C.; Lindenbaum, A.; White, J.M. Some metal complexes of citric and tricarballylic acids. J. Inorg. Nucl. Chem. 1959, 12, 122–128. [Google Scholar] [CrossRef]
- Wu, X.; Wu, C.; Wei, C.; Hu, L.; Qian, J.; Cao, Y.; Ai, X.; Wang, J.; Yang, H. Highly Crystallized Na2CoFe(CN)6 with Suppressed Lattice Defects as Superior Cathode Material for Sodium-Ion Batteries. ACS Appl. Mater. Interfaces 2016, 8, 5393–5399. [Google Scholar] [CrossRef] [PubMed]
- Hu, M.; Ishihara, S.; Yamauchi, Y. Bottom-Up Synthesis of Monodispersed Single-Crystalline Cyano-Bridged Coordination Polymer Nanoflakes. Angew. Chemie Int. Ed. 2013, 52, 1235–1239. [Google Scholar] [CrossRef] [PubMed]
- Zakaria, M.B.; Hu, M.; Tsujimoto, Y.; Sakka, Y.; Suzuki, N.; Kamachi, Y.; Imura, M.; Ishihara, S.; Ariga, K.; Yamauchi, Y. Controlled crystallization of cyano-bridged Cu-Pt coordination polymers with two-dimensional morphology. Chem. Asian J. 2014, 9, 1511–1514. [Google Scholar] [CrossRef] [PubMed]
- Xiong, P.; Zeng, G.; Zeng, L.; Wei, M. Prussian blue analogues Mn[Fe(CN)6]0.6667·nH2O cubes as an anode material for lithium-ion batteries. Dalt. Trans. 2015, 44, 16746–16751. [Google Scholar] [CrossRef] [PubMed]
- Heibel, M.; Kumar, G.; Wyse, C.; Bukovec, P.; Bocarsly, A.B. Use of Sol−Gel Chemistry for the Preparation of Cyanogels as Ceramic and Alloy Precursors. Chem. Mater. 1996, 8, 1504–1511. [Google Scholar] [CrossRef]
- Arun, T.; Prakash, K.; Kuppusamy, R.; Joseyphus, R.J. Magnetic properties of prussian blue modified Fe3O4 anocubes. J. Phys. Chem. Solids 2013, 74, 1761–1768. [Google Scholar] [CrossRef]
- Lemus-Santana, A.A.; Rodriguez-Hernandez, J.; Castillo, L.F. Del; Basterrechea, M.; Reguera, E. Unique coordination of pyrazine in T[Ni(CN)(4)] center dot 2pyz with T = Mn, Zn, Cd. J. Solid State Chem. 2009, 182, 757–766. [Google Scholar] [CrossRef]
- Hu, L.; Zhang, P.; Chen, Q.W.; Yan, N.; Mei, J.Y. Prussian Blue Analogue Mn3[Co(CN)6]2·nH2O porous nanocubes: Large-scale synthesis and their CO2 storage properties. Dalt. Trans. 2011, 40, 5557–5562. [Google Scholar] [CrossRef] [PubMed]
- Vafazadeh, R.; Dehghani-Firouzabadi, A.; Willis, A.C. Synthesis of Hetero- and Homo-multinuclear Complexes with a Tetracyanonickelate Anion: Structural Characterization [Cu(bcen)Ni(CN)4]2. Acta Chim. Slov. 2017, 686–691. [Google Scholar] [CrossRef]
- Türköz, D.; Kartal, Z.; Bahçeli, S. Ft-Ir Spectroscopic Study Of Co(1-Propanethiol)2Ni(Cn)4·Benzene Clathrate. Z. Naturforsch. A 2004, 59, 523–526. [Google Scholar] [CrossRef]
- Gil, D.M.; Navarro, M.C.; Lagarrigue, M.C.; Guimpel, J.; Carbonio, R.E.; Gomez, M.I.J. Synthesis and structural characterization of perovskite YFeO3 by thermal decomposition of a cyano complex precursor, Y[Fe(CN)6]·4H2O. J. Therm. Anal. Calorim. 2011, 103, 889–896. [Google Scholar] [CrossRef]
- Huang, L.; Ge, X.; Dong, S. A facile conversion of a Ni/Fe coordination polymer to a robust electrocatalyst for the oxygen evolution reaction. RSC Adv. 2017, 7, 32819–32825. [Google Scholar] [CrossRef] [Green Version]
- Hosseini, S.G.; Abazari, R. A facile one-step route for production of CuO, NiO, and CuO–NiO nanoparticles and comparison of their catalytic activity for ammonium perchlorate decomposition. RSC Adv. 2015, 5, 96777–96784. [Google Scholar] [CrossRef]
- Zhang, Y.X.; Kuang, M.; Wang, J.J. Mesoporous CuO-NiO micropolyhedrons: Facile synthesis, morphological evolution and pseudocapcitive performance. CrystEngComm 2014, 16, 492–498. [Google Scholar] [CrossRef]
- Huang, M.; Li, F.; Zhang, Y.X.; Li, B.; Gao, X. Hierarchical NiO nanoflake coated CuO flower core-shell nanostructures for supercapacitor. Ceram. Int. 2014, 40, 5533–5538. [Google Scholar] [CrossRef]


| Sample Names | Cu (NO3)2·3H2O (g) | K2[Ni(CN)4] (g) | TSCD (g) | Surface Area (m2 g−1) |
|---|---|---|---|---|
| Cu-Ni_0.00 | 0.120 | 0.120 | 0.00 | 31.54 |
| Cu-Ni_0.15 | 0.120 | 0.120 | 0.15 | 48.97 |
| Cu-Ni_0.20 | 0.120 | 0.120 | 0.20 | 47.69 |
| Cu-Ni_0.25 | 0.120 | 0.120 | 0.25 | 34.43 |
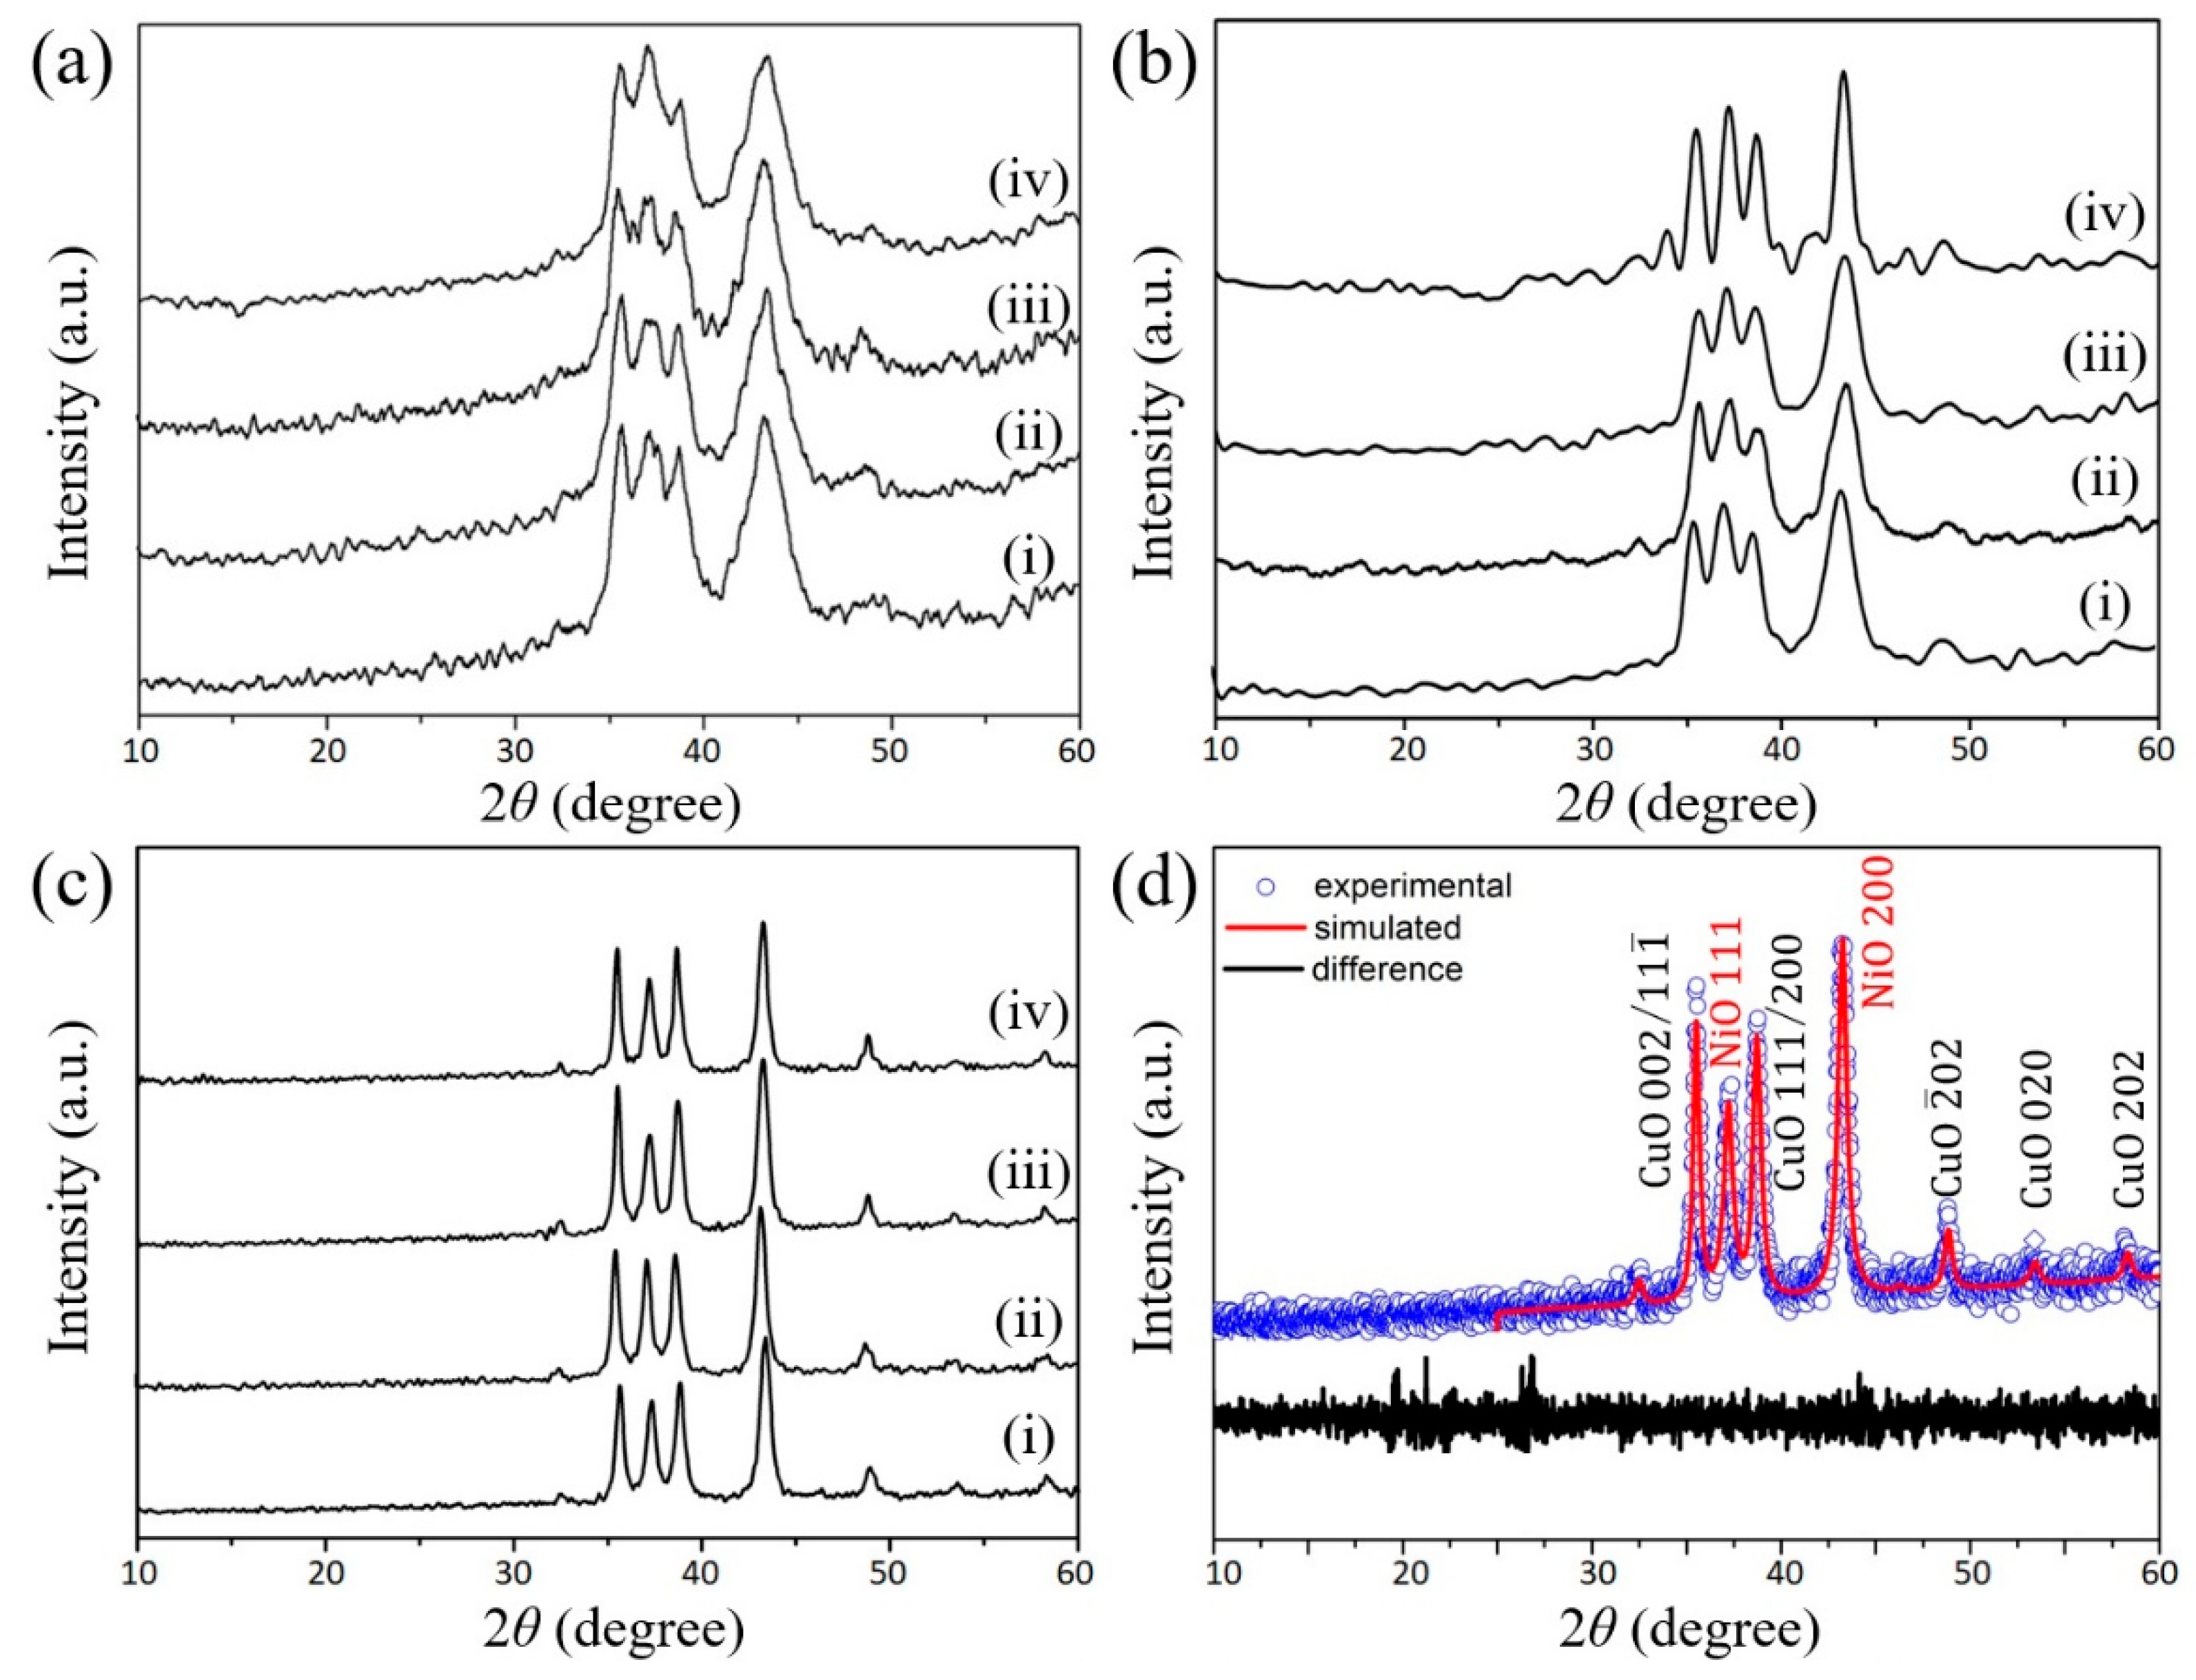
| Compound | 1 | 2 |
|---|---|---|
| Formula | CuO | NiO |
| Space group | C2/c | Fmm |
| a/Å | 4.683(7) | 4.178(1) |
| b/Å | 3.422(6) | 4.178(1) |
| c/Å | 5.128(8) | 4.178(1) |
| α(o) | 90.00 | 90.00 |
| β(o) | 99.54 | 90.00 |
| γ(o) | 90.00 | 90.00 |
| V/Å3 | 81.0798 | 72.9298 |
| wR(%) * | 3.2 | 1.6 |
© 2018 by the authors. Licensee MDPI, Basel, Switzerland. This article is an open access article distributed under the terms and conditions of the Creative Commons Attribution (CC BY) license (http://creativecommons.org/licenses/by/4.0/).
Share and Cite
Azhar, A.; Young, C.; Kaneti, Y.V.; Yamauchi, Y.; Badjah, A.Y.; Naushad, M.; Habila, M.; Wabaidur, S.; Alothman, Z.A.; Kim, J. Cyano-Bridged Cu-Ni Coordination Polymer Nanoflakes and Their Thermal Conversion to Mixed Cu-Ni Oxides. Nanomaterials 2018, 8, 968. https://doi.org/10.3390/nano8120968
Azhar A, Young C, Kaneti YV, Yamauchi Y, Badjah AY, Naushad M, Habila M, Wabaidur S, Alothman ZA, Kim J. Cyano-Bridged Cu-Ni Coordination Polymer Nanoflakes and Their Thermal Conversion to Mixed Cu-Ni Oxides. Nanomaterials. 2018; 8(12):968. https://doi.org/10.3390/nano8120968
Chicago/Turabian StyleAzhar, Alowasheeir, Christine Young, Yusuf Valentino Kaneti, Yusuke Yamauchi, Ahmad Yacine Badjah, Mu Naushad, Mohamed Habila, Saikh Wabaidur, Zeid A. Alothman, and Jeonghun Kim. 2018. "Cyano-Bridged Cu-Ni Coordination Polymer Nanoflakes and Their Thermal Conversion to Mixed Cu-Ni Oxides" Nanomaterials 8, no. 12: 968. https://doi.org/10.3390/nano8120968