Synergistic Effects of Active Sites’ Nature and Hydrophilicity on the Oxygen Reduction Reaction Activity of Pt-Free Catalysts

 , , , , ,
Abstract
:
1. Introduction
2. Materials and Methods
2.1. Catalyst Preparation
2.2. Physical Characterizations
3. Results and Discussion
4. Conclusions
Supplementary Materials
Author Contributions
Funding
Acknowledgments
Conflicts of Interest
References
- Greeley, J.; Stephens, I.E.L.; Bondarenko, A.S.; Johansson, T.P.; Hansen, H.A.; Jaramillo, T.F.; Rossmeisl, J.; Chorkendorff, I.; Nørskov, J.K. Alloys of Platinum and Early Transition Metals as Oxygen Reduction Electrocatalysts. Nat. Chem. 2009, 1, 552–556. [Google Scholar] [CrossRef] [PubMed]
- Wu, G.; Zelenay, P. Nanostructured Nonprecious Metal Catalysts for Oxygen Reduction Reaction. Acc. Chem. Res. 2013, 46, 1878–1889. [Google Scholar] [CrossRef] [PubMed]
- Ghosh, T.; Vukmirovic, M.B.; Di Salvo, F.J.; Adzic, R.R. Intermetallics as Novel Supports for Pt Monolayer O2 Reduction Electrocatalysts: Potential for Significantly Improving Properties. J. Am. Chem. Soc. 2010, 132, 906–907. [Google Scholar] [CrossRef] [PubMed]
- Bashyam, R.; Zelenay, P. A Class of Non-Precious Metal Composite Catalysts for Fuel Cells. Nature 2006, 443, 63–66. [Google Scholar] [CrossRef] [PubMed]
- Lefèvre, M.; Proietti, E.; Jaouen, F.; Dodelet, J.P. Iron-Based Catalysts with Improved Oxygen Reduction Activity in Polymer Electrolyte Fuel Cells. Science 2009, 324, 71–74. [Google Scholar] [CrossRef] [PubMed]
- Jaouen, F.; Herranz, J.; Lefèvre, M.; Dodelet, J.-P.; Kramm, U.I.; Herrmann, I.; Bogdanoff, P.; Maruyama, J.; Nagaoka, T.; Garsuch, A.; et al. Cross-Laboratory Experimental Study of Non-Noble-Metal Electrocatalysts for the Oxygen Reduction Reaction. ACS Appl. Mater. Interfaces 2009, 1, 1623–1639. [Google Scholar] [CrossRef] [PubMed]
- Wu, G.; More, K.L.; Johnston, C.M.; Zelenay, P. High-Performance Electrocatalysts for Oxygen Reduction Derived from Polyaniline, Iron, and Cobalt. Science 2011, 332, 443–447. [Google Scholar] [CrossRef] [PubMed]
- Cheon, J.Y.; Kim, T.; Choi, Y.; Jeong, H.Y.; Kim, M.G.; Sa, Y.J.; Kim, J.; Lee, Z.; Yang, T.H.; Kwon, K.; et al. Ordered Mesoporous Porphyrinic Carbons with Very High Electrocatalytic Activity for the Oxygen Reduction Reaction. Sci. Rep. 2013, 3, 2715. [Google Scholar] [CrossRef] [PubMed] [Green Version]
- Guan, B.Y.; Yu, L.; Lou, X.W. A Dual-Metal–Organic-Framework Derived Electrocatalyst for Oxygen Reduction. Energy Environ. Sci. 2016, 9, 3092–3096. [Google Scholar] [CrossRef]
- Xia, B.Y.; Yan, Y.; Li, N.; Wu, H.B.; Lou, X.W.; Wang, X. A Metal–Organic Framework-Derived Bifunctional Oxygen Electrocatalyst. Nat. Energy 2016, 1, 15006. [Google Scholar] [CrossRef]
- Liu, T.; Zhao, P.; Hua, X.; Luo, W.; Chen, S.; Cheng, G. An Fe–N–C Hybrid Electrocatalyst Derived from a Bimetal–Organic Framework for Efficient Oxygen Reduction. J. Mater. Chem. A 2016, 4, 11357–11364. [Google Scholar] [CrossRef]
- Masa, J.; Xia, W.; Muhler, M.; Schuhmann, W. On the Role of Metals in Nitrogen-Doped Carbon Electrocatalysts for Oxygen Reduction. Angew. Chem. Int. Ed. 2015, 54, 10102–10120. [Google Scholar] [CrossRef] [PubMed]
- Tylus, U.; Jia, Q.; Strickland, K.; Ramaswamy, N.; Serov, A.; Atanassov, P.; Mukerjee, S. Elucidating Oxygen Reduction Active Sites in Pyrolyzed Metal-Nitrogen Coordinated Non-Precious-Metal Electrocatalyst Systems. J. Phys. Chem. C 2014, 118, 8999–9008. [Google Scholar] [CrossRef] [PubMed]
- Choi, C.H.; Choi, W.S.; Kasian, O.; Mechler, A.K.; Sougrati, M.T.; Brüller, S.; Strickland, K.; Jia, Q.; Mukerjee, S.; Mayrhofer, K.J.J.; et al. Unraveling the Nature of Sites Active toward Hydrogen Peroxide Reduction in Fe-N-C Catalysts. Angew. Chem. Int. Ed. 2017, 56, 8809–8812. [Google Scholar] [CrossRef] [PubMed] [Green Version]
- Workman, M.J.; Dzara, M.; Ngo, C.; Pylypenko, S.; Serov, A.; McKinney, S.; Gordon, J.; Atanassov, P.; Artyushkova, K. Platinum Group Metal-Free Electrocatalysts: Effects of Synthesis on Structure and Performance in Proton-Exchange Membrane Fuel Cell Cathodes. J. Power Sources 2017, 348, 30–39. [Google Scholar] [CrossRef]
- Longhi, M.; Marzorati, S.; Checchia, S.; Sacchi, B.; Santo, N.; Zaffino, C.; Scavini, M. Sugar-Based Catalysts for Oxygen Reduction Reaction. Effects of the Functionalization of the Nitrogen Precursors on the Electrocatalytic Activity. Electrochim. Acta 2016, 222, 781–792. [Google Scholar] [CrossRef]
- Su, C.-Y.; Cheng, H.; Li, W.; Liu, Z.-Q.; Li, N.; Hou, Z.; Bai, F.-Q.; Zhang, H.-X.; Ma, T.-Y. Atomic Modulation of FeCo–Nitrogen–Carbon Bifunctional Oxygen Electrodes for Rechargeable and Flexible All-Solid-State Zinc–Air Battery. Adv. Energy Mater. 2017, 7, 1602420. [Google Scholar] [CrossRef]
- Witkowska, A.; Giuli, G.; Renzi, M.; Marzorati, S.; Yiming, W.; Nobili, F.; Longhi, M. Fe Local Structure in Pt-Free Nitrogen-Modified Carbon Based Electrocatalysts: XAFS Study. J. Phys. Conf. Ser. 2015, 012131/1–012131/4. [Google Scholar] [CrossRef]
- Artyushkova, K.; Serov, A.; Rojas-Carbonell, S.; Atanassov, P. Chemistry of Multidinous Active Sites for Oxygen Reduction Reaction in Transition Metal-Nitrogen-Carbon Electrocatalysts. J. Phys. Chem. C 2015, 119, 25917–25928. [Google Scholar] [CrossRef]
- Hao, G.-P.; Sahraie, N.R.; Zhang, Q.; Krause, S.; Oschatz, M.; Bachmatiuk, A.; Strasser, P.; Kaskel, S. Hydrophilic Non-Precious Metal Nitrogen-Doped Carbon Electrocatalysts for Enhanced Efficiency in Oxygen Reduction Reaction. Chem. Commun. 2015, 51, 17285–17288. [Google Scholar] [CrossRef] [PubMed]
- Kumar, K.V.; Preuss, K.; Guo, Z.X.; Titirici, M.M. Understanding the Hydrophilicity and Water Adsorption Behavior of Nanoporous Nitrogen-Doped Carbons. J. Phys. Chem. C 2016, 120, 18167–18179. [Google Scholar] [CrossRef]
- Bogdanov, K.; Fedorov, A.; Osipov, V.; Enoki, T.; Takai, K.; Hayashi, T.; Ermakov, V.; Moshkalev, S.; Baranov, A. Annealing-Induced Structural Changes of Carbon Onions: High-Resolution Transmission Electron, Microscopy and Raman Studies. Carbon 2014, 73, 78–86. [Google Scholar] [CrossRef]
- Larson, A.C.; Von Dreele, R.B. General Structural Analysis System (GSAS); Los Alamos National Laboratory, Report LAUR: Los Alamos, NM, USA, 2004. [Google Scholar]
- Sing, K.S.W.; Everett, D.H.; Haul, R.A.W.; Moscou, L.; Pierotti, R.A.; Rouquerol, J.; Siemieniewska, T. Reporting Physisorption Data for Gas/Solid Systems with Special Reference to the Determination of Surface Area and Porosity. Pure Appl. Chem. 1985, 57, 603–619. [Google Scholar] [CrossRef]
- Thommes, M. Physical Adsorption Characterization of Nanoporous Materials. Chem. Ing. Tech. 2010, 82, 1059–1073. [Google Scholar] [CrossRef] [Green Version]
- Leonard, N.D.; Nallathambi, V.; Calabrese Burton, S. Carbon Supports for Non-Precious Metal Proton Exchange Membrane Fuel Cells. ECS Trans. 2011, 41, 1175–1181. [Google Scholar] [CrossRef]
- Xy, J.B.; Zhao, T.S. Mesoporous Carbon with Uniquely Combined Electrochemical and Mass Transport Characteristics for Polymer Electrolyte Membrane Fuel Cells. RSC Adv. 2013, 3, 16–24. [Google Scholar]
- Marzorati, S.; Longhi, M. Templating Induced Behavior of Platinum-free Carbons for Oxygen Reduction Reaction. J. Electroanal. Chem. 2016, 775, 350–355. [Google Scholar] [CrossRef]
- Ferrari, A.C.; Robertson, J. Interpretation of Raman Spectra of Disordered and Amorphous Carbon. Phys. Rev. B 2001, 61, 14095–14107. [Google Scholar] [CrossRef]
- Santangelo, S. Controlled Surface Functionalisation of Carbon Nanotubes by Nitric Acid Vapors Generated from Sub-Azeotropic Solution. Surf. Interface Anal. 2016, 48, 17–25. [Google Scholar] [CrossRef]
- Cançado, L.G.; Takai, K.; Enoki, T.; Endo, M.; Kim, Y.A.; Mizusaki, H.; Jorio, A.; Coelho, L.N.; Magalhães-Paniago, R.; Pimenta, M.A. General Equation for the Determination of the Crystallite Size La of Nanographite by Raman Spectroscopy. Appl. Phys. Lett. 2006, 8, 163106–163108. [Google Scholar] [CrossRef]
- Klement, W., Jr. Technical Report 401844; WM Keck Laboratory for Engineering Materials, California Institute of Technology: Pasadina, CA, USA, 1963; Available online: http://www.dtic.mil/dtic/tr/fulltext/u2/401844.pdf (accessed on 18 July 2018).
- Chen, Q.; Jin, Z. The Fe-Cu System: A Thermodynamic Evaluation. Metal. Mater. Trans. A 1995, 26, 417–426. [Google Scholar] [CrossRef]
- Peng, H.; Liu, F.; Liu, X.; Liao, S.; You, C.; Tian, X.; Nan, H.; Luo, F.; Song, H.; Fu, Z.; et al. Effect of Transition Metals on the Structure and Performance of the Doped Carbon Catalysts Derived from Polyaniline and Melamine for ORR Application. ACS Catal. 2014, 4, 3797–3805. [Google Scholar] [CrossRef]
- Lahaye, J.; Nanse, G.; Bagreev, A.; Strelko, V. Porous Structure and Surface Chemistry of Nitrogen Containing Carbons from Polymers. Carbon 1999, 37, 585–590. [Google Scholar] [CrossRef]
- Díaz, J.; Paolicelli, G.; Ferrer, S.; Comin, F. Separation of the sp3 and sp2 Components in the C1s Photoemission Spectra of Amorphous Carbon Films. Phys. Rev. B 1996, 54, 8064–8069. [Google Scholar] [CrossRef]
- Biesinger, M.C.; Lau, L.W.M.; Gerson, A.R.; Smart, R.S.C. Resolving Surface Chemical States in XPS Analysis of First Row Transition Metals, Oxides and Hydroxides: Sc, Ti, V, Cu, and Zn. Appl. Surf. Sci. 2010, 257, 887–898. [Google Scholar] [CrossRef]
- Galbiati, I.; Bianchi, C.L.; Longhi, M.; Carra, A.; Formaro, L. Iron and Copper Containing Oxygen Reduction Catalysts from Templated Glucose-Histidine. Fuel Cells 2010, 10, 251–258. [Google Scholar] [CrossRef]
- Formaro, L.; Longhi, M.; Messina, P.; Galbiati, I. Catalysts Free from Noble Metals Suitable for the Electrochemical Reduction of Oxygen. U.S. Patent US 20140162869 A1, 12 June 2014. [Google Scholar]
- Andrews, R.; Jacques, D.; Qian, D.; Rantell, T. Multiwall Carbon Nanotubes: Synthesis and Application. Acc. Chem. Res. 2002, 35, 1008–1017. [Google Scholar] [CrossRef] [PubMed]
- Liang, J.; Zhou, R.F.; Chen, X.M.; Tang, Y.H.; Qiao, S.Z. Fe-N Decorated Hybrids of CNTs Grown on Hierarchically Porous Carbon for High-Performance Oxygen Reduction. Adv. Mater. 2014, 26, 6074–6079. [Google Scholar] [CrossRef] [PubMed]
- Maldonado, S.; Stevenson, K.J. Influence of Nitrogen Doping on Oxygen Reduction Electrocatalysis at Carbon Nanofiber Electrodes. J. Phys. Chem. B 2005, 109, 4707–4716. [Google Scholar] [CrossRef] [PubMed]
- Van Dommele, S.; de Jong, K.P.; Bitter, J.H. Nitrogen-Containing Carbon Nanotubes as Solid Base Catalysts. Chem. Commun. 2006, 4859–4861. [Google Scholar] [CrossRef]
- Shao, Y.; Sui, J.; Yin, G.; Gao, Y. Nitrogen-Doped Carbon Nanostructures and their Composites as Catalytic Materials for Proton Exchange Membrane Fuel Cell. Appl. Catal. B 2008, 79, 89–99. [Google Scholar] [CrossRef]
- Sidik, R.A.; Anderson, A.B.; Subramanian, N.P.; Kumaraguru, S.P.; Popov, B.N. O2 Reduction on Graphite and Nitrogen-Doped Graphite: Experiment and Theory. J. Phys. Chem. B 2006, 110, 1787–1793. [Google Scholar] [CrossRef] [PubMed]
- Liu, R.; Wu, D.; Feng, X.; Müllen, K. Nitrogen-Doped Ordered Mesoporous Graphitic Arrays with High Electrocatalytic Activity for Oxygen Reduction. Angew. Chem. 2010, 122, 2619–2623. [Google Scholar] [CrossRef]
- Chizari, K.; Janowska, I.; Houllé, M.; Florea, I.; Ersen, O.; Romero, T.; Bernhardt, P.; Ledoux, M.J.; Pham-Huu, C. Tuning of Nitrogen-Doped Carbon Nanotubes as Catalyst Support for Liquid-Phase Reaction. Appl. Catal. A Gen. 2010, 380, 72–80. [Google Scholar] [CrossRef]
- Terrones, M.; Ajayan, P.M.; Banhart, F.; Blase, X.; Carroll, D.L.; Charlier, J.C.; Czerw, R.; Foley, B.; Grobert, N.; Kamalakaran, R.; et al. N-Doping and Coalescence of Carbon Nanotubes: Synthesis and Electronic Properties. Appl. Phys. A Mater. Sci. Process. 2002, 74, 355–361. [Google Scholar] [CrossRef]
- Ismagilov, Z.R.; Shalagina, A.E.; Podyacheva, O.Y.; Ischenko, A.V.; Kibis, L.S.; Boronin, A.I.; Chesalov, Y.A.; Kochubey, D.I.; Romanenko, A.I.; Anikeeva, O.B.; et al. Structure and Electrical Conductivity of Nitrogen-Doped Carbon Nanofibers. Carbon 2009, 47, 1922–1929. [Google Scholar] [CrossRef]
- Afanasev, B.N.; Akulova, Y.P. A Correlation Between the Hydrophilicity of a Metal and its Surface Tension. Calculation of the Bond Energy of Water Molecules Adsorbed on an Uncharged Metal Surface. Prot. Met. 2000, 36, 25–30. [Google Scholar] [CrossRef]
- Lee, W.J.; Maiti, U.N.; Lee, J.M.; Lim, J.; Han, T.H.; Sang, O.K. Nitrogen-Doped Carbon Nanotubes and Graphene Composite Structures for Energy and Catalytic Applications. Chem. Commun. 2014, 50, 6818–6830. [Google Scholar] [CrossRef] [PubMed]


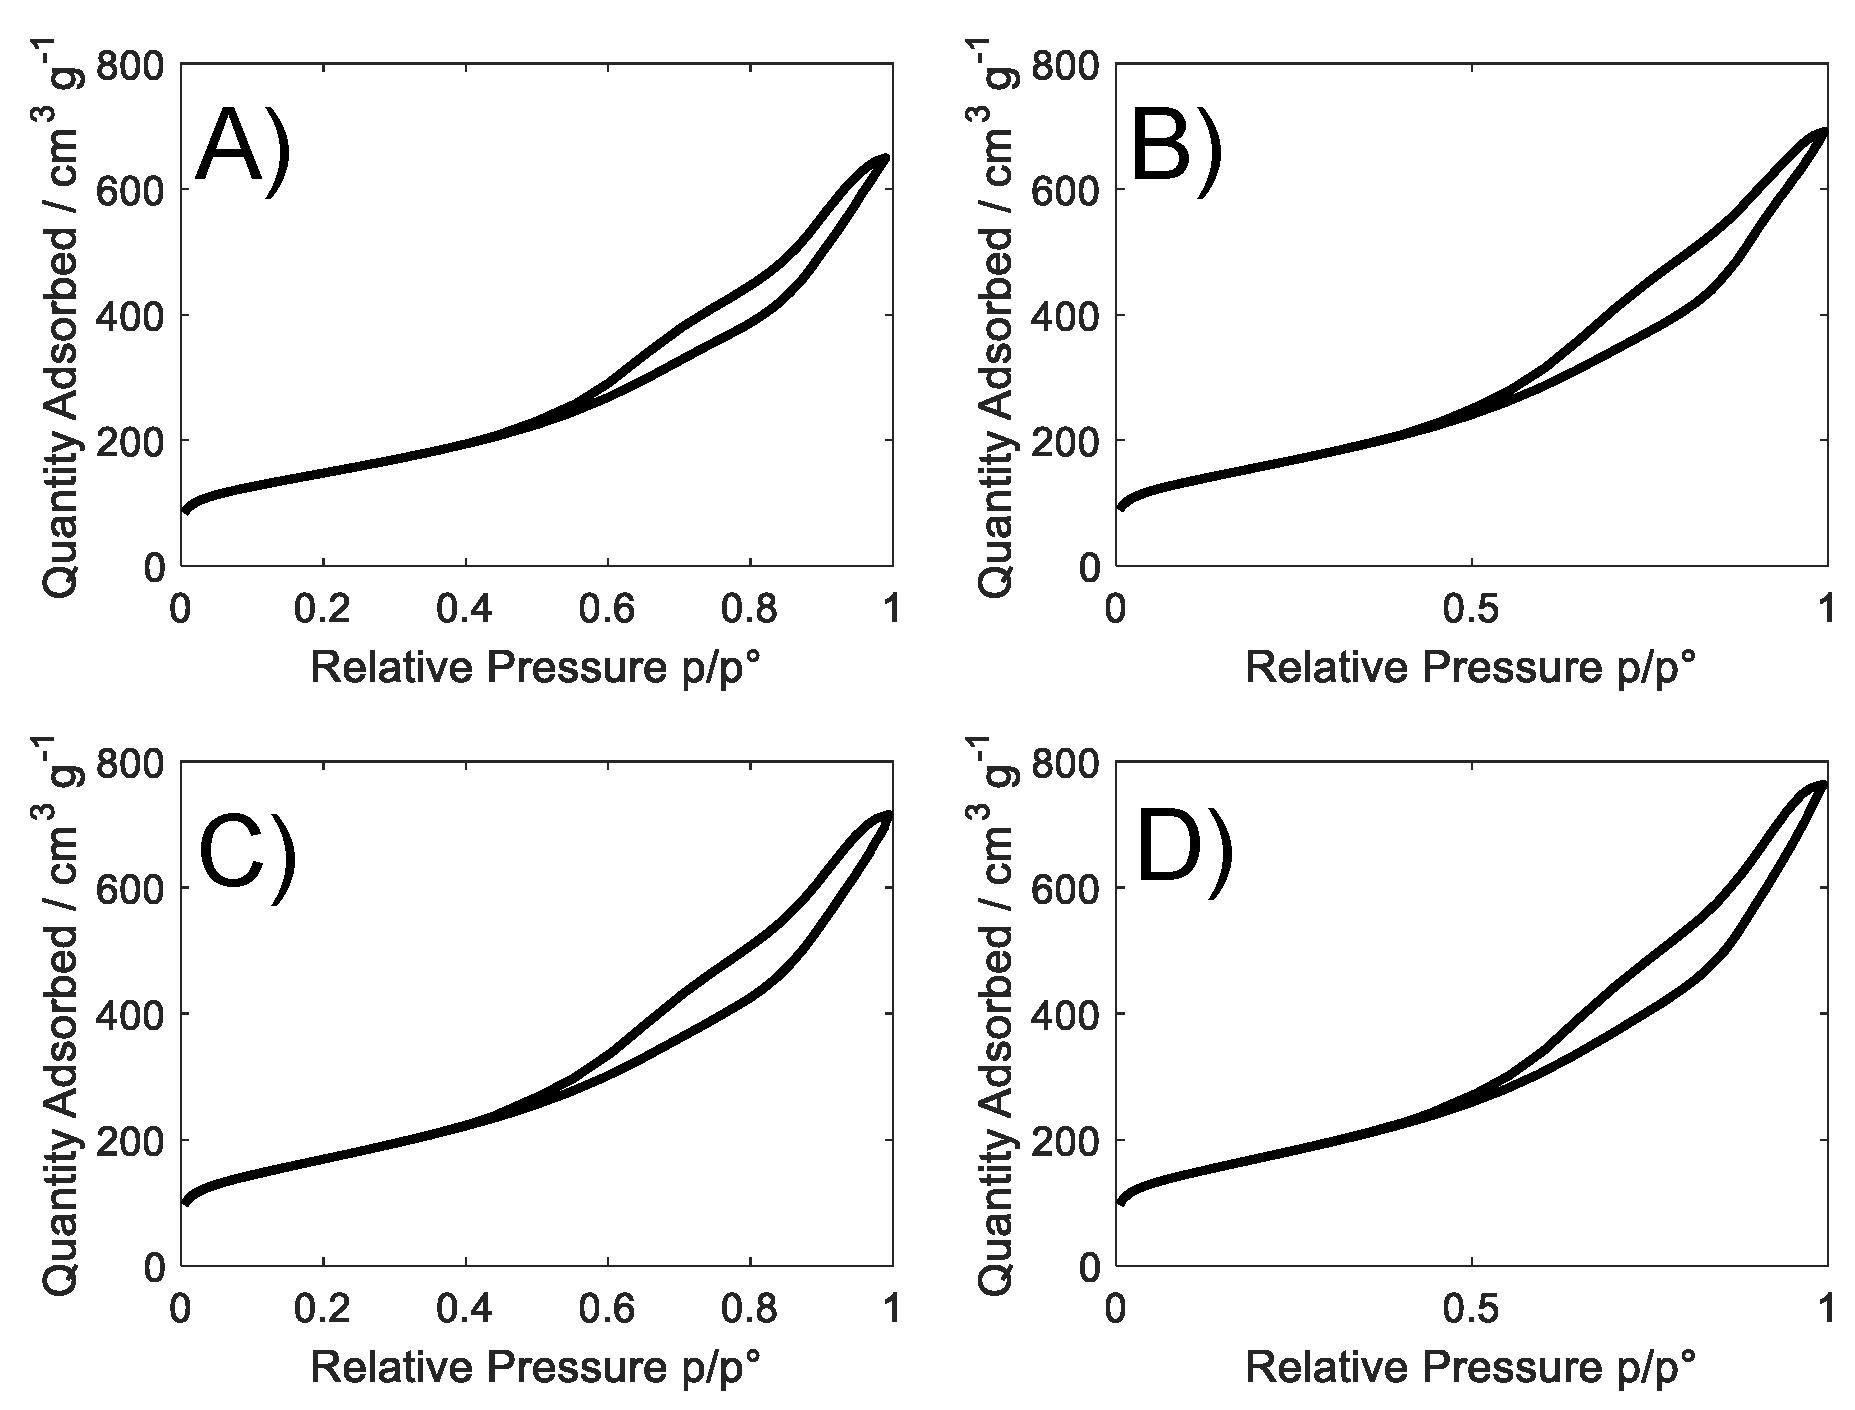
| Sample Name | SSA/m2 g−1 | Pores% d < 2 nm | Pores% 2 < d < 5 nm | Pores% 5 < d < 20 nm | Pores% d > 20 nm |
|---|---|---|---|---|---|
| S_GA | 523 | 7.2 | 53.7 | 34.5 | 4.6 |
| S_GA_Cu | 556 | 3.9 | 56.3 | 35.6 | 4.2 |
| S_GA_Fe | 598 | 5.7 | 56.9 | 33.2 | 4.2 |
| S_GA_FeCu | 602 | 5.0 | 54.7 | 35.7 | 4.6 |
| Sample Name | %C | %N | %O | %Fe | %Cu |
|---|---|---|---|---|---|
| S_GA | 88.6 ± 0.7 | 8.3 ± 0.5 | 3.1 ± 0.6 | - | - |
| S_GA_Cu | 88.0 ± 0.5 | 6.9 ± 0.9 | 4.7 ± 1.3 | - | 0.4 ± 0.2 |
| S_GA_Fe | 88.6 ± 0.5 | 7.1 ± 0.5 | 4.0 ± 0.5 | 0.3 ± 0.2 | - |
| S_GA_FeCu | 89.4 ± 1.2 | 7.1 ± 0.5 | 3.0 ± 1.0 | 0.3 ± 0.2 | 0.2 ± 0.2 |
| Peak Number | Binding Energies/eV | Functional Group | S_GA | S_GA_Cu | S_GA_Fe | S_GA_FeCu |
|---|---|---|---|---|---|---|
| (1) | 398.3–398.5 | Pyridinic N | 25 ± 1 | 26 ± 2 | 29 ± 1 | 27 ± 2 |
| (2) | 399.2–399.6 | Nx-Me or amine | 13 ± 4 | 16 ± 4 | 13 ± 1 | 14 ± 1 |
| (3) | 400.9–401.0 | Pyrrolic N | 37 ± 2 | 35 ± 2 | 36 ± 1 | 31 ± 4 |
| (4) | 402.0–403.0 | Quaternary N | 12 ± 3 | 10 ± 2 | 10 ± 1 | 11 ± 3 |
| (5) | 403.3–403.6 | Graphitic N | 6 ± 1 | 5 ± 1 | 5 ± 1 | 7 ± 1 |
| (6) | 404.8–405.1 | Shake-up π-π * | 3 ± 2 | 4 ± 2 | 5 ± 1 | 6 ± 1 |
| (7) | 406.8–406.9 | Shake-up π-π * | 4 ± 1 | 4 ± 1 | 2 ± 1 | 4 ± 1 |
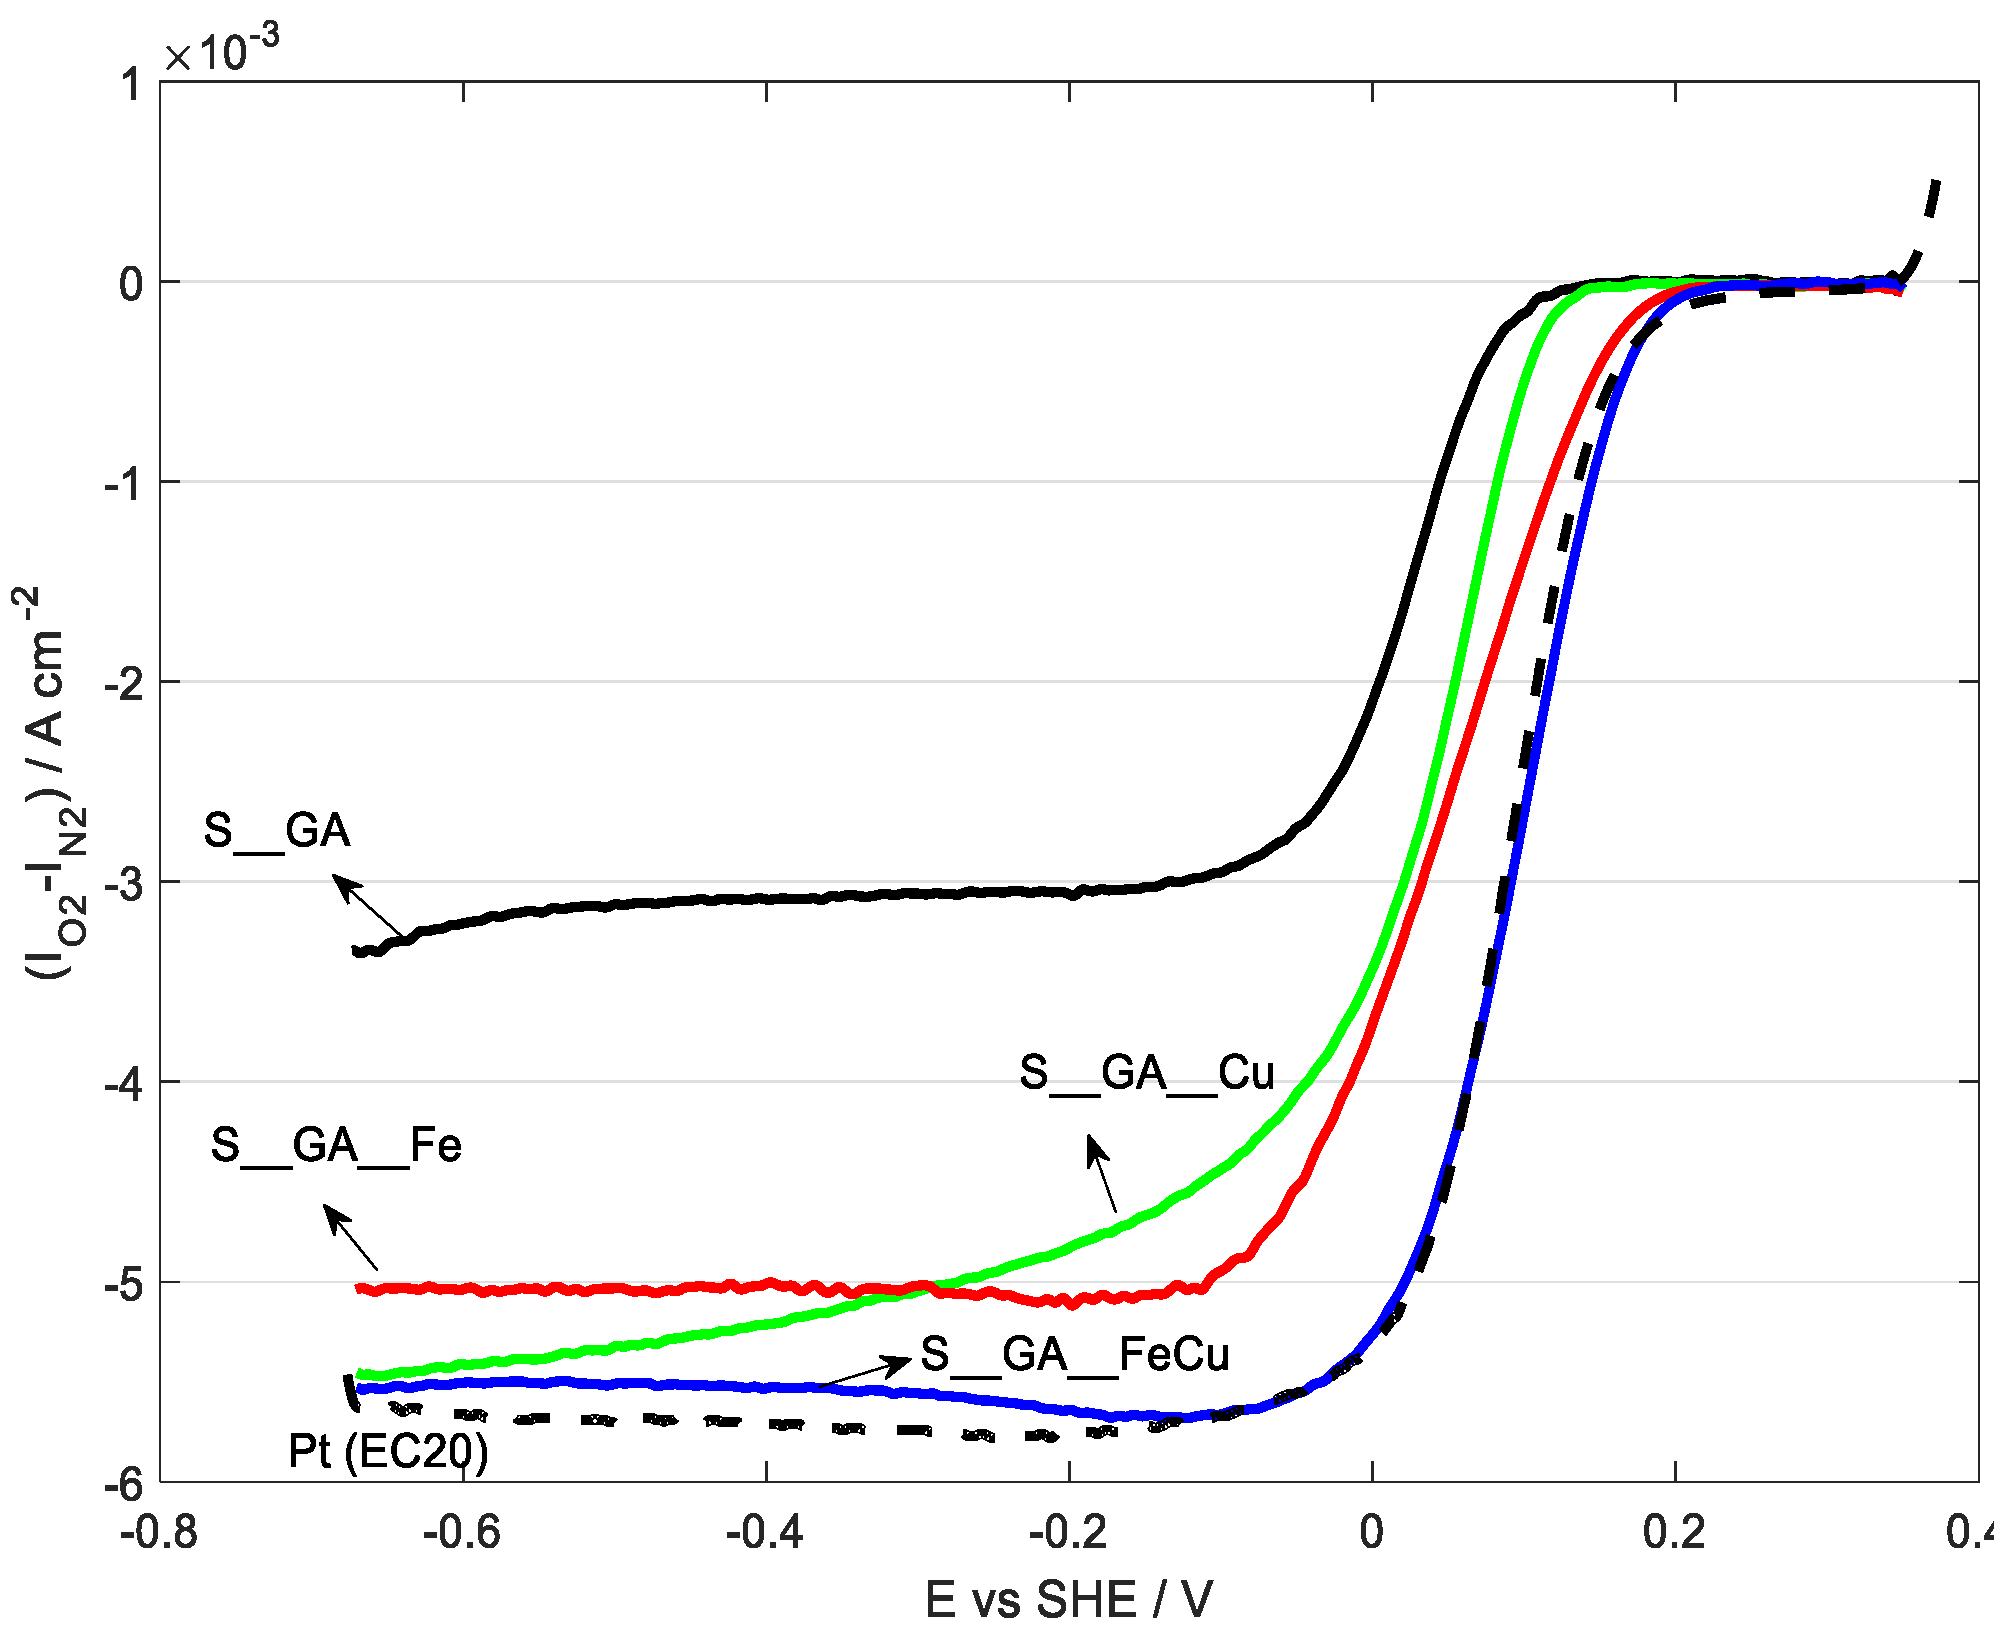
| Sample Name | Eonset versus SHE/V at j = 1 mA cm−2 | E1/2 versus SHE/V | n e− |
|---|---|---|---|
| S_GA | 0.044 | 0.033 | 2.72 ± 0.01 |
| S_GA_Cu | 0.082 | 0.068 | 3.82 ± 0.03 |
| S_GA_Fe | 0.117 | 0.066 | 3.98 ± 0.03 |
| S_GA_FeCu | 0.145 | 0.099 | 3.48 ± 0.02 |
| Pt EC20 | 0.135 | 0.088 | 4.0 ± 0.1 |
| Sample Name | Time/s |
|---|---|
| S_GA | 7.9 |
| S_GA_Fe | 5.8 |
| S_GA_Cu | 4.7 |
| S_GA_FeCu | 4.0 |
© 2018 by the authors. Licensee MDPI, Basel, Switzerland. This article is an open access article distributed under the terms and conditions of the Creative Commons Attribution (CC BY) license (http://creativecommons.org/licenses/by/4.0/).
Share and Cite
Longhi, M.; Cova, C.; Pargoletti, E.; Coduri, M.; Santangelo, S.; Patanè, S.; Ditaranto, N.; Cioffi, N.; Facibeni, A.; Scavini, M. Synergistic Effects of Active Sites’ Nature and Hydrophilicity on the Oxygen Reduction Reaction Activity of Pt-Free Catalysts. Nanomaterials 2018, 8, 643. https://doi.org/10.3390/nano8090643
Longhi M, Cova C, Pargoletti E, Coduri M, Santangelo S, Patanè S, Ditaranto N, Cioffi N, Facibeni A, Scavini M. Synergistic Effects of Active Sites’ Nature and Hydrophilicity on the Oxygen Reduction Reaction Activity of Pt-Free Catalysts. Nanomaterials. 2018; 8(9):643. https://doi.org/10.3390/nano8090643
Chicago/Turabian StyleLonghi, Mariangela, Camilla Cova, Eleonora Pargoletti, Mauro Coduri, Saveria Santangelo, Salvatore Patanè, Nicoletta Ditaranto, Nicola Cioffi, Anna Facibeni, and Marco Scavini. 2018. "Synergistic Effects of Active Sites’ Nature and Hydrophilicity on the Oxygen Reduction Reaction Activity of Pt-Free Catalysts" Nanomaterials 8, no. 9: 643. https://doi.org/10.3390/nano8090643