Article

CdSe/ZnS Quantum Dots Impaired the First Two Generations of Placenta Growth in an Animal Model, Based on the Shh Signaling Pathway

1
State Key Laboratory of Food Science and Technology, Nanchang University, Nanchang 330047, China
2
Zystein, LLC., Fayetteville, AR 72704, USA
*
Author to whom correspondence should be addressed.
Nanomaterials 2019, 9(2), 257; https://doi.org/10.3390/nano9020257
Submission received: 27 December 2018 / Revised: 7 February 2019 / Accepted: 11 February 2019 / Published: 14 February 2019

Abstract

:
The toxicity, especially the transgenerational toxicity of quantum dots (QDs) in vivo, is still scarcely understood in spite of great promising applications of QDs in biomedicine. In this study, the maternal status, pregnancy outcome, and fetus development of parental generation (P0) to offspring in three generations (F3) were investigated after Kunming mice perinatal (GD 13-PND 5) exposure to Cd containing QDs (CdSe/ZnS QDs) and CdCl2. The results show CdSe/ZnS QDs induced placenta injuries in P0 and diminished placenta diameters in F1 and F2. Bodyweight growth decreased in the CdSe/ZnS QDs treatment group in the F1 and F2 generation. Additionally, CdSe/ZnS QDs significantly altered the expression of key genes in the Shh signal pathway. Overall, this study exhibited that the CdSe/ZnS QDs exposure during perinatal period impaired placenta growth in the first two generations, but not on the third generation. The toxicological actions of the CdSe/ZnS QDs might be through the effects on the Shh signal pathway.

Graphical Abstract

1. Introduction

Quantum dots (QDs) are classified as semiconductor inorganic nanoparticles, which are synthesized with elements that come from group III-V elements (e.g., InP and InAs) or group II-VI elements (e.g., CdSe and CdTe). Due to the nanoscale size and excellent fluorescence properties, QDs can be applied for tumor diagnosis, drug targeting, biomedical imaging, and other biomedical applications [1,2,3,4]. However, QDs could induce potential toxicity because of the elemental composition and nanoscale size during medical applications or accidental exposures. Tang et al. reported that intravenous exposure to QDs triggered liver injury in mice at a dosage of 10 nmol/kg body weight (BW) [5]. CdSe QDs with a surface coating of ZnS at a concentration of 0.23 pmol/cell caused Xenopus embryonic cell injury observed by Dubertret et al. [6]. Moreover, there are several in vitro and in vivo studies aimed to explore the toxic effects and mechanisms of QDs [7,8].
Recently, reproductive toxic effects of QDs had drawn scientific concerns. Zhang et al. found QDs that accumulated in the placenta and disturbed placental function, inducing severe malformations of the placenta and fetus after exposure to QDs in late pregnancy [9]. Chu et al. reported that QDs could translocate across the placental barrier into the fetus in a dose dependent manner [10]. However, multigenerational toxicity as a field of reproductive toxicity of QDs has not been well studied. As far as we know, only one recent study indicated that exposure to QDs for two weeks before mating, at a dosage of 0.81 mg Cd/kg, did not disturb the reproductive outcome and the offspring development over three generations [11]. These findings could result from the utilization of core/shell structure and phospholipid encapsulation that inhibited QDs degradation. Inhibition of QDs degradation reduced the amount of cadmium ions, preventing damage to the placenta during the term of pregnancy. However, there is scarce research focus on multigenerational toxicity of QDs, not to mention multigenerational toxicity induced by perinatal exposure.
This study was; therefore, aimed to evaluate the multigenerational effects and mechanism of exposure to CdSe/ZnS QDs during perinatal period (gestation day 13 (GD 13)-postnatal day 5 (PND 5)) in mice. The effects on female reproductive performance and the overall health of their first, second, and third generations of litters were determined. The Cd concentrations in pregnant tissues and the transcription levels of genes related to oxidative stress, apoptosis, and fetus development were also evaluated.

2. Materials and Methods

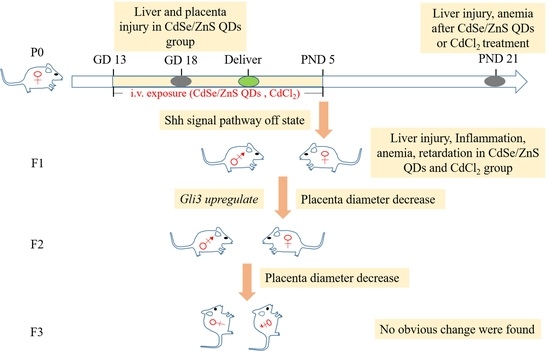
2.1. Material and Animal Treatment

CdSe/ZnS QDs used in this research was purchased from Ocean NanoTech, LLC (QSH560, Lot#041802#, Springdale, AR, USA). The optical properties of the CdSe/ZnS QDs were characterized by fluorescence and absorption spectroscopy. Transmission electron microscopy (TEM, JEOL USA, Inc. Peabody, MA, USA) and dynamic light scattering (DLS, Microtrac Inc., Montgomeryville, PA, USA) was used to measure primary and hydrodynamic diameter of this material. Approximately 8–10-week old, female Kunming mice, were obtained from the experimental animal center of Nanchang University. These were kept at a 12/12-hour light/dark cycle condition, libitum supplemented food and water at a specific time. All processes involving mice used in this experiment were in accordance with the institutional animal care committee guidelines and this study was approved by the Animal Care Review Committee (approval number 0064257), Nanchang University, Jiangxi, China. At the end of the 1-week adaptation, female mice were mated with healthy male mice. The day vaginal plug appeared was designated as GD 0 and these were randomly divided into three groups (n = 8). These were observed daily and weighed for clinical manifestations. The control group, CdCl2 group, CdSe/ZnS QDs group were treated with normal saline, 1.25 μmol/L CdCl2, 0.125 μmol/L CdSe/ZnS QDs, respectively at 100 μL/mice/day from GD 13 to GD 18 or PND 5 (total 5- or 10-times exposure) using tail vein injection. The dose used in this research was according to our previous work, because a longer exposure period was planned, the amount of QDs per exposure was lower than before [9]. Total Cd concentration were same in CdCl2 and QDs group. These mice were designated as the parental generation (P0). Half of these mice were anatomized at GD 18, while the rest were exposed until PND 5 and anatomized at PND 21. Six female mice in F1, at age of 60 d, were randomly chosen and mated with healthy male mice to make the F2 generation. After that, six female mice in F2 were used to obtain F3. Pregnancy parameters in P0, F1, F2, and fetus development, such as body weight, fetus and placenta length, fetus number, malformation, and fetus body weight growth, were recorded. Other offspring that were not used in mating were anatomized at PND 60, and blood, organs, and tissues were collected and studied.

2.2. ICP-MS (Inductively Coupled Plasma Mass Spectrometry) Analysis Cd Caontent

Approximately 0.1–0.5 g of spleen, liver, kidney, lungs, ovary, breast, uterus, and fetus were weighed in 100 mL glass beaker. To each was added 10 mL of nitric acid and 2 mL of per chloric acid and digestion were carried out at 240 °C for one hour. The temperature was raised to 280 °C until the samples dried out. After cool down to room temperature, double distilled water was added to a final volume of 25 mL. These were used to analyze Cd ion concentrations by ICP-MS.

2.3. Histopathological Examination

The livers and placentas were carefully isolated from P0 generation in GD 18 and submerged in 10% formalin solution immediately after harvest. These tissues were sliced to 5 μm thickness and these slices were mounted on glass slides. Histological images were taken using a Nikon Ti optical microscope (Tokyo, Japan) after hematoxylin-eosin (HE) staining.

2.4. Hematological Analysis and Serum Biomarkers Assay

Blood in P0 (GD18 and PND 5) and F1 (PND 60) was collected to make hematological analysis and serum biomarkers assay. Mean corpuscular hemoglobin (MCH), hemoglobin (HGB), platelets (PLT), mean corpuscular hemoglobin concentration (MCHC), red blood cells (RBC), white blood cells (WBC), hematocrit (HCT), and mean corpuscular volume (MCV) were determined. Serum biomarkers such as albumin (ALB), aspartate aminotransferase (AST), total protein (TP), globulin (GLB), and total bilirubin levels (TBIL); the ratio of albumin to globulin (A/G), and alkaline phosphatase (ALP), and alanine aminotransferase (ALT); and the ratio of aspartate aminotransferase to aspartate aminotransferase (AST:ALT ration), Creatinine (Cr), and uric acid (UA) were verified. These indicators were examined at Adicon clinical laboratories, Nanchang, China.

2.5. RT-qPCR Analysis

AxyPrep Multisource Total RNA Miniprep Kit (Axygen Scientific, Union City, CA, USA) was used to isolate the total RNA from the placenta of the P0 and F1 generations according to the manufacturer’s protocol. cDNA was synthesized with Takara PrimeScriptTM RT reagent kit (Cat#RR047A, Lot#AK2802) using 1 μg total RNA following measurements of total RNA concentration using software Quantity One, (PDI Inc., New York, New York). The qPCR primers were synthesized by Xiangyin Biotechnology China (Hangzhou China) (Table S1). Quantitative PCR (qPCR) was performed using SYBR® Premix Ex TaqTM II (TakaRa Code: DRR820A) following standard protocol with 7900HT Fast real-time System (Applied Biosystems, Foster City, CA, USA). Thermal cycling program involved 1 cycle at 95 °C for 1 min, followed by 40 cycles of 95 °C for 5 s, and then 60 °C for 1 min. GAPDH was used as the reference gene. Relative gene expression levels were determined by the critical threshold (Ct) number and calculated using the 2−ΔΔCt method.

2.6. Statistical Analysis

All the values in this study were expressed as mean ± standard deviation and one-way analysis of variance (ANOVA) by L.S.D (SPSS v22.0, SPSS, Inc., Chicago, IL, USA) was used for comparison of results among different groups.

3. Results

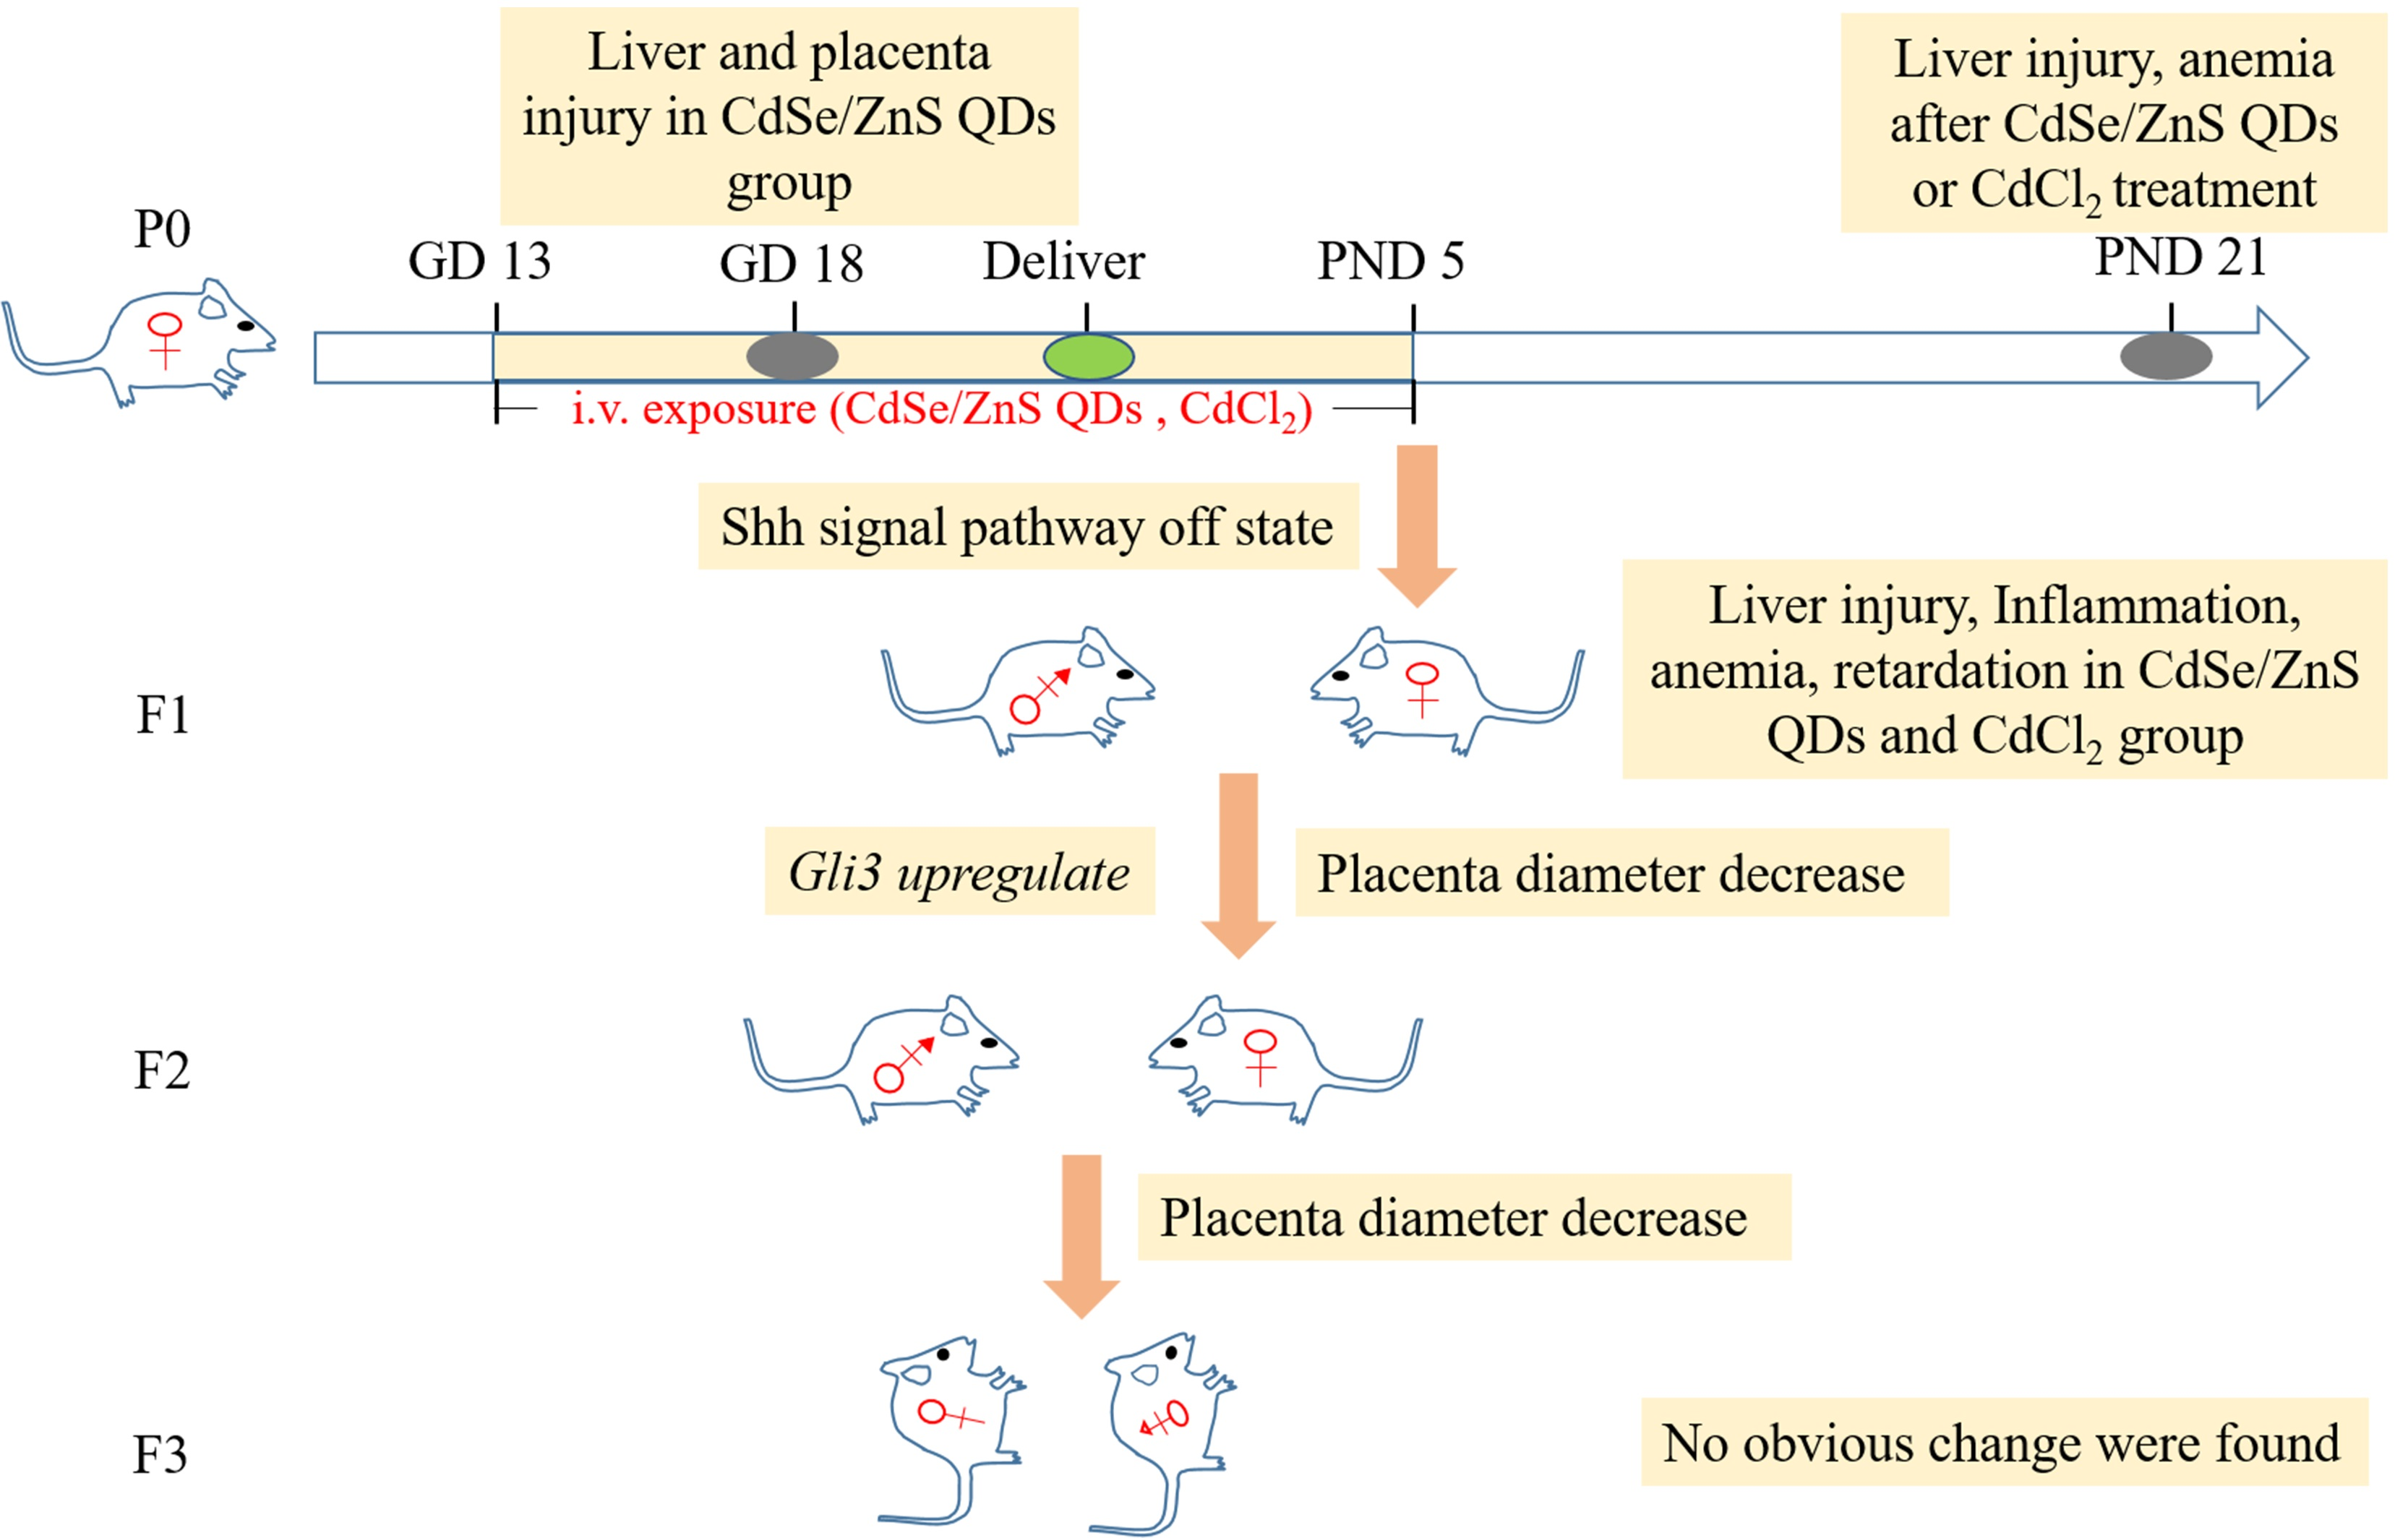
3.1. Characterization of CdSe/ZnS QDs

The CdSe/ZnS QDs used in this research showed emission peak around 530–550 nm and absorbance peak around 520–540 nm (Figure 1A,B). Dynamic light scattering (DLS) (Figure 1C) analysis indicated that the particles were well resolved in water with an approximate hydrodynamic diameter of 20 nm, which was slighter large than the corresponding size (13 nm) determined by TEM.

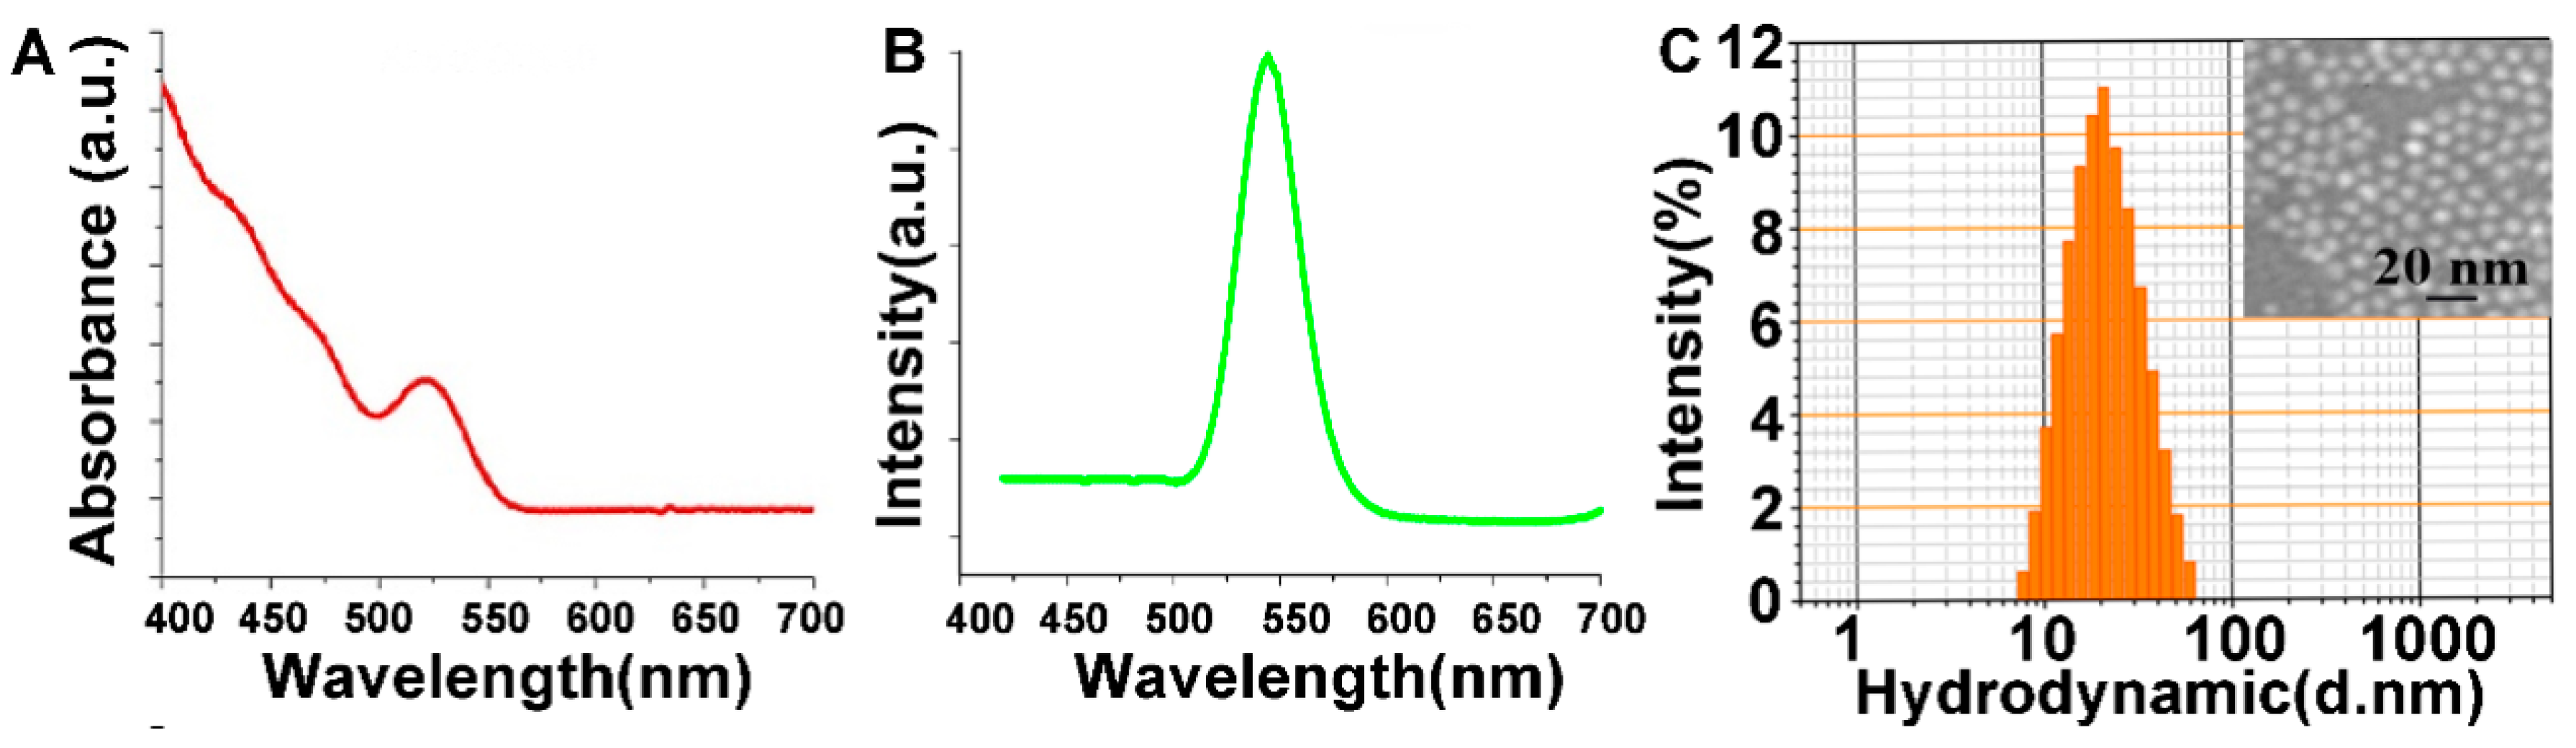
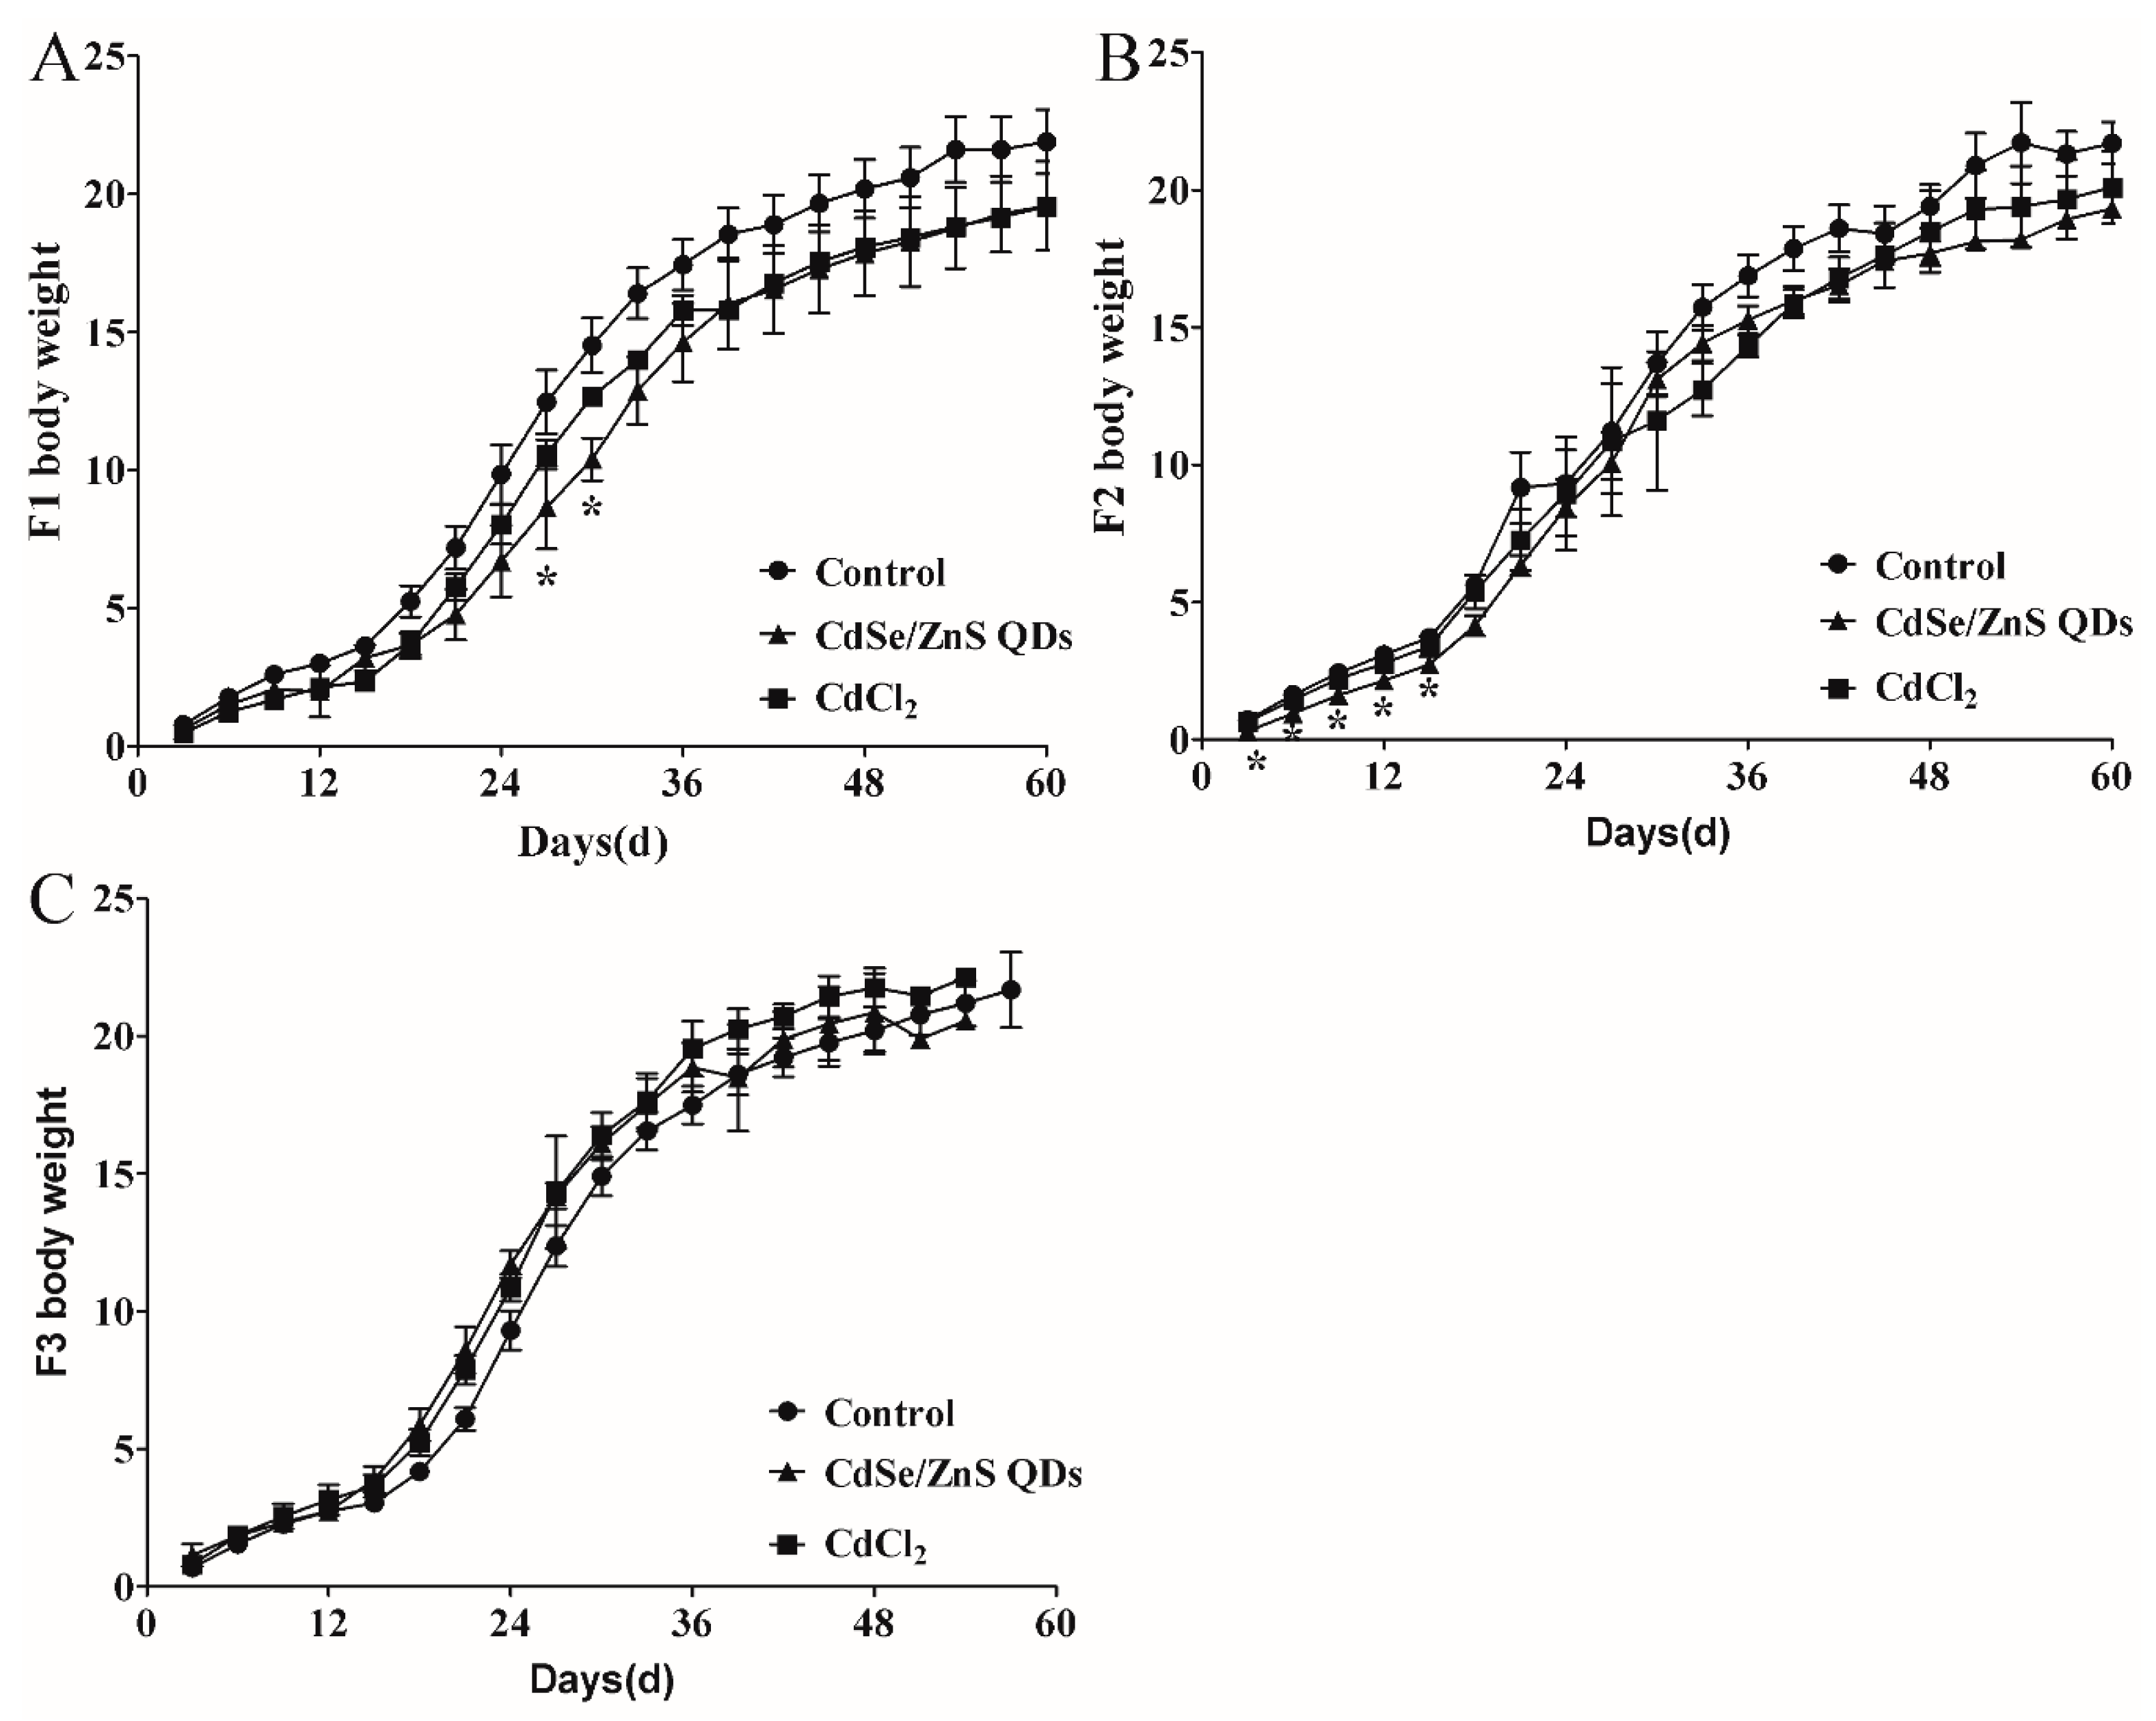
3.2. Body Weight Changes of Pregnant Mice

In this study, reduction in weight gain were found in P0 pregnant mice after CdSe/ZnS QDs and CdCl2 treatment; however, those decreases were not significant (Figure 2A). Furthermore, body weights of F1 and F2 during pregnancy in treatment groups did not exhibit significant changes compared with the control group (Figure 2B,C).

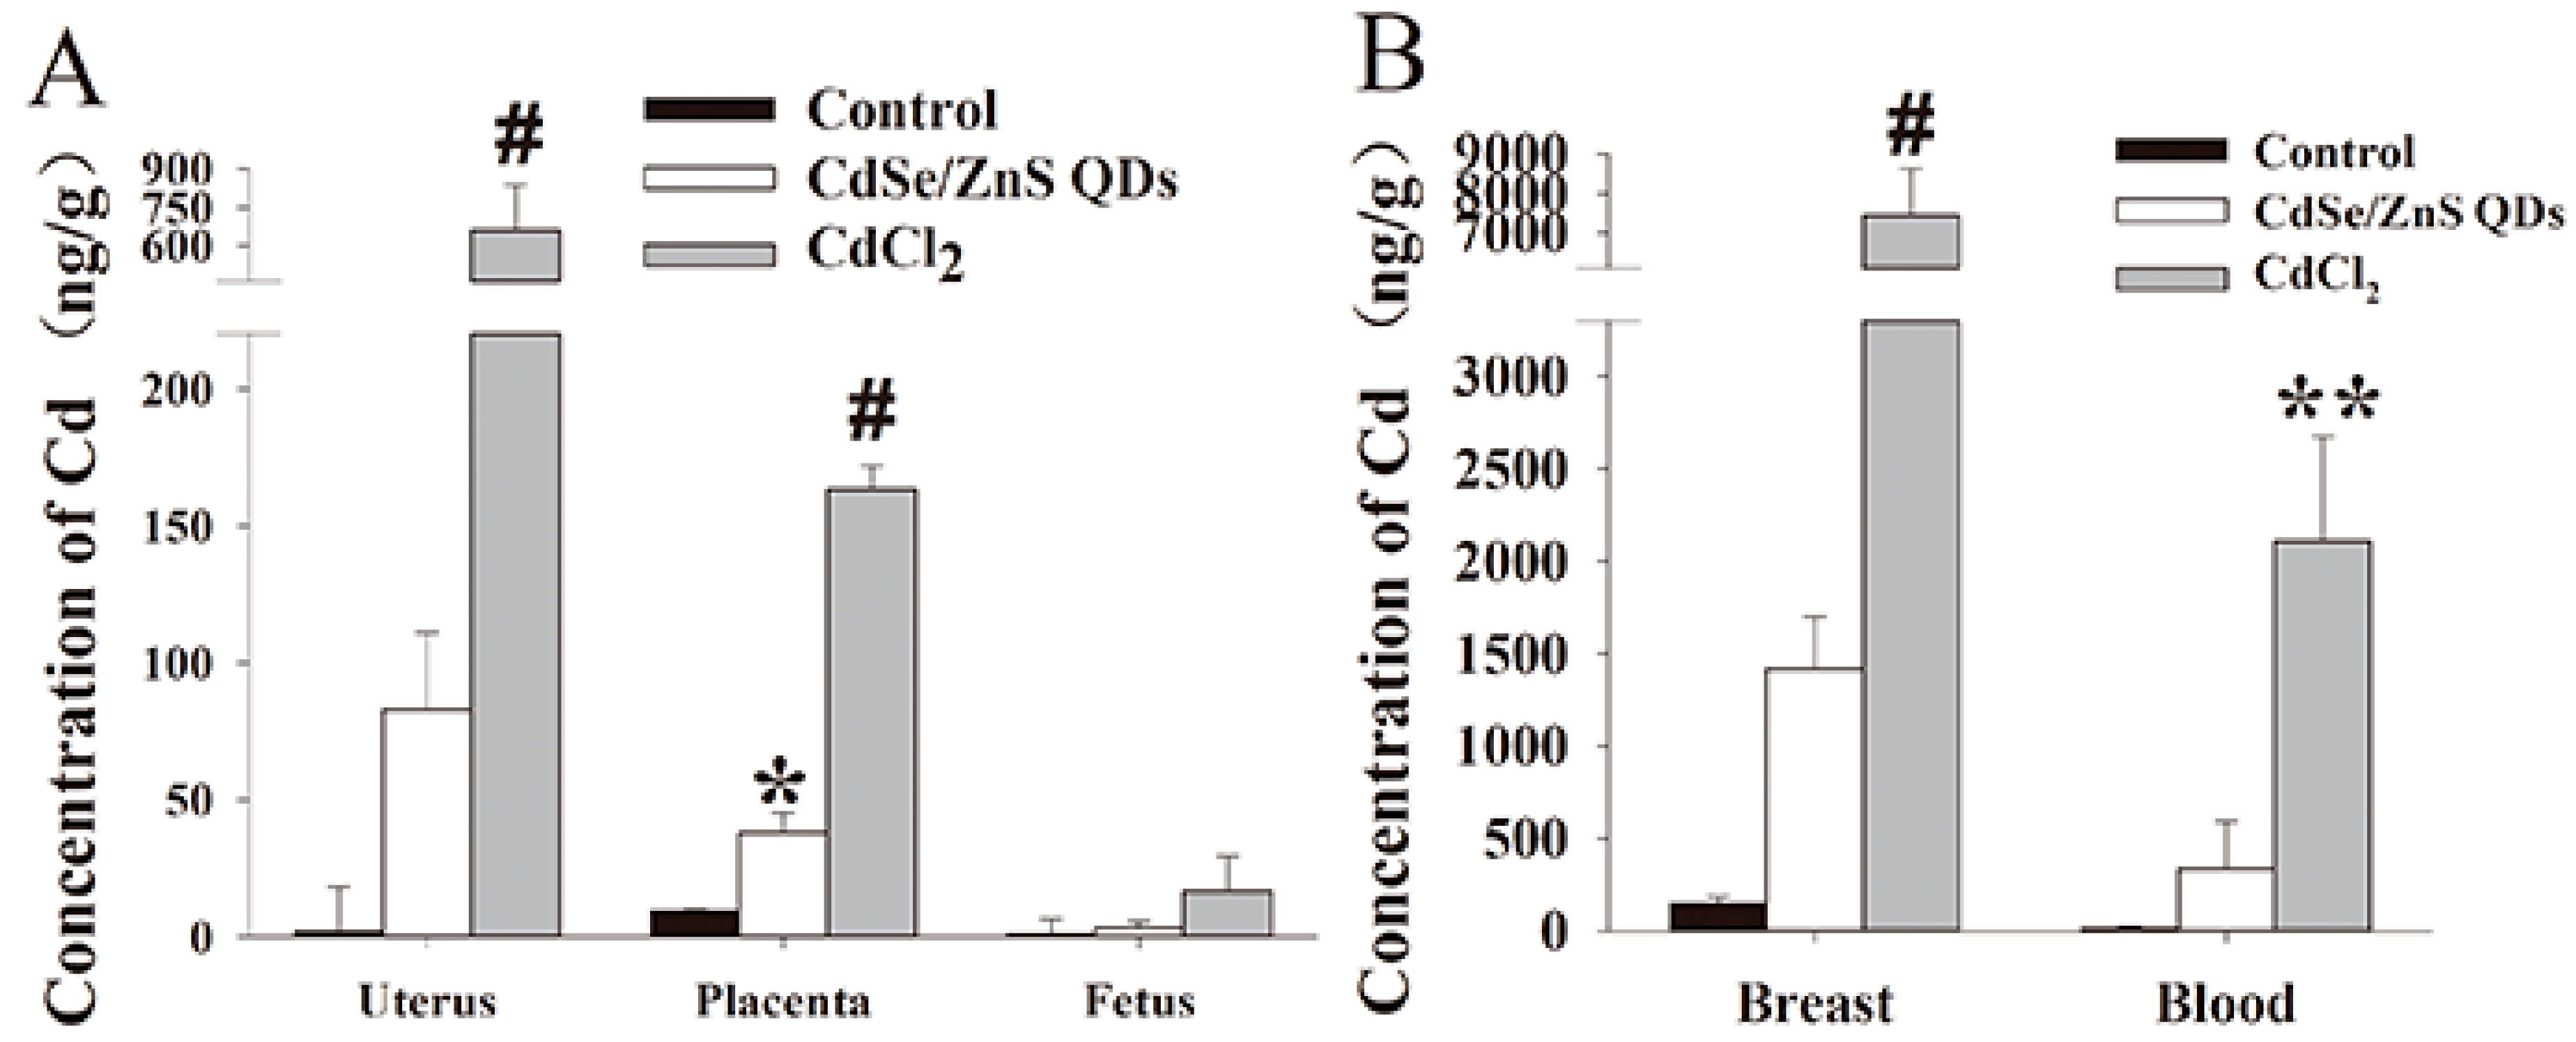
3.3. Cd Contents Analysis in Parental Mice (P0)

In GD 18 (P0), significant elevations of Cd concentrations in placenta were observed in CdSe/ZnS QDs group. (Figure 3) Meanwhile, both uterus and placenta showed obvious amounts of Cd in the CdCl2 group. In PND 21 (P0), Cd concentration in breast and blood belonging to the CdCl2 group showed an obvious increase compared with the control group.

3.4. Hematology and Serum Biochemistry

Before the birthing of P0 (GD 18), mice treated with CdSe/ZnS QDs showed a 3.7% (p < 0.05) decrease in MCV level and 49% (p < 0.05) decrease in PLT level compared with the control. In addition, the WBC increased by 24% (p < 0.05) in the CdCl2 treatment group (Table S2). At the end of the suckling period of P0 (PND 21), the levels of RBC and HCT in the mice treated with CdSe/ZnS QDs were statistically lower than the control group at 16% and 18% decrease, respectively. Moreover, the RBC count showed 16% decline, while the MCV level was raised by 8.08% (p < 0.05) in the CdCl2 treatment group (Table S3). At 60 days old, the F1 female mice in CdCl2 and CdSe/ZnS QDs treatment groups showed reductions in MCH by 8.4% and 10.5%, respectively. Meanwhile, the WBC was significantly decreased by 35% in the CdCl2 treatment group (Table S4).
In GD18 (P0), significant increase of AST:ALT ratio (154%, p < 0.05) was found in the CdCl2 treatment group (Figure S1A). At the end of the suckling period of P0 (PND 21), ALT, AST, and GLB in mice treated with CdCl2 showed 48% (p < 0.01), 45% (p < 0.05), and 15.8% (p < 0.05) reduction, respectively, compared with the control group (Figure S1B). The ALB levels in CdCl2 and CdSe/ZnS QDs treatment groups showed 13.9% (p < 0.01) and 7.5% (p < 0.05) decline, respectively (Figure S1B). The Cr levels in mice treated with CdSe/ZnS QDs were statistically lower than the control group with a percent of 26.8% (p < 0.05). The TP levels showed 10.4% (p < 0.05) and 12% (p < 0.01) decrease, respectively in mice treated with CdCl2 and CdSe/ZnS QDs. At 60 days of age of F1 female mice, the TP and UA levels significantly decreased by 15% (p < 0.05) and 17.9% (p < 0.05), respectively, while AST level and AST:ALT ratio significantly increased 90% (p < 0.05) and 316% (p < 0.01) in the CdSe/ZnS QDs treatment group compared with the control group (Figure 4). Besides, TBIL, AST, ALT, ALT/AST, and the ALP were significantly increased by 14% (p < 0.05), 55% (p < 0.01), 69.6% (p < 0.01), and 25.4% (p < 0.05) in the CdCl2 treatment group compared with the control group (Figure 4). Furthermore, the AST:ALT ratio in the CdSe/ZnS QDs treatment group and AST, AST:ALT ratio in CdCl2 treatment group exhibited a highly significant increase compared with the control group (Figure 4).

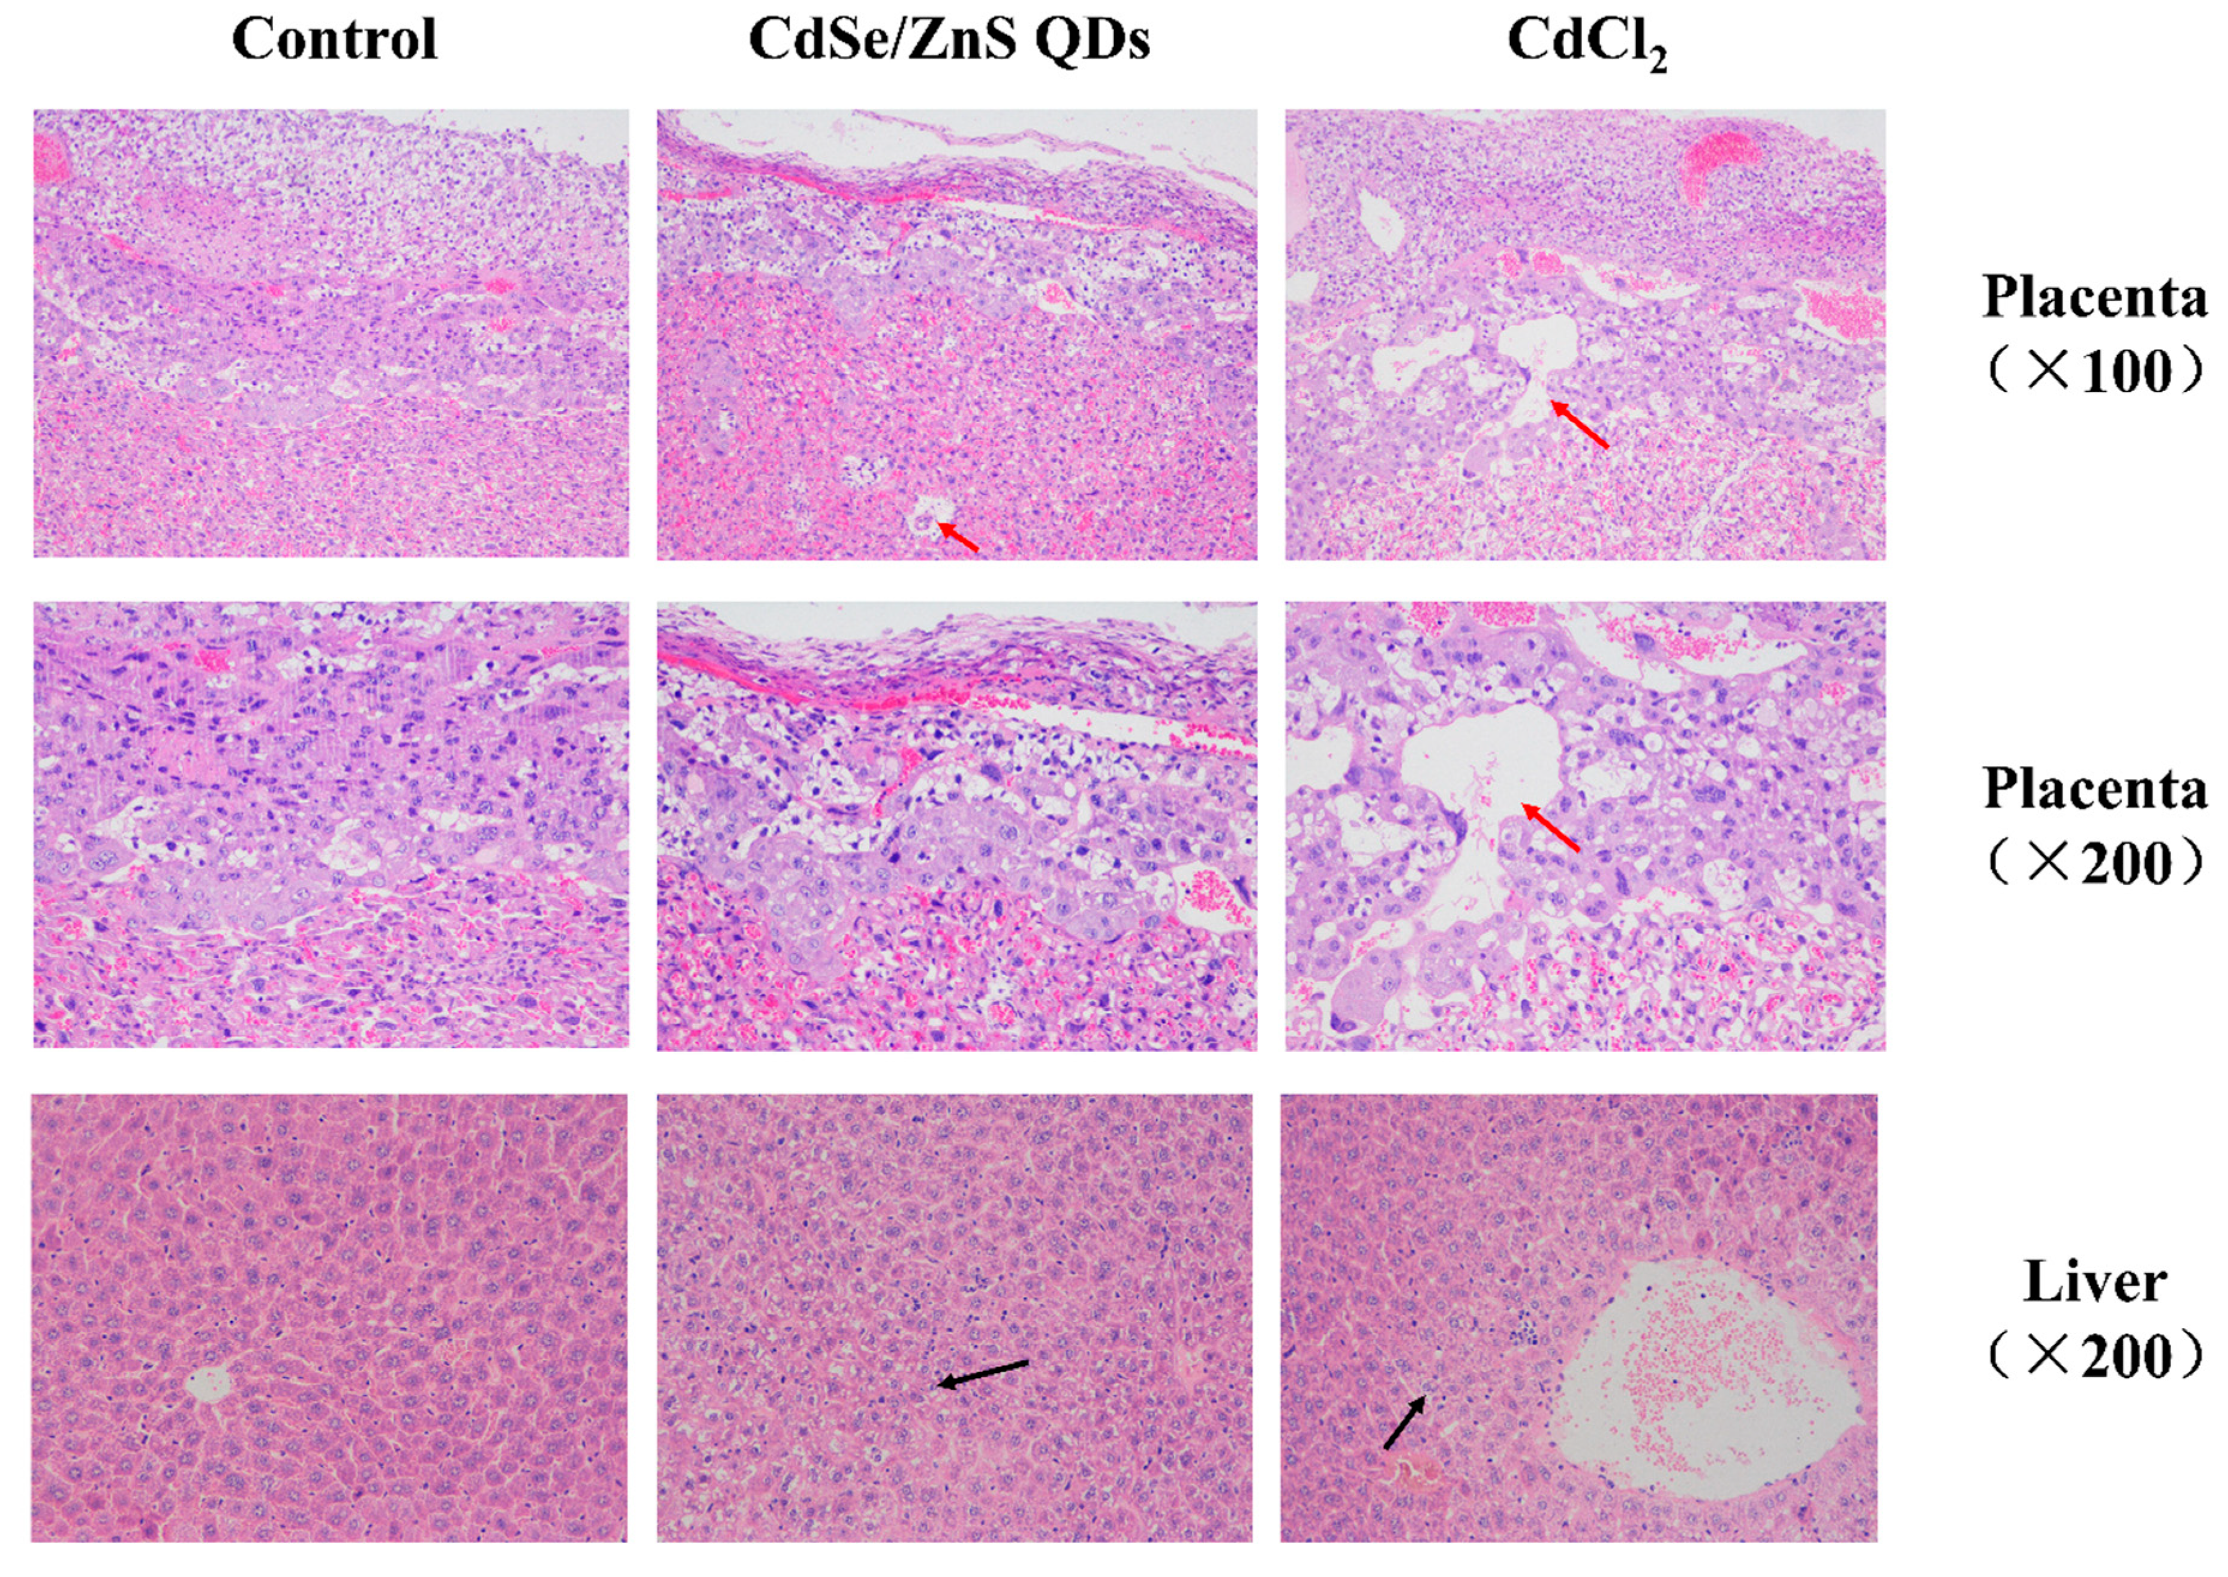
3.5. Histopathological Examination

Histopathological changes in the liver and placenta of mice are shown in Figure 5. After CdSe/ZnS QDs or CdCl2 treatment, hepatocytes appeared swollen and vacuoles occurred in cytoplasm (Figure 5). Meanwhile, necrotic hepatocytes could be found in the CdCl2 group.
The histopathological changes in the placenta showed large vacuoles in the junction zone of the placenta of the CdSe/ZnS QDs and CdCl2 treatment groups (Figure 5). Sharp decline of blood cells was observed in the labyrinth zone. Meanwhile, some deformed trophoblast giant cells were found in the CdCl2 treatment group.

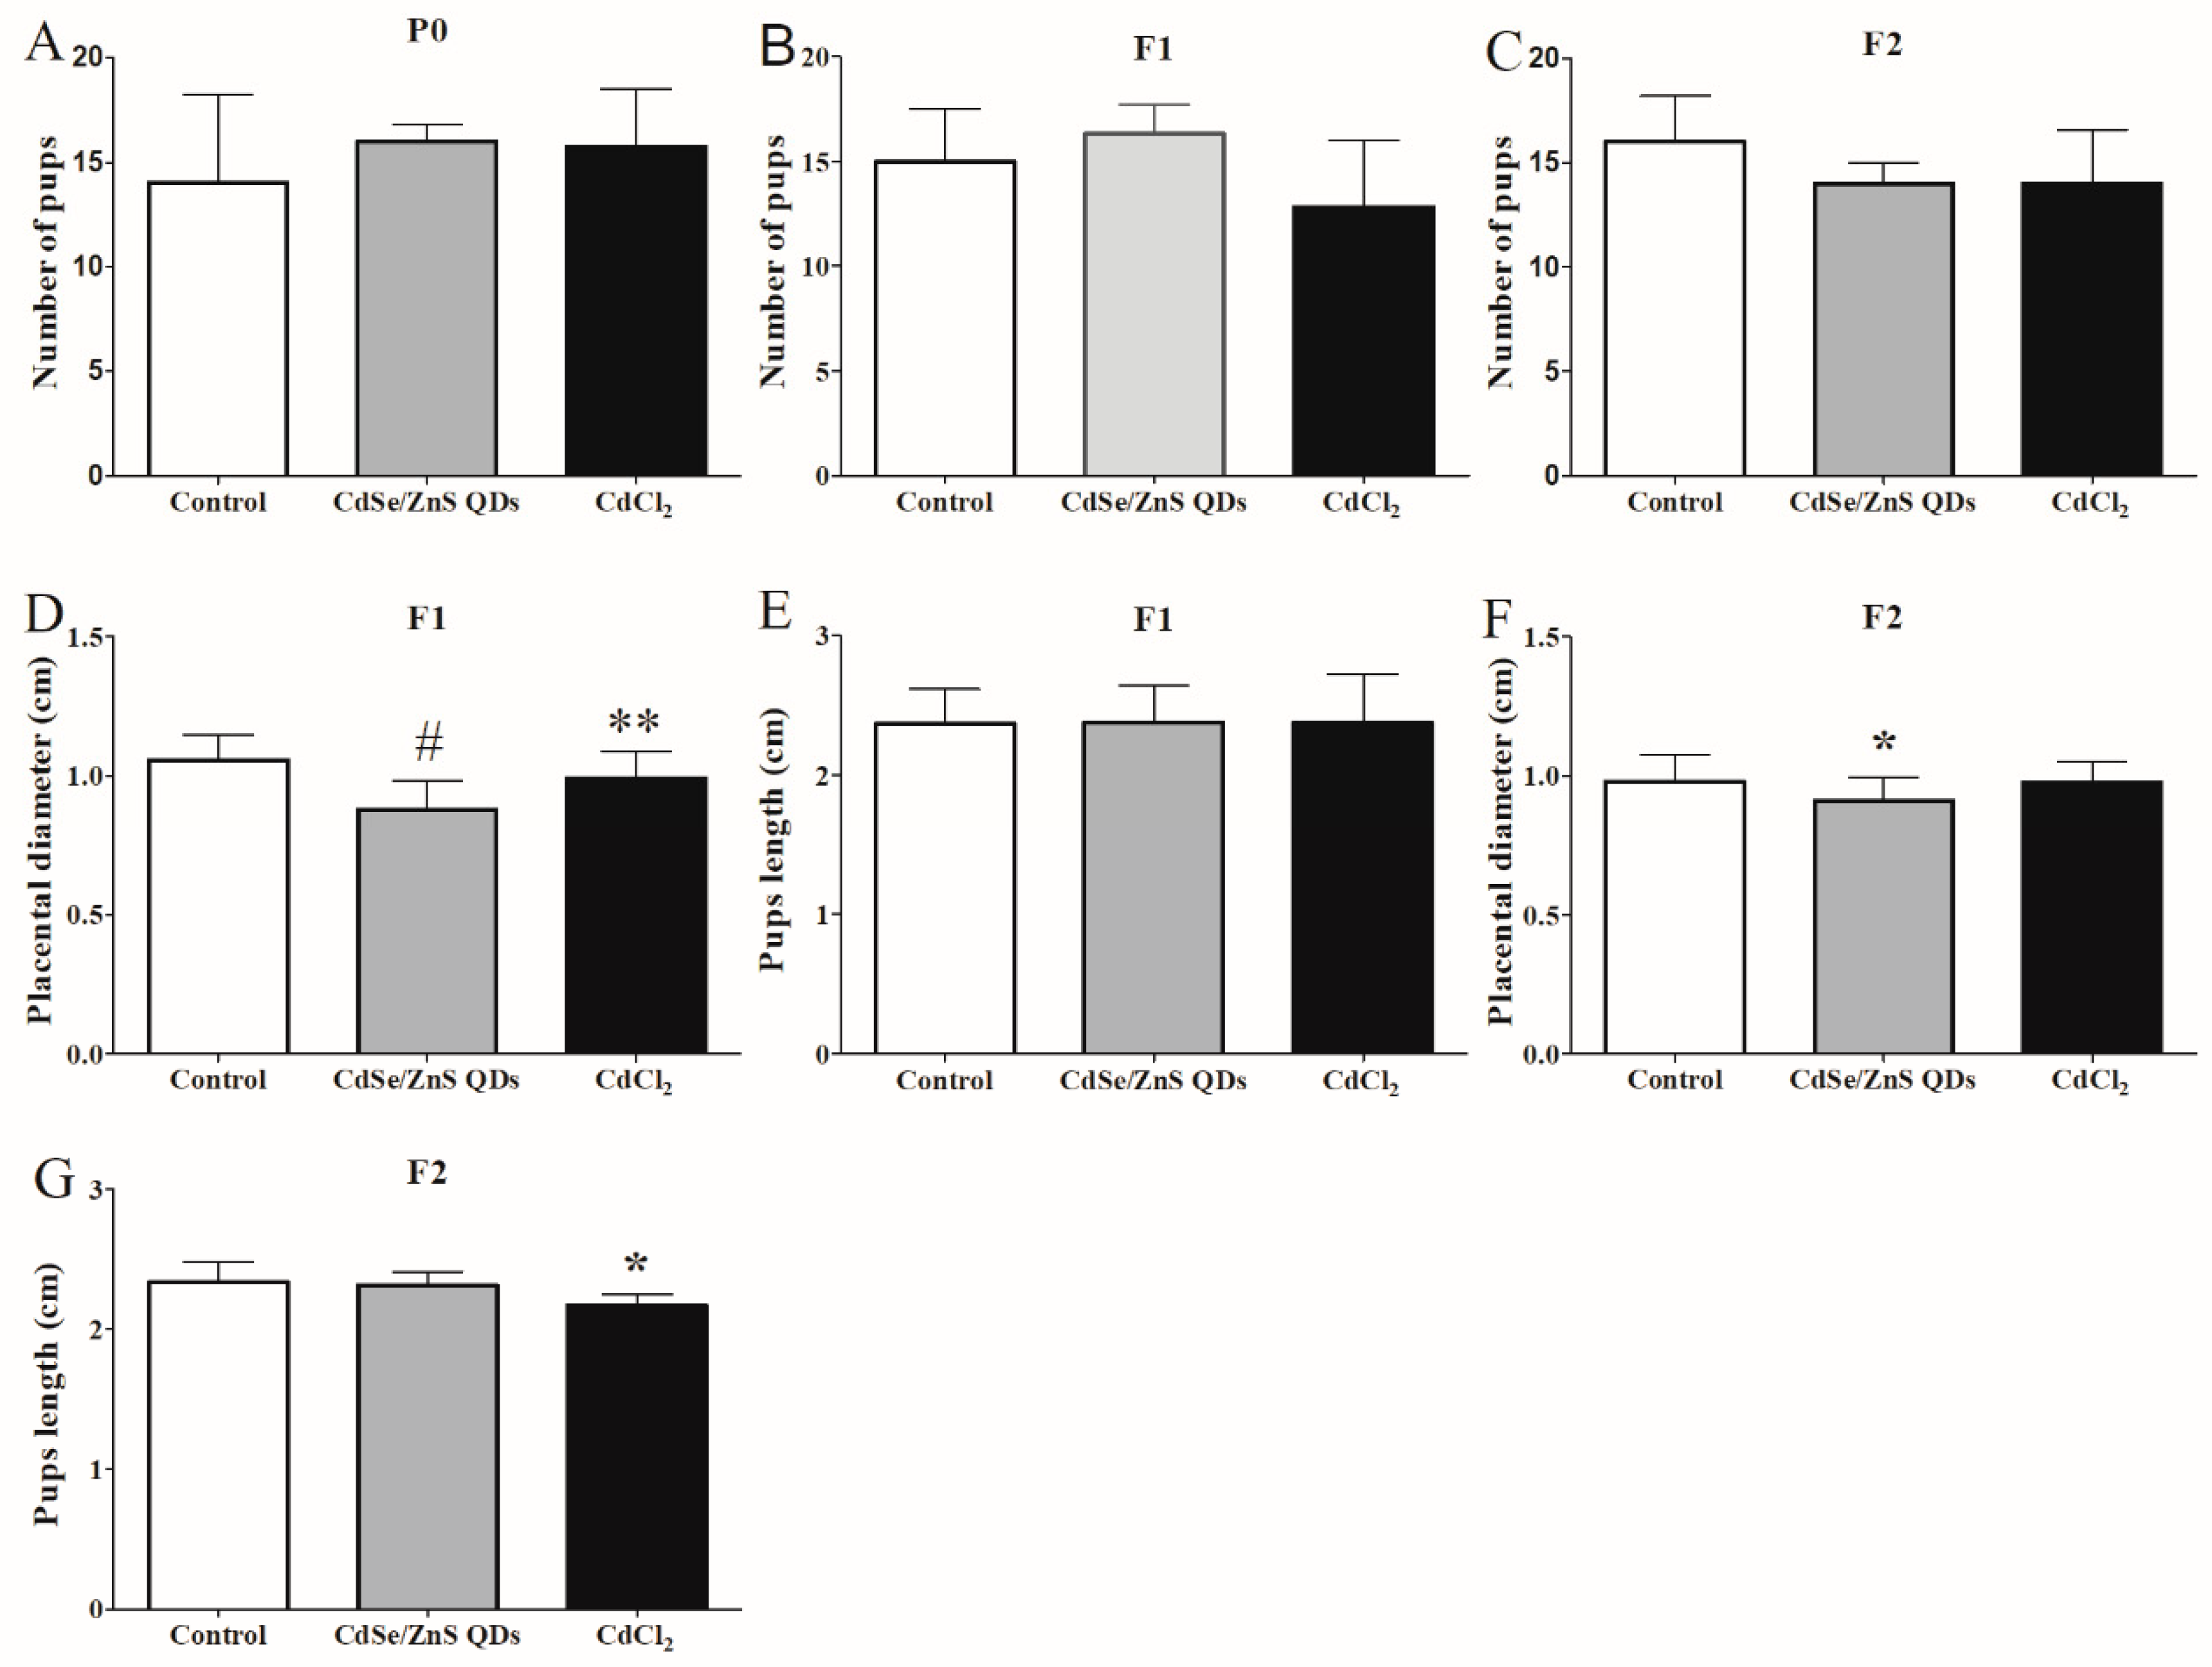
3.6. Offspring Development

There were no significant differences in the numbers of average litter between the treatment groups and control group of all the generations (Figure 6A–C). On GD 18, the fetal average body length in F1 did not show significant differences among all of the groups (Figure 6E). In addition, the average fetal body length in the CdCl2 treatment group of F2 was 2.17 cm at GD 18, which was significantly smaller than the control group (Figure 6G). The average diameter of the placenta in the CdSe/ZnS treatment group of F1 was 0.88 cm, which was 16.19% shorter than (1.05 cm) the control group (Figure 6D). The placental average diameter of F2 in CdSe/ZnS treatment group was 0.91 cm, which was also smaller than that of the control group (Figure 6F). The CdSe/ZnS and CdCl2 treatment groups (Figure 7A–C) exhibited a decrease in body weight among the P0’s, F1’s offspring F1, F2, respectively.

3.7. RT-qPCR Analysis

To study the mechanism of CdSe/ZnS QDs induced placenta injury and dysfunction, the genes associated with fetus development (Ptch1, Smo, Gli1, Gli2, Gli3), apoptosis (Bcl-2, and Caspase3), and oxidative stress (HO-1, Gclc) were chosen for RT-qPCR assay. The results of these studies were enumerated.
In the P0 CdSe/ZnS QDs treatment group, Ptch1, Smo, HO-1, and Gclc were significantly upregulated in the placenta (Figure 8A). Gli1 and Gli2 in the placenta of P0 after CdSe/ZnS QDs treatment showed around a two-fold significant downregulation, respectively, while Gli3 showed upregulation but it was not significant. No obvious change of these genes were found in the F1 CdSe/ZnS QDs treatment group.

4. Discussion

Due to the rapid growth and applications of nanotechnology, the likelihood of nanomaterials exposure to pregnant people could substantially increase. Nanoparticles may induce offspring injury in the following ways: (1) Pass through the placenta–fetus or blood–breast barrier and directly induce fetal injury [10]; (2) induce placenta or uterus injury and indirectly cause fetus injury [12,13]; or (3) induce maternal inflammation to induce fetal injury [14]. In this study, we evaluated the transgenerational effects and mechanism of action of CdSe/ZnS QDs toxicity in murine animals.

4.1. QDs Induced Maternal Injury

Hematology and serum biochemical indicators have been used to evaluate the alteration of physiological state of mice. WBC and PLT are responses of animals that may indicate system inflammation. A decrease in PLT could indicate inflammatory dysfunction in mice after CdSe/ZnS QDs treatment in GD 18. RBC, MCV, and HCT indices were also used to indicate possible anemia response. In this study, HCT and RBC levels showed significant decrease in PND 21 in the CdSe/ZnS QDs treatment, which implied that CdSe/ZnS QDs treatment induced anemia. These observations were consistent with previous research [12]. The Cr and TP, which may be used as indices of renal function, in the CdSe/ZnS QDs treatment group, suggesting possible kidney injury after treatment (Figure 4B).
Histopathological examinations in the liver of CdSe/ZnS QDs and CdCl2 treatment groups exhibited swollen hepatocytes and vacuoles appears in cytoplasm, suggesting liver damage occurred (Figure 5). Large vacuoles were found in P0 CdSe/ZnS QDs and CdCl2 treatment groups’ placenta at the junction zone, which indicated that the CdSe/ZnS QDs affected the placental structure, which was similar to a previous study [15]. A sharp decrease in blood cells in the labyrinth zone and deformed trophoblast giant cells in the CdCl2 treatment groups were found. This implied that CdCl2 treatment may have disturbed the gas exchange and nutrient transportation function of the placenta in accordance with a previous study [15].

4.2. QDs Accumulate in the Placenta but Do Not Pass to the Next Generation

The dosage of QDs used in this experiment may have been insufficient to allow bigger quantity of Cd to cross through the placenta, as seen from the low quantity of Cd deposited in the fetus with a relative high concentration of Cd in the placenta of GD18. Meanwhile, QDs could accumulatively deposit in the placenta. Elevated Cd concentration in breast and blood was exhibited in treatment groups at PND 21 (P0) compared with the control (not significant). The concentration of Cd was higher in the breast than in the blood, reflecting the translocation and deposition of Cd in the breast. However, no obvious Cd concentration elevation in the stomach of PND 21 mice (F1) was found (data not shown).

4.3. QDs Impaired the First Two Generations of Placenta Growth and Induced Offspring Injury

The offspring reproductive ability was evaluated by the number of weaned pups per litter. In this regard, no significant changes were found among all groups. Furthermore, there was no significant malformation of fetus found in the F1 and F2 generations. However, smaller placenta diameters were found in the CdSe/ZnS QDs treatment and CdCl2 groups in the F1 and F2 generation. Compared with the control group in F1 and F2, the average body weight of the treatment groups also showed a slight decrease, which indicated that CdSe/ZnS QDs or CdCl2 treatment might have caused offspring retardation in accordance with previous studies [9,13,16].
To explore the physiological and pathological status of the offspring, we performed hematological tests in the F1 generation. WBC count decreased in mice treated with CdCl2, which may reflect weakening of the immune system after heavy metal ion exposure [17]. The MCV was also decreased in the CdCl2 treatment group and MCH decreased in either the CdSe/ZnS QDs or CdCl2 treatment groups compared with the control group. In summary, the CdCl2 treatment caused more significant MCV and MCH level decrease than the CdSe/ZnS QDs treatment group. The significant decrease in MCV and MCH in mice exposed to CdSe/ZnS QDs and CdCl2 suggested the possibility of anemia in the F1 generation. Biochemical evaluation in F1 was carried out for AST:ALT ratio, ALP, and TBIL, which were used as reliable markers of liver inflammation [18]. In the F1 generation, AST level and AST:ALT ratio significantly increased in the CdSe/ZnS QDs treatment group, which indicated that there was serious liver damage induced by CdSe/ZnS QDs.

4.4. QD May Cause Toxicity through Shh Signal Pathway

The possible toxicity mechanism for the CdSe/ZnS QDs was examined through induction of offspring development retardation, transcriptional levels of genes related to development, apoptosis, and oxidative stress in the placenta. The Shh signal pathway has been known to play an important part in mammal pup’s development [19,20]. Ptch1, Smo, Gli1, Gli2, Gli3 are the key genes in the Shh signal pathway and were chosen to reflect the status of the Shh pathway after treatment. Ptch1 is a transmembrane protein that acts as a receptor for sonic hedgehog (Shh). In this research, ptch1 showed upregulation, which implied that the shh signal pathway was in the off state. The Smo then transferred the signal into the cell and finally activated the Gli1 and Gli2, which acted as transcription activator. Although Smo was also upregulated, previous studies indicated that Ptch1 could efficiently inhibit Smo, and one Ptch1 molecule can inhibit 50 Smo molecules [21]. In the off state, Ptch1 bound with Smo, which inhibited Smo molecules causing the inactivation of the Gli1 and Gli2 [22]. When Gli1 and Gli2 are active, some downstream genes could be activated along with transcription, such as Wnt and MAPK, which are important in fetus development [23,24]. Gli3 acts as a negative transcription regulator in the Shh signal pathway “off” state, which could be a repressor form (GliR) that blocks transcription of downstream genes [25] (Figure 8A). Gli2 and Gli3 are required for the proper development of placenta with the Shh signal pathway [26]. In this study, the expression reduction of Gli1 and Gli2 were found in P0 after CdSe/ZnS QDs treatment, which indicated that those nanoparticles might have enhanced the shutting off the Shh signal pathway, which restricted placenta development.
Many reports have indicated that nanoparticle toxicity was caused by ROS and apoptosis [27,28]. Caspase-3 is an important executor of cell apoptosis and apoptosis was thought to be followed with Caspase-3 expression [29]. It also reported that a member of the Bcl-2 family is important in regulating the process of cell death [30]. In this study, upregulation of Caspase3 and Bcl-2 were found in P0 but not significant. These implied that the CdSe/ZnS QDs treatments may not induce apoptosis in the placenta of P0. HO-1 and GCLC are related to oxidative stress [31,32]. HO-1 is a stress protein that is produced during oxidative challenges. Heme oxygenase mediates the first step of heme catabolism by cleaving the heme to form biliverdin that is transformed into bilirubin. Biliverdin has been shown to protect linoleic acid from oxidation [33]. On the other hand, GCLC is the first rate-limiting enzyme in GSH synthesis, which is an important organ antioxidant [34]. GSH can decrease ROS concentration that ultimately reduces the damage caused by ROS [35]. In this study, HO-1 and GCLC were upregulated in P0 placenta, which indicated ROS stress in the F0 placenta.

5. Conclusions

In this study, the maternal effect and three-generational development conditions after exposure to CdSe/ZnS QDs in perinatal stage have been studied. The results showed that exposure to CdCl2 and CdSe/ZnS QDs induced high accumulation of Cd in blood, breast, uterus, and placenta in the P0 generation. This accumulation of QDs induced maternal injury. Smaller placenta size and lower body weight growth rate in the first two generations and offspring (F1) injury were found after QDs exposure. The RT-qPCR results indicated that the toxic effects of CdSe/ZnS QDs might be through the shh signal pathway, and ROS stress may also be involved. Further studies are recommended to confirm the results obtained in this study to elucidate the QD mechanism of toxicity.

Supplementary Materials

The following are available online at https://www.mdpi.com/2079-4991/9/2/257/s1, Figure S1: Serum biochemical analysis mice sacrificed at P0 GD 18 (A), PND 21 (B); Table S1: RT-qPCR primer pairs; Table S2: Whole blood analysis from P0 female mice treated with normal saline, CdSe/ZnS QDs, and CdCl2 in GD 18 stage; Table S3: Whole blood analysis from female mice treated with normal saline, CdSe/ZnS QDs, and CdCl2 in PND 21; Table S4: Whole blood analysis from F1 female mice treated with normal saline, CdSe/ZnS QDs and CdCl2.

Author Contributions

W.H., H.K., X.H., and H.X. conceived and designed the experiments; W.H., H.K., X.H., P.Y., B.C., and L.Y. performed the experiments; Z.P.A. and H.X. analyzed the data; W.H. and H.X. wrote the paper.

Funding

This research was funded by the Natural Science Foundation of China (81771658, 81560537).

Acknowledgments

Thanks to Andrew Wang for providing the materials of the QDs.

Conflicts of Interest

The authors declare no conflicts of interest.

References

  1. Michalet, X.; Pinaud, F.F.; Bentolila, L.A.; Tsay, J.M.; Doose, S.; Li, J.J.; Sundaresan, G.; Wu, A.M.; Gambhir, S.S.; Weiss, S. Quantum dots for live cells, in vivo imaging, and diagnostics. Science 2005, 307, 538–544. [Google Scholar] [CrossRef] [PubMed]
  2. Li, J.J.; Zhu, J.J. Quantum dots for fluorescent biosensing and bio-imaging applications. Analyst 2013, 138, 2506–2515. [Google Scholar] [CrossRef] [PubMed]
  3. Wegner, K.D.; Hildebrandt, N. Quantum dots: bright and versatile in vitro and in vivo fluorescence imaging biosensors. Chem. Soc. Rev. 2015, 44, 4792–4834. [Google Scholar] [CrossRef] [PubMed] [Green Version]
  4. Bilan, R.; Fleury, F.; Nabiev, I.; Sukhanova, A. Quantum dot surface chemistry and functionalization for cell targeting and imaging. Bioconjugate Chem. 2015, 26, 609–624. [Google Scholar] [CrossRef] [PubMed]
  5. Tang, Y.; Han, S.L.; Liu, H.M.; Chen, X.; Huang, L.; Li, X.H.; Zhang, J.X. The role of surface chemistry in determining in vivo biodistribution and toxicity of CdSe/ZnS core-shell quantum dots. Biomaterials 2013, 34, 8741–8755. [Google Scholar] [CrossRef] [PubMed]
  6. Dubertret, B.; Skourides, P.; Norris, D.J.; Noireaux, V.; Brivanlou, A.H.; Libchaber, A. In vivo imaging of quantum dots encapsulated in phospholipid micelles. Science 2002, 298, 1759–1762. [Google Scholar] [CrossRef] [PubMed]
  7. Zheng, W.; Xu, Y.M.; Wu, D.D.; Yao, Y.; Liang, Z.L.; Tan, H.W.; Lau, A.T. Acute and chronic cadmium telluride quantum dots-exposed human bronchial epithelial cells: The effects of particle sizes on their cytotoxicity and carcinogenicity. Biochem. Bioph. Res. Co. 2018, 495, 899–903. [Google Scholar] [CrossRef] [PubMed]
  8. Oh, E.; Liu, R.; Nel, A.; Gemill, K.B.; Bilal, M.; Cohen, Y.; Medintz, I.L. Meta-analysis of cellular toxicity for cadmium-containing quantum dots. Nat. Nanotechnol. 2016, 11, 479–486. [Google Scholar] [CrossRef]
  9. Zhang, W.Y.; Yang, L.; Kuang, H.J.; Yang, P.F.; Aguilar, Z.P.; Wang, A.; Fu, F.; Xu, H.Y. Acute toxicity of quantum dots on late pregnancy mice: Effects of nanoscale size and surface coating. J. Hazard. Mater. 2016, 318, 61–69. [Google Scholar] [CrossRef]
  10. Chu, M.Q.; Wu, Q.W.; Yang, H.; Yuan, R.Q.; Hou, S.K.; Yang, Y.F.; Zou, Y.J.; Xu, S.; Xu, K.Y.; Ji, A.L.; et al. Transfer of quantum dots from pregnant mice to pups across the placental barrier. Small 2010, 6, 670–678. [Google Scholar] [CrossRef]
  11. Liu, J.W.; Yang, C.B.; Liu, J.; Hu, R.; Hu, Y.Z.; Chen, H.Y.; Law, W.C.; Swihart, M.T.; Ye, L.; Wang, K.; et al. Effects of cd-based quantum dot exposure on the reproduction and offspring of kunming mice over multiple generations. Nanotheranostics 2017, 1, 23–37. [Google Scholar] [CrossRef]
  12. Ma, J.; Li, R.B.; Liu, Y.; Qu, G.B.; Liu, J.; Guo, W.L.; Song, H.Y.; Li, X.H.; Liu, Y.J.; Xia, T.; et al. Carbon nanotubes disrupt iron homeostasis and induce anemia of inflammation through inflammatory pathway as a secondary effect distant to their portal-of-entry. Small 2017, 13, 1603830. [Google Scholar] [CrossRef] [PubMed]
  13. Zalgeviciene, V.; Kulvietis, V.; Bulotiene, D.; Zurauskas, E.; Laurinaviciene, A.; Skripka, A.; Rotomskis, R. Quantum dots mediated embryotoxicity via placental damage. Reprod. Toxicol. 2017, 73, 222–231. [Google Scholar] [CrossRef] [PubMed]
  14. Hawkins, S.J.; Crompton, L.A.; Sood, A.; Saunders, M.; Boyle, N.T.; Buckley, A.; Minogue, A.M.; Mccomish, S.F.; Jiménezmoreno, N.; Corderollana, O. Nanoparticle-induced neuronal toxicity across placental barriers is mediated by autophagy and dependent on astrocytes. Nat. Nanotechnol. 2018, 13, 427–433. [Google Scholar] [CrossRef]
  15. Zhang, G.B.; Wang, H.; Hu, J.; Guo, M.Y.; Wang, Y.; Zhou, Y.; Yu, Z.; Fu, L.; Chen, Y.H.; Xu, D.X. Cadmium-induced neural tube defects and fetal growth restriction: Association with disturbance of placental folate transport. Toxicol. Appl. Pharm. 2016, 306, 79–85. [Google Scholar] [CrossRef] [PubMed]
  16. Barański, B. Behavioral alterations in offspring of female rats repeatedly exposed to cadmium oxide by inhalation. Toxicol. Lett. 1984, 22, 53–61. [Google Scholar] [CrossRef]
  17. Adeyemo, O.K. Haematological profile of Clarias gariepinus (Burchell, 1822) exposed to lead. Turk. J. Fish Aquat. Sci. 2007, 1, 163–169. [Google Scholar]
  18. Giannini, E.; Botta, F.; Fasoli, A.; Ceppa, P.; Risso, D.; Lantieri, P.B.; Celle, G.; Testa, R. Progressive liver functional impairment is associated with an increase in AST/ALT ratio. Digest. Dis. Sci. 1999, 44, 1249–1253. [Google Scholar] [CrossRef]
  19. Pak, E.; Segal, R.A. Hedgehog Signal Transduction: Key Players, Oncogenic Drivers, and Cancer Therapy. Dev. Cell 2016, 38, 333–344. [Google Scholar] [CrossRef]
  20. Bellusci, S.; Furuta, Y.; Rush, M.G.; Henderson, R.; Winnier, G.; Hogan, B. Involvement of Sonic hedgehog (Shh) in mouse embryonic lung growth and morphogenesis. Development 1997, 124, 53–63. [Google Scholar]
  21. Chen, J.K.; Taipale, J.; Cooper, M.K.; Beachy, P.A. Inhibition of Hedgehog signaling by direct binding of cyclopamine to Smoothened. Genes Dev. 2002, 16, 2743–2748. [Google Scholar] [CrossRef] [PubMed] [Green Version]
  22. Kugler, M.C.; Joyner, A.L.; Loomis, C.A.; Munger, J.S. Sonic hedgehog signaling in the lung. From development to disease. Am. J. Resp. Cell Mol. 2015, 52, 1–13. [Google Scholar] [CrossRef] [PubMed]
  23. Rajat, R.; Ljiljana, M.; Scott, M.P. Patched1 regulates hedgehog signaling at the primary cilium. Science 2007, 317, 372–376. [Google Scholar]
  24. Mo, R.; Freer, A.M.; Zinyk, D.L.; Crackower, M.A.; Michaud, J.; Heng, H.H.; Chik, K.W.; Shi, X.M.; Tsui, L.C.; Cheng, S.H.; et al. Specific and redundant functions of Gli2 and Gli3 zinc finger genes in skeletal patterning and development. Development 1997, 124, 113–123. [Google Scholar] [PubMed]
  25. Park, H.L.; Bai, C.; Platt, K.A.; Matise, M.P.; Beeghly, A.; Hui, C.C.; Nakashima, M.; Joyner, A.L. Mouse Gli1 mutants are viable but have defects in SHH signaling in combination with a Gli2 mutation. Development 2000, 127, 1593–1605. [Google Scholar] [PubMed]
  26. Litingtung, Y.; Dahn, R.D.; Li, Y.; Fallon, J.F.; Chiang, C. Shh and Gli3 are dispensable for limb skeleton formation but regulate digit number and identity. Nature 2002, 418, 979–983. [Google Scholar] [CrossRef] [PubMed]
  27. Pan, Y.B.; Gong, Y.; Ruan, H.F.; Pan, L.Y.; Wu, X.K.; Tang, C.; Wang, C.J.; Zhu, H.B.; Zhang, Z.M.; Tang, L.F. Sonic hedgehog through Gli2 and Gli3 is required for the proper development of placental labyrinth. Cell Death Dis. 2015, 6, e1653. [Google Scholar] [CrossRef] [PubMed]
  28. Kalashnikova, I.; Mazar, J.; Neal, C.J.; Rosado, A.; Das, S.; Westmoreland, T.; Seal, S. Nanoparticle delivery of curcumin induces cellular hypoxia and ROS-mediated apoptosis via modulation of Bcl-2/Bax in human neuroblastoma. Nanoscale 2017, 9, 10375–10387. [Google Scholar] [CrossRef] [PubMed]
  29. Derfus, A.M.; Chan, W.C.; Bhatia, S.N. Probing the cytotoxicity of semiconductor quantum dots. Nano Lett. 2004, 4, 11–18. [Google Scholar] [CrossRef] [PubMed]
  30. Porter, A.G.; Jänicke, R.U. Emerging roles of caspase-3 in apoptosis. Cell Death Differ. 1999, 6, 99–104. [Google Scholar] [CrossRef] [PubMed] [Green Version]
  31. Czabotar, P.E.; Guillaume, L.; Andreas, S.; Adams, J.M. Control of apoptosis by the BCL-2 protein family: implications for physiology and therapy. Nat. Rev. Mol. Cell Biol. 2014, 15, 49–63. [Google Scholar] [CrossRef] [PubMed]
  32. Choi, A.M.; Alam, J. Heme oxygenase-1: function, regulation, and implication of a novel stress-inducible protein in oxidant-induced lung injury. Am. J. Resp. Cell Mol. 1996, 15, 9–19. [Google Scholar] [CrossRef] [PubMed]
  33. Yang, H.P.; Magilnick, N.; Lee, C.; Kalmaz, D.; Ou, X.P.; Chan, J.Y.; Lu, S.C. Nrf1 and Nrf2 regulate rat glutamate-cysteine ligase catalytic subunit transcription indirectly via NF-κB and AP-1. Mol. Cell. Biol. 2005, 25, 5933–5946. [Google Scholar] [CrossRef] [PubMed]
  34. Ayer, A.; Zarjou, A.; Agarwal, A.; Stocker, R. Heme oxygenases in cardiovascular health and disease. Physiol. Rev. 2016, 96, 1449–1508. [Google Scholar] [CrossRef] [PubMed]
  35. Korge, P.; Calmettes, G.; Weiss, J.N. Increased reactive oxygen species production during reductive stress: the roles of mitochondrial glutathione and thioredoxin reductases. Biochim. Biophys. Acta 2015, 1847, 514–525. [Google Scholar] [CrossRef] [PubMed]
Figure 1. Characterization of CdSe/ZnS quantum dots (QDs). (A) absorption; and (B) emission spectra of CdSe/ZnS QDs; (C) the diameter of CdSe/ZnS QDs determined by dynamic light scattering (DLS) and Transmission electron microscopy (TEM).
Nanomaterials 09 00257 g001
Figure 2. Average body weights of three generational pregnant mice. (AC) show changes in maternal body weight of P0, F1, F2, respectively; the body weight of pregnant mice were presented as a percentage of the weight while vaginal plug appeared (GD 0) (= 100%). These data are presented as the mean and SD, n = 6.
Nanomaterials 09 00257 g002
Figure 3. Accumulation of Cd in various organs from different stages of P0 mice. (A) uterus, placenta, and fetus in GD 18; (B) breast and blood in postnatal day 21 (PND 21). * p < 0.05, ** p < 0.01, # p < 0.001 vs. control. Values were the mean ± standard deviation, n = 5.
Nanomaterials 09 00257 g003
Figure 4. Serum biochemical analysis of F1 mice sacrificed at PND 60. * p < 0.05, ** p < 0.01 vs. control. albumin (ALB), aspartate aminotransferase (AST), total protein (TP), globulin (GLB), total bilirubin levels (TBIL), the ratio of albumin to globulin (A/G), alkaline phosphatase (ALP), alanine aminotransferase (ALT), the ratio of aspartate aminotransferase to aspartate aminotransferase (AST:ALT ration), Creatinine (Cr), uric acid (UA).
Nanomaterials 09 00257 g004
Figure 5. Histological images of the liver and placenta from GD18 P0 mice. Red arrows indicate the large vacuoles on placenta, black arrows indicate histopathological changes in the liver.
Nanomaterials 09 00257 g005
Figure 6. Reproductive ability and development status of mice in three generation after P0 exposure to QDs and CdCl2. (A) Number of pups in P0; (B) number of pups in F1; and (C) number of pups in F2. F1, F2 placental diameter (D,E) and fetus length (F,G). All the data are expressed as mean ± SD (n = 5). * p < 0.05, ** p < 0.01, # p < 0.001 vs. control.
Nanomaterials 09 00257 g006
Figure 7. 60-day body weight growth ratios: (A) F1 (n = 6); (B) F2 (n = 6); (C) F3 (n = 6). All the data are expressed as mean ± SD. * p < 0.05 vs. control. The body weight growth ratios = (bodyweight − body weight in PND1)/body weight in PND1.
Nanomaterials 09 00257 g007
Figure 8. Gene expression and possible molecular mechanism after P0 exposure to QDs. (A) Fold changes of gene expression in P0 and F1 generations placentas. (B) Possible molecular mechanism. Relative gene expression levels were determined by the critical threshold (Ct) number and calculated using the 2−ΔΔCt method (fold change = 2−ΔΔCt value). Values were the mean ± standard deviation, n = 6. * p < 0.05, ** p < 0.01, # p < 0.001 vs. control.
Nanomaterials 09 00257 g008

