Structural Basis of CO2 Adsorption in a Flexible Metal-Organic Framework Material
by
 , , ,
, , ,
Andrew J. Allen
1,* ,
,
Winnie Wong-Ng
1,
Eric Cockayne
1,
Jeffrey T. Culp
2,3 and
Christopher Matranga
3 1
Material Measurement Laboratory, National Institute of Standards and Technology (NIST), Gaithersburg, MD 20899-8520, USA
2
AECOM Corporation, Pittsburgh, PA 15236, USA
3
National Energy Technology Laboratory (NETL), US Department of Energy, Pittsburgh, PA 15236, USA
*
Author to whom correspondence should be addressed.
Nanomaterials 2019, 9(3), 354; https://doi.org/10.3390/nano9030354
Submission received: 3 February 2019
/
Revised: 16 February 2019
/
Accepted: 19 February 2019
/
Published: 4 March 2019
(This article belongs to the Special Issue Nanomaterials in CO2 Capture)
Abstract
:This paper reports on the structural basis of CO2 adsorption in a representative model of flexible metal-organic framework (MOF) material, Ni(1,2-bis(4-pyridyl)ethylene)[Ni(CN)4] (NiBpene or PICNIC-60). NiBpene exhibits a CO2 sorption isotherm with characteristic hysteresis and features on the desorption branch that can be associated with discrete structural changes. Various gas adsorption effects on the structure are demonstrated for CO2 with respect to N2, CH4 and H2 under static and flowing gas pressure conditions. For this complex material, a combination of crystal structure determination and density functional theory (DFT) is needed to make any real progress in explaining the observed structural transitions during adsorption/desorption. Possible enhancements of CO2 gas adsorption under supercritical pressure conditions are considered, together with the implications for future exploitation. In situ operando small-angle neutron and X-ray scattering, neutron diffraction and X-ray diffraction under relevant gas pressure and flow conditions are discussed with respect to previous studies, including ex situ, a priori single-crystal X-ray diffraction structure determination. The results show how this flexible MOF material responds structurally during CO2 adsorption; single or dual gas flow results for structural change remain similar to the static (Sieverts) adsorption case, and supercritical CO2 adsorption results in enhanced gas uptake. Insights are drawn for this representative flexible MOF with implications for future flexible MOF sorbent design.
1. Introduction
There is continued and sustained research interest in developing a better understanding of the properties of flexible porous coordination polymer (PCP) or flexible metal-organic framework (MOF) materials, especially those relevant to their selective gas adsorption capabilities [1,2,3,4,5]. Such an interest is based on the potential of PCPs or MOFs to address commercial needs for molecular sorption and sensing, enhanced gas recovery, carbon mitigation, and other gas storage applications [6,7,8,9,10]. While many MOFs are not found to change in structure significantly when guest solvent or gas molecules are adsorbed or desorbed, several flexible MOFs have been discovered that exhibit reversible structural transitions between nanoscale low-porosity and high-porosity states during the adsorption and desorption of gases [11,12,13,14,15]. Such structurally-dynamic flexible MOFs can show adsorption isotherms characterized by step-shape features where the pore system opens to accommodate the guest molecule. Below the step, little adsorption occurs, while the physical process at the step can be described as a “gate opening” event [16,17,18,19,20]. Another important aspect of the sorption isotherms is that the desorption branch frequently exhibits hysteresis with respect to the adsorption branch of the isotherm [21,22,23,24,25]. The temperature and pressure conditions that lead to gate opening can vary significantly for different guest molecules. In soft porous crystals, it is also possible to have behavior that is far more complex than a simple guest-induced gate opening such as “breathing” effects with multiple steps in the adsorption and/or desorption branches of the isotherm [26,27,28,29,30]. Meanwhile, the frequently observed hysteresis in the isotherm curve can be exploited as a basis for separating different gas species having different adsorption or desorption threshold pressures [31,32,33,34,35].
Understanding the structural dynamics that underlie the adsorption and desorption properties of flexible MOFs is a key requirement for improving and optimizing their performance to meet given selective gas sorption or separation requirements. Unfortunately, obtaining such insights frequently proves challenging. In part, this is due to there being no single structurally-dynamic, gate-opening mechanism ubiquitous across all flexible MOF materials [36]. More importantly, the flexible nature of the polymer linkers incorporated into the overall structure of flexible MOFs, results in some uncertainty and variability in any structure being determined. Thus, each flexible MOF, or class of flexible MOFs, must be investigated individually [37]. In this connection, since their original synthesis by Culp et al., [23], several of the present authors have studied members of the PICNIC (pillared cyanonickelate) class of flexible MOFs, which have a dynamic pillared cyanonickelate architecture [38,39]. This class of flexible MOFs incorporate metal ions bridged through organic linkers into extended coordinate-covalent networks [40]. This and similar architectures offer enormous diversity in the materials design of possible flexible MOFs, arising from an ability to alter the coordination geometry and organic linker properties in numerous combinations, thus creating porous networks of widely varied nanoscale size and chemical nature [41,42]. One of the more representative model PICNIC flexible MOFs, known to exhibit a high degree of CO2 adsorption and desorption in particular, is an effective extended 3D Hofmann clathrate analog: a pillared Ni(1,2-bis(4-pyridyl)ethylene)[Ni(CN)4], compound denoted as NiBpene [23].
NiBpene has been the subject of several studies by some of the present authors [23,39,40,43,44,45]. It has a characteristic CO2 adsorption/desorption isotherm exhibiting hysteresis between the adsorption and desorption branches and also features on the desorption branches that have been associated with structural changes, as measured by neutron diffraction (ND) and small-angle neutron scattering (SANS) [45]. Using single-crystal X-ray diffraction (XRD), it has been possible to achieve an a priori crystal structure determination, at least under conditions where ligands and solvents of crystallization, i.e., dimethyl sulfoxide (DMSO) and water molecules, occupy the nanoscale pores as a result of the crystallization technique used [44]. Consistent with the freely available crystallographic information files (CIF) uploaded in Reference [44], it was reported that when the cavities of the NiBpene structure (monoclinic P21/m, with lattice parameters: a = 1.35941(12) nm, b = 1.43621(12) nm, c = 1.42561 nm, β = 96.141(2)°, unit cell volume: V = 2.7674(4) nm3, with standard deviation uncertainties in least significant digits given in parentheses), are full of dimethyl sulfonyl oxide (DMSO) solvent and extra ligands, the structure is wide open as a result of the near perpendicular geometry of the Bpene ligands (β ≈ 90°) relative to the basal 2-dimensional (2D) cyanonickelate net [23,39,44]. We envisage an analogous situation when the cavities are full of CO2, the volume of the unit cell would be the largest (β closest to 90°) as compared with the situation when CO2 is depleted. Conversely, when the structure ‘collapses’, the monoclinic β angle moves away from 90° and the Bpene linker d-spacing decreases. However, in reality, an absolute ‘guest-free’ situation might not occur with the material under ambient conditions due to the fact that a small number of guest molecules from the atmosphere could occupy the cavities. Nevertheless, one expects to see similar trends in the unit cell volume and β angle variation as a function of CO2 partial pressure, . While the rapid in situ XRD measurements obtained here (see below) are not sufficient for full structure determinations, they are sufficient to follow the trends in the structural changes as a function of by performing least-squares lattice parameter refinements. Since lattice expansion (contraction) is expected as the temperature is increased (decreased) at a given pressure, some insights can also be gained by following lattice parameter changes as a function of temperature.
In summary, due to the variable configuration of the flexible pillared structure, broad peaks in the diffraction pattern can prove challenging for structural analysis across all of the ranges of adsorption/desorption conditions of interest [45]. Nevertheless, progress has been sufficient to enable density functional theory (DFT), which has been applied previously by some of the present authors to the case of CO2 adsorption in a 1D molecular sieve [46], to be applied to CO2 adsorption in NiBpene. Starting with the a priori single-crystal XRD structure previously determined, we here apply DFT (within significant uncertainties) to attempt predictions on how the NiBpene structure and its associated gas sorption properties change under realistic gas pressure conditions.
In this connection, we present new results for the adsorption of CO2 by NiBpene under dual gas conditions. The effects of dual gas adsorption as a function of CO2 partial pressure are illustrated for CO2/N2, CO2/CH4 and CO2/H2 static gas pressure conditions using SANS-based small-angle neutron diffraction. Structural changes associated with adsorption and desorption are further explored under in situ operando conditions for the same gas combinations under dual gas flow conditions. In this case, the measurements we present are based on combined rapid ultra-small-angle X-ray scattering (USAXS), small-angle X-ray scattering (SAXS) and powder XRD measurements [47,48,49], developed with others by one of the present authors (A.J.A), and both the adsorption and desorption processes can be followed. Applying the previously-determined structure results [44] together with the new powder XRD results, we now present DFT calculations that provide insights regarding CO2 sorption, in particular, under both single-gas and dual-gas sorption conditions. In particular, the DFT calculations show how the gas sorption properties can be associated with inferred changes in the NiBpene pillared structure, including the reversible 90° rotation of individual Bpene ligands. Finally, we also explore the partially-reversible enhanced CO2 adsorption by NiBpene observed to occur in the supercritical CO2 pressure regime. We consider how supercritical conditions enhance the CO2 adsorption in NiBpene, bringing the CO2 molecules per mole close to the theoretical maximum limit of five CO2 molecules per formula unit, predicted by the DFT calculations.
While the flexible nature of the NiBpene microstructure makes XRD determination of the structure under all adsorption conditions extremely challenging, just as for most flexible MOFs, it remains important to characterize gas sorption behavior and relate this to structure, as we illustrate below. We note how model calculations based on DFT simulations, such as those we present, can indicate how the microstructural design may be modified or how species can be added to improve gas sorption performance. Exciting opportunities exist to design new flexible MOF materials with enhanced gas sorption performance [50,51]. However, as we conclude, this requires that the crystal structure is sufficiently well characterized to provide all needed information for DFT to predict adsorption and desorption behavior.
2. Materials and Methods
2.1. Synthesis and Preparation of NiBpene Powder
All chemicals were purchased from Sigma-Aldrich (St. Louis, MO, USA) and used as received. The synthesis of polycrystalline NiBpene, comprising of Ni(Bpene)[Ni(CN)4] where the Bpene ligand has a composition: C16H10N6Ni2, followed a previously reported procedure [44]. In brief, a flask was charged with 4 mmol of polymeric Ni[Ni(CN)4]n hydrate. Using sequential incremented additions of 15 mL H2O, 15 mL concentrated ammonium hydroxide solution (≈ 28% by volume) and 15 mL of dimethyl sulfoxide (DMSO), the solid was dissolved slowly at room temperature while stirring. (Note: concentrated NH4OH must not be mixed directly with DMSO directly, or rapid outgassing of NH3 can occur). Once dissolved, 5.6 mmol of 1,2-bis(4-pyridyl)ethylene dissolved in 35 mL DMSO was added to the clear solution. The pressure in the flask was slowly decreased using a water aspirator to outgas the NH3 at a controlled and approximately constant rate, which was sufficiently slow to prevent excessive bubbling. After ≈ 90 min, the precipitated solid was filtered off and washed with a mixture of 1-part H2O, 3-parts DMSO, followed by acetone. The solid was then extracted in 100 mL of acetone at reflux for 2 h and isolated by filtration. In this process, 247 mg or 1.4 mmol of Bpene ligand was recovered on evaporation of the acetone filtrate. The extracted solid was then further refined in 50 mL toluene at reflux for 30 min to give a toluene-loaded sample free of Bpene guests as determined by thermogravimetric analysis (TGA). To facilitate sample activation for gas sorption measurements, toluene was replaced by acetone by extraction of the former in boiling acetone until TGA analysis showed complete exchange of toluene with acetone (after 1 h to 2 h). The adsorbed acetone was removed overnight at 90 °C under vacuum to yield 1.22 g (3.0 mmol) of guest-free Ni(Bpene)Ni(CN)4. This formula mass was verified from the residual mass of NiO after TGA in air to 550 °C.
2.2. Small-Angle Neutron Scattering and Diffraction under Static Dual Gas Conditions
SANS measurements were carried out at the NIST Center for Neutron Research (NCNR) using the NCNR’s two 30-m SANS instruments [52] with similar measurement configurations to those reported previously [45]. SANS measurements are used both to determine the scattering intensity profile, I(q), as a function of the magnitude of the scattering vector, q, where q = (4π/λ) × sin(θ), and θ is one half of the scattering angle and λ is the neutron wavelength, and to determine the position and intensity of the first small-angle diffraction peak, qPK, which is associated with the flexible MOF d-spacing (where d = 2π/qPK) most sensitive to the presence of adsorbed guest molecules. For all SANS measurements, λ = 0.51 nm. Using up to three instrument configurations, SANS data were obtained in the q range: (0.04 < q < 6) nm−1. This is sufficient to characterize both the powder morphology present and the internal nanoscale structure. The powder morphology determined from SANS has been reported previously [45], so only the data in the (3 < q < 6) nm−1 range has been used to provide the relevant neutron-based small-angle diffraction results reported here. In all SANS measurements, data were recorded on a two-dimensional detector. Using the NCNR SANS analysis software package developed using Igor Pro (Wavemetrics, Lake Oswega, OR, USA) [53], data were corrected for detector sensitivity, electronic and parasitic background effects, and sample absorption, and then calibrated against the incident beam flux and normalized to unit sample volume. Finally, the data were circularly averaged to obtain absolute scattered intensity I(q) versus q data.
In situ data, specifically for the diffraction peak associated with the main Bpene ligand d-spacing, were collected for activated NiBpene under vacuum, and in separate experiments at up to 17 bar of the following pure gases: CO2, N2, CH4, and H2, and also in 50/50 mixtures of N2, CH4 and H2 with CO2 at total pressures up to 34 bar. All measurements were carried out at 30 °C. Note that, with the relatively small amount of the NiBpene sample in the chamber (≈0.11 g), the large headspace volume (≈2 L) and consequent large number of moles of CO2 at 17 bar (1.35 mol CO2), changes in headspace composition of the gas mixtures due to any selective CO2 adsorption were negligible (<0.02%). The objective of these measurements was to follow the behavior of the main NiBpene ligand space diffraction peak as a function of CO2 partial pressure during dual gas adsorption and compare this both with the previously determined CO2 sorption isotherm for NiBpene and with the previously measured response of this peak during pure CO2 adsorption. Details of the isotherm measurement and the detailed setup for the in situ SANS experiments have been described previously [45].
2.3. Small-Angle X-Ray Scattering and Diffraction under Dual Gas Flow Conditions
The X-ray measurements reported here were conducted at the USAXS facility at the Advanced Photon Source (APS), Argonne National laboratory, Argonne, IL [47,48,49]. This facility provides combined USAXS, SAXS and wide-angle X-ray scattering (WAXS) measurements without disturbing the sample position within ≈6 min. In principle, these measurements cover a contiguous q range from 0.001 nm−1 to 60 nm−1. Here, the maximum q was limited to ≈ 45 nm−1 due to restrictions on the scattered beam path arising from the sample cell geometry. The USAXS instrument exploits Bonse-Hart-type double-crystal optics and extends the SAXS q range down to 0.001 nm−1. For USAXS measurements, the beam size was 0.6 mm × 0.6 mm. To provide better signal-to-noise at high q, the USAXS instrument was supplemented with a Pilatus 100K detector (Dectris Ltd., Baden, Switzerland) in a conventional pinhole SAXS geometry. The SAXS q values were calibrated using an AgBe calibration standard. A beam size of 0.6 mm horizontal × 0.2 mm vertical was used for the SAXS measurements. The combined accessible q range for USAXS and SAXS is 0.001 nm−1 to 15 nm−1, and the combined dynamic range in linear intensity response exceeds 10 orders of magnitude. To evaluate changes in the atomic structure of NiBpene during gas adsorption and desorption, a modified Dectris Pilatus 300 KW detector was used to perform area-detector-based WAXS measurements providing XRD data in a q range from 14 nm−1 to the maximum accessible 45 nm−1. A NIST Standard Reference Material, SRM 660a (LaB6: lanthanum hexaboride) [54] was used to calibrate the q values and sample-to-detector geometry. The beam size used for WAXS measurements was the same as for the pinhole SAXS. The USAXS, SAXS and WAXS data were reduced and calibrated using the APS USAXS facility analysis software packages (especially Irena and Nika) [55,56] and developed using Igor Pro.
X-ray energies used for the USAXS, SAXS and WAXS measurements were 18 keV and 21 keV (λ = 0.06889 nm and 0.05904 nm, respectively). The use of this relatively high X-ray energy, together with a rapid overall measurement time, permits sample environments with substantial sample cell windows for studies requiring elevated pressures or temperatures. Here, a small parallel-sided powder sample (thickness ≈ 0.05 mm) of NiBpene was encapsulated in plastic tape, which was perforated to allow the inflow and outflow of gas. This sample was then mounted inside a pressure cell with polyamide film windows and the cell connected to an automated Hiden XCS dual gas flow system (Hiden Isochema Ltd., Warrington, UK). This system employs gas flow through the sample (at ≈100 mL/min) and a gate valve system to apply total gas pressures up to 50 bar. After initial activation of the sample by CO2 pressurizing to 5 bar followed by partial evacuation to ≈0.3 bar, USAXS/SAXS/WAXS measurements were then conducted as a function of gas pressure in separate experiments using pure CO2, N2, CH4, and H2 up to 18 bar, each followed by similar measurements with a dual gas flow of CO2/N2, CO2/CH4, and CO2/H2, respectively, up to a total pressure of 35 bar. In each case, the nominal 100 mL/min total gas flow was distributed 50/50 between the two gases, with corrections for the different gas constants applied automatically by the Hiden XCS control software. Thus, the USAXS/SAXS/WAXS measurements approximately followed the pressure conditions of the previously described SANS measurements except that the 50/50 partial pressures of the gas mixtures were achieved by dual gas flow control rather than use of a Sieverts gas-cart arrangement. In these studies, both the internal powder morphology and the main Bpene ligand spacing diffraction peak could be followed as a function of gas pressure conditions (as for SANS), but also the XRD pattern as a whole could be followed under the same conditions. The measurement configuration is shown schematically in the Supporting Information Figure S1.
2.4. Small-Angle X-Ray Scattering and Diffraction under Supercritical CO2 Conditions
Using a different sample environment configuration, USAXS/SAXS/WAXS measurements were also made of NiBpene under supercritical CO2 pressure conditions. In this configuration, the powdered sample was mounted in the center of a 1.5-mm quartz capillary plugged at both ends with porous glass wool. The capillary was connected to a Teledyne Isco 1000D syringe pump gas system (Teledyne, Lincoln, NE, USA) that enabled CO2 pressures to be increased into the supercritical regime. The measurement configuration is shown schematically in the Supporting Information Figure S2. This arrangement also incorporates a thermocouple mounted through one end of the capillary and heating coils to both calibrate and select the desired sample temperature. The sample was activated by a gentle purge of the system with flowing CO2, pressurizing the system to 5 bar of CO2 under static (non-flow) conditions, followed by a second gentle purge of flowing CO2, then the system was sealed and pressurized to the desired CO2 pressure under static non-flow conditions. Using this arrangement, USAXS/SAXS/WAXS measurements were carried out at several sub-critical CO2 pressure values with the sample held at 90 °C. Then, the system pressure was incremented in small steps through the supercritical gas transition at ≈73 bars CO2 to ≈80 bars CO2 gas pressure. Several pressures and temperatures were investigated in the supercritical CO2 regime, until finally the pressure was reduced in increments to ambient with the sample temperature at 60 °C. The USAXS/SAXS/WAXS measurement configurations were identical to those above used for the subcritical dual gas flow studies, except that the WAXS data q range was no longer constrained by the pressure cell design, so XRD data were obtained at the maximum measurable q of 60 nm−1.
2.5. Estimation of Lattice Parameter Changes in Response to Gas Adsorption/Desorption in NiBpene
The goal of lattice parameter estimation was to elucidate the structural flexibility of NiBpene as reflected by changes in the monoclinic unit cell β angle through determining trends in the response of the unit cell parameters as a whole, as a function of (or other gas partial pressure). The Jade Software Suite (Materials Data Inc., Livermore, CA, USA) was used for the least-squares refinements. Starting from the previously-published single-crystal structure of NiBpene [44] and DFT-predicted (see below) different-but-related cell parameters (monoclinic, a = 1.3784 nm, b = 1.4822 nm, c = 1.3818 nm, β = 108°), we performed least-squares refinements using the XRD peaks in the SAXS and WAXS regimes of eight selected experimental USAXS/SAXS/WAXS datasets. These XRD peaks cover a q-range from 0.028 nm−1 to 0.47 nm−1 (equivalent CuKα2θ range from 4° to 70°). To determine the trend in unit cell volume and β angle in this series of XRD patterns, we also included (for room temperature data) powder diffraction data collected previously using a computer-controlled Philips powder diffractometer (Malvern Panalytical Inc., Westborough, MA, USA) with a CuKα2θ range from 3° to 60°. However, most peaks were broad and weak for 2θ > 40°.
The XRD peaks for NiBpene are broad in general, and some are very weak. Particularly at higher diffraction angles, the peaks in rapid in situ USAXS/SAXS/WAXS datasets are also distorted in shape. It is difficult to assign a space group to these patterns, and therefore, they were refined by using the primitive lattice P. We did not use the space group P21/m that was determined for the NiBpene single-crystal measurements [44], directly, because the crystal had different guests present, as well as extra ligands within the cavities. These could give rise to a different space group.
2.6. DFT Model Interpretation
Density functional theory calculations were performed to complement the experimental measurements and to model the energetics and structural changes upon CO2 sorption in NiBpene. Although all current density functionals use some approximation to the unknown exact exchange-correlation functional, in practice, DFT that combines the Perdew–Burke–Ernzerhof (PBE) or solid-state PBE (PBEsol) generalized gradient approximation [57,58] with “Hubbard U” corrections for transition metal ions [59] and empirical van der Waals forces has been found to provide a good combination of speed and accuracy for the study of CO2 sorption in MOFs [60]. Flexible MOFs can have one or more elastic parameters that are extremely small [61]. Because of this, the Pulay stress (which normally causes only negligible strain error at the cutoff energy that we use) causes significant enough strain errors in NiBpene to make typical iterative full relaxation inefficient. We therefore use an “equation of state” approach to fully relax the structures where the total energy is calculated as a function of volume through a series of fixed volume (cell shape allowed to change) calculations [62]. The ground state volume is found via cubic spline interpolation and the ground state structure via fixed-volume relaxation at this volume. For NiBpene, tests on nickel oxide and planar metallocyanide compounds showed that a Hubbard value of U = 5.0 eV for Ni and empirical van der Waals forces treated using the Tkatchenko–Scheffler method with iterative Hirshfeld partitioning [63,64,65] reproduces the experimental structures well. These parameters were thus used for NiBpene. The Ni ions were fixed at the spin states expected for their local environments: high spin for the Ni coordinated by 6 N in empty cells and low spin for the Ni coordinated by 4 C. For all computations, a supercell of the primitive structure was taken with the lattice parameters b and c and doubled, allowing possible Bpene ordering superstructures to be investigated; see Figure 1. The spins for the high spin (hs) Ni ions were arbitrarily set to be antiferromagnetic for the nearest hs neighbors; in any case, spin interactions at 0.7 nm distance are expected to be very small. All possible orderings of the Bpene molecules along the crystal axes were investigated with P2/c monoclinic or higher symmetry, plus some special structures with lower symmetry. All relaxations were carried out at fixed volumes (cell shape allowed to relax) that were multiples of 0.025 nm3. The optimum cell volume was found via cubic spline interpolation of the results. The DFT calculations were carried out using the VASP software (VASP Version 5.4.4., VASP Software GmbH, Vienna, Austria) [66,67].
The lowest-energy configurations of each ordering type found for empty Ni-Bpene were used for CO2 studies. One CO2 per primitive cell at a time (four per supercell) was introduced into each structure; the lowest energy position and orientation for this CO2, and the relaxed structure, were found (as before, from a cubic spline fit to a series of fixed volume relaxations). Then, an additional CO2 per primitive cell was introduced and the optimization procedure repeated for this CO2. In each case, hundreds of initial combinations of positions and orientations were considered for the new CO2. We are thus confident that we have identified important low-energy configurations of CO2 molecules in NiBpene, but it is possible that collective rearrangements of the CO2 could lead to even lower-energy configurations. The calculations used P2/c monoclinic symmetry to match the experimentally known lattice type while avoiding the overlap of symmetry-equivalent CO2 molecules. Preliminary results for H2, N2 and CH4 sorption were similarly obtained for one fixed representative cell.
3. Results and Discussion
3.1. Dual Gas Adsorption under Static Pressure Conditions
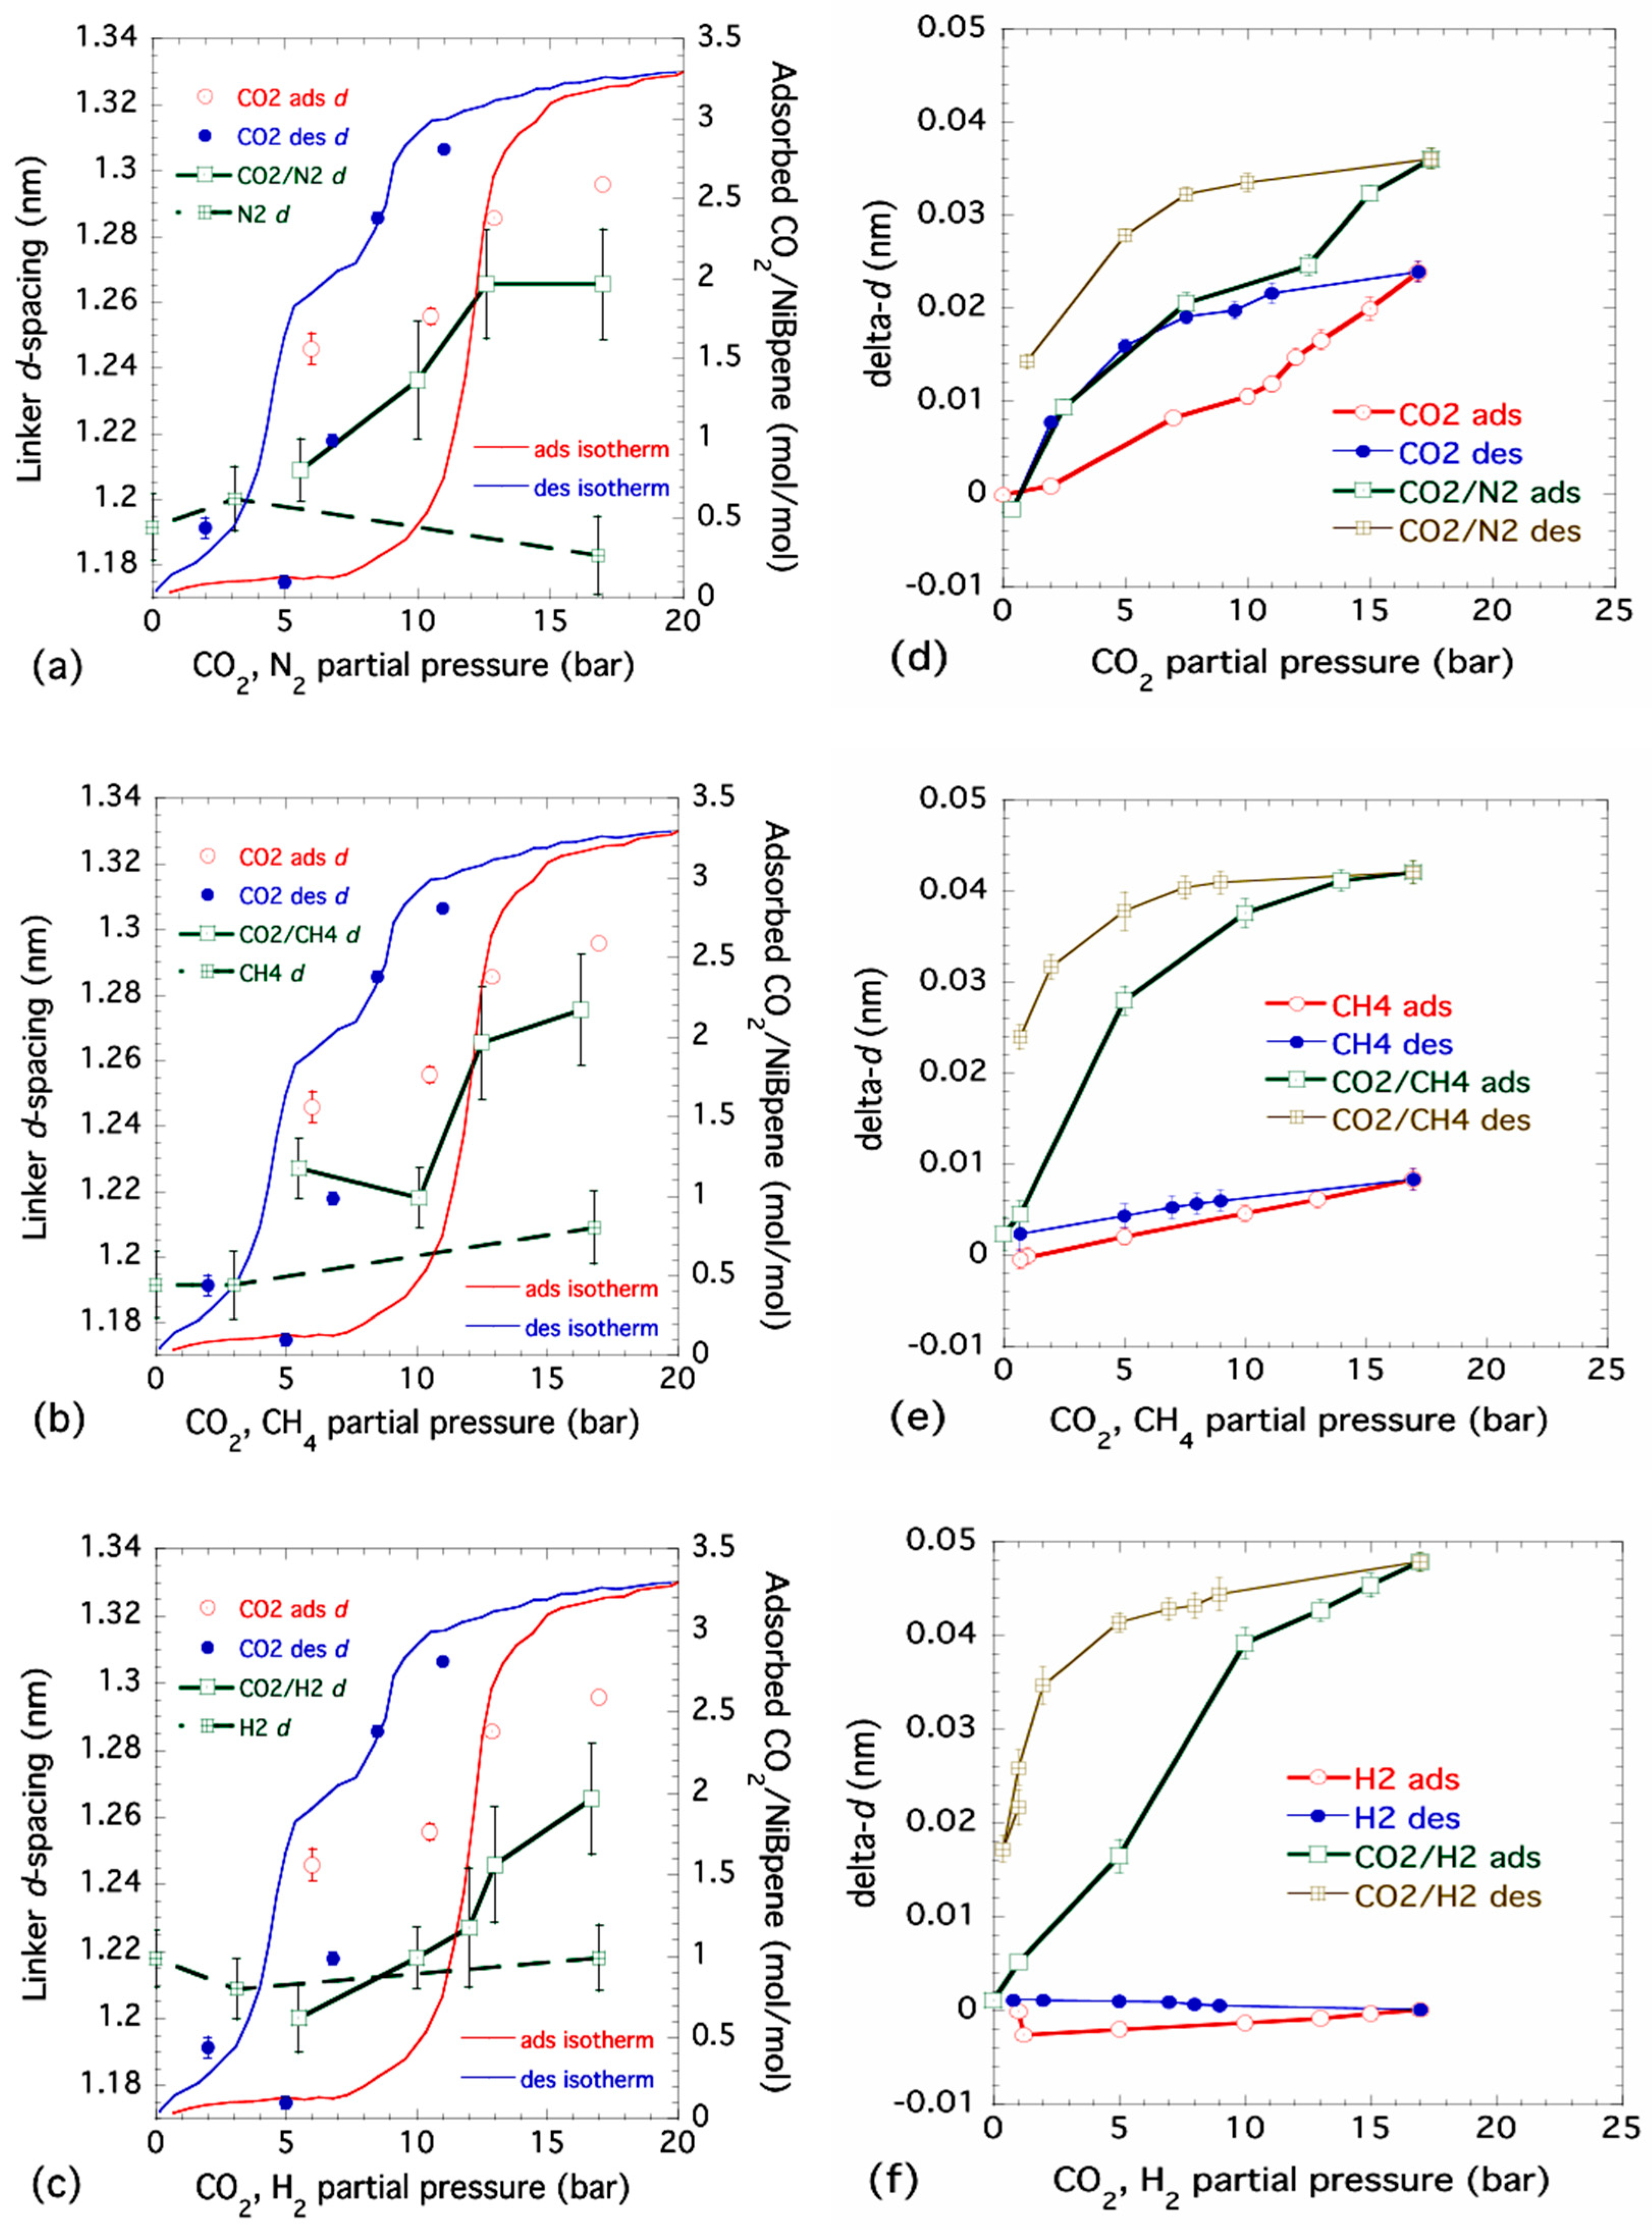
SANS (low-angle diffraction) data were used to track variations in the main Bpene linker d-spacing as a function of pressure. The small-angle diffraction peak data are shown in the Supporting Information Figure S3, while the variations in linker d-spacing are shown superimposed on the previously measured isotherm curves for NiBpene in Figure 2 [45]. For pure CO2 adsorption, the linker d-spacing shows a rough correlation with the adsorption and desorption branches of the isotherm (indicated in Figure 2a–c). We associate this with the Bpene ligand pillars standing up and letting CO2 molecules adsorb into the caged cell structure. In the case of pure N2, CH4 or H2, Figure 2a–c, respectively, they showed little or no significant change in the linker d-spacing. This suggests that, under Sieverts-type gas dosing conditions at near ambient temperatures, each of these gases alone is not significantly adsorbed into the NiBpene structure over the experimental timescales of 15 min to ≈2 h. For the case of Sieverts-type dual gas dosing, where each gas is initially stored with CO2 to an equal partial pressure within the gas reservoir, variations in the linker d-spacing broadly follow the same trend as that for the pure CO2 case over the equivalent CO2 partial pressure range. However, the absolute increases in linker d-spacing are significantly less than in the pure CO2 case. Note that only changes during adsorption were followed, since changes in the ratio of the two residual gas partial pressures during desorption can result from any selective desorption of one gas ahead of the other. These observations suggest that while NiBpene may have some preference for CO2 adsorption under Sieverts gas dosing conditions on timescales of less than a few hours, complex cooperative gate-opening processes may occur with more than one gas present [38,68].
3.2. Dual Gas Adsorption and Desorption under Flow Pressure Conditions
Combined USAXS, SAXS and WAXS results are presented (for H2) in the Supporting Information Figure S4 and (for linker d-spacings) in Figure 2d–f for the following single-gas and dual-gas combinations under controlled flow conditions: CO2 and CO2/N2, CH4 and CO2/CH4 and H2 and CO2/H2. Changes in the microstructure and structure were followed as a function of both adsorption and desorption, because any selectivity in gas release from the sample that might occur during desorption does not affect the gas partial pressures under the dual gas flow conditions used.
In Figure 2d–f, the changes in Bpene linker d-spacing, delta-d, with respect to that measured at a pressure below 1 bar are plotted versus pressure. Note that for single gas flow, the plots are with respect to total pressure on the sample in the gas flow system. For the 50/50 dual gas measurements, the total pressure is double that shown but the gas-flow conditions enforce a 50% partial pressure for each component gas. This is achieved through an automated correction in the mass flow controller setting for each gas, according to the gas law specific to that gas. Also, plotting the changes in d-spacing here removes the effects of any deviations in the absolute d-spacing due to sample preparation or history. A comparison of Figure 2d with Figure 2a reveals that the effects of pure CO2 adsorption under flow conditions follow the same trends as under Sieverts gas dosing conditions, although the overall change in d-spacing during flow: (0.024 ± 0.001) nm, is somewhat less than in the Sieverts case: (0.050 ± 0.005) nm on adsorption and as much as (0.115 ± 0.005) nm on desorption. The effects of pure N2 sorption were not measured under flow conditions, but we note that the linker d-spacing variation for CO2/N2 dual gas flow, carried out immediately after the pure CO2 cycle, is enhanced significantly to (0.036 ± 0.001) nm, although following the same trend as for the effects of pure CO2 gas flow. In Figure 2e, the effects of pure CH4 flow on the d-spacing during adsorption and desorption confirm the hinted increase in d-spacing, (0.017 ± 0.015) nm, seen in the Sieverts-type static gas case shown in Figure 2b, with a reduced but less uncertain increase in d-spacing on adsorption under gas flow conditions of (0.008 ± 0.001) nm. However, there is a clear amplification in the variation in linker d-spacing in the case of dual CO2/CH4 gas flow: (0.042 ± 0.002) nm, compared to the case for pure CO2 flow versus total CO2 pressure. These observations are even stronger for the case of CO2/H2 dual gas flow (Figure 2f), where there is no significant effect due to H2 adsorption alone (just as in the Sieverts static gas case shown in Figure 2c), but there is the strongest variation of all the gas flow measurements for CO2/H2 dual gas flow: (0.048 ± 0.002) nm. By comparison, the increases in the linker d-spacing for dual gas adsorption in the Sieverts static gas case (Figure 2a–c) are 0.056 nm, 0.057 nm and 0.065 nm, respectively, for CO2/N2, CO2/CH4 and CO2/H2, each with an estimated standard deviation uncertainty of ±0.015 nm.
We conclude that NiBpene is at least partially selective for CO2 adsorption/desorption in the case of a pure single gas, under both static and flow conditions. This is evidenced not only by the absence of significant changes in the linker d-spacing for gases other than CO2, but also by the complete absence of significant changes anywhere in the associated XRD pattern, as illustrated in the Supporting Information Figure S4. However, this selectivity probably does not extend significantly to the case of dual gas adsorption under static gas pressure or gas flow conditions due to likely cooperative gate opening effects.
3.3. Structural Changes in NiBpene During CO2 Adsorption/Desorption under Supercritical Conditions
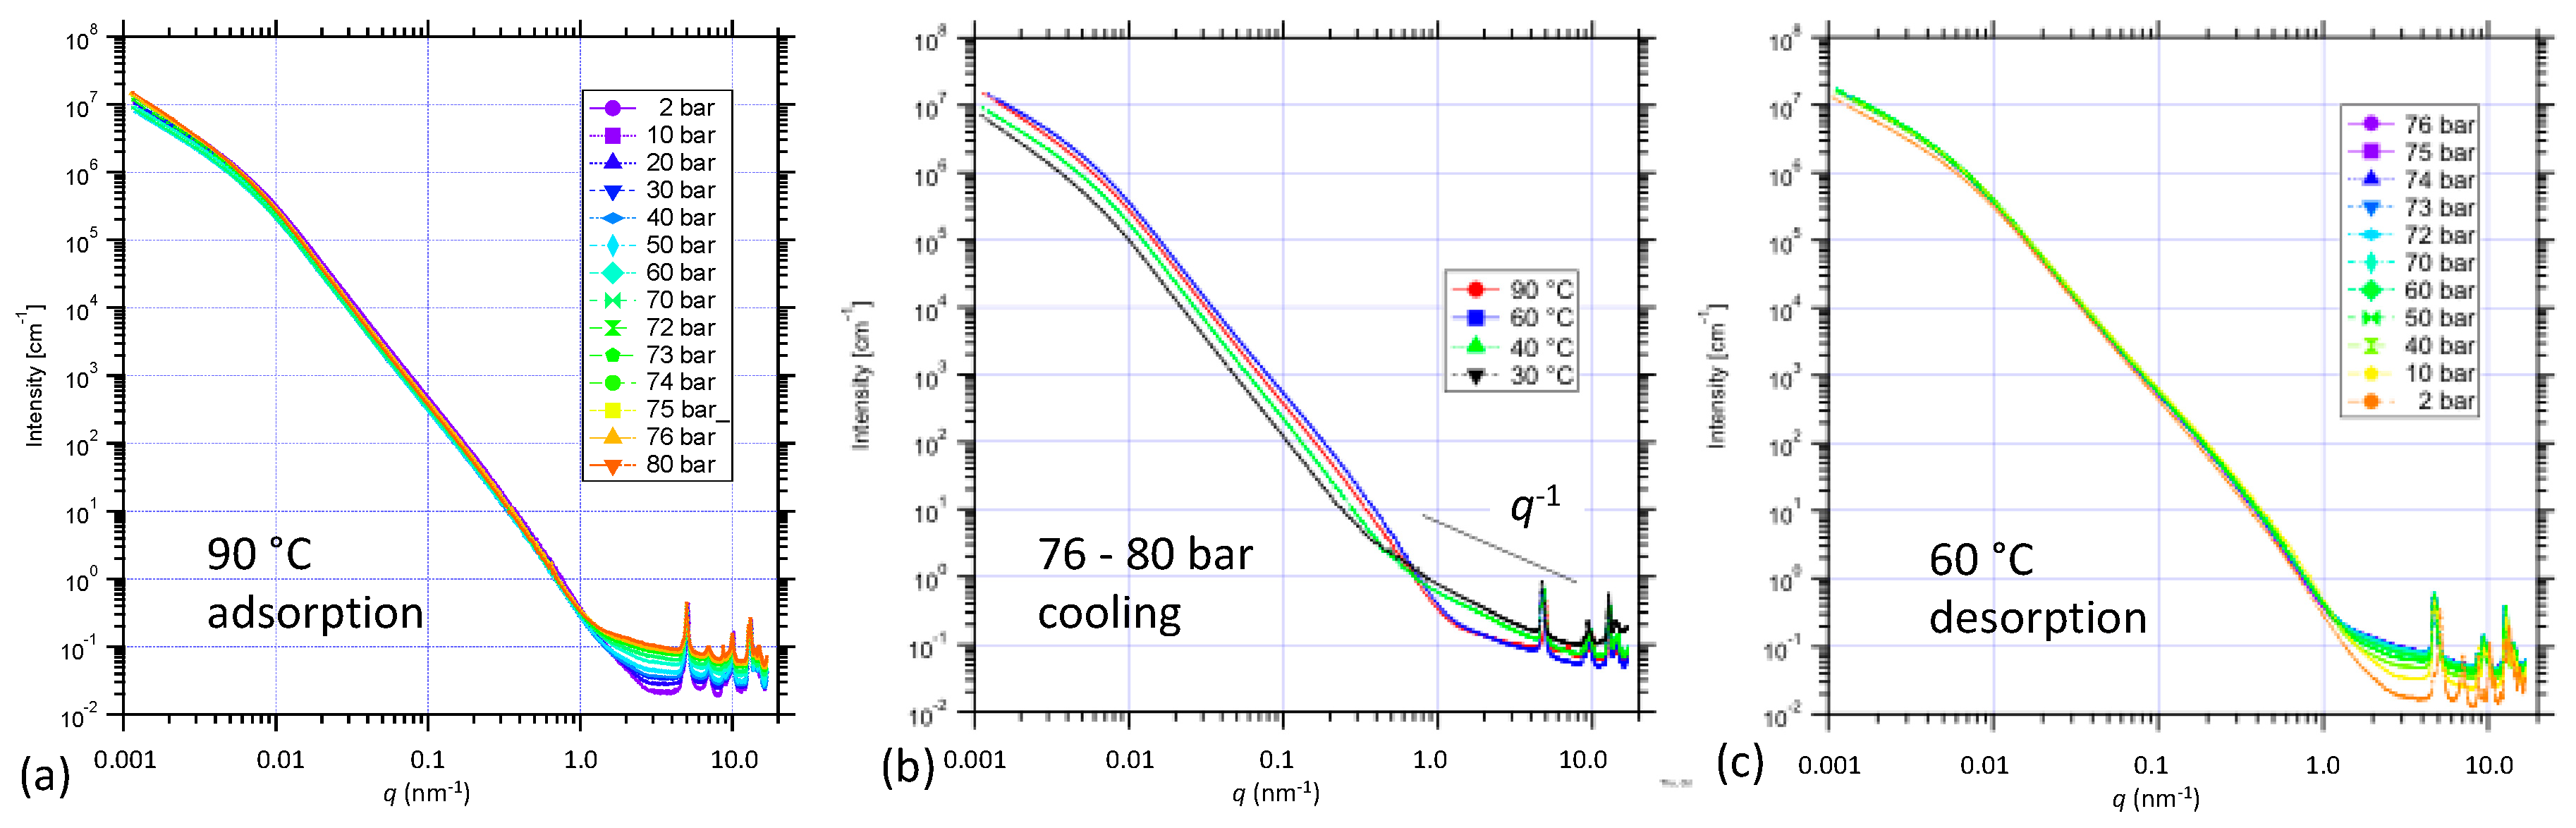
New combined USAXS/SAXS/WAXS results were obtained for NiBpene under both subcritical (see Supporting Information Figures S5–S7) and supercritical CO2 static (no flow) pressure conditions during both adsorption and desorption, at controlled temperatures in the 60 °C to 90°C regime. For the case of increasing CO2 pressure at 90 °C from the sub-critical pressure regime up into the supercritical regime for CO2 pressures above ≈ 73 bar [69], Figure 3a presents combined USAXS and sector-averaged pinhole SAXS data on a log-log plot. There is a clear increase in the scattering background as CO2 is adsorbed and fills the pores space. The USAXS data are slit-smeared, which distorts the profile at low q, but model fits can allow for this, as described elsewhere, and can provide information on the NiBpene powder morphology [45]. While this is not the focus of our discussion here, we note that the data are absolute-intensity calibrated, and thus, intensity variations of the USAXS profile can be associated with the scattering contrast factor between the adsorbate gas and the solid NiBpene sorbent, and/or changes in the sample morphology. In this connection, Figure 3b presents corresponding USAXS/SAXS data for NiBpene subject to static CO2 pressures between 76 bar and 80 bar for progressively lower temperatures: 90 °C, 60 °C, 40 °C, and 30 °C. Two effects are apparent: (i) a pronounced increase in background under the XRD peaks; (ii) a significant decrease in intensity in the USAXS regime. Both effects are more pronounced as the transition from supercritical CO2 to liquid CO2 is approached and traversed for temperatures below 31 °C [67]. The changes are consistent with the presence of CO2 of progressively increased density both outside and within the NiBpene matrix: The dense CO2 both reduces the scattering contrast between the NiBpene solid and the surrounding gas environment and increases the X-ray scattering background. We also note the emergence of a q−1 scattering dependence extending from ≈0.5 nm−1 to ≈5 nm−1. This is the hallmark of extended linear scattering features that may be associated with our DFT predictions of changes in the Bpene ligand configuration as CO2 is adsorbed into the system in the supercritical and liquid CO2 regimes. Figure 3c shows corresponding data for the final desorption stage of these in situ measurements, which was conducted at 60 °C. We note very little change in the system, other than a decrease in the scattering background under the XRD peaks until the pressure is below 10 bar, which is consistent with the hysteresis in CO2 adsorption and desorption observed in the sub-critical regime.
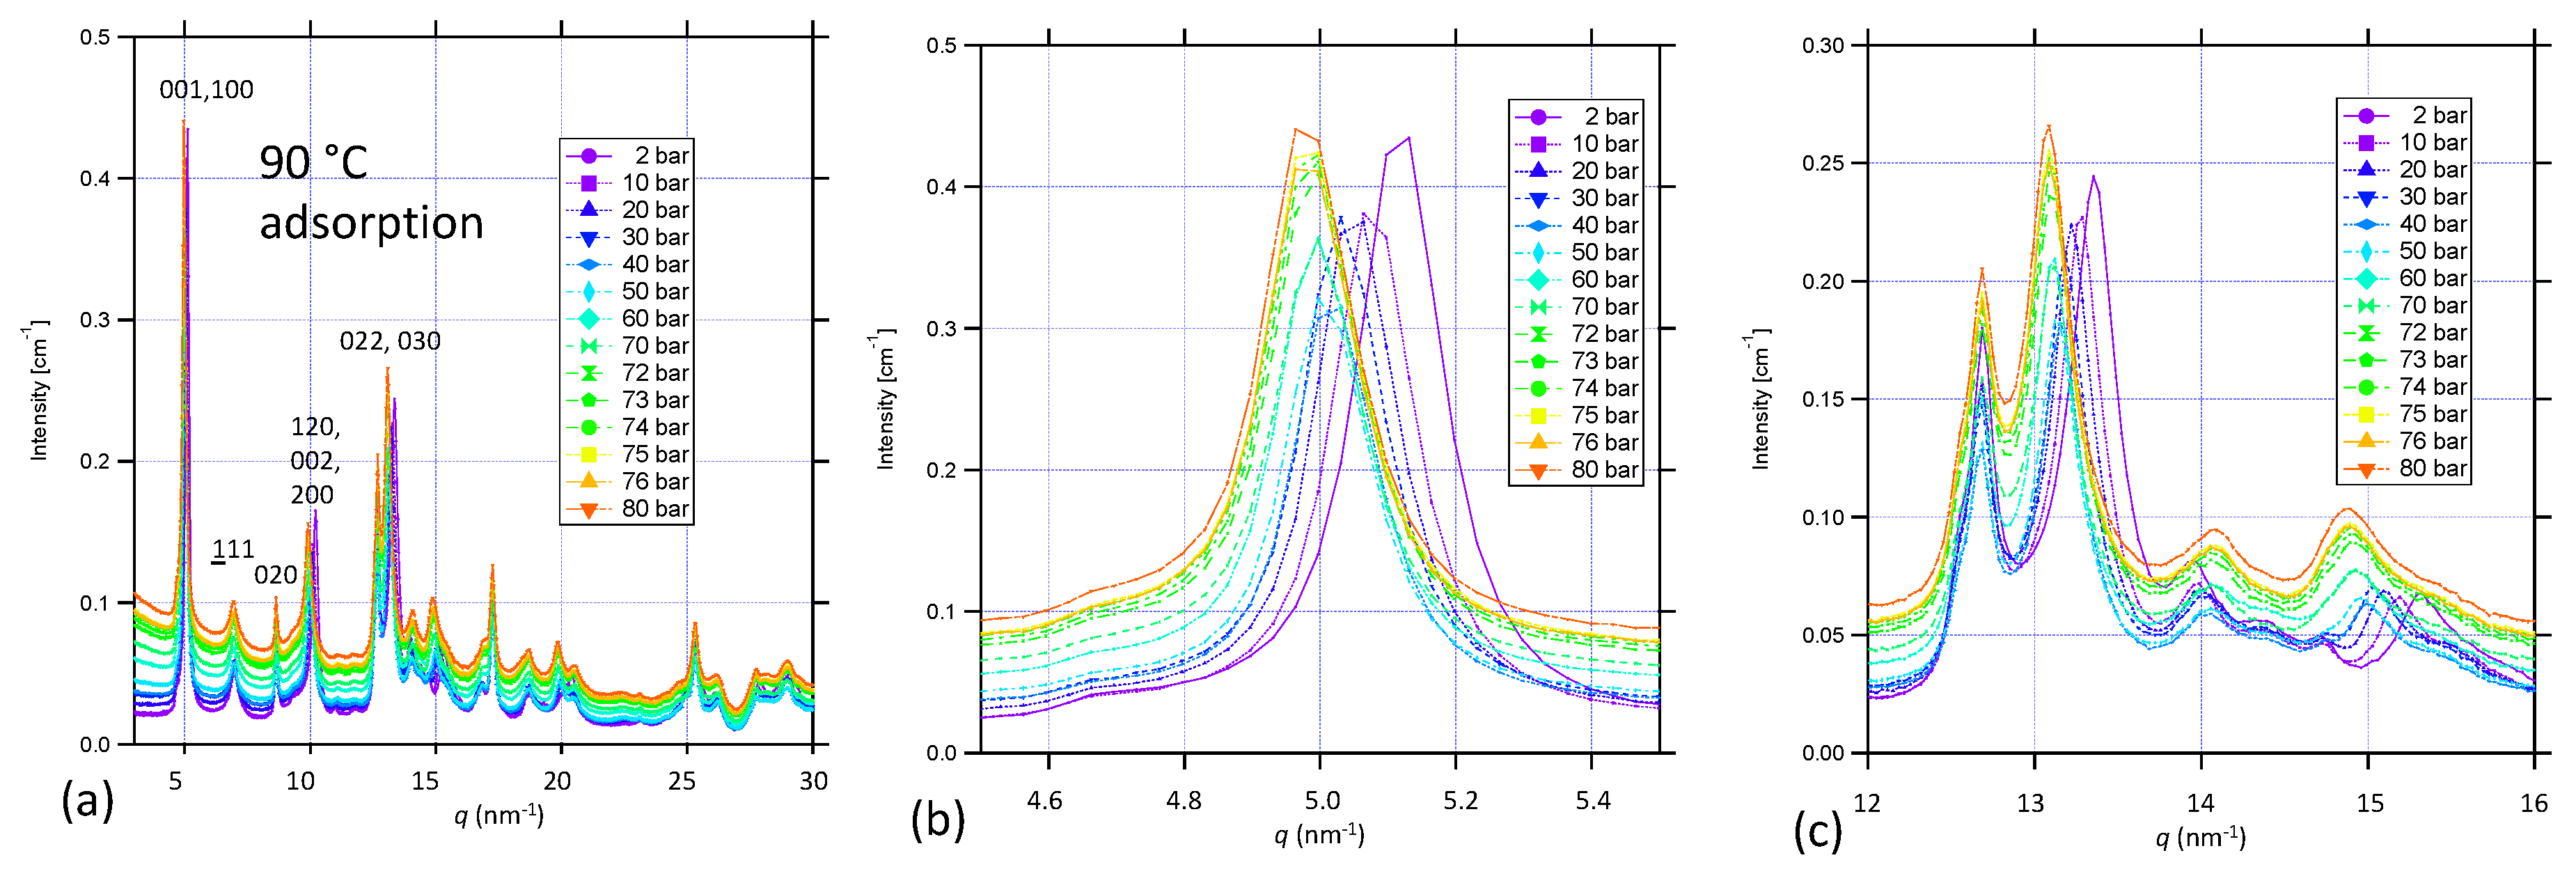
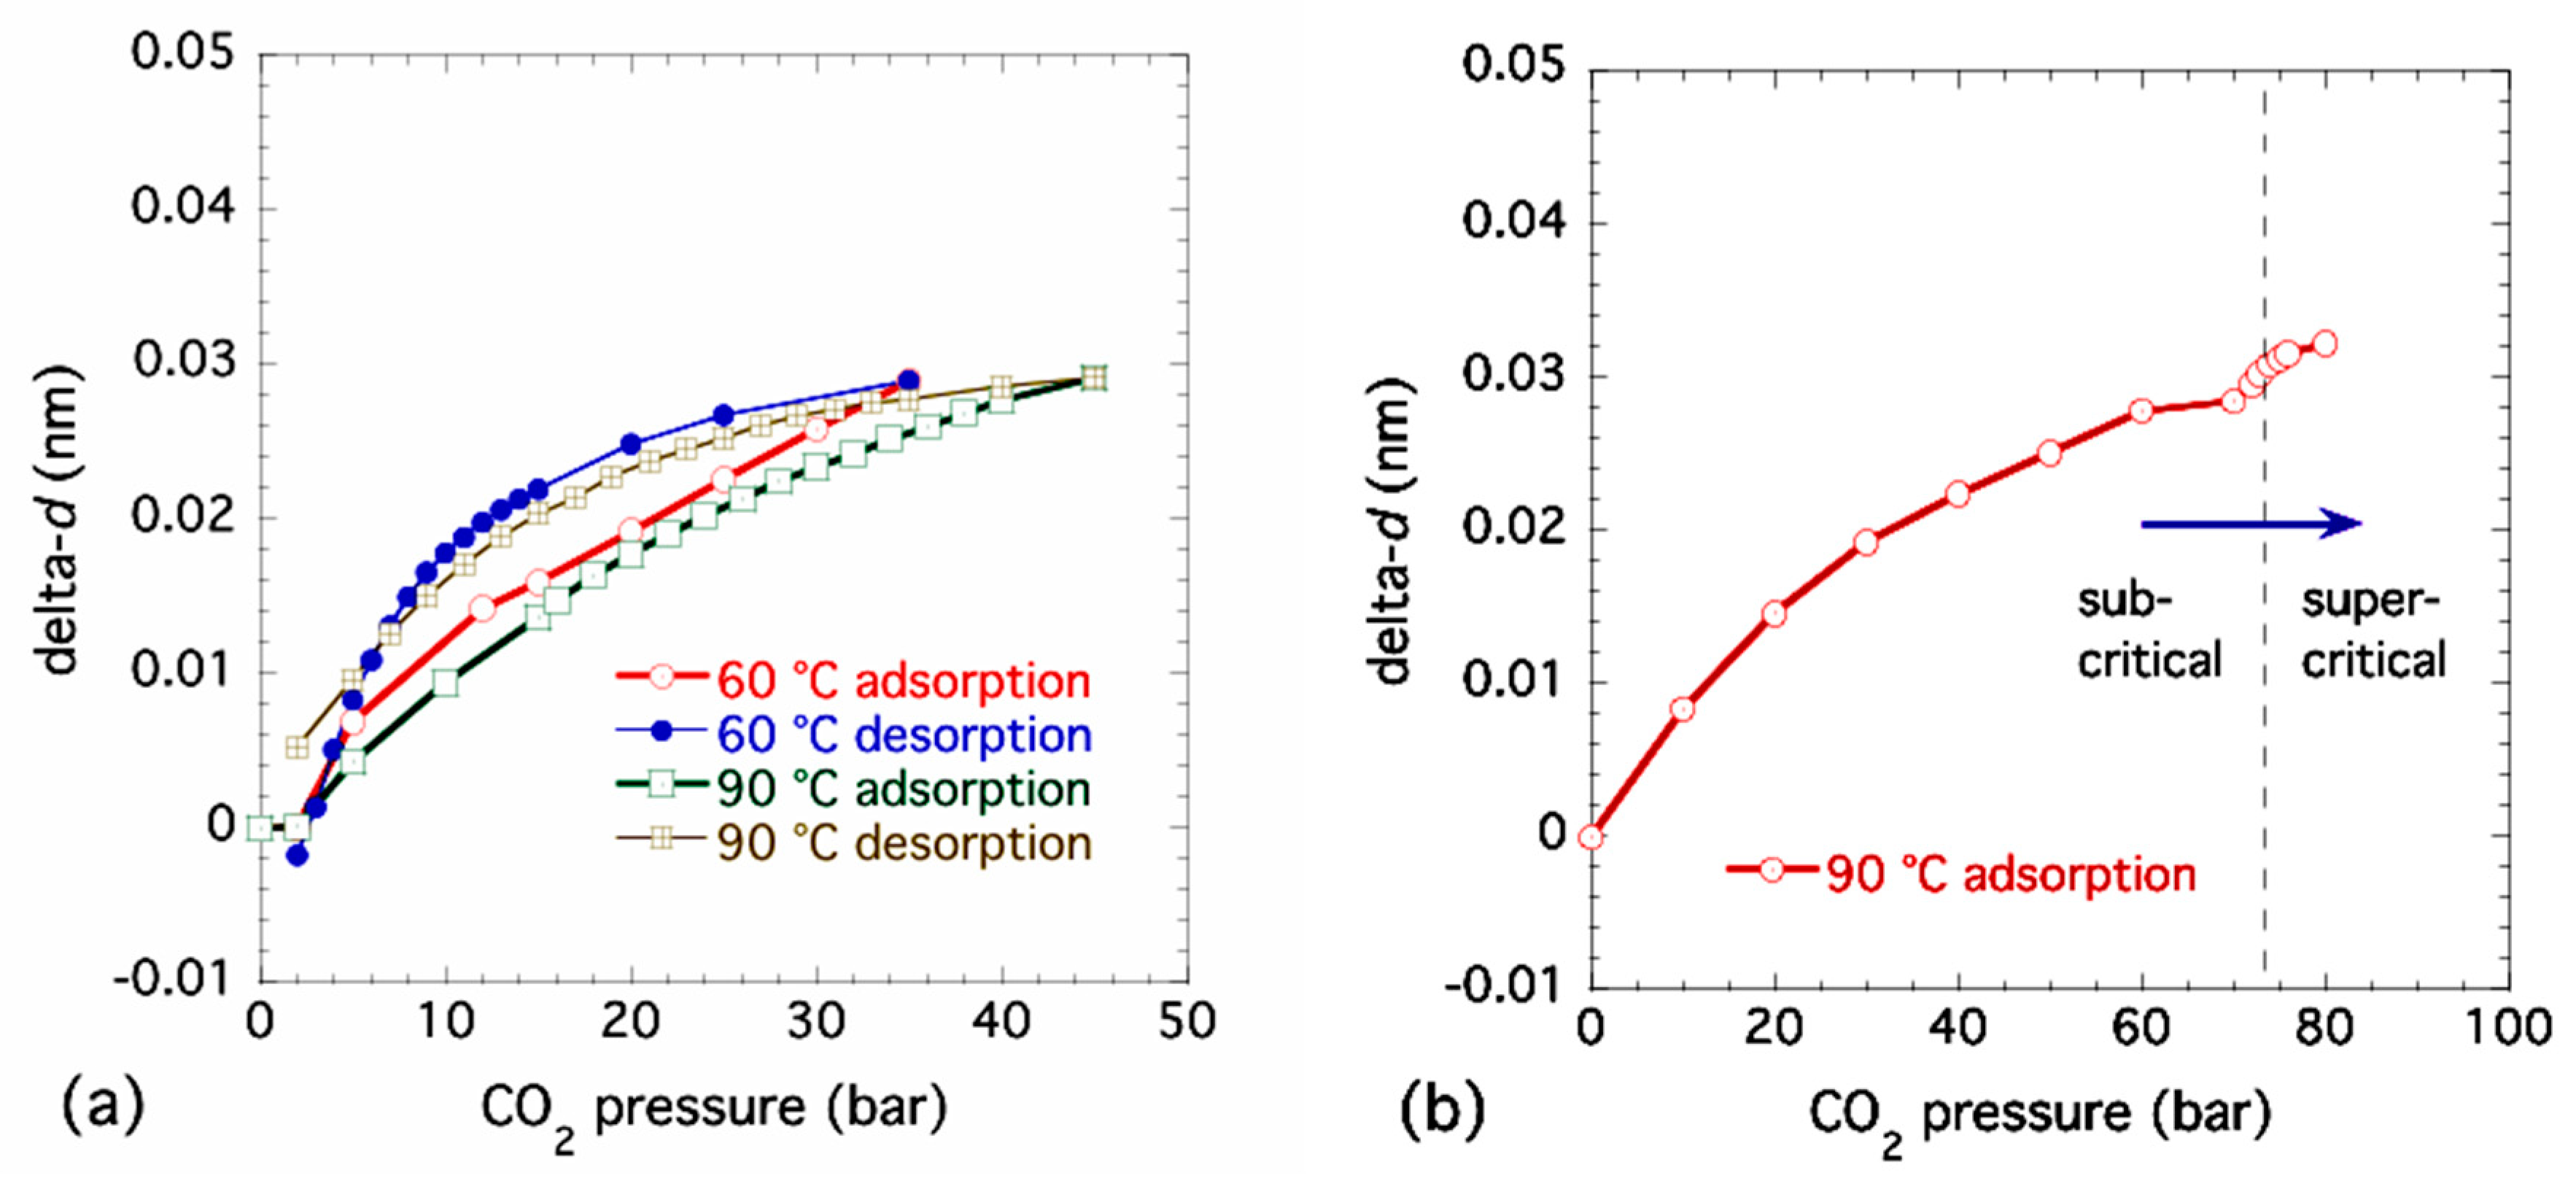
Figure 4a presents combined SAXS and WAXS data showing the XRD peaks on a linear–linear plot corresponding to the same sequence of increasing CO2 pressures at 90 °C as Figure 3a. Based on previous work and our unit cell interpretation employed here, some major peak assignments are also included. Figure 4b,c presents expanded plots of the Bpene linker (001) peak at q ≈ 5 nm−1 and the (221) XRD peak complex at q ≈ 13 nm−1. Clearly, several of the XRD peaks including the Bpene linker spacing XRD peak move to the left (smaller q, larger d-spacing) as the CO2 pressure is increased. (This contrasts with the case shown in the Supporting Information Figure S4). However, some XRD peaks show no change during adsorption or desorption. Changes in the (001) XRD peak linker d-spacing have been determined through Lorentzian peak fitting. Examples of this XRD peak fitting are given in the Supporting Information Figure S8. The changes in lattice spacing, delta-d, from the ambient (1-bar) d-value are plotted against CO2 pressure for new sub-critical adsorption and desorption measurements at both 60 °C and 90 °C in Figure 5a, where the increase in linker d-spacing on adsorption at these temperatures is (0.029 ± 0.001) nm. For a separate sample run, changes in linker d-spacing are shown in adsorption only with pressures increasing into the supercritical regime at 90 °C in Figure 5b. There is no corresponding desorption data at 90 °C as the final desorption was conducted at 60 °C. Allowing for the use of different powder samples and temperatures and inevitable small differences in starting conditions, these results are consistent with those presented earlier in Figure 2. We also note from Figure 4b and Figure 5b that the Bpene linker d-spacing undergoes a further expansion of ≈ 0.003 nm once is increased from 72 bar into the supercritical regime to 80 bar. This point is discussed in regard to DFT predictions of CO2 adsorption in NiBpene in Section 3.5.
3.4. Lattice Parameter Determination of NiBpene under Selected CO2 Pressure Conditions
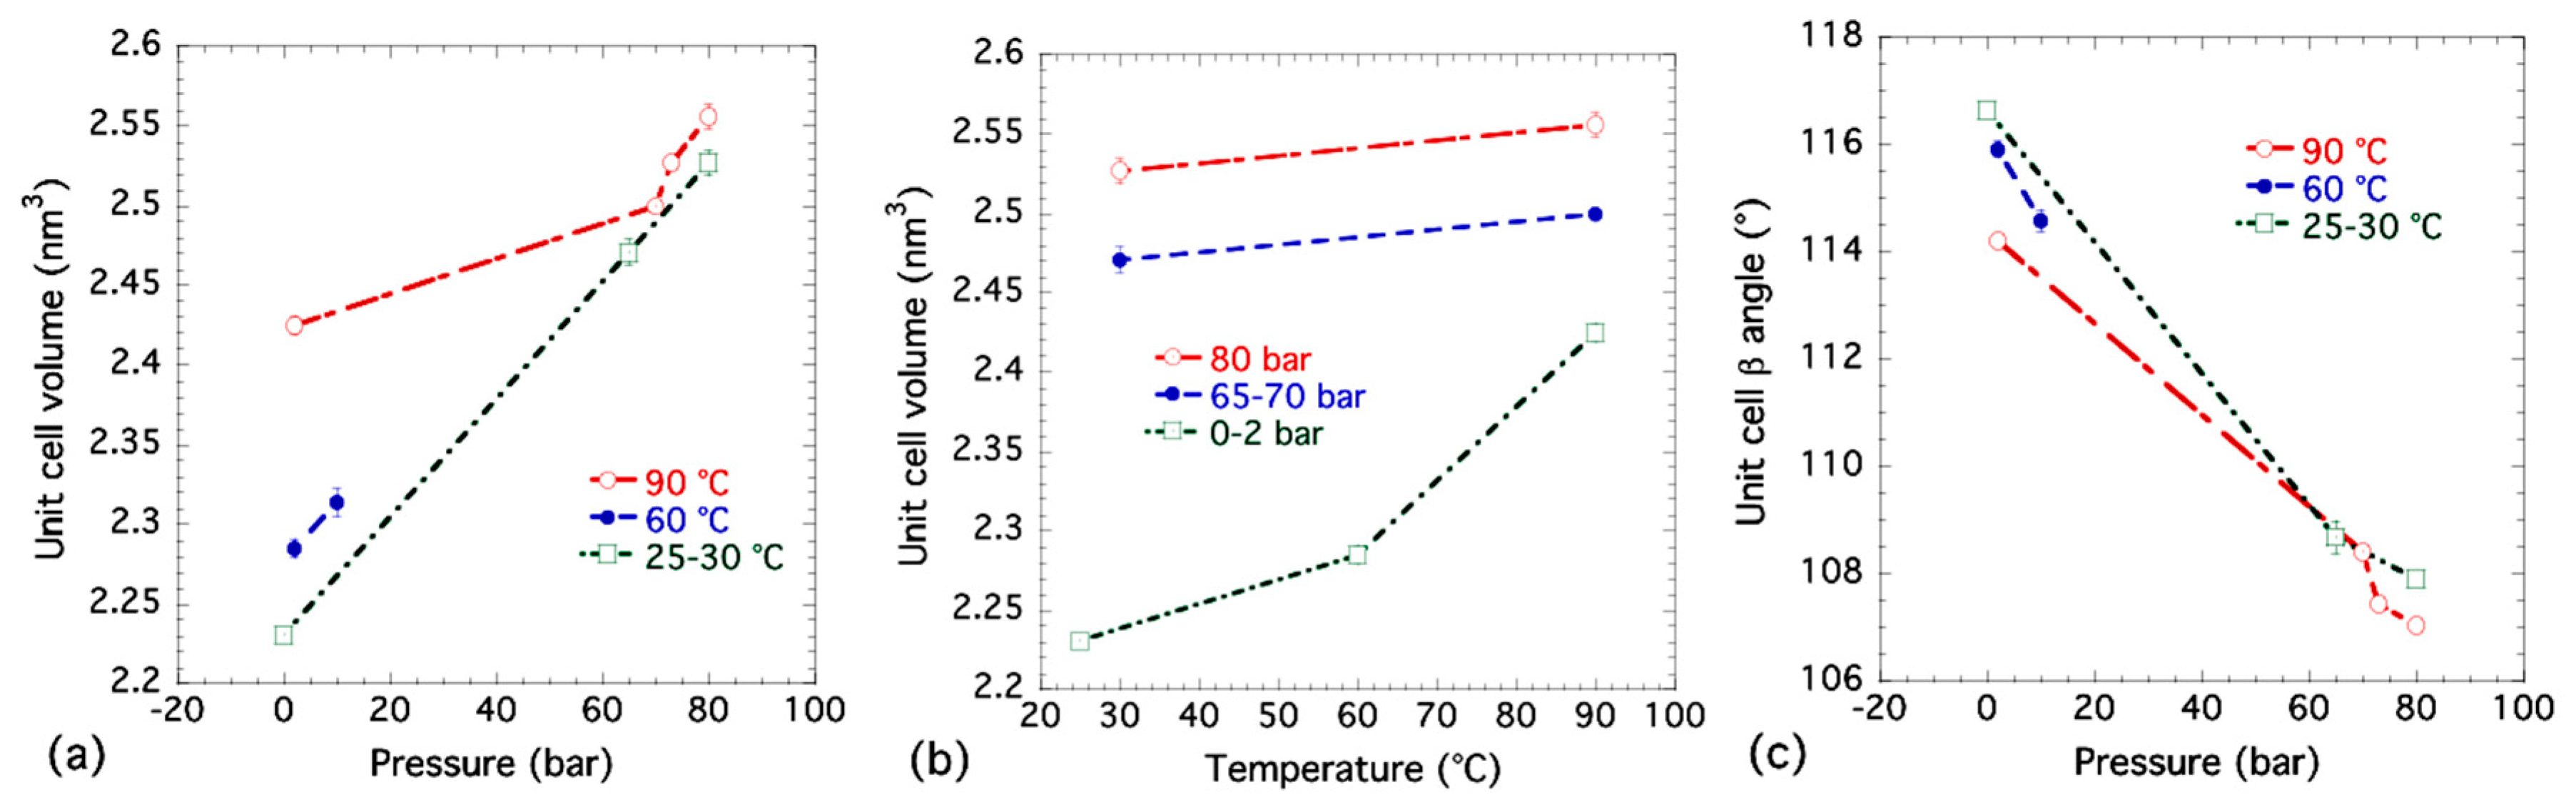
Table 1 gives results for least-squares refinements of eight selected XRD pattern datasets collected from the combined USAXS/SAXS/WAXS measurements. For datasets 1 to 4, datasets 5 and 6, and datasets 7 and 8, cell parameters are compared as a function of at fixed temperatures of 90 °C, 60 °C and 30 °C, respectively. Dataset 9 was measured at room temperature under ambient pressure. Figure 6 shows how the unit cell volume and β angle vary with pressure () and temperature (T). The general trends shown in the unit cell volume plots are that, as pressure is increased, the unit cell volume, V, also increases due to the greater number of CO2 molecules residing inside the unit cell. At the same time, the unit cell β angle decreases and moves closer to 90° indicating that the Bpene ligand is in a more perpendicular and upright orientation. Meanwhile, as temperature is increased, the unit cell volume generally expands in accordance with expected thermal expansion.
It appears that at the supercritical pressure (starting at 73 bar, 90 °C), the β angle starts to decrease more strongly with increased pressure while the unit cell volume increases more steeply. Among all of the eight selected XRD measurements, the β angle is smallest at the highest supercritical pressure used at 80 bar, even though it is still larger than the 97° found in the previous single crystal study where DMSO was the sorbate [44]. It is conceivable that the Bpene ligands interact with the DMSO molecules to open up the cavities within the NiBpene structure to a greater degree than occurs due to the packing of more polarizable CO2 molecules. The CO2 molecules have to align themselves to maximize their packing density within the structure, as discussed in connection with the DFT results. Even with supercritical CO2 pressures, the unit cell does not attain as high a volume as that found in the single crystal study with DMSO as the sorbate and with an extra Bpene ligand. This may simply be due to larger molecular cross sections for DMSO and Bpene guests compared to CO2.
3.5. DFT Model Results for NiBpene
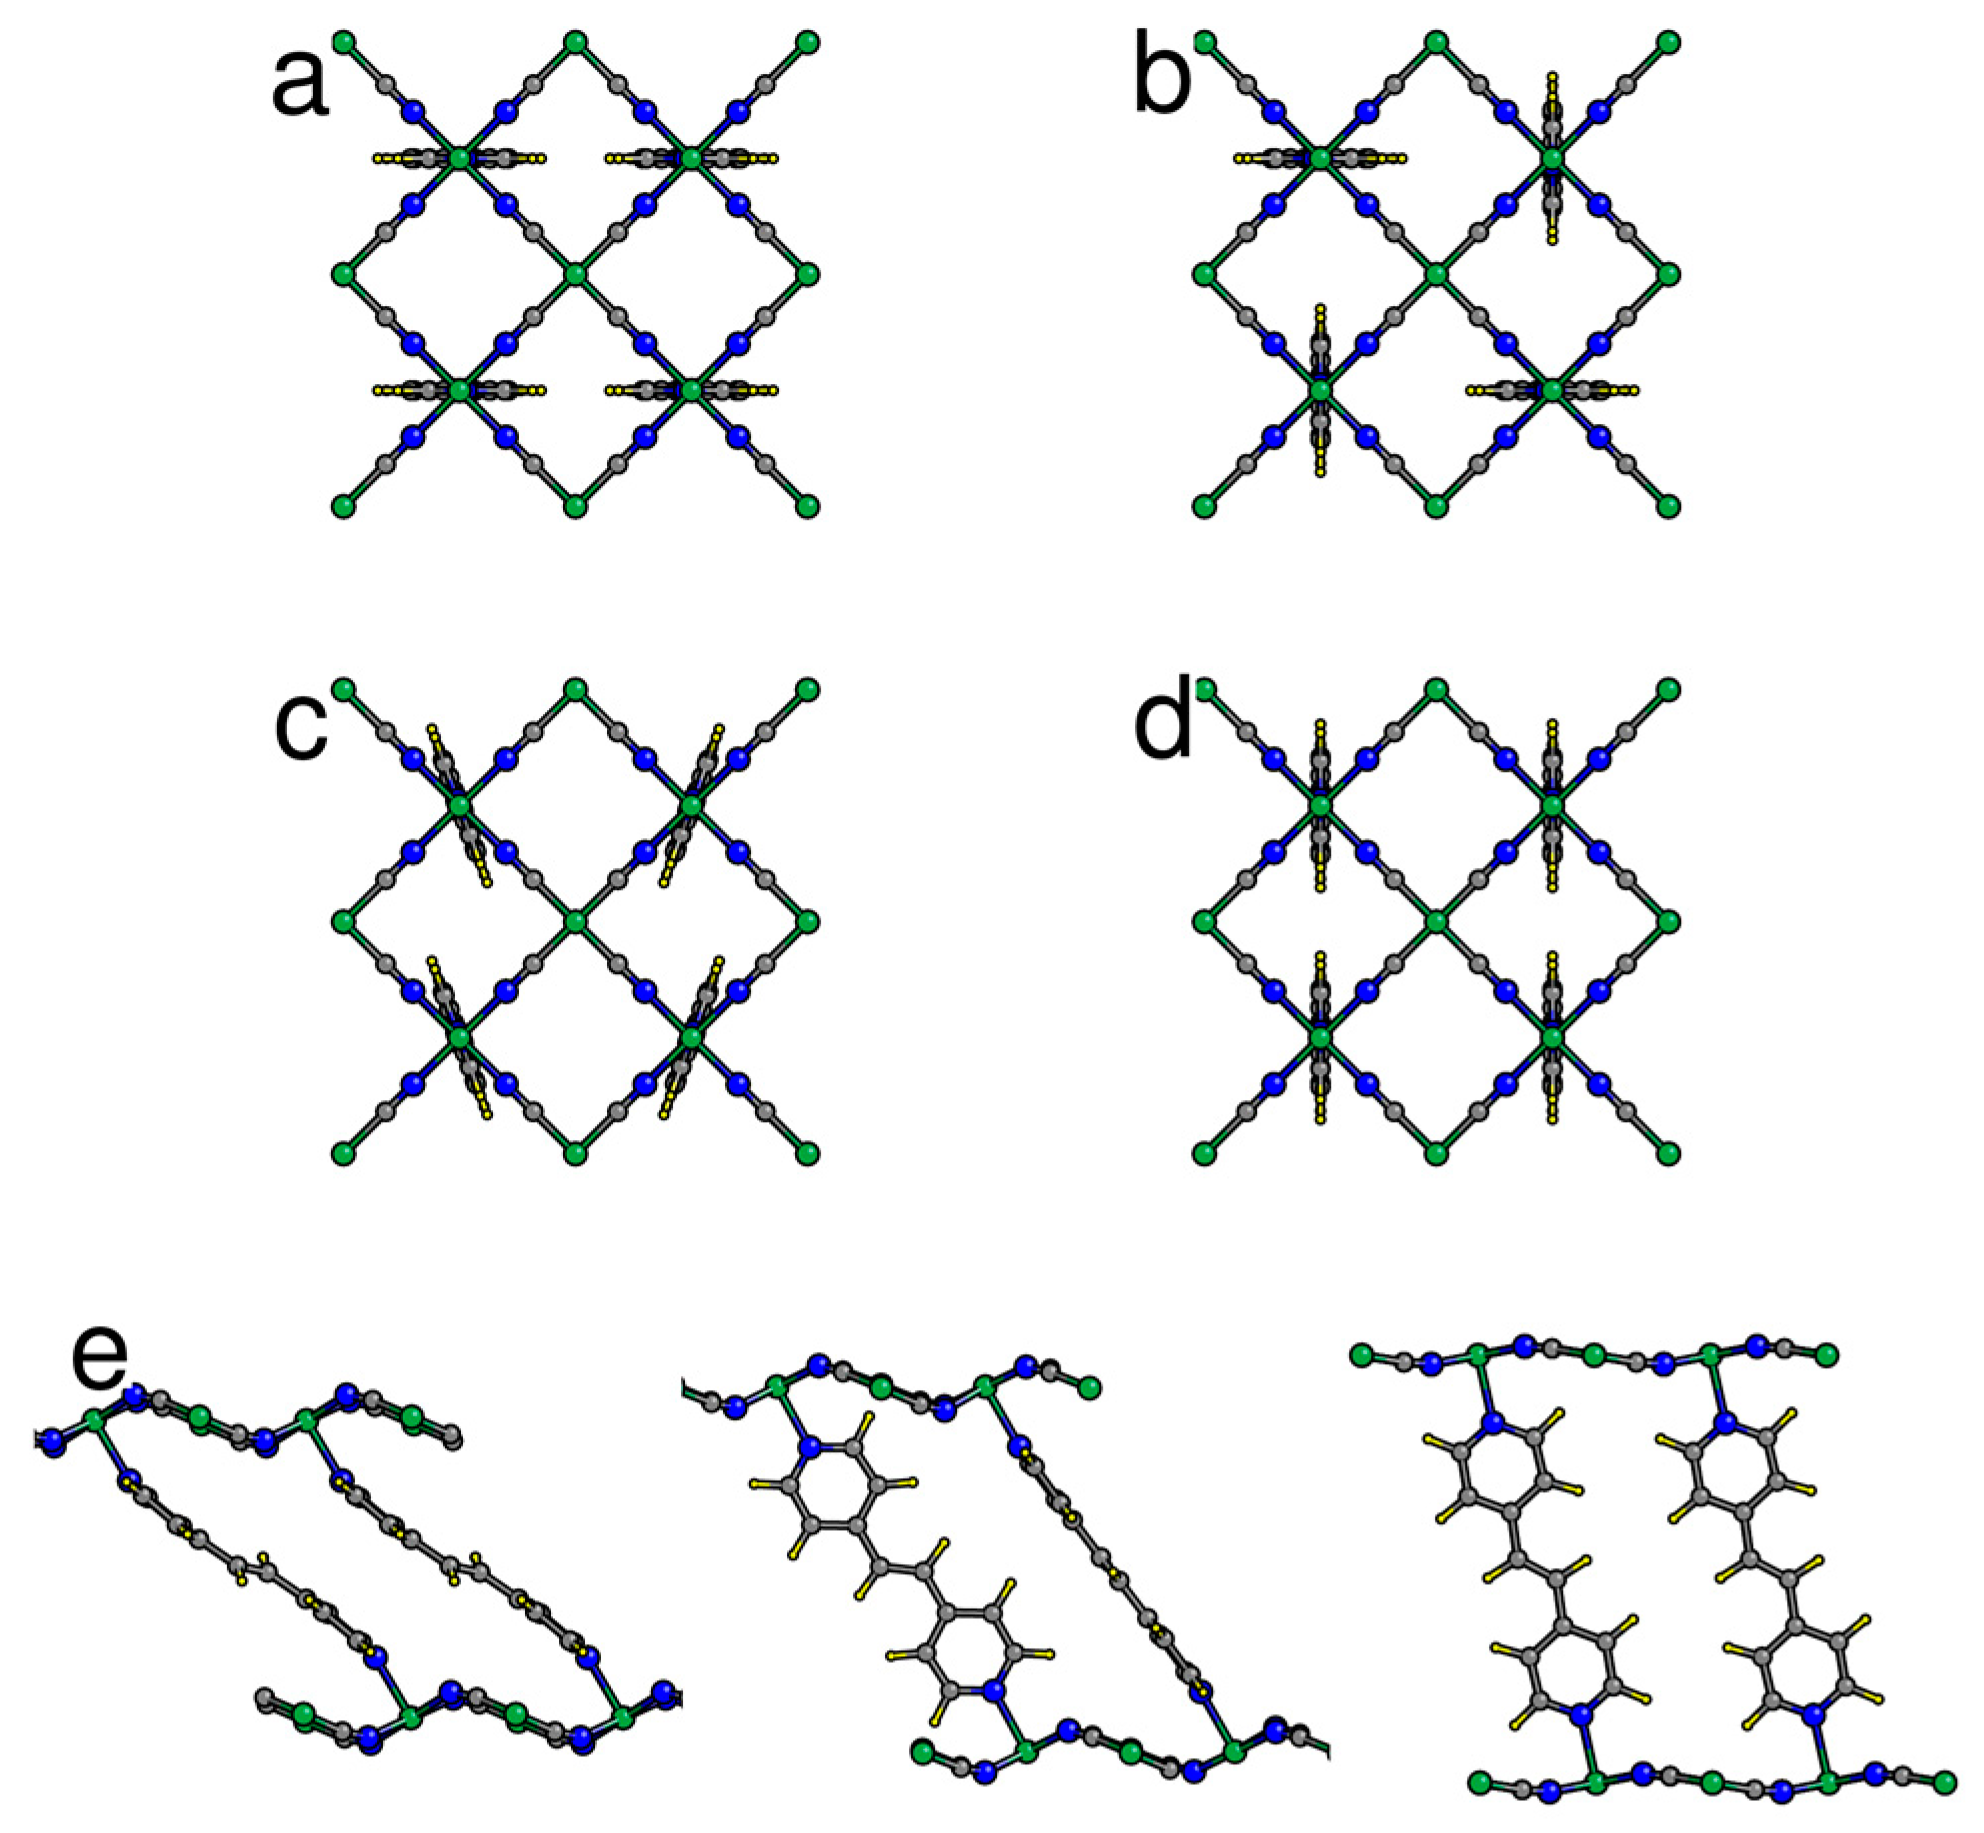
Individual Bpene molecules prefer to orient themselves such that the projected molecule in the bc plane extends along either the b or c direction (Figure 1). The barrier for 90° rotation of a single Bpene molecule is estimated to be about 0.35 eV. Four types of favorable collective ordering were found (Figure 1): (1) where all Bpene molecules have their projection along the b axis ([b] type); (2) where the projected orientations alternate along b and c ([bc] type), (3) [c] type, and (4) canted [c] type (Figure 1c) where the Bpene molecules rotate slightly to avoid interfering with their neighbors along the c direction. Note that the canted [c] type describes the orientation pattern of the bound Bpene molecules in the structure refinement of Wong-Ng et al. [44]. Note also that the Bpene molecule lacks 180° rotational symmetry around its long axis and thus, each Bpene in each structure shown in Figure 1 actually has two possible non-equivalent orientations. Here, we present results for the specific orientation patterns found with P2/c monoclinic symmetry and lowest energy.
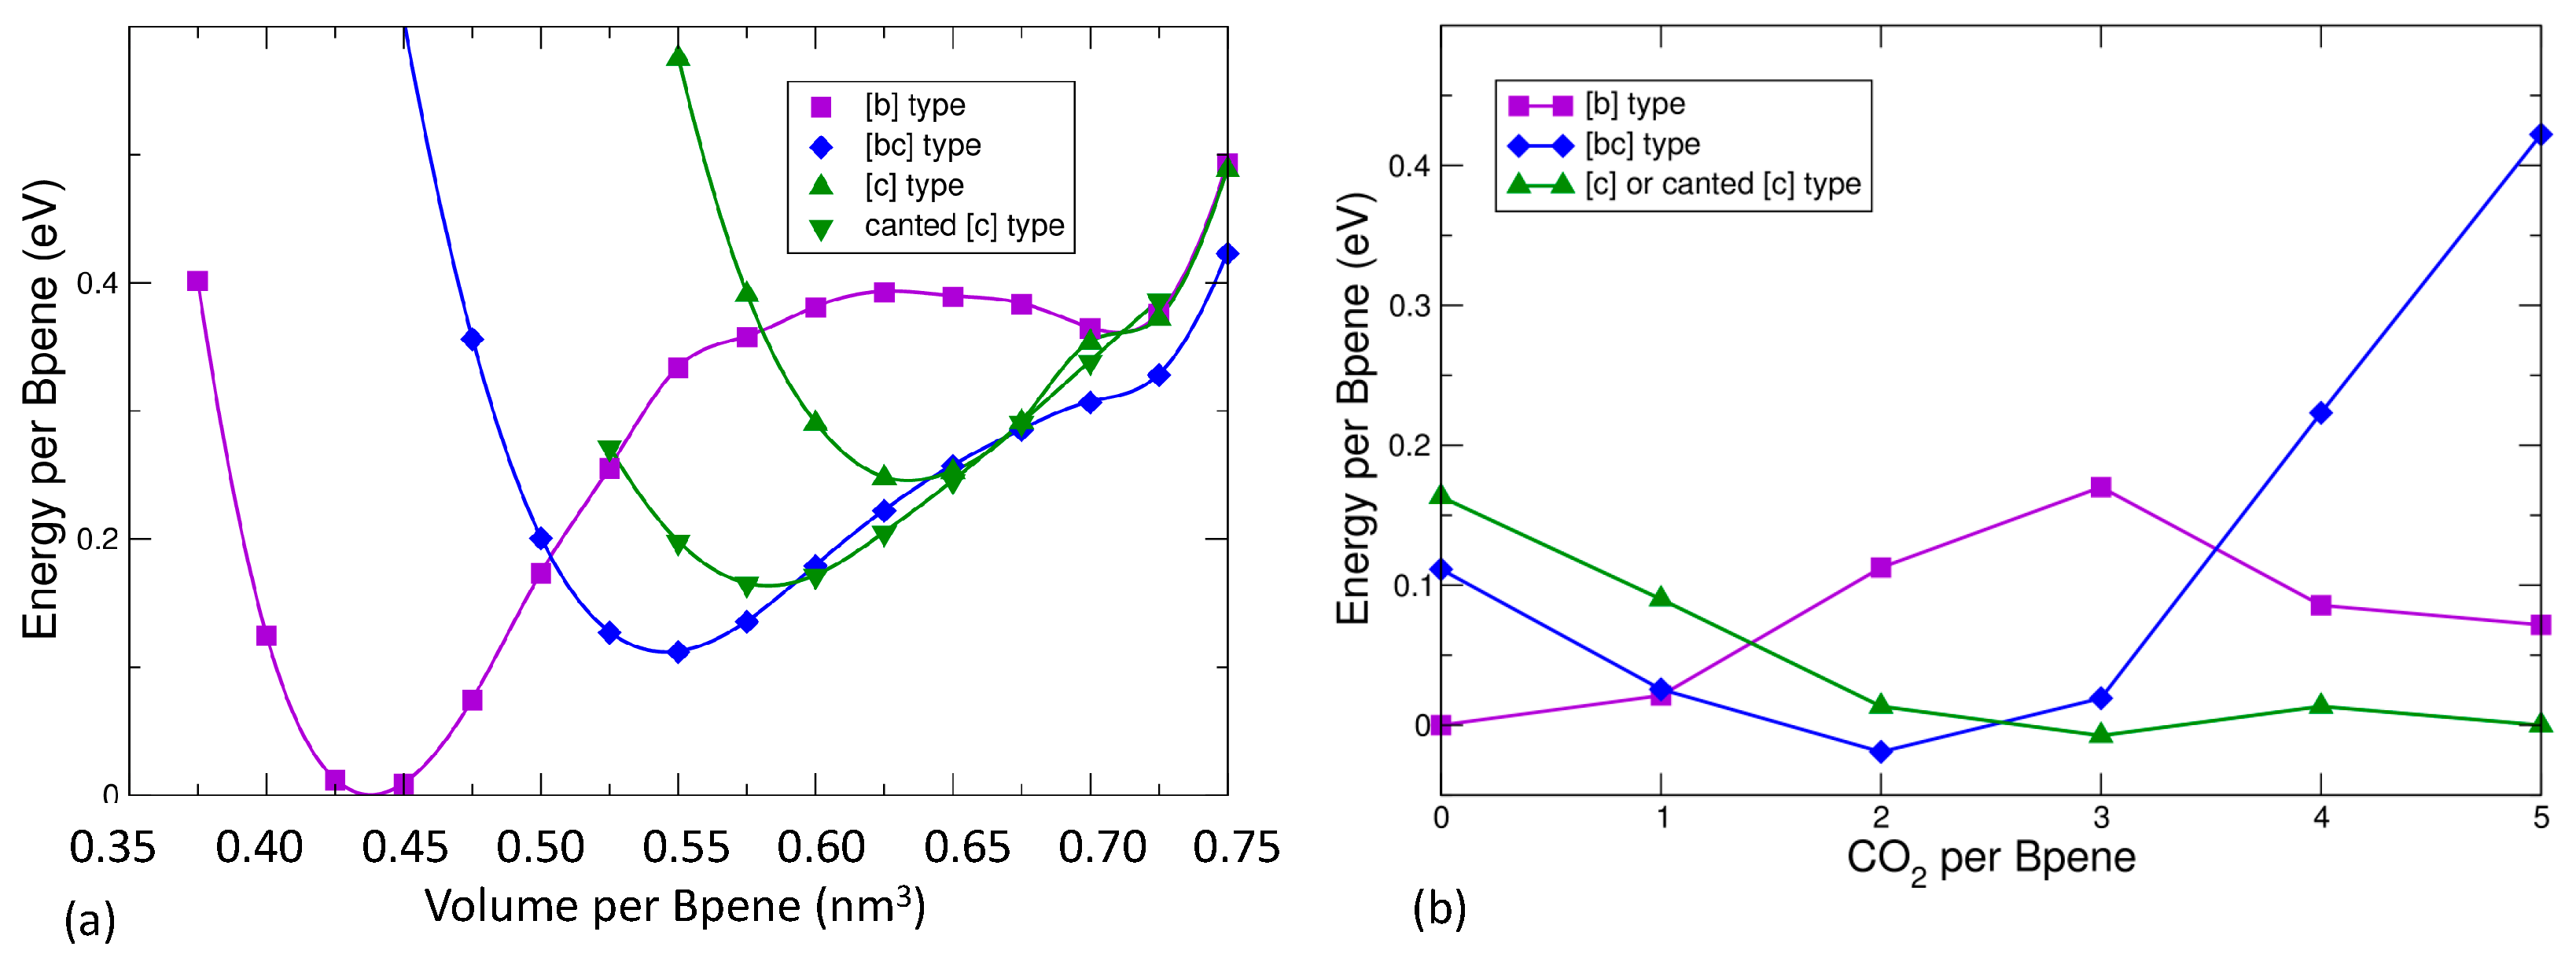
The experimental evidence is consistent with higher CO2 pressure leading to higher CO2 sorption leading to expansion of the unit cell volume and a decrease of the monoclinic β angle towards 90°. Prior to presenting the DFT results for CO2 sorption, Figure 7a gives the results of energy versus volume for an empty NiBpene structure. For completely empty NiBpene, DFT actually predicts a collapse of the structure to a volume of less than 0.45 nm3 per Bpene. As the volume increases, three transitions occur, to a [bc] type, then a canted [c] type, and finally back to a [bc] type. Note that these types of transitions may appear to be first-order; however, one needs other types of measurements (such as heat capability measurements) to corroborate any such conclusion. The predicted series of orientational ordering phase transitions is different when CO2 molecules are incorporated into the DFT calculations (Figure 7b). Now, a transition from a [b] type, to a [bc] type, to a canted [c] type, is predicted as the CO2 loading increases. No transition back to a [bc] type occurs because this orientational pattern (Figure 1b) has less empty volume for the CO2 molecules to occupy than the other types.
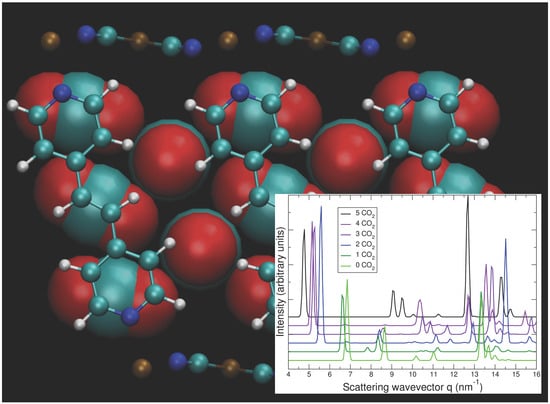
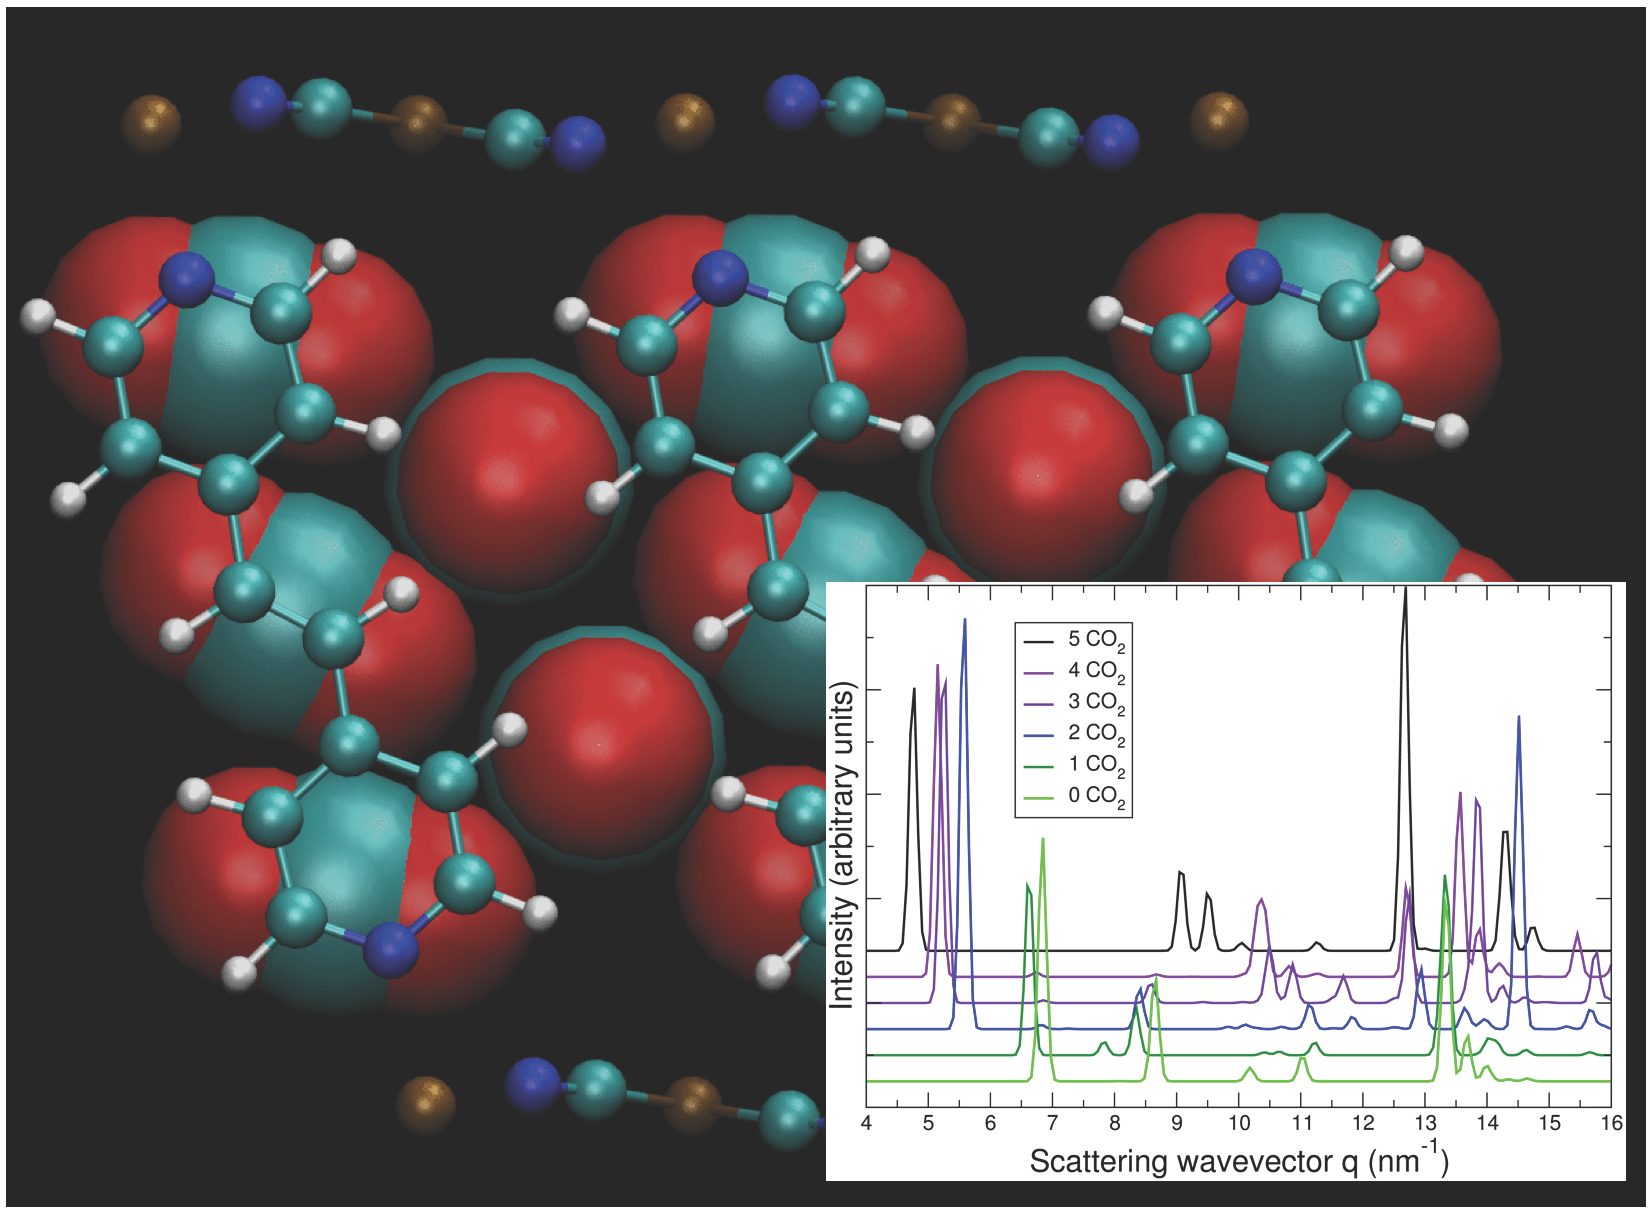
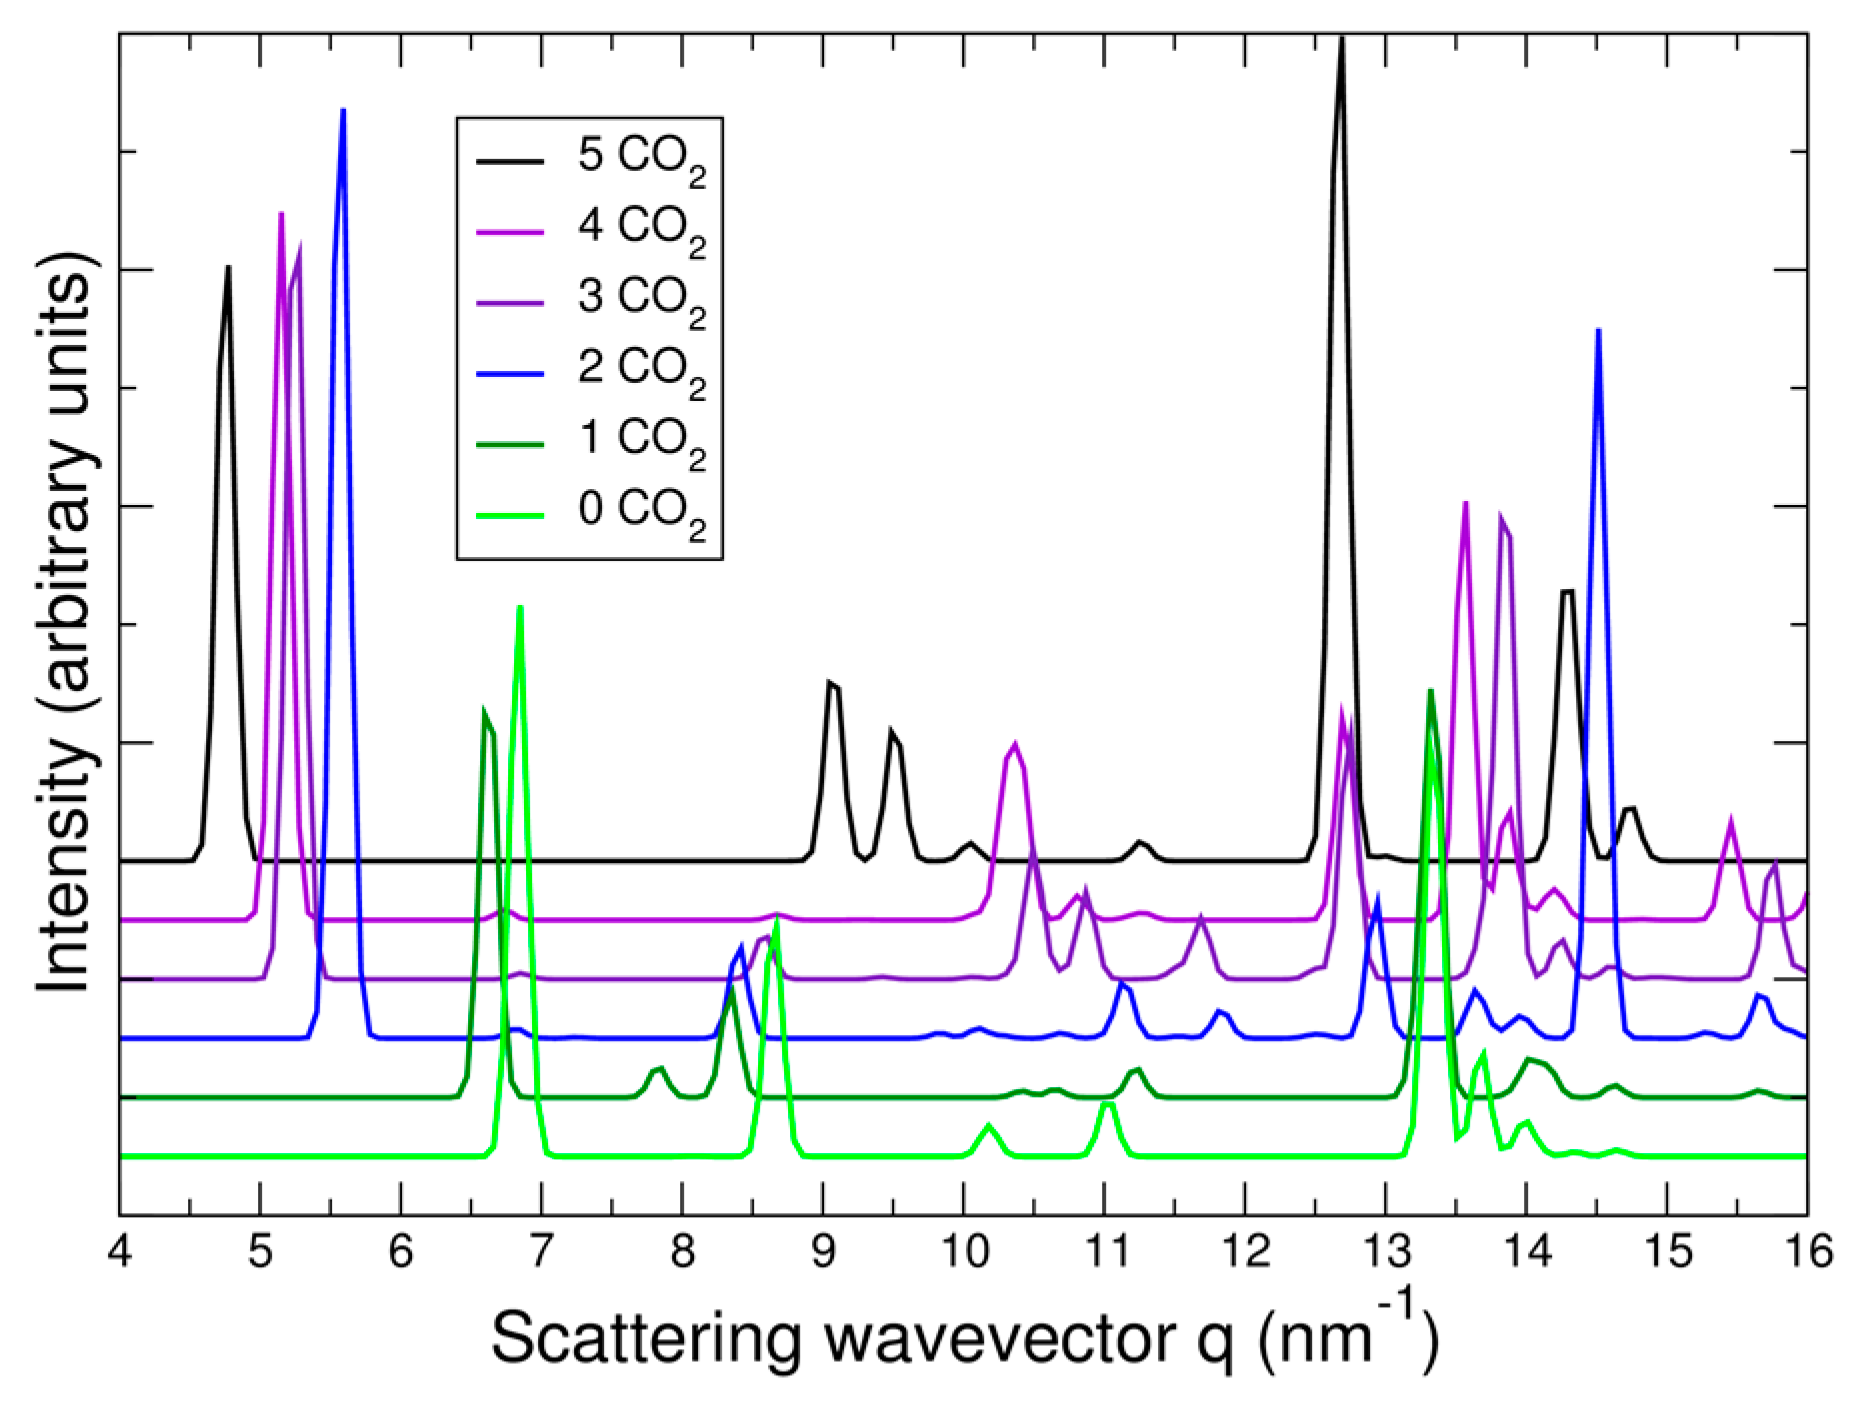
In Figure 8, the predicted cell volume versus CO2 loading is shown. Note that zero-point and thermal motion of the Bpene atoms and the CO2 are not included. These effects are expected to expand the volumes above the DFT predictions. In Figure 9, the simulated powder XRD patterns as a function of CO2 loading are shown based on the lowest-energy DFT structure at each CO2 loading. Atomic structure factors and Lorenz factors are included, but the unknown temperature factors are neglected. The simulated powder patterns show intriguing similarities to the experimental ones. The first strong peak is always the [100] peak, and the q-shifts of this peak inversely correlate with the distance between the Ni[CN]4 planes. A small peak near 6.8 nm−1 is sometimes visible and sometimes absent as is true experimentally. A set of specific diffraction peaks near this value are identified; these peaks have supercell [hkl] indices where k or l, or both, are odd, and will therefore be absent if the NiBpene structure has the translational symmetry of a 1.4 nm × 0.7 nm × 0.7 nm cell. It is interesting that the [bc] and canted [c] type Bpene arrangements of Figure 1 inherently lead to some supercell periodicity. However, more work is needed to make a quantitative agreement between the experimentally measured powder XRD patterns and structural models.
The calculated geometry of NiBpene loaded with 5 CO2 per Bpene is shown in Figure 10. It contains a packing of three CO2 aligned mostly along the c direction alternating with two CO2 aligned mostly along the b direction. DFT calculations show that it is energetically unfavorable for NiBpene to accommodate a sixth CO2 molecule per Bpene. These results compare with a maximum adsorption between 3 and 3.5 CO2 per Bpene, measured previously for sub-critical CO2 isotherms measured at 30 °C (Figure 2).
A thermodynamic analysis via DFT or classical modeling to fully bridge the DFT results with the experimental measurements would require advances in modeling far beyond the scope of this work. Note that existing thermodynamic modeling, e.g. Reference [70], generally focuses on systems with a “rigid” framework and that modeling of flexible MOFs is more difficult. Thermodynamic modeling of one flexible MOF system, MIL-53, has been successfully performed [71], but the Bpene orientational degrees of freedom make Ni-Bpene much more difficult to model, either here or in any future work. Here, the focus of our DFT studies has been to explore the coupling between the amount of CO2 adsorption, cell size, and Bpene orientational configuration in detail.
Adsorption of a single ad-molecule per Bpene for different molecules was investigated using a canted [c] type configuration with a volume of 0.575 nm3 per Bpene. CO2, N2, CH4, and H2 were all found to favor a position near the exposed Ni site. The calculated adsorption energies per molecule were 0.37 eV, 0.25 eV, 0.36 eV, and 0.13 eV, respectively. The DFT results, in combination with the XRD results suggest that CO2 sorption hysteresis are due to transitions between different ordering types of the Bpene molecules as the pressure changes, in line with the picture of Culp et al. [23]. The different ordering types have different periodic cells, leading to the appearance or disappearance of diffraction peaks. The effects observed for supercritical CO2 may be due to a transition from a canted [c] configuration to a [c] configuration concomitant with an increase of CO2 sorption to 5.0 per Bpene.
4. Concluding Discussion
In this paper, we have discussed the structural basis of CO2 adsorption in the MOF material: Ni(1,2-bis(4-pyridyl)ethylene)[Ni(CN)4] (NiBpene), a representative model flexible MOF exhibiting a CO2 sorption isotherm with characteristic hysteresis and features that can be associated with discrete structural changes. While our results have demonstrated a structural response in the case of pure CO2 adsorption and desorption, there is little or no change in the structure in the presence of pure N2, CH4 or H2 under static and flowing gas pressure conditions (at least over the pressure ranges tested), selective gas adsorption for CO2 with respect to N2, CH4 and H2 under dual gas static and flowing gas pressure conditions cannot be established. Further experimental work and DFT calculations are needed to determine a full explanation of why this is so. We have highlighted the importance of solving the MOF crystal structure, even if this varies for different guest species. This is because knowledge of the structural arrangement allows DFT to work with the near-neighbor bonds and force constants to make predictions regarding the structural response of the material during adsorption and desorption of guest species, and hence, to explain the observed structural transitions. Due to the hybrid nature of flexible MOFs, such predictions can be exploited to tune the overall host–guest interactions [72,73,74,75]. We note that DFT predicts different calculated adsorption energies per molecule for CO2 with respect to either N2 or H2, and this may underlie some preference of NiBpene for pure CO2 adsorption over these other two gases when CO2 is not present. The preference for pure CO2 adsorption over pure CH4 adsorption is less clear on this basis. However, it may originate, at least in part, from the different shape and size of the CH4 molecule with respect to CO2.
Using in situ operando small-angle neutron and X-ray scattering, neutron diffraction and X-ray diffraction, we have compared the structural effects of both single gas and dual gas adsorption and desorption at pressure, under both static (Sieverts) and gas flow conditions. We find these effects, including the possible cooperative gate-opening of one gas to allow another to adsorb, broadly consistent between static and flowing gas conditions. However, we note that single and dual gas flow conditions, with an effectively unlimited supply of the component gases, are much more likely than static Sieverts gas conditions to approximate the conditions under which these flexible MOF materials will be called to function.
Finally, we note the enhanced CO2 adsorption that appears to occur in NiBpene for gas pressures sufficiently high to put CO2 into the supercritical regime. This is manifest both in the enhanced expansion of the (001) linker d-spacing under these conditions and in the DFT calculations that suggest how the number of CO2 molecules per Bpene can be increased from the previously observed maximum of ≈4 to ≈5 CO2 molecules per Bpene. The potential efficiency of supercritical CO2 for solvent applications suggests that the exploitation of CO2 adsorption in the supercritical regime may provide an important role for such flexible MOF materials in the future.
Supplementary Materials
The following are available online at https://www.mdpi.com/2079-4991/9/3/354/s1, Figure S1: Schematic of USAXS/SAXS/WAXS measurement configurations with dual gas flow system; Figure S2: Schematic of USAXS/SAXS/WAXS measurement configuration with capillary sample cell and syringe pump; Figure S3: SANS diffraction peak fits for single and dual gas static conditions; Figure S4: Combined SAXS/WAXS XRD data for in situ pure H2 gas flow; Figure S5: Combined USAXS/SAXS data for in situ subcritical CO2 adsorption/desorption; Figure S6: Combined SAXS/WAXS XRD data for in situ subcritical CO2 adsorption/desorption; Figure S7: Detailed XRD data for combined (001)/(100) peak; Figure S8: Examples of XRD Lorentzian peak fits in SAXS/WAXS data. Also available is an electronic zip file containing: (i) Files in *cif format giving the minimum DFT energy structures for each CO2 loading factor from 0 to 5 in Ni-Bpene; (ii) Files in VASP POSCAR format giving the minimum DFT energy structures for each CO2 loading factor from 0 to 5 in Ni-Bpene; (iii) The VASP KPOINTS file used; (iv) A sample VASP INCAR file used for the relaxations; (v) Titles of the VASP pseudopotentials used; and (vi) A README file that links these Supplementary Information files to the manuscript and describes what each file contains.
Author Contributions
A.J.A., E.C. and W.W.-N. conceived and designed experiments and model simulations; A.J.A., W.W.-N., J.T.C. and C.M. performed experiments; A.A. and W.W.-N. analyzed data; J.T.C. and C.M. prepared samples; E.C. ran DFT calculations. All authors contributed to data interpretation and writing paper.
Funding
This research received no external funding.
Acknowledgments
The authors thank Laura Espinal of NIST’s Materials Measurement Science Division, as well as Juscelino Leao and Craig Brown of the NIST Center for Neutron Research, for valuable discussions and neutron experiment support. The authors also thank Ross Andrews, Ivan Kuzmenko and Jan Ilavsky of X-ray Science Division, Argonne National Laboratory, for valuable discussions and X-ray experiment support. This work utilized neutron scattering facilities supported in part by the National Science Foundation under Agreement No. DMR-0944772. Use of the Advanced Photon Source, an Office of Science User Facility operated for the U.S. Department of Energy (DOE) Office of Science by Argonne National Laboratory, was supported by the U.S. DOE under Contract No. DE-AC02-06CH11357. Certain commercial materials and equipment are identified in this paper only to specify adequately the experimental procedure. In no case does such identification imply recommendation by NIST nor does it imply that the material or equipment identified is necessarily the best available for this purpose. Reference in this work to any specific commercial product is to facilitate understanding and does not necessarily imply endorsement by the US Department of Energy.
Conflicts of Interest
The authors declare no conflict of interest. The founding sponsors had no role in the design of the study; in the collection, analyses, or interpretation of data; in the writing of the manuscript, and in the decision to publish the results.
References
- Yaghi, O.M.; O’Keeffe, M.; Ockwig, M.W.; Chae, H.K.; Eddaourdi, M.; Kim, J. Reticular synthesis and the design of new materials. Nature 2003, 423, 705–714. [Google Scholar] [CrossRef] [PubMed]
- Li, J.-R.; Ma, Y.G.; McCarthy, M.C.; Sculley, J.; Yu, J.; Jeong, H.-K.; Balbuena, P.B. Carbon dioxide capture-related gas adsorption and separation in metal-organic frameworks. Coord. Chem. Rev. 2011, 255, 1791–1823. [Google Scholar] [CrossRef]
- Sumida, K.; Rogow, D.L.; Mason, J.A.; McDonald, T.M.; Bloch, E.D.; Herm, Z.R.; Bae, T.-H.; Long, J.R. Carbon dioxide capture in metal–organic frameworks. Chem. Rev. 2012, 112, 724–781. [Google Scholar] [CrossRef] [PubMed]
- Schneemann, A.; Bon, V.; Schwedler, I.; Senkovska, I.; Kaskel, S.; Fischer, R.A. Flexible metal–organic frameworks. Chem. Soc. Rev. 2014, 43, 6062–6096. [Google Scholar] [CrossRef] [PubMed] [Green Version]
- Adil, K.; Belmabkhout, Y.; Pillai, R.S.; Cadiau, A.; Bhatt, P.M.; Assen, A.H.; Maurin, G.; Eddaoudi, M. Gas/vapor separation using ultra-microporous metal-organic frameworks: Insights into the structure/separation relationship. Chem. Soc. Rev. 2017, 46, 3402–3430. [Google Scholar] [CrossRef] [PubMed]
- Mueller, U.; Schubert, M.; Teich, F.; Puetter, H.; Schierle-Arndt, K.; Pastré, J. Metal-organic frameworks—Prospective industrial applications. J. Mater. Chem. 2006, 16, 626–636. [Google Scholar] [CrossRef]
- Zhu, Q.L.; Xu, Q. Metal-organic framework composites. Chem. Soc. Rev. 2014, 43, 5468–5512. [Google Scholar] [CrossRef] [PubMed]
- Xia, W.; Mahmood, A.; Zou, R.Q.; Xu, Q. Metal-organic frameworks and their derived nanostructures for electrochemical energy storage and conversion. Energy Environ. Sci. 2015, 8, 1837–1866. [Google Scholar] [CrossRef]
- Mason, J.A.; Veenstra, M.; Long, J.R. Evaluating metal–organic frameworks for natural gas storage. Chem. Sci. 2014, 5, 32–51. [Google Scholar] [CrossRef] [Green Version]
- Sun, L.; Campbell, M.G.; Dinca, M. Electrically conductive porous metal-organic frameworks. Angew. Chem. Int. Ed. 2016, 55, 3566–3579. [Google Scholar] [CrossRef] [PubMed]
- Coudert, F.-X.; Jeffroy, M.; Alain, H.; Fuchs, M.A.; Boutin, A.; Mellot-Draznieks, C. Thermodynamics of guest-induced structural transitions in hybrid organic—Inorganic frameworks. J. Am. Chem. Soc. 2008, 130, 14294–14302. [Google Scholar] [CrossRef] [PubMed]
- Klein, N.; Hoffmann, H.C.; Cadiau, A.; Getzschmann, J.; Lohe, M.R.; Paasch, S.; Heydenreich, T.; Adil, K.; Senkovska, I.; Brunner, E.; et al. Structural flexibility and intrinsic dynamics in the M-2(2,6-ndc)(2)(dabco) (M = Ni, Cu, Co, Zn) metal-organic frameworks. J. Mater. Chem. 2012, 22, 10303–10312. [Google Scholar] [CrossRef]
- Mason, J.A.; Oktawiec, J.; Taylor, M.K.; Hudson, M.R.; Rodriguez, J.; Bachman, J.E.; Gonzalez, M.I.; Cervellino, A.; Guagliardi, A.; Brown, C.M.; et al. Methane storage in flexible metal–organic frameworks with intrinsic thermal management. Nature 2015, 527, 357–361. [Google Scholar] [CrossRef] [PubMed]
- Liu, D.H.; Liu, T.F.; Chen, Y.P.; Zou, L.F.; Feng, D.W.; Wang, K.C.; Zhang, Q.; Yuan, S.; Zhong, C.L.; Zhou, H.C. A Reversible crystallinity-preserving phase transition in metal-organic frameworks: Discovery, mechanistic studies, and potential applications. J. Am. Chem. Soc. 2015, 137, 7740–7746. [Google Scholar] [CrossRef] [PubMed]
- Banerjee, D.; Wang, H.; Plonka, A.M.; Emge, T.J.; Parise, J.B.; Li, J. Direct structural identification of gas induced gate-opening coupled with commensurate adsorption in a microporous metal-organic framework. Chem. A Eur. J. 2016, 22, 11816–11825. [Google Scholar] [CrossRef] [PubMed]
- Tanaka, D.; Nakagawa, K.; Higuchi, M.; Horike, S.; Kubota, Y.; Kobayashi, L.C.; Takata, M.; Kitagawa, S. Kinetic gate-opening process in a flexible porous coordination polymer. Angew. Chem. Int. Ed. 2008, 47, 3914–3918. [Google Scholar] [CrossRef] [PubMed]
- Seo, J.; Matsuda, R.; Sakamoto, H.; Bonneau, C.; Kitagawa, S. A pillared-layer coordination polymer with a rotatable pillar acting as a molecular gate for guest molecules. J. Am. Chem. Soc. 2009, 131, 12792–12800. [Google Scholar] [CrossRef] [PubMed]
- Nijem, N.; Wu, H.H.; Canepa, P.; Marti, A.; Balkus, K.J.; Thonhauser, T.; Li, J.; Chabal, Y.J. Tuning the gate opening pressure of metal-organic frameworks (MOFs) for the selective separation of hydrocarbons. J. Am. Chem. Soc. 2012, 134, 15201–15204. [Google Scholar] [CrossRef] [PubMed]
- Suzuki, T.; Kotani, R.; Kondo, A.; Maeda, K. Structural investigation of a flexible MOF [Cu(BF4)(2)(1,3-bis(4-pyridyl)propane)(2)] showing selective gate adsorption with dynamic pore-opening/pore-closing processes. J. Phys. Chem. C 2016, 120, 21571–21579. [Google Scholar] [CrossRef]
- Elsaidi, S.K.; Mohamed, M.H.; Banerjee, D.; Thallapally, P.K. Flexibility in metal-organic frameworks: A fundamental understanding. Coord. Chem. Rev. 2018, 358, 125–152. [Google Scholar] [CrossRef]
- Yamada, K.; Tanaka, H.; Yagishita, S.; Adachi, K.; Uemura, T.; Kitagawa, S.; Kawata, S. Stepwise guest adsorption with large hysteresis in a coordination polymer {[Cu(bhnq)(THF)(2)](THF)}(n) constructed from a flexible hingelike ligand. Inorg. Chem. 2006, 45, 4322–4324. [Google Scholar] [CrossRef] [PubMed]
- Choi, H.J.; Dinca, M.; Long, J.R. Broadly hysteretic H-2 adsorption in the microporous metal-organic framework Co(1,4-benzenedipyrazolate). J. Am. Chem. Soc. 2008, 130, 7848–7850. [Google Scholar] [CrossRef] [PubMed]
- Culp, J.T.; Smith, M.R.; Bittner, E.; Bockrath, B. Hysteresis in the physisorption of CO2 and N2 in a flexible pillared layer nickel cyanide. J. Am. Chem. Soc. 2008, 130, 12427–12434. [Google Scholar] [CrossRef] [PubMed]
- Seo, J.; Chun, H. Hysteretic gas sorption in a microporous metal-organic framework with nonintersecting 3D channels. Euro. J. Inorg. Chem. 2009, 33, 4946–4949. [Google Scholar] [CrossRef]
- Wu, H.H.; Thibault, C.G.; Wang, H.; Cychosz, K.A.; Thommes, M.; Li, J. Effect of temperature on hydrogen and carbon dioxide adsorption hysteresis in an ultramicroporous MOF. Microporous Mesoporous Mater. 2016, 219, 186–189. [Google Scholar] [CrossRef] [Green Version]
- Ramsahye, N.A.; Trung, T.K.; Bourrelly, S.; Yang, Q.Y.; Devic, T.; Maurin, G.; Horcajada, P.; Llewellyn, P.L.; Yot, P.; Serre, C.; et al. Influence of the organic ligand functionalization on the breathing of the porous iron terephthalate metal-organic framework type material upon hydrocarbon adsorption. J. Phys. Chem. C 2011, 115, 18683–18695. [Google Scholar] [CrossRef]
- Mu, B.; Li, F.; Huang, Y.G.; Walton, K.S. Breathing effects of CO2 adsorption on a flexible 3D lanthanide metal-organic framework. J. Mater. Chem. 2012, 22, 10172–10178. [Google Scholar] [CrossRef]
- Chen, L.J.; Mowat, J.P.S.; Fairen-Jimenez, D.; Morrison, C.A.; Thompson, S.P.; Wright, P.A.; Duren, T. Elucidating the breathing of the metal-organic framework MIL-53(Sc) with ab Initio molecular dynamics simulations and in situ X-ray powder diffraction experiments. J. Am. Chem. Soc. 2013, 135, 15763–15773. [Google Scholar] [CrossRef] [PubMed]
- Lama, P.; Aggarwal, H.; Bezuidenhout, C.X.; Barbour, L.J. Giant hysteretic sorption of CO2: In situ crystallographic visualization of guest binding within a breathing framework at 298 K. Angew. Chem. Int. Ed. 2016, 55, 13271–13275. [Google Scholar] [CrossRef] [PubMed]
- Shi, Y.X.; Li, W.X.; Zhang, W.H.; Lang, J.P. Guest-induced switchable breathing behavior in a flexible metal-organic framework with pronounced negative gas pressure. Inorg. Chem. 2018, 57, 8627–8633. [Google Scholar] [CrossRef] [PubMed]
- Li, J.-R.; Kuppler, R.J.; Zhou, H.-C. Selective gas adsorption and separation in metal–organic frameworks. Chem. Soc. Rev. 2009, 38, 1477–1504. [Google Scholar] [CrossRef] [PubMed]
- Yang, S.H.; Lin, X.; Lewis, W.; Suyetin, M.; Bichoutskaia, E.; Parker, J.E.; Tang, C.C.; Allan, D.R.; Rizkallah, P.J.; Hubberstey, P.; et al. A partially interpenetrated metal-organic framework for selective hysteretic sorption of carbon dioxide. Nat. Mater. 2012, 11, 710–716. [Google Scholar] [CrossRef] [PubMed]
- Culp, J.T.; Sui, L.; Goodman, A.; Luebke, D. Carbon dioxide (CO2) absorption behavior of mixed matrix polymer composites containing a flexible coordination polymer. J. Coll. Int. Sci. 2013, 393, 278–285. [Google Scholar] [CrossRef] [PubMed]
- Simon, C.M.; Braun, E.; Carraro, C.; Smit, B. Statistical mechanical model of gas adsorption in porous crystals with dynamic moieties. Proc. Natl. Acad. Sci. USA 2017, 114, E287–E296. [Google Scholar] [CrossRef] [PubMed] [Green Version]
- Yang, H.Y.; Li, Y.Z.; Jiang, C.Y.; Wang, H.H.; Hou, L.; Wang, Y.Y.; Zhu, Z.H. An interpenetrated pillar-layered metal-organic framework with novel clusters: Reversible structural transformation and selective gate-opening adsorption. Cryst. Growth Des. 2018, 18, 3044–3050. [Google Scholar] [CrossRef]
- Coudert, F.-X. Responsive metal–organic frameworks and framework materials: Under pressure, taking the heat, in the spotlight, with friends. Chem. Mater. 2015, 27, 1905–1916. [Google Scholar] [CrossRef]
- Bennett, T.D.; Cheetham, A.K. Amorphous metal-organic frameworks. Acc. Chem. Res. 2014, 47, 1555–1562. [Google Scholar] [CrossRef] [PubMed]
- Kauffman, K.L.; Culp, J.T.; Allen, A.J.; Espinal, L.; Wong-Ng, W.; Brown, T.D.; Goodman, A.; Bernardo, M.P.; Pancoast, R.J.; Chirdon, D.; et al. Selective adsorption of CO2 from light gas mixtures by using a structurally dynamic porous coordination polymer. Angew. Chem. Int. Ed. 2011, 50, 10888–10892. [Google Scholar] [CrossRef] [PubMed]
- Culp, J.T.; Madden, C.; Kauffman, K.; Shi, F.; Matranga, C. Screening Hofmann compounds as CO2 sorbents: Nontraditional synthetic route to over 40 different pore-functionalized and flexible pillared cyanonickelates. Inorg. Chem. 2013, 52, 4205–4216. [Google Scholar] [CrossRef] [PubMed]
- Wong-Ng, W.; Culp, J.T.; Chen, Y.S. Crystallography of representative MOFs based on pillared cyanonickelate (PICNIC) architecture. Crystals 2016, 6, 108. [Google Scholar] [CrossRef]
- Bury, W.; Fairen-Jimenez, D.; Lalonde, M.B.; Snurr, R.Q.; Farha, O.K.; Hupp, J.T. Control over catenation in pillared paddlewheel metal-organic framework materials via solvent-assisted linker exchange. Chem. Mater. 2013, 25, 739–744. [Google Scholar] [CrossRef]
- Luo, X.L.; Yin, Z.; Zeng, M.H.; Kurmoo, M. The construction, structures, and functions of pillared layer metal-organic frameworks. Inorg. Chem. Front. 2016, 3, 1208–1226. [Google Scholar] [CrossRef]
- Culp, J.T.; Natesakhawat, S.; Smith, M.R.; Bittner, E.; Matranga, C.; Bockrath, B. Hydrogen storage properties of rigid three-dimensional Hofmann clathrate derivatives: The effects of pore size. J. Phys. Chem. C 2008, 112, 7079–7083. [Google Scholar] [CrossRef]
- Wong-Ng, W.; Culp, J.T.; Chen, Y.S.; Zavalij, P.; Espinal, L.; Siderius, D.W.; Allen, A.J.; Scheins, S.; Matranga, C. Improved synthesis and crystal structure of the flexible pillared layer porous coordination polymer: Ni(1,2-bis(4-pyridyl)ethylene)[Ni(CN)(4)]. Crystengcom 2013, 15, 4684–4693. [Google Scholar] [CrossRef]
- Allen, A.J.; Espinal, L.; Wong-Ng, W.; Queen, W.L.; Brown, C.M.; Kline, S.R.; Kauffman, K.L.; Culp, J.T.; Matranga, C. Flexible metal-organic framework compounds: In situ studies for selective CO2 capture. J. Alloy. Compd. 2015, 647, 24–34. [Google Scholar] [CrossRef]
- Espinal, L.; Wong-Ng, W.; Kaduk, J.A.; Allen, A.J.; Snyder, C.R.; Chiu, C.; Siderius, D.W.; Li, L.; Cockayne, E.; Espinal, A.E.; et al. Time-dependent CO2 sorption hysteresis in a one-dimensional microporous octahedral molecular sieve. J. Am. Chem. Soc. 2012, 134, 7944–7951. [Google Scholar] [CrossRef] [PubMed]
- Ilavsky, J.; Jemian, P.R.; Allen, A.J.; Zhang, F.; Levine, L.E.; Long, G.G. Ultra-small-angle X-ray scattering at the Advanced Photon Source. J. Appl. Cryst. 2009, 42, 469–479. [Google Scholar] [CrossRef]
- Ilavsky, J.; Zhang, F.; Allen, A.J.; Levine, L.E.; Jemian, P.R.; Long, G.G. Ultra-small-angle X-ray scattering instrument at the Advanced Photon Source: History, recent development, and current status. Metall. Mater. Trans. A 2013, 44, 68–76. [Google Scholar] [CrossRef]
- Ilavsky, J.; Zhang, F.; Andrews, R.N.; Kuzmenko, I.; Jemian, P.R.; Levine, L.E.; Allen, A.J. Development of combined microstructure and structure characterization facility for in situ and operando studies at the Advanced Photon Source. J. Appl. Cryst. 2018, 51, 867–882. [Google Scholar] [CrossRef]
- Hendon, C.H.; Rieth, A.J.; Korzynski, M.D.; Dinca, M. Grand challenges and future opportunities for metal-organic frameworks. ACS Cent. Sci. 2017, 3, 554–563. [Google Scholar] [CrossRef] [PubMed]
- Trickett, C.A.; Helal, A.; Al-Maythalony, B.A.; Yamani, Z.H.; Cordova, K.E.; Yaghi, O.M. The chemistry of metal-organic frameworks for CO2 capture, regeneration and conversion. Nat. Rev. Mater. 2017, 2, 17045. [Google Scholar] [CrossRef]
- Glinka, C.J.; Barker, J.G.; Hammouda, B.; Krueger, S.; Moyer, J.J.; Orts, W.J. The 30m SANS instruments at NIST. J. Appl. Cryst. 1998, 31, 430–445. [Google Scholar] [CrossRef]
- Kline, S.R. Reduction and analysis of SANS and USANS data using IGOR Pro. J. Appl. Cryst. 2006, 39, 895–900. [Google Scholar] [CrossRef]
- Black, D.R.; Windover, D.; Henins, A.; Filliben, J.; Cline, J.P. Certification of Standard Reference Material 660B. Powder Diffr. 2011, 26, 155–158. [Google Scholar] [CrossRef]
- Ilavsky, J.; Jemian, P.R. Irena: Tool suite for modeling and analysis of small-angle scattering. J. Appl. Cryst. 2009, 42, 347–353. [Google Scholar] [CrossRef]
- Ilavsky, J. Nika: Software for two-dimensional data reduction. J. Appl. Cryst. 2012, 45, 324–328. [Google Scholar] [CrossRef]
- Perdew, J.P.; Burke, K.; Ernzerhof, M. Generalized gradient approximation made simple. Phys. Rev. Lett. 1996, 77, 3865–3868. [Google Scholar] [CrossRef] [PubMed]
- Perdew, J.P.; Ruzsinszky, A.; Csonka, G.I.; Vydrov, O.A.; Scuseria, G.E.; Constantin, L.A.; Zhou, X.; Burke, K.; Tao, J.; Staroverov, V.N.; et al. Restoring the density-gradient expansion for exchange in solids and surfaces. Phys. Rev. Lett. 2008, 100, 136406. [Google Scholar] [CrossRef] [PubMed]
- Liechtenstein, A.I.; Anisimov, V.I.; Zaanen, J. Density-functional theory and strong interactions: Orbital ordering in Mott-Hubbard insulators. Phys. Rev. B 1995, 52, R5467–R5470. [Google Scholar] [CrossRef] [Green Version]
- Cockayne, E. Contribution of density functional theory to microporous materials for carbon capture. In Materials and Processes for CO2 Capture, Conversion, and Sequestration; Li, L., Wong-Ng, W., Huang, K., Cook, L.P., Eds.; John Wiley & Sons: Hoboken, NJ, USA, 2018; pp. 319–343. ISBN 9781119231035. [Google Scholar] [CrossRef]
- Ortiz, A.U.; Boutin, A.; Fuchs, A.H.; Coudert, F.-X. Anisotropic Elastic Properties of Flexible Metal-Organic Frameworks: How Soft are Soft Porous Crystals? Phys. Rev. Lett. 2012, 109, 195502. [Google Scholar] [CrossRef] [PubMed]
- Cockayne, E. Thermodynamics of the Flexible Metal–Organic Framework Material MIL-53(Cr) From First-Principles. J. Phys. Chem. C 2017, 121, 4312–4317. [Google Scholar] [CrossRef] [PubMed] [Green Version]
- Bucko, T.; Lebègue, S.; Hafner, J.; Ángyán, J.G. Improved density dependent correction for the description of London dispersion forces. J. Chem. Theory Comput. 2013, 9, 4293–4299. [Google Scholar] [CrossRef] [PubMed]
- Bucko, T.; Lebègue, S.; Ángyán, J.G.; Hafner, J. Extending the applicability of the Tkatchenko-Scheffler dispersion correction via iterative Hirshfeld partitioning. J. Chem. Phys. 2014, 141, 034114. [Google Scholar] [CrossRef] [PubMed]
- Bultinck, P.; Van Alsenoy, C.; Ayers, P.W.; Carbó Dorca, R. Critical analysis and extension of the Hirshfeld atoms in molecules. J. Chem. Phys. 2007, 126, 144111. [Google Scholar] [CrossRef] [PubMed] [Green Version]
- Kresse, G.; Furthmüller, J. Efficiency of ab-initio total energy calculations for metals and semiconductors using a plane-wave basis set. Comput. Mater. Sci. 1996, 6, 15–50. [Google Scholar] [CrossRef]
- Kresse, G.; Furthmüller, J. Efficient iterative schemes for ab initio total-energy calculations using a plane-wave basis set. Phys. Rev. B 1996, 54, 11169–11186. [Google Scholar] [CrossRef]
- D’Alessandro, D.M.; Smit, B.; Long, J.R. Carbon dioxide capture: Prospects for new materials. Angew. Chem. Int. Ed. 2010, 49, 6058–6082. [Google Scholar] [CrossRef] [PubMed]
- Span, R.; Wagner, W. A new equation of state for carbon dioxide covering the fluid region from the triple-point temperature to 1100K at pressures up to 800 MPa. J. Phys. Chem. Ref. Data 1996, 25, 1509–1596. [Google Scholar] [CrossRef]
- Siderius, D.W.; Gelb, L.D. Predicting Gas Adsorption in Complex Microporous and Mesoporous Materials Using a New Density Functional Theory of Finely Discretized Lattice Fluids. Langmuir 2009, 25, 1296–1299. [Google Scholar] [CrossRef] [PubMed]
- Ghysels, A.; Vanduyfhuys, L.; Vandichel, M.; Waroquier, M.; Van Speybroeck, V.; Smit, B. On the Thermodynamics of Framework Breathing: A Free Energy Model for Gas Adsorption in MIL-53. J. Phys. Chem. C 2013, 117, 11450–11554. [Google Scholar] [CrossRef]
- Freund, R.; Lachelt, U.; Gruber, T.; Ruhle, B.; Wuttke, S. Multifunctional Efficiency: Extending the Concept of Atom Economy to Functional Nanomaterials. ACS Nano 2018, 12, 2094–2105. [Google Scholar] [CrossRef] [PubMed]
- Liu, Y.; Ma, Y.; Yang, J.; Diercks, C.S.; Tamura, N.; Jin, F.; Yaghi, O.M. Molecular Weaving of Covalent Organic Frameworks for Adaptive Guest Inclusion. J. Am. Chem. Soc. 2018, 140, 16015–16019. [Google Scholar] [CrossRef] [PubMed]
- Modena, M.M.; Hirschle, P.; Wuttke, S.; Burg, T.P. Porous Nanoparticles: Mass Measurements Reveal Preferential Sorption of Mixed Solvent Components in Porous Nanoparticles. Small 2018, 14, 1800826. [Google Scholar] [CrossRef] [PubMed]
- McDonald, T.M.; Mason, J.A.; Kong, X.; Bloch, E.D.; Gygi, D.; Dani, A.; Crocellà, V.; Giordanino, F.; Odoh, S.O.; Drisdell, W.S.; et al. Cooperative Insertion of CO2 in Diamine-Appended Metal-Organic Frameworks. Nature 2015, 519, 303–308. [Google Scholar] [CrossRef] [PubMed]
Figure 1.
Examples of possible ordering patterns for Bpene pillars in NiBpene as projected onto the bc plane: (a) [b]-type: projected Bpene coordinates extend primarily along the b axis; (b) [bc]-type: an alternation of projected Bpene orientations along the b and c axes; (c) canted [c] type; (d) [c]-type; (e) schematic of NiBpene cell expansion upon CO2 sorption, projected onto the ca plane (CO2 not shown). Changes in Bpene orientation upon expansion are based on DFT calculations.

Figure 2.
Variations in Bpene linker d-spacing with either pressure (pure gas) or partial pressure (dual gas). (a) N2 and CO2/N2, (b) CH4 and CO2/CH4, and (c) H2 and CO2/H2, show ND-based results under static gas pressure conditions, superimposed on measured CO2 adsorption/desorption isotherms measured at 30 °C. These plots show changes in d-spacing for pure CO2 adsorption (CO2 ads d) and desorption (CO2 des d). Additional points and lines refer to either pure gases (indicated) or dual gas combinations with CO2 (adsorption only). (d) CO2 and CO2/N2, (e) CH4 and CO2/CH4, and (f) H2 and CO2/H2 show XRD-based results for changes in Bpene linker d-spacing under gas flow conditions at ≈30 °C. These plots show changes in d-spacing for both adsorption (ads) and desorption (des) for pure gases and also dual gas combinations. In (a) to (f), vertical bars are computed standard deviation uncertainties based on Gaussian (ND) or Lorentzian (XRD) peak fits to the linker d-spacing peak.

Figure 3.
Combined USAXS/SAXS data for NiBpene during (a) adsorption of CO2 to 80 bar in the supercritical fluid regime; (b) cooling from 90 °C to 30 °C under 76 bar to 80 bar ; and (c) final desorption to 2 bar at 60 °C. Uncertainties are represented by the (small) scatter within each dataset.
Figure 3.
Combined USAXS/SAXS data for NiBpene during (a) adsorption of CO2 to 80 bar in the supercritical fluid regime; (b) cooling from 90 °C to 30 °C under 76 bar to 80 bar ; and (c) final desorption to 2 bar at 60 °C. Uncertainties are represented by the (small) scatter within each dataset.

Figure 4.
Combined SAXS/WAXS XRD patterns for (a) NiBpene during CO2 adsorption to 80 bar in the supercritical fluid regime; (b) expanded plot of Bpene linker XRD peak at q ≈ 5 nm−1; and (c) expanded plot of XRD peak at q ≈ 13 nm−1. Uncertainties represented by (small) scatter within each dataset.
Figure 4.
Combined SAXS/WAXS XRD patterns for (a) NiBpene during CO2 adsorption to 80 bar in the supercritical fluid regime; (b) expanded plot of Bpene linker XRD peak at q ≈ 5 nm−1; and (c) expanded plot of XRD peak at q ≈ 13 nm−1. Uncertainties represented by (small) scatter within each dataset.

Figure 5.
Changes in Bpene linker d-spacing with CO2 pressure for (a) adsorption and desorption at 60 °C and 90 °C under subcritical conditions and (b) adsorption only for pressures extending to 80 bar in the supercritical CO2 regime at 90 °C. Peak fit uncertainties are smaller than the data points.

Figure 6.
Variation of NiBpene unit cell parameters with CO2 pressure and temperature: (a) unit cell volume, V, versus CO2 pressure, ; (b) unit cell volume, V, versus temperature, T; and (c) unit cell β angle versus . Vertical bars indicate standard deviation uncertainties for each data point.
Figure 6.
Variation of NiBpene unit cell parameters with CO2 pressure and temperature: (a) unit cell volume, V, versus CO2 pressure, ; (b) unit cell volume, V, versus temperature, T; and (c) unit cell β angle versus . Vertical bars indicate standard deviation uncertainties for each data point.

Figure 7.
(a) Predicted DFT energy versus volume for empty NiBpene for various Bpene orientational patterns; (b) predicted DFT relative energy per Bpene for different types of Bpene orientational patterns and different CO2 loadings. The effective chemical potential is set so that the minimum energy is zero for 0 and 5 CO2 per Bpene.

Figure 8.
DFT predicted cell volume versus CO2 loading.

Figure 9.
X-ray powder diffraction patterns of minimum energy DFT structures in NiBpene versus carbon loading.
Figure 9.
X-ray powder diffraction patterns of minimum energy DFT structures in NiBpene versus carbon loading.

Figure 10.
Predicted geometry of CO2 at loading of five CO2 per Bpene, projected along (a) the ab plane and (b) the ca plane. CO2 molecules are magnified for clarity. Element key: gold = Ni, white = H, blue = N, green = C, red = O. Also see Figure 1.
Figure 10.
Predicted geometry of CO2 at loading of five CO2 per Bpene, projected along (a) the ab plane and (b) the ca plane. CO2 molecules are magnified for clarity. Element key: gold = Ni, white = H, blue = N, green = C, red = O. Also see Figure 1.


Table 1.
Estimated unit cell parameters of 9 XRD datasets (sets 1–8 from USAXS/SAXS/WAXS measurements and set 9 from powder XRD data taken at room temperature and ambient pressure.).
Table 1.
Estimated unit cell parameters of 9 XRD datasets (sets 1–8 from USAXS/SAXS/WAXS measurements and set 9 from powder XRD data taken at room temperature and ambient pressure.).
| Dataset | T (°C) | (bar) | a (nm) | b (nm) | c (nm) | β (°) | V (nm3) |
|---|---|---|---|---|---|---|---|
| 1 | 90 | 80 | 1.373(2) 1 | 1.447(4) | 1.3513(9) | 107.06(9) | 2.556(8) |
| 2 | 90 | 73 | 1.3647(9) | 1.4353(7) | 1.3522(15) | 107.45(10) | 2.527(4) |
| 3 | 90 | 70 | 1.3683(15) | 1.4301(6) | 1.3469(9) | 108.43(7) | 2.500(3) |
| 4 | 90 | 2 | 1.3597(6) | 1.442(2) | 1.356(3) | 114.22(6) | 2.425(6) |
| 5 | 60 | 10 | 1.357(4) | 1.4087(12) | 1.332(3) | 114.6(2) | 2.314(9) |
| 6 | 60 | 2 | 1.360(3) | 1.4080(9) | 1.327(2) | 115.92(15) | 2.285(6) |
| 7 | 30 | 80 | 1.3616(9) | 1.452(4) | 1.344(2) | 107.92(9) | 2.527(8) |
| 8 | 30 | 65 | 1.357(3) | 1.437(2) | 1.338(3) | 108.7(3) | 2.471(8) |
| 9 | 25 | 0 | 1.3529(1) | 1.3966(2) | 1.321(2) | 116.66(6) | 2.231(4) |
1 Standard deviation uncertainties in least significant digits given in parentheses.
© 2019 by the authors. Licensee MDPI, Basel, Switzerland. This article is an open access article distributed under the terms and conditions of the Creative Commons Attribution (CC BY) license (http://creativecommons.org/licenses/by/4.0/).
Share and Cite
MDPI and ACS Style
Allen, A.J.; Wong-Ng, W.; Cockayne, E.; Culp, J.T.; Matranga, C. Structural Basis of CO2 Adsorption in a Flexible Metal-Organic Framework Material. Nanomaterials 2019, 9, 354. https://doi.org/10.3390/nano9030354
AMA Style
Allen AJ, Wong-Ng W, Cockayne E, Culp JT, Matranga C. Structural Basis of CO2 Adsorption in a Flexible Metal-Organic Framework Material. Nanomaterials. 2019; 9(3):354. https://doi.org/10.3390/nano9030354
Chicago/Turabian StyleAllen, Andrew J., Winnie Wong-Ng, Eric Cockayne, Jeffrey T. Culp, and Christopher Matranga. 2019. "Structural Basis of CO2 Adsorption in a Flexible Metal-Organic Framework Material" Nanomaterials 9, no. 3: 354. https://doi.org/10.3390/nano9030354
Note that from the first issue of 2016, this journal uses article numbers instead of page numbers. See further details here.